4.1. Methodology: Porosity, Crossing and Attractiveness Indexes and a Composite Index
It is important to underline that the methodology adopted was tested on a limited set of data—as the main locations in the study area are considered privileged candidates for redevelopment and revitalization operations, with the intention, in future research developments, to extend the analysis over the entire urban and metropolitan territory.
The research in particular was based on the development of a set of indexes, considered useful and interesting to evaluate the capacity of a sample of abandoned buildings acting as potential public spaces. In doing so, we proposed a set of indexes based on such a capacity, linking together the concept of centrality and therefore considering the quantity and quality of a set of central services and activities in close proximity to this selected subset.
Distances from places have been considered from the studies on centrality. In this case, the 15-minute walk, corresponding to about 1200 m, considered by several sources to be those necessary to consider an area as having essential services, were used to define “service” areas around the places.
These service areas were drawn running a “service area” algorithm from the centroids of the selected locations and were expressed in terms of walking distances from the points. Such areas, shaped as irregular polygons drawn from the urban road network on the territory, subsequently serve to collect and count, within them, the data relating to some activities that can be defined as central. Centrality is expressed in the most recent sense of the term. It is worth noting that at the present stage of the research, no distance-decay function was implemented when collecting and counting activities and services from the selected points of origin. This consideration of the central activities located within a defined distance from the selected places led to reasoning in two different directions. On the one hand, there is the need to focus on evaluating the centrality and diversity (or variety) of activities present. It is, in fact, not sufficient to focus on the plain number of “central” activities located within a certain distance from the point, but it is also important to focus on the variety and diversity. It is different, from the user perspective, to find an area of the city characterized by a huge number of bank and insurance company branches, that could be defined as a “financial district”, rather than an area characterized by a vibrant mix of differentiated activities [
65]. On the other hand, there is the more articulated need to understand the current role of urban voids in order to bring real interruptions, cracks in the urban territory, and to evaluate, instead, their potential role as central places in the event of their opening. These aspects constitute one of the main challenges to the city of Cagliari and to contemporary cities in general. For this reason, the authors have proposed specific indicators to support walkability in contexts characterized by urban enclaves. In particular, the proposal of indexes definable as porosity, crossing and attractiveness, and a composite index, are functional for the reduction of the urban enclave effect previously described. It should be noted that the quantitative definition of the indexes refers to the case of the historic center of Cagliari and is the result of the assessment of the context of the Strategic Plan of the Metropolitan City of Cagliari (2020). Particularly important, in the computation of the different indexes, will be the setup of weights.
Please note that both the single indexes as defined in the following lines (PI, CI and AI) will hold appropriate weights, and also the composite index WBBI will be realized further weighting on the previous indexes.
In this regard, the following indexes (Ii) were defined for each public property:
- (1)
Porosity index (PI): the weighted coverage ratio, between the building area and the pertinent free land area. The PI was calculated as in the formula:
where
Rc = the ratio, in percentage, between covered area referred to the building, built or buildable, and the land area of reference, and
pp is a weight to be attributed to the ratio
Rc, so that:
In particular, if Rc then the weight pp 1 (linear decreasing function) according to an inverse relationship and is closely related to the conditions of the reference context.
In other words, as Rc decreases, the weight pp increases in order to appreciate the empty surfaces included in the building areas functional to walkability (see case study, Paragraph 4.2).
- (2)
Crossing index (CI): The crossing index specifies the level of crossability that characterizes each public property and that allows people to reach different parts of the city. This index, in fact, depends on the architectural morphology of the building, in particular on the number of crossings and paths that connect the various entrances to the property. The CI was calculated as in the formula:
where
Nc = number of crossings that unfold between two accesses and that allows us to relate more urban portions and
pc is a weight to be attributed to the
Nc, so that:
In particular, if Nc then the weight pc 1 (linear increasing function) according to a direct relationship, and is closely related to the conditions of the reference context.
In other words, as Nc increases, the pc weight increases in order to appreciate the crossings included in the functional areas for walkability (see case study, Paragraph 4.2).
- (3)
Attractiveness index (AI) refers to both the number and the variety of central places found within a 15-minute travel range from the analyzed property compendium. Therefore, for the calculation of this index, the Simpson diversity index was taken as a reference, which allows us to give weight to the diversity of urban boundary functions. The Simpson diversity index, used in statistics in the case of populations with a finite number (in the case of index D) of elements:
where
Nj indicates the number of j-th “species”
where
corresponds to the Simpson concentration index in the case of finite population.
The Simpson index finds a wide application in ecology to represent environmental ecological diversity and by analogy it has been transposed to the urban context [
67,
68], or to the diversity of central places. Specifically, it refers to the diversity of central locations. These indexes constitute the first set proposed by the authors of a big data set under development, representative in quantitative terms of the intrinsic and extrinsic walkability of large-scale disused public assets.
- (4)
Walkable Big Buildings Index (WBBI). The indexes PI, CI and AI were integrated by the authors into a composite index Walkable Big Buildings Index (WBBI) experienced in the historic center of the city of Cagliari. In particular, the WBBI is the sum of the weighted (
pk) indexes (PI, CI, AI), where the sum of weights is 1. To distinguish this index from the others, a one hundred basis was used. The WBBI was calculated as in the formula:
In other words, each index Ii is weighted in relation to the intrinsic and extrinsic characteristics of the abandoned buildings and the relative conditions of the reference urban context in order to appreciate the potential (big disused buildings) functional walkability (see case study, Paragraph 4.2). In this sense, the plans of the historic centers constitute the main reference basis for the evaluation of the context to support the definition of the weights (pk).
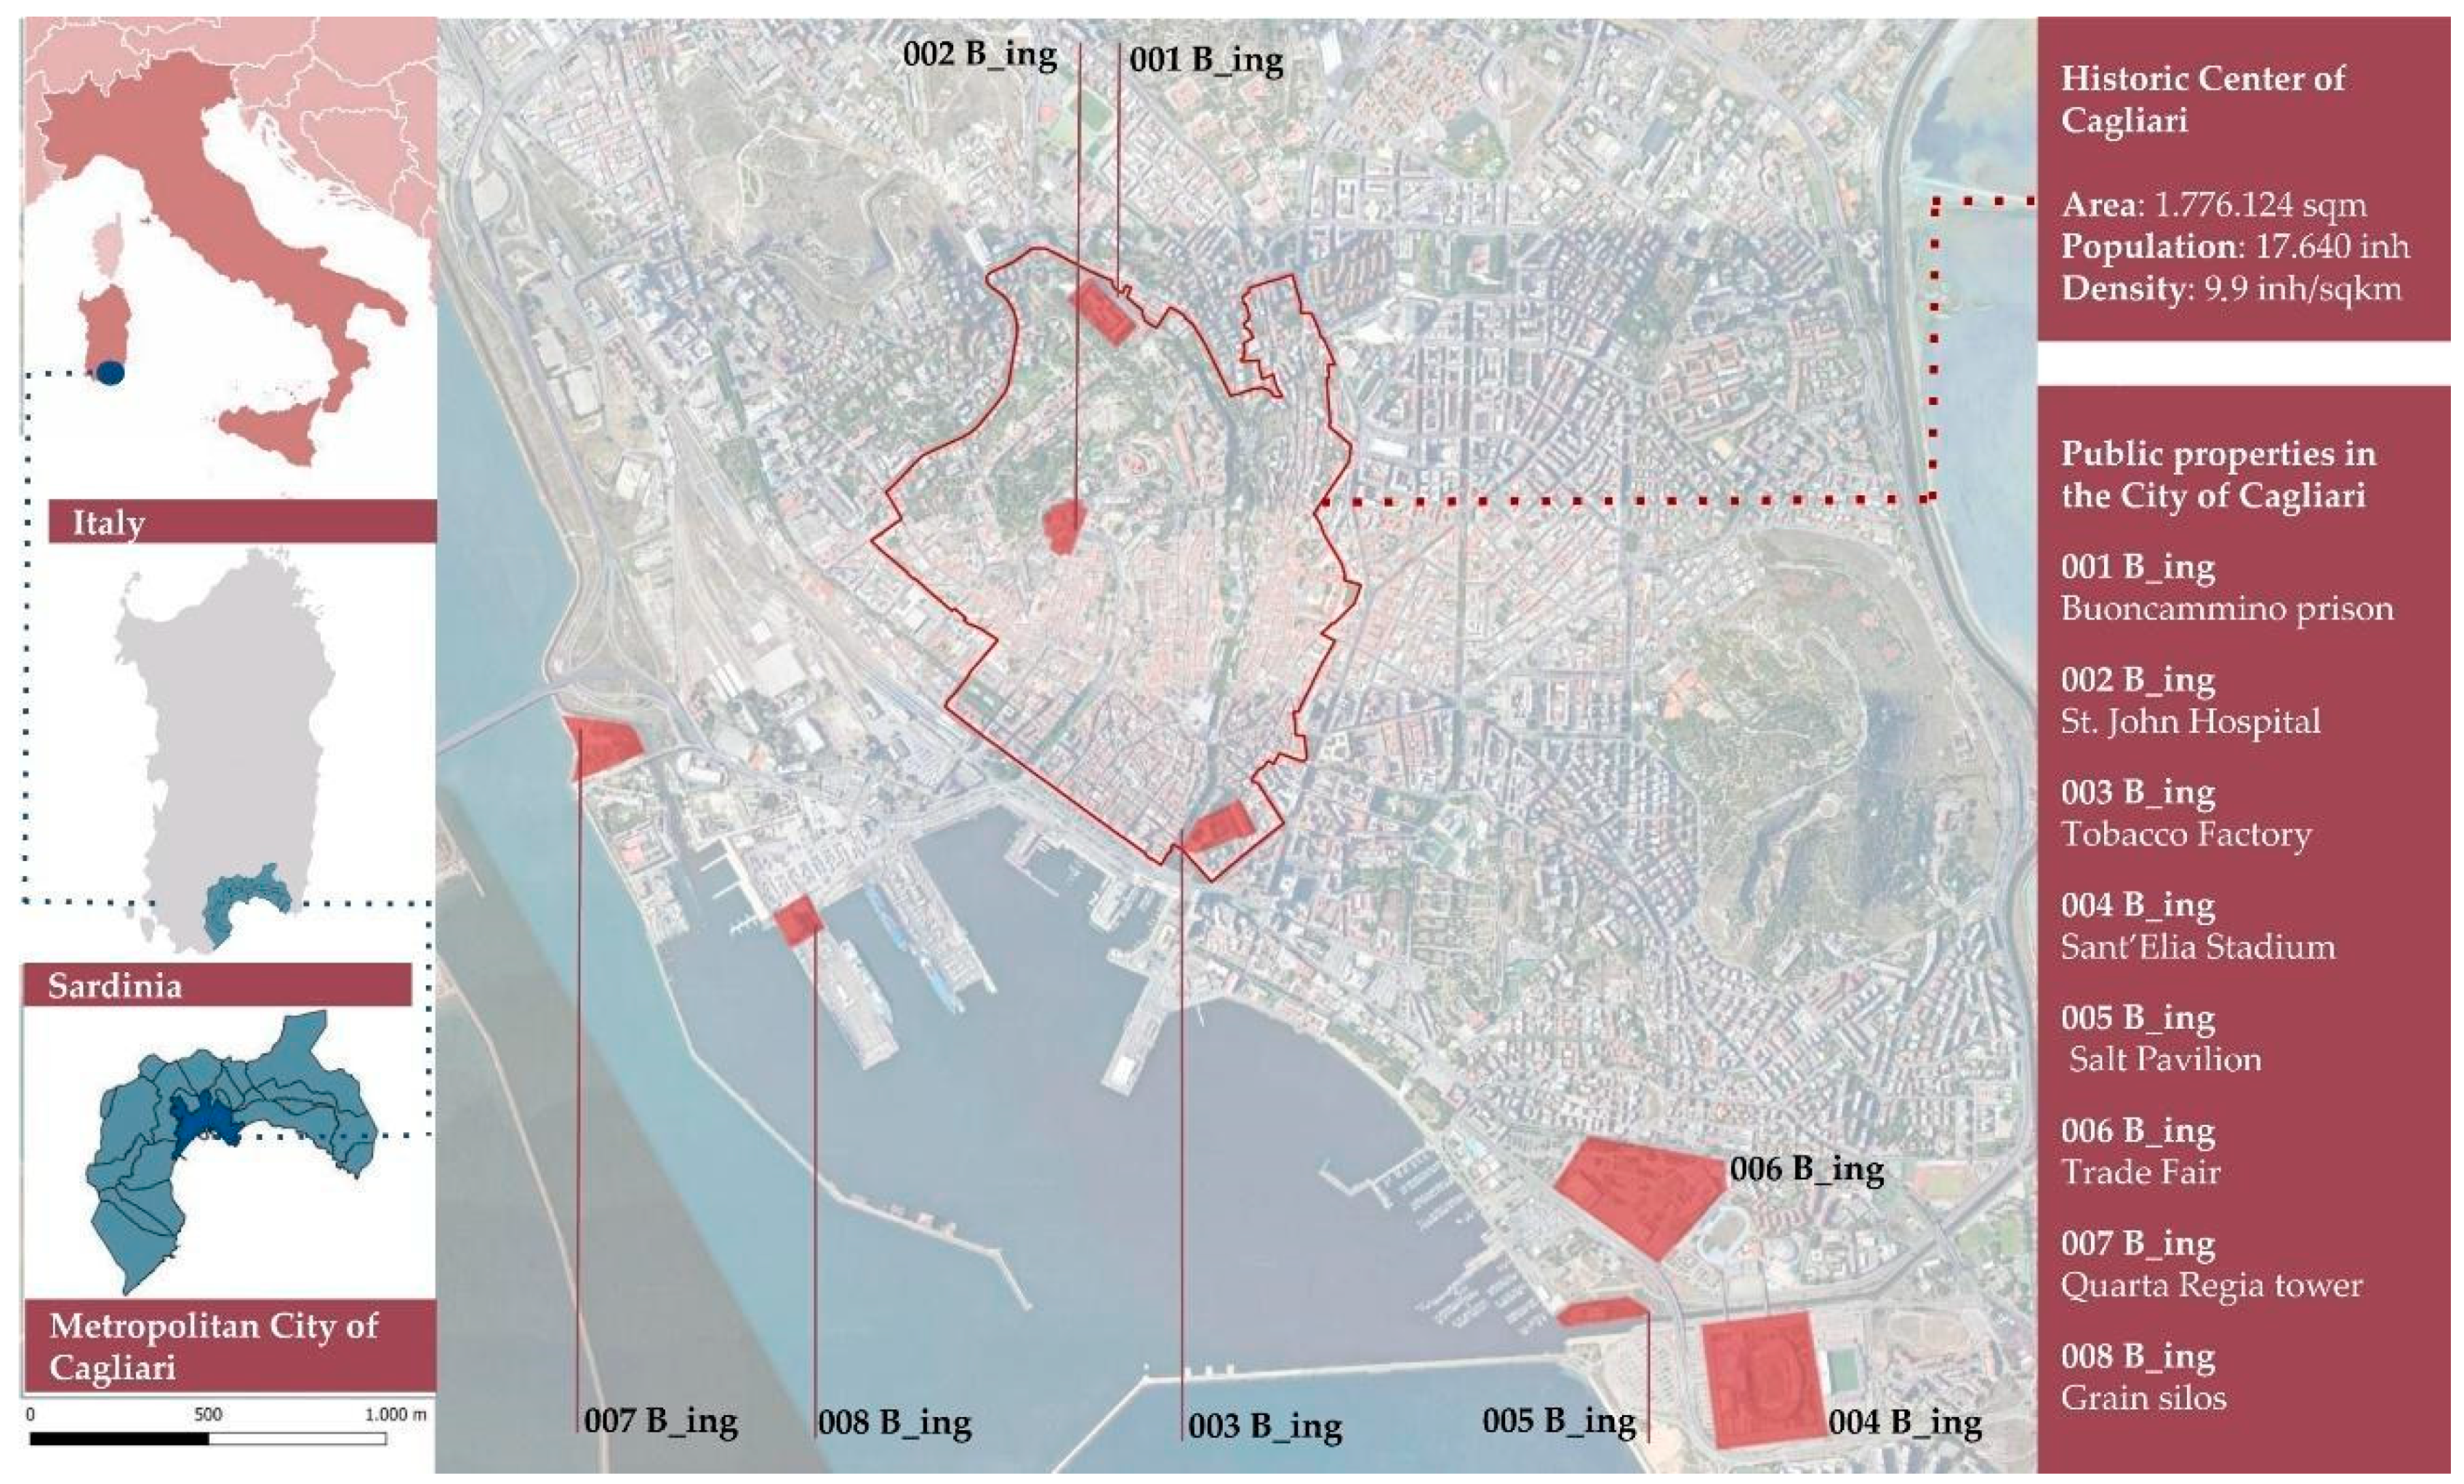
4.2. Data and Study Area
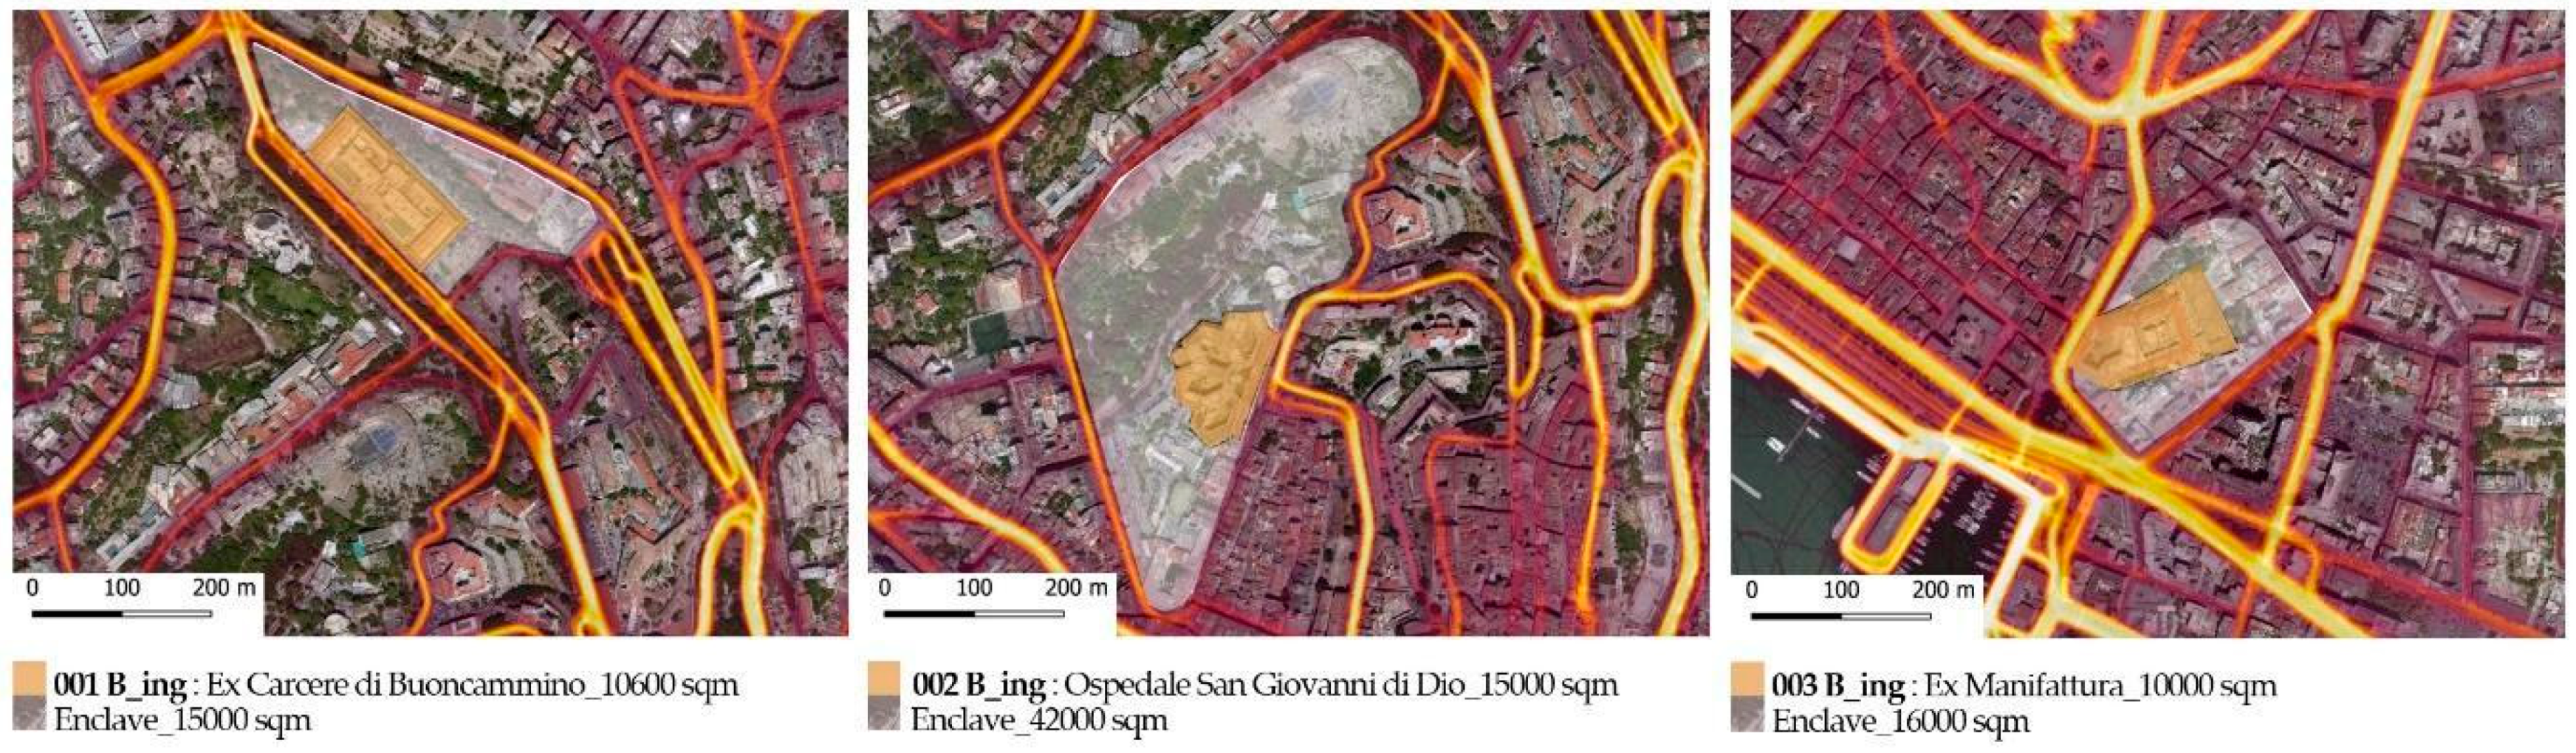
On the basis of a first survey of the public real estate assets present in the city of Cagliari, with particular reference to its historic center, the authors have undertaken an activity of collecting and processing data relating to the main public buildings that have been abandoned. Among these, the disused public complexes 001 B_ing, 002 B_ing and 003 B_ing were selected, among the most representative in terms of areas—valium and architectural stylistic dimensions. On the other hand, although located within the historic city center, characterized by an articulated system of central places, they limit the reach of the city in 15 minutes due to the persistent “enclave effect”. It refers to a larger area of the disused building, as a result of the previous and/or subsequent urban infrastructures favored by the past effect of central location of the to-date abandoned buildings (
Figure 4).
This is a critical issue, also confirmed by the smart community that animates Strava’s digital platform. This platform shows the densest areas, i.e., those most crossed by the community of users of the popular app for sports activities—for example running, cycling, etc.—to testify a “practicability” of walking in a broad sense. The
Figure 4 shows the enclave effect and consequently how a greater and better accessibility of these spaces would facilitate the walkability, and therefore the desired goal, of the 15-minute city, as confirmed in the occasion of the health crisis.
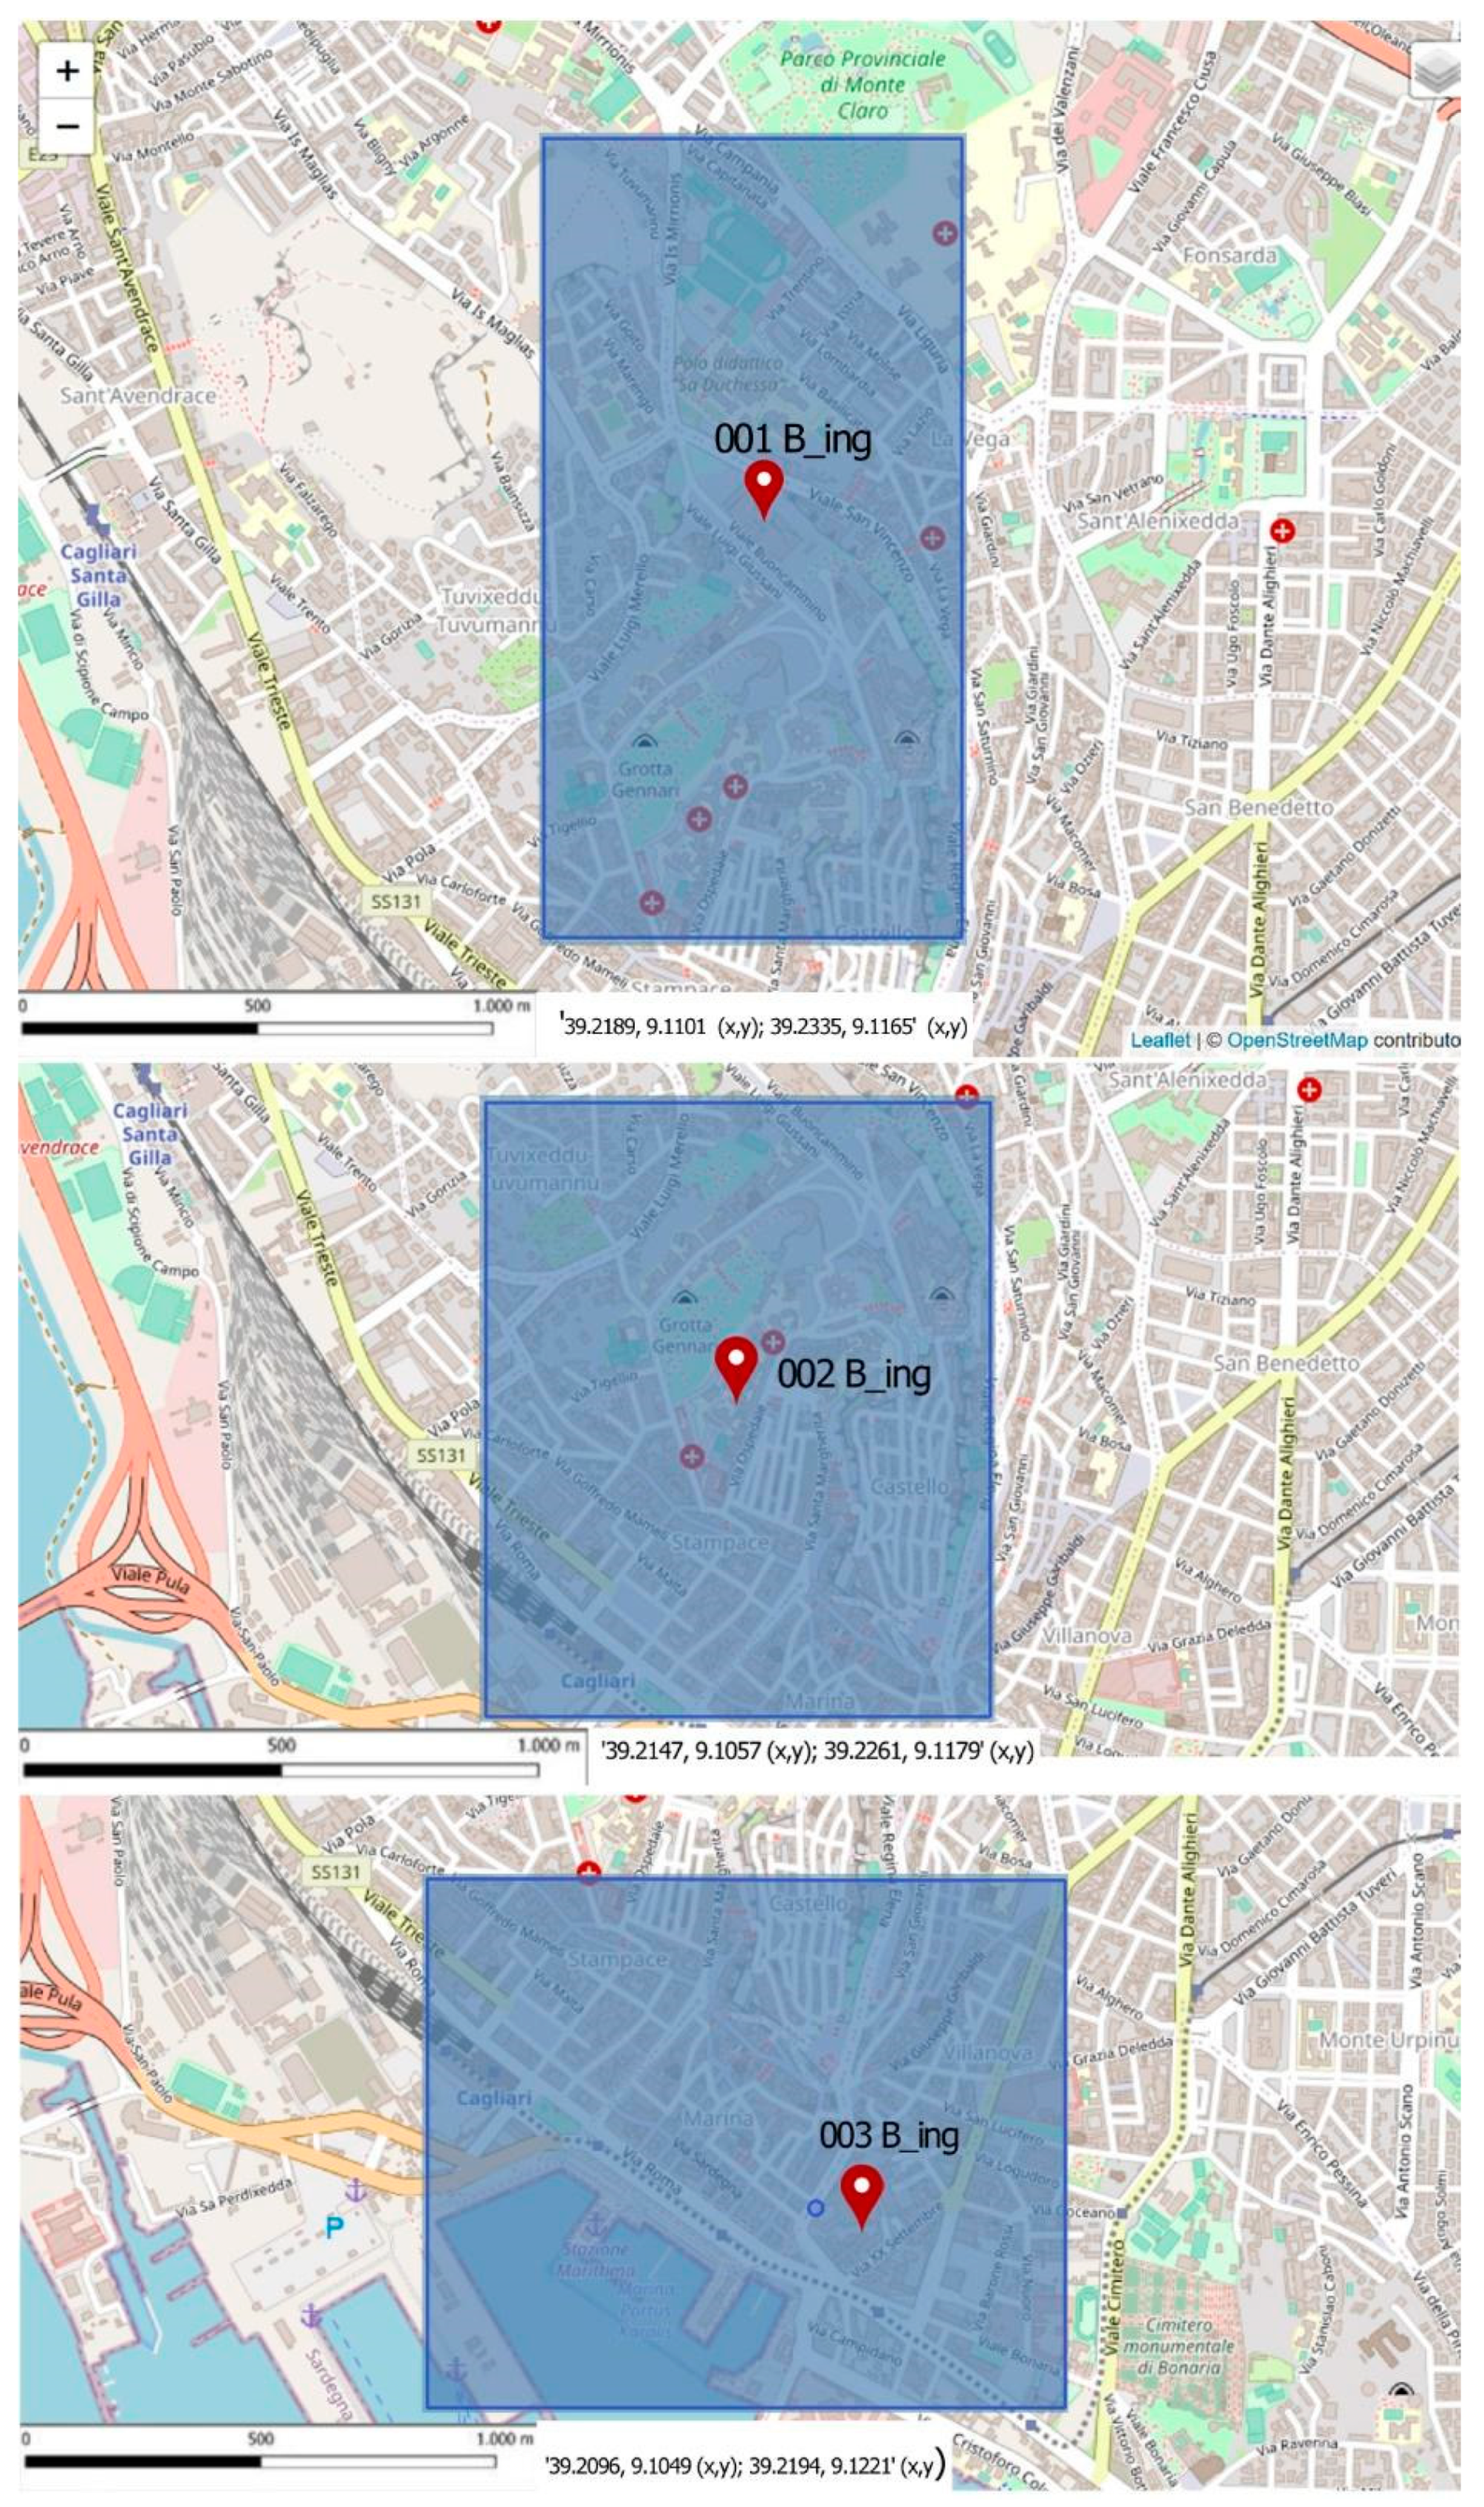
The authors then proceeded to identify the central locations within the historic center of Cagliari with reference to the three previously selected real estate compendia, included in the relative 15-minute isochrones. For this evaluation, the OSMR1 algorithms referred to Google maps were used (
Figure 5). In particular, the isochrones have been used to define areas where activities are located. Activities were searched through the homonymous search engine embedded into Google Maps. The principle used is that of the Minimum Bounding Rectangle (MBR), as the extent of the polygon derived by the most extreme coordinate values of isochrones computed over each location.
Figure 5 shows the extreme coordinates of the three MBR computed over the relative 15-min isochrones for each building. Within each area, the following central locations have been identified, divided into the three categories previously defined (
Table 1).
The authors then proceeded to evaluate the PI, CI and AI and WBBI indexes:
The assessment of PI and CI required the determination of the following weights resulting from the evaluation of the reference urban context of the historic center of Cagliari. For the three abandoned buildings obtained the following PI after identifying the specific weights:
| pp = 1 |
| pp = 0.5 |
| pp = 0.25 |
| pp = 0 |
The following PI is therefore derived (
Table 2).
For the three abandoned buildings, the following CI were after obtained with specific weights:
| Pc = 0 |
| Pc = 0.15 |
| Pc = 0.35 |
| Pc = 0.50 |
The following CI is therefore derived (
Table 3).
In particular, for the AI index, the Simpson index was applied, in agreement with Borruso (2006) [
66], transposing by analogy a typical index used to represent ecological diversity to the diversity of central locations, as reported in
Table 4.
Finally, the evaluation of the WBBI required the determination of the weights for each index that composes it. In particular we considered
pk = 0.3 for PI,
pk = 0.4 for CI and
pk = 0.3 for AI (
Table 5), justified by the necessary role of “crossing” to reduce the enclave effect of large abandoned building dimensions.
Below is a summary table of the calculation of the three indexes, starting from the input data referring to the abandoned real estate complexes selected in the historic urban area,
Figure 6.
The results of the proposed method were presented and discussed in
Section 5 and
Section 6.


