Article

Optimal Design Model for a Residential PV Storage System an Application to the Spanish Case

by
Juan Antonio Ballesteros-Gallardo
,
Angel Arcos-Vargas
* and
Fernando Núñez
Industrial Engineering and Management Science, University of Seville, 41092 Seville, Spain
*
Author to whom correspondence should be addressed.
Sustainability 2021, 13(2), 575; https://doi.org/10.3390/su13020575
Submission received: 14 November 2020 / Revised: 26 December 2020 / Accepted: 28 December 2020 / Published: 9 January 2021

Abstract

:
Self-consumption of photovoltaic energy is being promoted as an effective way for energy consumption in residential households. The European Directive 944/2019 promotes the use of green energy and battery energy storage systems (BESS) for self-consumption and, in Spain, the 244/2019 Royal Decree of the Spanish electrical regulatory framework allows the self-consumption of energy with a photovoltaic (PV) facility for residential use, as well as the injection of the surplus energy into the grid for which compensation will be received. At the same time, new developments in PV and BESS technologies reduce the costs of facilities, a fact that can increase the profitability of self-consumption through PV energy. This study evaluates the profitability of a household PV facility with BESS using a model based on real market prices, hourly data from user smart meters, and their own location; especially, the model gives the best configuration of PV panels power and BESS capacity. The financial indicators taken as reference for the results and conclusions are the Net Present Value (NPV), Internal Rate of Return (IRR), and Investment Return (IR). Our method examines also the effect of the BESS and PV panel costs on the profitability of the facility. Unlike other studies, our model is based on actual (not simulated) demand and price data, and it can be easily extended to other locations and market prices.

1. Introduction

Many countries in the European Union (EU) have implemented different policies in order to improve and develop solar energy systems (instead of fossil ones) after the European Directive 944/2019 [1]. The objective of this legislative framework is to achieve a cleaner energy generation and decrease the impact of emissions on the environment. In Spain, the 244/2019 Royal Decree [2] established the technical and administrative requirements for the self-generation and consumption of energy. In particular, this decree allows households to inject the surplus energy into the electricity market, being the company with which a user has contracted electricity supply from, to offset the income earned by the prosumer on the electricity bill. At the same time, all the administrative process has been simplified; thus, currently, a seller only has to present to the Spanish Public Administration a formal declaration (endorsed by an engineer) indicating that technical and administrative requirements for the sale of energy are met. The developments of these policies create therefore a suitable framework to support the investment in household PV facilities.
The purpose of this research is to provide an economic and operational model for a household PV facility, with or without a battery energy storage system (BESS), that aims to optimise the power of the PV panels and the capacity of the BESS. With the only input of the household demand and its own location, the proposed model provides the best configuration of them (panels and BESS) according to certain financial indicators; this outcome is especially useful for installers, prosumers and system regulators.
The regulatory changes during recent years, in many countries, have tended to encourage green energies, together with the continuous improvement in cost and efficiency of photovoltaic (PV) panels. According to Arcos [3], the current PV energy regulation promotes the flexibility of the electrical market through the self-consumption and storage of the energy produced by residential householders. Dusonchet and Telaretti [4] presented an economic analysis of a photovoltaic (PV) facility without BESS in western EU countries in the year 2009. They pointed out that most of the countries (14 out of 17) have introduced policies to support PV household facilities, but the saving in tariffs did not cover the expenses of the facility in five of them (Netherlands, Luxembourg, Finland, Ireland and Sweden). Campoccia et al. [5] concluded that the countries with net-metering and active self-consumption in 2013 (Italy and Greece) have the highest profitability indexes for PV facilities, which suggests that domestic PV generation needs Government support through favourable self-consumption regulatory schemes. In the case of Spain, Del Rio and Mir-Artigues [6] recommended in 2012 an optimisation of the feed-in tariffs for the domestic PV self-consumers, and the simplification of the administrative process as main changes to make residential PV facilities attractive. The same conclusion was reached in 2016 by Bayod-Rújula et al. [7], highlighting the negative effect of the solar tax established in the Royal Decree 900/2015 in the PV-BESS deployment, as the self-consumers pay also for the use and maintenance of the power net, although they use it the least.
The following papers take, in essence, a financial perspective—although the approaches adopted are very diverse—Del Coso et al. [8] and Chen [9] raised the question whether the PV facility costs will be covered by the savings in consumption from the supply network and the sale of surplus energy to the electrical market. Zhu et al. [10] presented in 2013 an optimisation analysis for hybrid BESS, not connected to PV panels, based on the total return on investment (ROI), with the conclusion that the BESS for residential use improves the ROI up to 60%. The levelized cost of energy (LCOE) was reviewed by Zhang et al. [11] in the year 2014 for the European electrical market. They observed that the LCOE for PV facilities decreases as a consequence of technological evolution and that the feed-in tariffs to support the PV deployment were reduced or even eliminated. The efficiency is increased in the overall energy process, with facility energy prices being similar to the price of electricity supplied by the network. For their part, Ghiassi et al. [12] studied in the year 2015 the optimal capital budget for solar farms (not residential facilities) with BESS, concluding that the PV panel cost is the 96–99% of the initial investment on solar panels and the rest on batteries. In our opinion, the proposal of Lorenzi and Santos [13] provided a novel approach. Thus, they compare two different strategies to optimise self-consumption in PV systems (in Portugal): storage and demand response. According to them, the most advantageous alternative will be the one that minimizes the daily expenditure for electricity (they do not adopt our annual cash flow perspective). Moreover, to deal with peak hours, its storage model imposes a different behaviour on weekdays and weekends that are not necessary for our model; thus, they assume that, during weekdays, the majority of the time is constituted by peak hours, so the surplus PV energy is forced to be injected in the battery.
The grid parity for PV panels has been widely analysed as well. Mondol and Hillenbrand [14] performed a review of grid parity in the year 2012, concluding that the Southern countries (Spain, Italy, Portugal and Greece) were the most suitable for reaching the grid parity as a consequence of the higher level of solar irradiation. In the case of Spain, they estimated that grid parity would be reached in Southern and Northern areas in 2014 and 2017, respectively, under the assumptions of an electricity price-increase rate of 3% and a cost-decrease rate of 4% for PV facilities. In 2018, Chiacchio et al. [15] determined the performance (in terms of plant and services availability) of a PV facility of 4.32 kWp located at Catania, connected to a 13.2 kWh BESS, and with a residential consumption of 4500 kWh. The facility provided enough energy during 98% of the time with a bill cost of 17 € and an income of 157 €. Although the household was nearly autonomous, with only 2% of grid consumption, the cost of the facility was not covered in before 20 years passed; moreover, the PV facility achieved a real environmental benefit that would need to be empowered by government policies. For their part, Chiacchio et al. [16] carried out an economic geographic comparison for a facility of 2.8 kWp PV panels with a 6.4 kWh BESS, covering a domestic consumption of 3700 kWh, and located either in the South or the North of Italy. The research used a historical series of environmental variables for the period 2008 to 2017. The result obtained reveals that the facility in the South area covered the whole demand of the household, whereas the facility located in the North area does not reach that; however, the connection to the network in the South was still necessary to avoid undesired service shortage. Shin et al. [17] proposed in the year 2019 a model for residential PV systems without BESS in South Korea. Unlike our study, their model is based on a genetic algorithm designed to minimize electricity bills and facility costs. Zhu et al. [18] designed an algorithm to optimise a residential facility with PV panels and BESS based on an initial budget. In this last research, the algorithm predicts the PV generation and energy consumption at the beginning of the day, while we use specific software for the PV generation and daily data from user smart meters for the domestic consumption. There are some studies that analyse the deployment of PV energy in Spain (from a financial perspective). Thus, Talavera et al. [19] studied the influence of the Spanish policies from 1998 to 2014 on the LCOE for residential PV panels, highlighting that the high number of policies published in the last decade (more than 12) created an unfavourable framework for investors.
Nowadays in Spain, with more mature technology and more suitable policies, it is considered that net-metering is an excellent way to improve the profitability and sustainability of PV panels. Colmenar et al. [20] studied the profitability of household PV panels with or without BESS in the year 2012 in Spain. They concluded that facilities without BESS were more profitable than the ones with BESS, but the use of BESS contributed to the stability of the grid by injecting surplus energy in the daily slots of higher demand. They estimated the generation profile from Photovoltaic Geographical Information System (PVGIS) and the demand as an hourly average along the months from government data in the period from 1981 to 1998; however, they were not focused on the best combination of PV panel peak power and BESS capacity, either in the advantage of the use of BESS. For its part, Bernal and Dufo [21] analysed the economic viability of a residential PV facility located in Saragossa (Spain) in the year 2016 but without focusing on the optimisation of the PV panel and BESS capacity for domestic use; they considered different scenarios for energy price, cost of development and annual energy production based on theoretical values of PV generation and energy demand. The project was generally profitable but there were some entry barriers for the investors, due to the long payback time (not less than 9 years), the high dependency of regulated and feed-in tariffs and the energy sell price (0.41 €/kWh); for example, they pointed out that a slight reduction of the feed-in tariffs could prevent the investment from being covered.
In 2017, Lopez and Steinenger [22] highlighted that the Spanish regulation hinders the PV facility for self-consumption as the return of investment is low (<2.2%). Moreover, the incentives created for grid connection were inefficient, considering that a dynamic net billing could help to promote the PV deployment. Note that these authors do not consider energy storage in their study nor do they try to identify an optimal configuration of the PV installation (with storage) for a typical consumer; moreover, they consider some charges on the prosumer bill that are not currently in force in Spain. More recently, in 2019, Rosales et al. [23] proposed a combination of feed-in tariff premiums in combination with a net-metering mechanism to compensate the consumption of the Spanish PV self-consumers with remuneration for the surplus energy produced. They also recommended the use of BESS to maximize the consumption of the PV energy and consequently extract an extra benefit from the facility. Finally, Sarasa et al. [24] applied Monte Carlo simulation (with data from the year 2019) to estimate the LCOE in Spain for three PV facilities of different sizes (5 kW, 50 kW and 500 kW of nominal power). In the case of a residential facility of 5 kW, the grid parity was achieved when the module cost was 0.4 €/kWp, with an internal rate of return of 10% for productions of 1200 kWh/kWp and above.
The aim of this paper is to provide a general model that, for a specific user profile and PV facility location, gives the optimal configuration of BESS capacity and PV panel peak power according to the financial indicators Net Present Value (NPV), Internal Rate of Return (IRR) and Return of Investment (IR). Given that the financial indicators depend on the BESS and PV panel costs, and that these costs are falling in recent years, an analysis is carried out to measure the effect of the decreasing trend of these two costs on those financial indicators. In our opinion, this paper presents at least two main contributions: the data sources and the flexibility of the model of energy generation, sales and self-consumption. We use data from the Spanish market: the production of photovoltaic energy has been obtained from PVGIS (a specialized software), while the domestic energy demand comes from the hourly data of the user smart meters. Notice that our demand data is not the result of a simulation process, as is usually the case in the literature in this field; for this reason, the results obtained from our analysis are more accurate than those based on-demand algorithms or simulations. As for the flexibility of the model, it is remarkable that unlike those studies based on mathematical simulation, which are the majority in this field (see, for example, Ghiassi et al. [12]), Zhu et al. [18], Colmenar et al. [21], Bernal and Dufo [22] and Sarasa et al. [23]), our empirical financial model can easily be extended to other locations or pricing schemes.
Finally, the self-consumption model presented in this paper could be interesting for regulators, households, entrepreneurs, and scholars. It is a business opportunity for the system regulator, since it improves the maintenance, developments and losses of the transmission networks, as a consequence of the self-consumption energy and the surplus energy injected into the market. For their part, households and entrepreneurs (prosumers) may know the economic revenues and profitability of the PV facilities, taking into account all the relevant (technical and economic) information, defining the right PV facility and storage capacity. Additionally, this initiative will produce a significant benefit to the environment, as it replaces energy obtained from fossil fuels (at least partially) by one without emissions.
The rest of this paper is organized as follows. Section 2 describes the model, the basic concepts of a PV facility with BESS, and the data description. Section 3 presents the results and financial assessment. Section 4 contains the discussion and, finally, Section 5 the conclusion.

2. Methods and Materials

2.1. A Model for Energy Self-Consumption Using PV Panels

The model used in this paper is designed for a home with a PV panel connected to the grid and which may or may not have an energy storage system—the two scenarios are analysed. Network defection is not considered, as the economic impact of a breakdown in the facility of the residential user would be much greater than the possible benefits from this alternative. In addition, being connected to the grid allows the obtaining of additional incomes by injecting the electricity produced into the grid at times when it surpasses the residential electricity demand [25]. Considering the existence of energy storage, Figure 1 depicts schematically the main parts of the household facility and the energy flows between the different parts. Each residential facility consists of three different components, which are managed by a control system: a battery system (BESS), the PV panels and an inverter module.
The first configuration analysed consists of a residential user connected to the grid and PV panels and without BESS—note that, in this scenario, the BESS component has to be removed from Figure 1. In this configuration, the savings come from the energy consumed from the PV panels (avoiding, therefore, the grid consumption) plus the income obtained from the surplus energy sold to the network. When the residential demand is higher than the production of PV panels, grid energy needs to be consumed to fully cover the domestic demand. The profitability of this facility mainly depends on the energy produced by the PV panels (either providing savings or incomes) and the cost of the facility, factors which will be driven by the size of the BESS and PV panels. This model is similar to the one proposed by Arcos et al. [26], although this last study does not consider the possibility of selling surplus energy to the market.
The second configuration is a little more sophisticated than the first one and, until recently, it was not allowed in some European countries, including Spain. The difference with the first scenario is the existence of a BESS which is connected to the PV facility. Then, the PV energy has three possible destinations, in this order: the domestic demand, the battery (if PV generation exceeds residential demand during off-peak hours, case II in Table 1), and the grid (if generation exceeds demand and the battery is either fully charged or partially charged and the hours are peak hours, case I in Table 1). The residential demand is satisfied firstly with the production of the PV panels, secondly with the BESS energy and finally, if necessary, with the grid (as in case III, Table 1). The BESS is a key element in the model because it allows the storage of surplus energy for further consumption (for example, in night hours). The BESS is charged with the excess of power produced by the PV panels during off-peak hours, and it is discharged when the PV production cannot meet the residential demand, a fact that happens mainly during the night.
The operating model offers two main benefits: the savings for the energy consumed from the PV panel and the BESS unit (therefore avoiding the grid energy consumption) and the incomes from the energy sold to the market according to net-metering regulations. Table 1 shows the operating model for the PV generation in the facility.
Given the operating model described in Table 1, the main economic question that this paper addresses is: “Given a user’s annual hourly demand, which is the PV and BESS size configuration that optimises the investment?”. For this purpose, three financial indicators are calculated for different configurations of BESS and PV panels: the net present value (NPV), the investment return (IR) and the internal rate of return (IRR). The operation of the PV system with storage is described in Equations (1)–(5).
Equation (1) models the hourly charge level (EBL) of the BESS at the beginning of each hour, as the battery charge level at the beginning of the previous hour ( E B L 1 ), plus a percentage of the PV energy delivered by the panels to the battery ( E C H ), minus the energy outflow from the BESS used for consumption ( E C B ). Parameter η represents the round trip efficiency of the BESS, according to which not all the energy received from the panel ( E C H ) can be stored in the battery and not all the energy outflow is consumed by the household. The energy stored can not exceed the limit capacity of the battery ( P B ).
E B L E B L 1 + η × E C H E C B / η E B L P B ;   η 1
Equations (2a) and (2b) model the hourly energy generation of the PV panels, as well as its destination. The PV energy generation ( E P V ) can be modelled as the expected PV energy generation every hour ( e G )—data from PVGIS (Photovoltaic Geographical Information System)—plus a random disturbance ( u G ) which follows a normal distribution N(0, σu2), and allows controlling for certain unexpected events such as unexpected cloudiness, an unexpected failure of the PV installation, measurement errors, etc. This PV energy can be used directly for self-consumption ( E C P V ) or to be sold to the market ( E S ) when it is a peak hour or the battery is full (Equation (2a)). When the BESS is partially charged and the hour is off-peak, part of the PV energy ( E P V ) is also used to charge the battery ( E C H )—Equation (2b).
E P V ( P P V + ) = e G + u G E C P V + E S E B L = P B   o r   E B L < P B   &   p e a k   h o u r
E P V ( P P V + ) = e G + u G E C P V + E C H + E S E B L < P B   &   o f f p e a k   h o u r
Equations (3a) and (3b) show that the hourly energy consumed from the facility ( E F ) is the sum of the energy supplied directly from the PV panels ( E C P V ) and the energy supplied by the BESS ( E C B ), when the production of PV energy ( E P V ) is lower than the energy demanded by the household ( E D )—Equation (3a). If the production of PV energy ( E P V ) is greater than the energy demanded ( E D ), the PV panels can support directly the demand (Equation (3b)).
E F ( P P V + ,   P B + ) = E C P V ( P P V + ) + E C B ( P B + ) E P V <   E D   &   E B L > 0
E F ( P P V + ,   P B + ) = E C P V ( P P V + ) E P V > E D
The hourly surplus energy produced by the PV panels ( E E X , Equation (4)) is defined as the difference between the PV energy generation ( E P V ) and the energy used directly by the household from the panels ( E C P V ). This surplus energy ( E E X ) is intended to be sold in the market ( E S ) or to charge the BESS ( E C H ).
E E X = E P V E C P V = E S + E C H E P V > E C P V   ( = E D )
Equations (5a) and (5b) describe the hourly energy consumed by the household ( E D ). The real energy demanded by the household ( E D ) is the sum of the expected demand ( e D ) and the random disturbance ( v d ~ N(0, σ2u) of zero mean. When the energy supplied directly by the PV panels ( E C P V ) and the energy supplied by the BESS ( E C B ) is equal to the energy demanded (Equation (5a)), it is not necessary to buy energy from the market; the household is powered only by the facility. In the case of energy supplied by the facility, ( E F ) is not able to fully cover the household demand (Equation (5b)), it is necessary to purchase energy in the market ( E P ).
E D ( P P V + ,   P P B + ) = e D + v D E F ( P P V + ,   P P B + ) E C P V + E C B E D
E D ( P P V ,   P B ) = e D + v D E F ( P P V + ,   P P B + ) + E P ( P P V , P P B   ) E C P V + E C B < E D
The financial model is formulated in Equations (6)–(12). Equation (6) computes the annual income received (IC) in the year t from the energy sale ( E S ) at market price (PE). Equation (7) defines the annual savings (S) coming from the energy consumed but not purchased in the market; that is, the energy consumed from the facility ( E F ), valued at market price (PE) plus the access tariff (AT).
I C t = E S ( P P V + ) × P E
S t = E F ( P P V + ,   P P B + ) × ( P E + A T )
Finally, the cash flow in the year t ( C F t ) is defined in Equation (8) as the incomes from sales ( I C t ) plus the savings from self-consumption ( S t ) minus the acquisition cost of new devices in the year t ( I t ), if any.
C F t = I C t + S t I t
Observe that sales ( E S ) and self-consumption from the facility ( E F ) are increased by more powerful PV panels ( P P V ) and higher BESS capacity ( P B ), also the falling network consumption ( E P ). The greater these two determinants ( P P V and P B ), the greater the savings, the incomes and, consequently, the cash flows from the facility.
The model for the facility without BESS can be easily adapted from this one by removing its influence; that is, the capacity of the BESS ( P B ), its charge level ( E B L ), the energy used to charge it ( E C H ), and the consumption from it ( E C B ) become null. Additionally, we drop Equation (1) and unify Equations (2a) and (2b) by removing E C H and their respective conditions.
Once we generate the cash flows for each possible configuration (facility with or without BESS), the project NPV and the IR indicator are mathematically defined by the following equations:
N P V = I 0 + C F 1 ( 1 + k ) + C F 2 ( 1 + k ) 2 + +   C F n ( 1 + k ) n = I 0 + t = 1 n C F t ( 1 + k ) t
I R = N P V I 0
where n is the number of years of the project, C F t is the cash-flow of the year t, k is the discount rate, and I0 represents the cost of the facility at the beginning of the project (initial investment), i.e., the panels and BESS acquisition costs.
For its part, the IRR index is given by the discount rate k at which the NPV equals 0, having the following equation:
I 0 +   t = 1 n C F t ( 1 + I R R ) t = 0
Finally, the investment required is defined as follows:
I t = C P V + C B = P P V × C u P V + P B × C u B
where C P V and C B are the cost of the panels and BESS respectively. They are obtained by multiplying the power of the PV panel ( P P V ) and the capacity of the BESS ( P B ) by their respective unitary costs ( C u P V and C u B )—the BESS cost would be zero for the facility without storage.
With the analysis above, we define the optimisation problem as follows:
Mathematical Model
Given:
(1)
An hourly PV energy generation EPV.
(2)
The hourly demand profile, ED.
(3)
The energy price (PE) and access tariff (AT).
(4)
The round trip efficiency of the BESS (η).
(5)
The daily peak hours and off-peak hours.
Find: PV panel peak power ( P P V ) and battery capacity ( P B ) for different scenarios of investment costs ( I t ) and annual residential demand (D).
Maximize: The financial indicators (optimised separately):
N P V = I 0 + t = 1 n C F t ( 1 + k ) t
I R = N P V I 0
N P V ( k = I R R ) = 0 I 0 +   t = 1 n C F t ( 1 + I R R ) t = 0
where:
C F t =   I C t +   S t I t
I C t = E S × P E
S t =   E F × ( P E + A T )
I t =   C P V +   C B = P P V × C u P V + P B × C u B
Subject to:
  • BESS level constraint:
    E B L = E B L 1 + η × E C H E C B / η E B L P B   ;   η   1
  • PV outflow constraints:
    E P V = e G + u G E C P V + E S E B L = P B   o r   E B L < P B   &   p e a k   h o u r
    E P V = e G + u G E C P V + E C H + E S E B L < P B   &   o f f p e a k   h o u r
  • Self-consumption constraints:
    E F = E C P V + E C B E P V <   E D   &   E B L > 0
    E F = E C P V E P V > E D
  • Surplus energy constraint:
    E E X = E P V E C P V = E S + E C H E P V > E C P V   ( = E D )
  • Hourly demand constraints:
    E D = E F E C P V + E C B E D
    E D = E F + E P E C P V + E C B < E D
Observe that the model and methodology presented in this paper can be easily implemented in other market frameworks since costs, incomes and savings of the project are based on real market variables (on an hourly basis).

2.2. Model Input Information

This section describes the data used in the model. We analyse four different data sources: demand profiles, energy price and tariffs, facility technology, and location and energy production.

2.2.1. Demand Profile

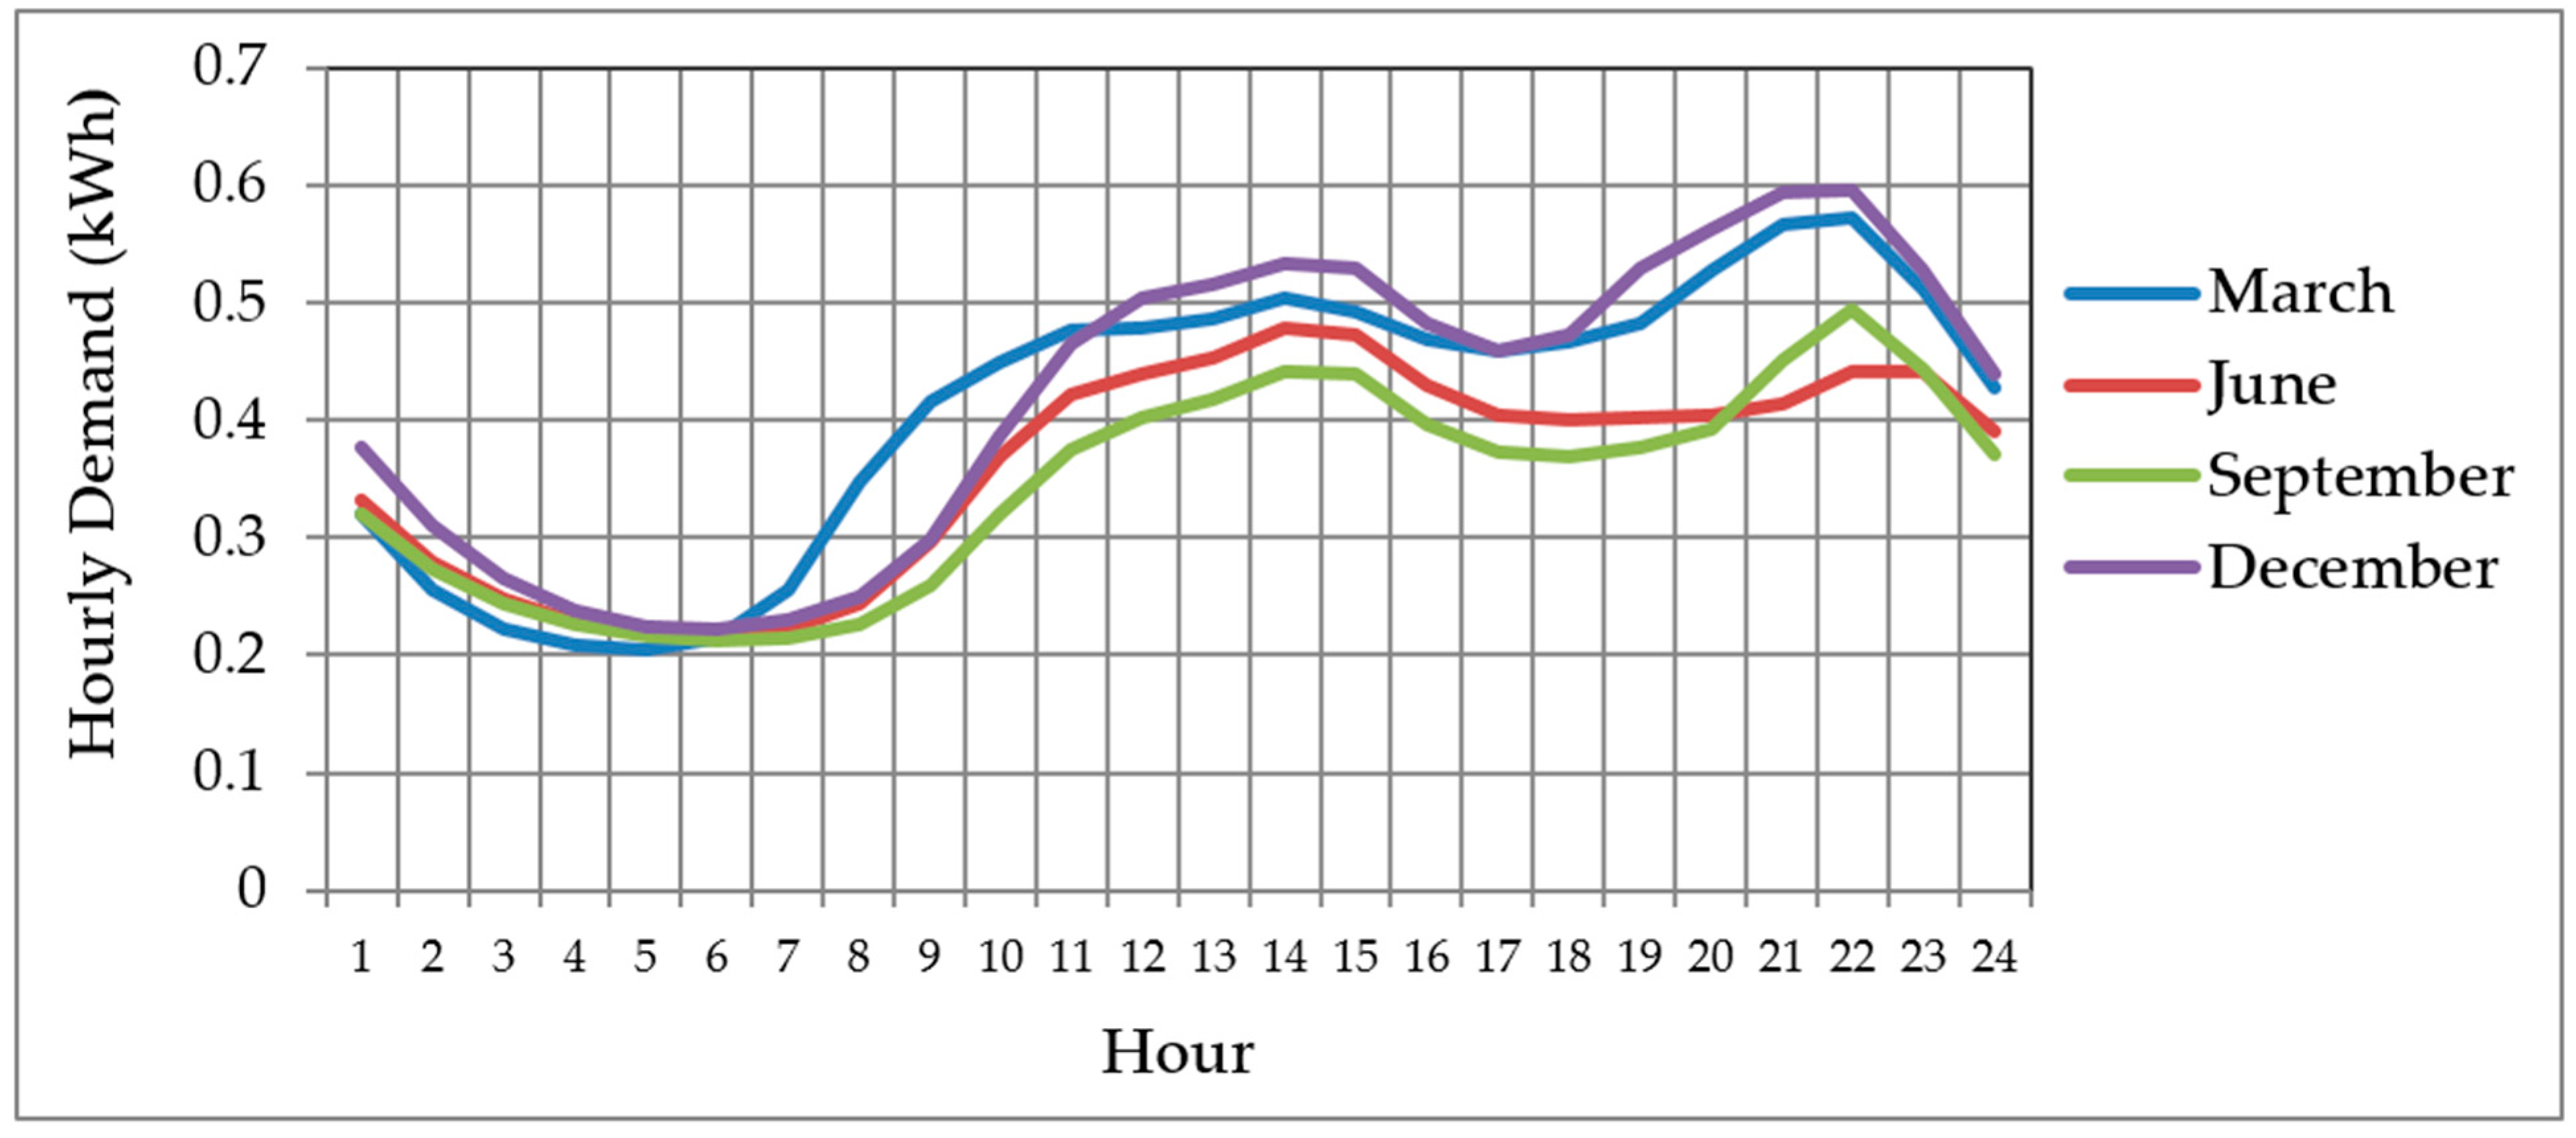
The hourly consumption of the domestic household ( E D ) is one of the main variables considered in the analysis as it is the key element for PV power and BESS capacity optimisation. The standard consumption of a residential household during a day depends on the month of the year considered, which in turn is influenced by external variables such as weather conditions or holiday seasons. As a representative example, Figure 2 shows the hourly household consumption from the grid ( E P ) obtained from the OMIE (Iberian Electricity Market Operator) on the 15th day of four different months: March, June, September and December. This variable is obtained from the smart meters installed in domestic households [27,28].
Consumption from the grid ( E P ) falls during the night hours from 0.4 kWh to 0.2 kWh, with similar patterns for each month. This is because few devices are connected to the network during the night, apart from the ones which need to be always connected (such as refrigerators). After that, demand increases from 7:00 a.m. reaching a local maximum at 14:00, ranging the consumption in this last hour from 0.45 (September) to 0.55 kWh (December). This growth is observed because people connect devices to the network (for instance, air conditioning, electric oven, hob, etc.). From 14:00, the curves show different patterns, as the work and weather conditions are different from one month to another. After a slight decrease between 14:00 and 18:00, consumption increases again until 22:00 reaching, at that hour, the peak of daily consumption, being in the range of 0.45 (September) and 0.6 kWh (December).
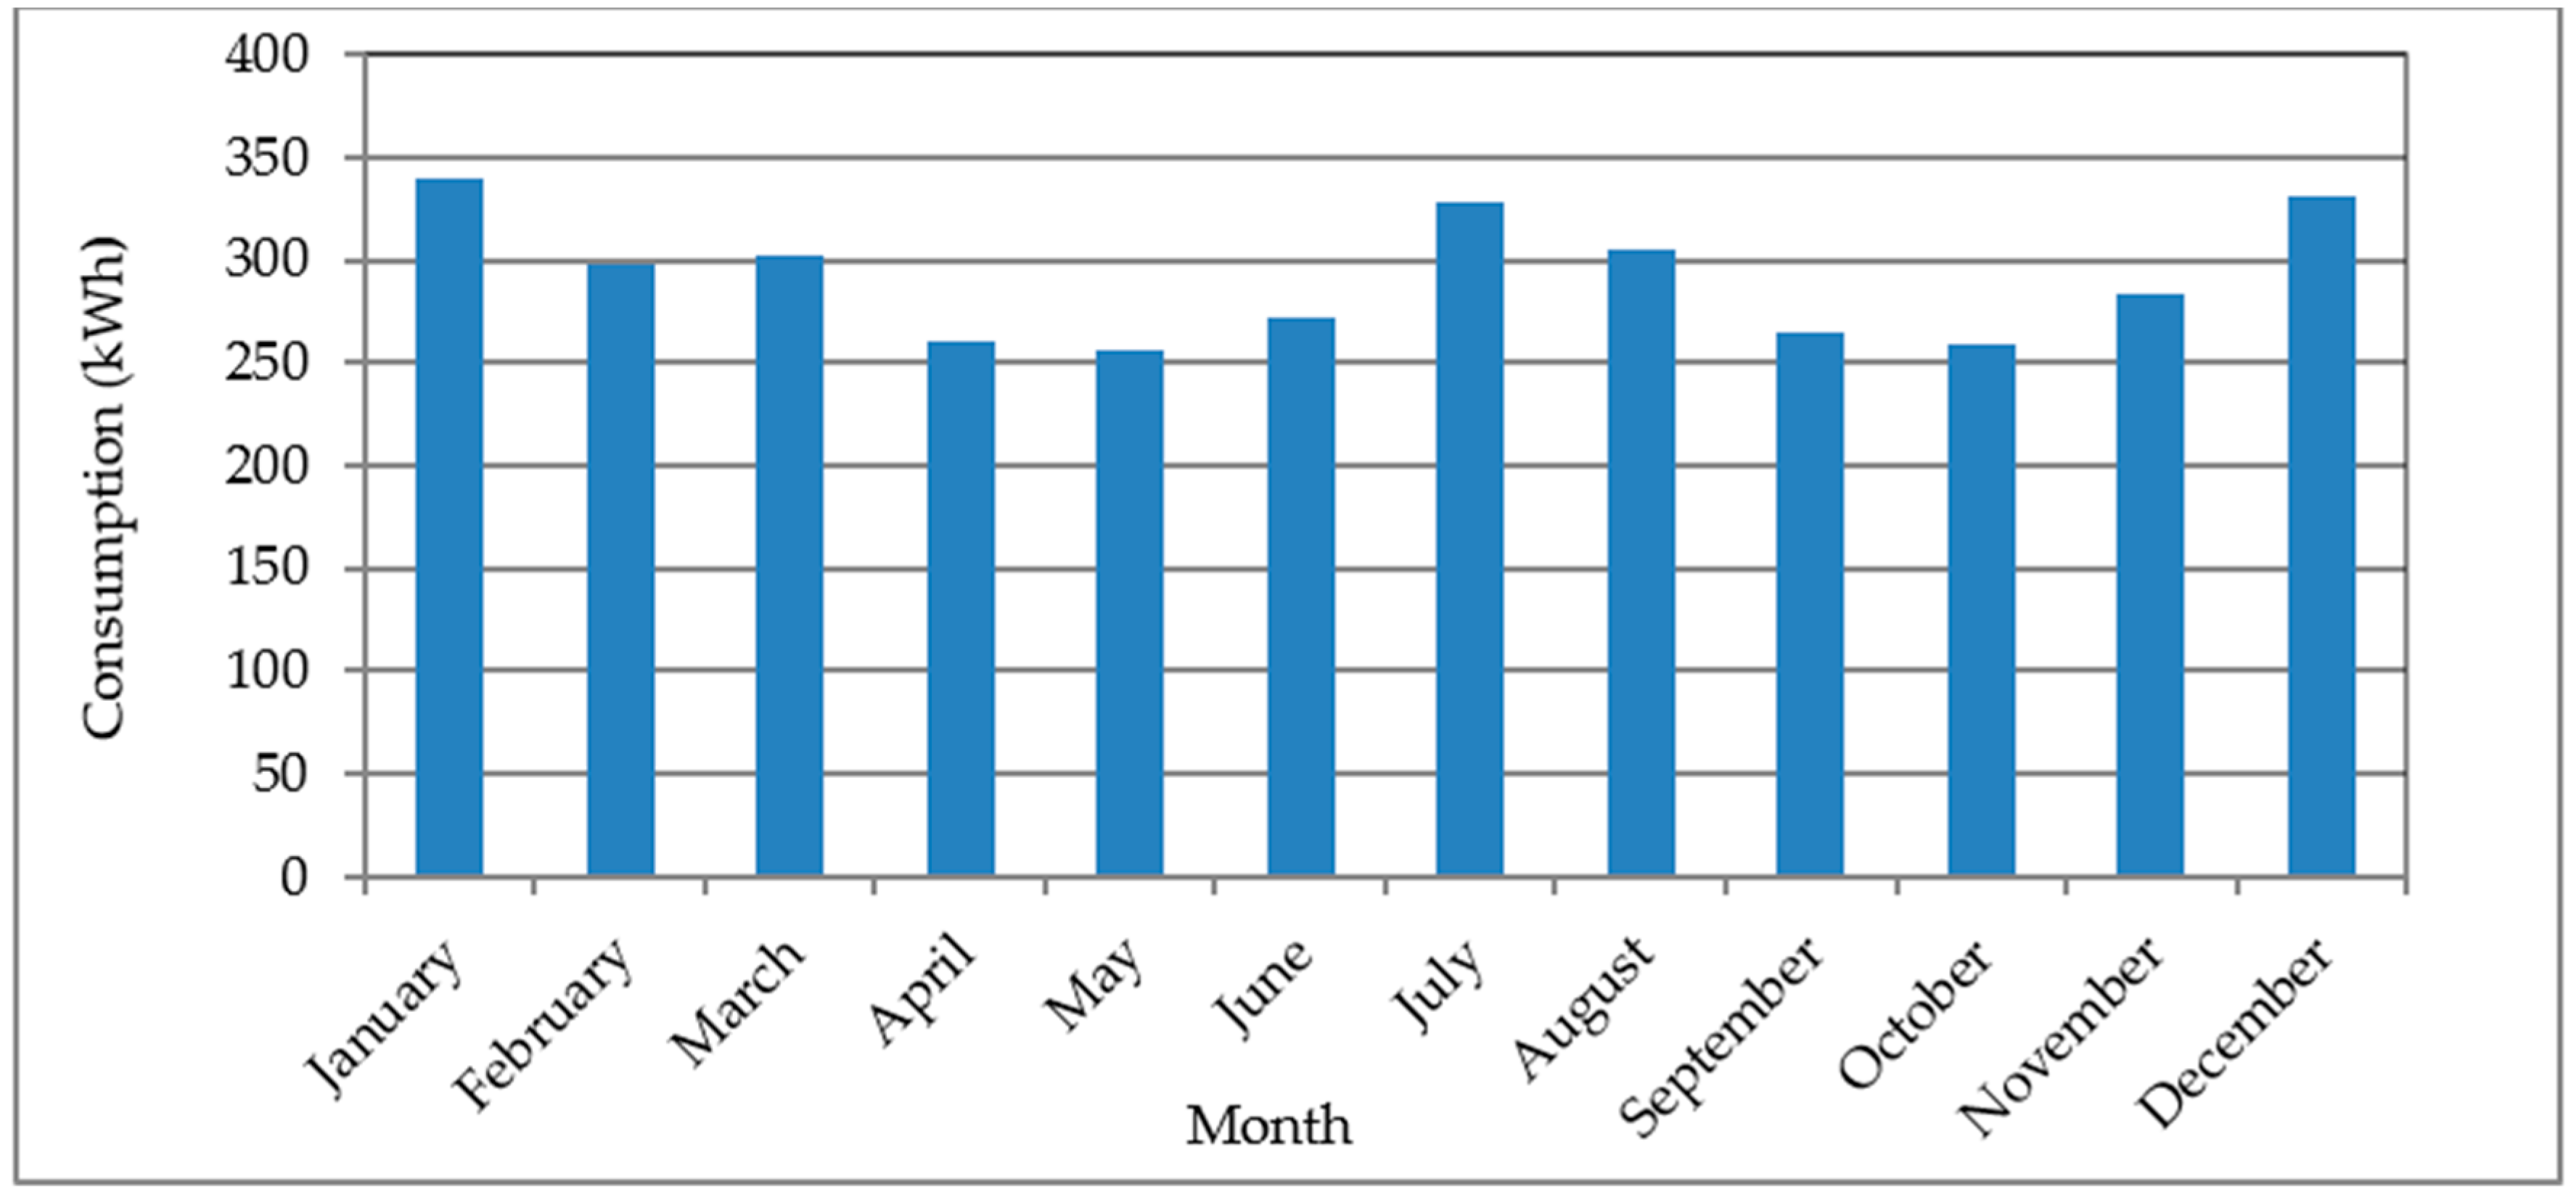
The seasonality of energy consumption from the grid ( E P ) is represented in Figure 3, depicting the total amount of energy demanded in every month. As can be observed, summer and winter months present the higher rates due to the devices used in order to mitigate the effects of the weather conditions. The range of the total monthly consumption is between 253 kWh in May and 339 kWh in January.

2.2.2. Energy Price and Tariffs

The market price of the energy (PE) is an hourly variable which can be obtained from the OMIE database [29]. OMIE is the nominated electricity operator for managing the Iberian Peninsula’s electricity markets. It operates 24/7 and manages the transactions for the sellers and buyers who trade on the electrical market. There are more than 1000 agents in total and involving over 15 million transactions per year. Through all the bids for selling and acquiring energy, OMIE builds the aggregate supply and demand curves and implements the matching process, starting with the cheapest offers until demand is satisfied in each programming period, and resulting in the end with the price and the amount of energy in the period [30]. Figure 4 shows that the crossing point of both aggregate curves determines the market price (PE) and the quantity of energy for the scheduling period. Note that the day-ahead prices are important in our model because they allow for the determining of the cost of the bill paid to the market.
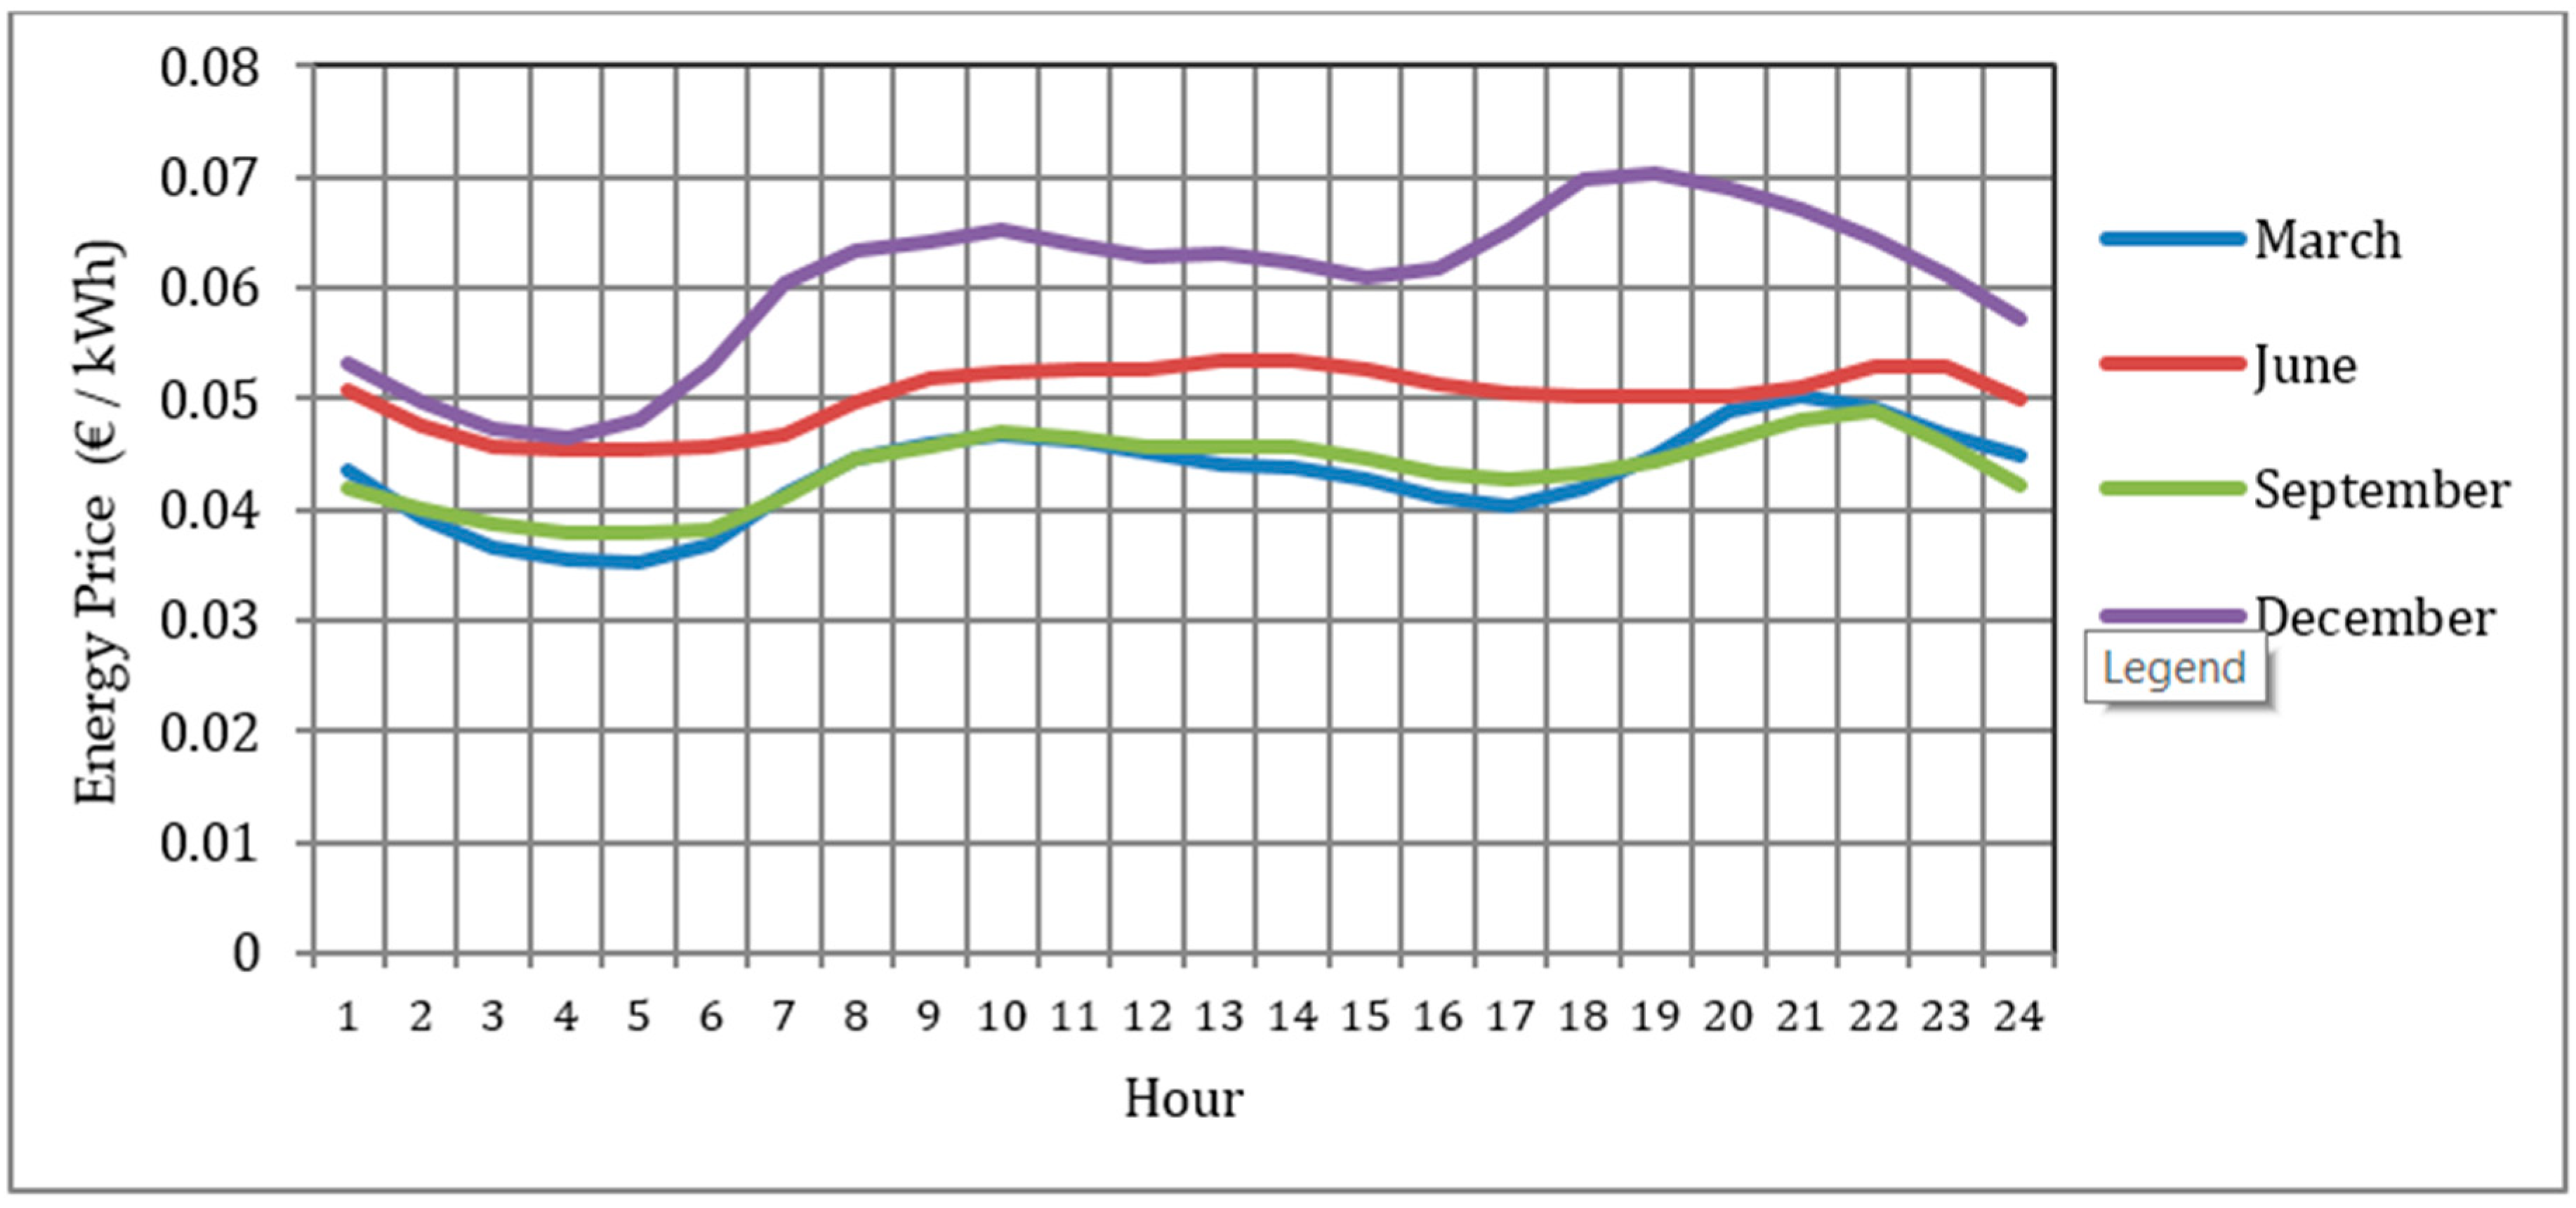
The day-ahead market price is fixed every hour, depending on the total energy demanded by consumers and the type and quantity of energy bids offered by the suppliers (green or non-renewable energies). As an example, Figure 5 contains the average hourly prices (PE) for March, June, September and December.
Note that the shape of the curves is similar to that of the daily household consumption ( E P ) of the previous section (Figure 2), with similar peak and off-peak hours during the day. Winter and summer months have the most expensive prices, caused by the peak in energy demand, their market prices being nearly one and a half times the prices of the cheapest months (March and September). The effect of the energy demanded on the market price is also observed during the entire day. In this sense, those hours with higher demand also have higher prices.
Additionally, when energy from the grid is consumed ( E P ), it is necessary to pay an hourly access tariff (AT). There is also a yearly price (PP), related to electrical power contracted by the user (CoP). This model assumes the 2.0 HDT hourly discrimination Spanish tariff for the domestic household, with a contracted power of 4.4 kW (CoP). This tariff is regulated by the Spanish Government; its value depends on both the peak and off-peak hours and the season of the year. Table 2 summarizes the values of the tariffs used in this research.
The Value Added Tax (VAT) for energy consumption in Spain is 21.0% and it is applicable to the complete energy bill. Moreover, there is a specific electricity tax of 5.11% on the net consumption bill and contracted power [30].

2.2.3. Technology of the Facility

The facilities assessed in this research are composed of several PV panels (made from crystalline silicone) [9], an inverter and a BESS to store the surplus energy. The slope and azimuth angle can be adjusted to the location where they are installed, in order to maximize energy production. Additionally, the energy generation of these panels ( E P ) depends on their own peak power ( P P V ). Then, higher peak power derives in higher energy generation, as is exemplified in Figure 6 for PV panels located in Seville City on 21 June. Higher peak powers provide also greater amounts of energy that can be used for self-consumption ( E C P V ), BESS storage ( E C H ), or electricity sale ( E S )—Equations (2a) and (2b)—, thus generating greater cash flows ( C F t , Equation (8)). The panel acquisition costs ( C P V ) are also more expensive, so the facility needs to be adjusted to the hourly user demand ( E D ) in order to make it profitable. In this research, the unitary cost for the PV panels ( C u P V ) is 900 €/kWp (In addition to these references, the unitary cost of the PV system has been contrasted with a real offer made by a local contractor in Spain; the offer includes EPC, BoS, inverter, PV modules and others) [31,32,33]. An important aspect to take into account is that this cost refers to the total price of an installed roof PV system, including Engineering Procurement and Construction (EPC), Balance of Systems (BoS), inverter, PV modules and others. The only cost that has not been considered in this total is the fixed installation cost (permitting and other legal issues) since in many Spanish municipalities there are equivalent subsidies that offset these costs—note also that this assumption simplifies the programming of the model.
The BESS uses a Li-Ion battery—a detailed study of the different categories of energy storage technologies, as well as their technical performance and future perspectives, can be found in Arcos et al. [35]. Following these authors, Table 3 presents the main characteristics of the Li-Ion batteries, which are obtained by combining information from various sources: Gomez et al. [36], Segui [37], Bardo [38], Hernández [39], Battery University [40], Jofemar Energy [41], Vélez [42], Clean Technica [43] and IRENA (International Renewable Energy Agency) [44].
The current performance of this type of storage technology has been significantly improved in recent years. In particular, the unitary cost ( C u B ) has been reduced by an average of 20% per year during the period 2010–2019 and, given the intensity of research focused on this field, it is foreseeable that the downward trend will continue. If the cost reduction continues at this rate, costs would be halved in 3.5 years (Equation (12)).

2.2.4. Location and Energy Production

The energy generated ( E P V ) depends on the solar irradiation received by the PV panels during the day and on their own peak power. The Photovoltaic Geographical Information System (PVGIS) of the European Commission provides information about the irradiation received on a PV panel, depending on its own position (latitude and inclination) and considering also the sunlight reflection, the changes in the solar spectrum, and the module temperature. The facility is located in Seville City, but the model can also be implemented in another location, knowing the hourly demand (see Figure 3). The parameters of the PV panel configuration (obtained from PVGIS) are shown in Table 4.
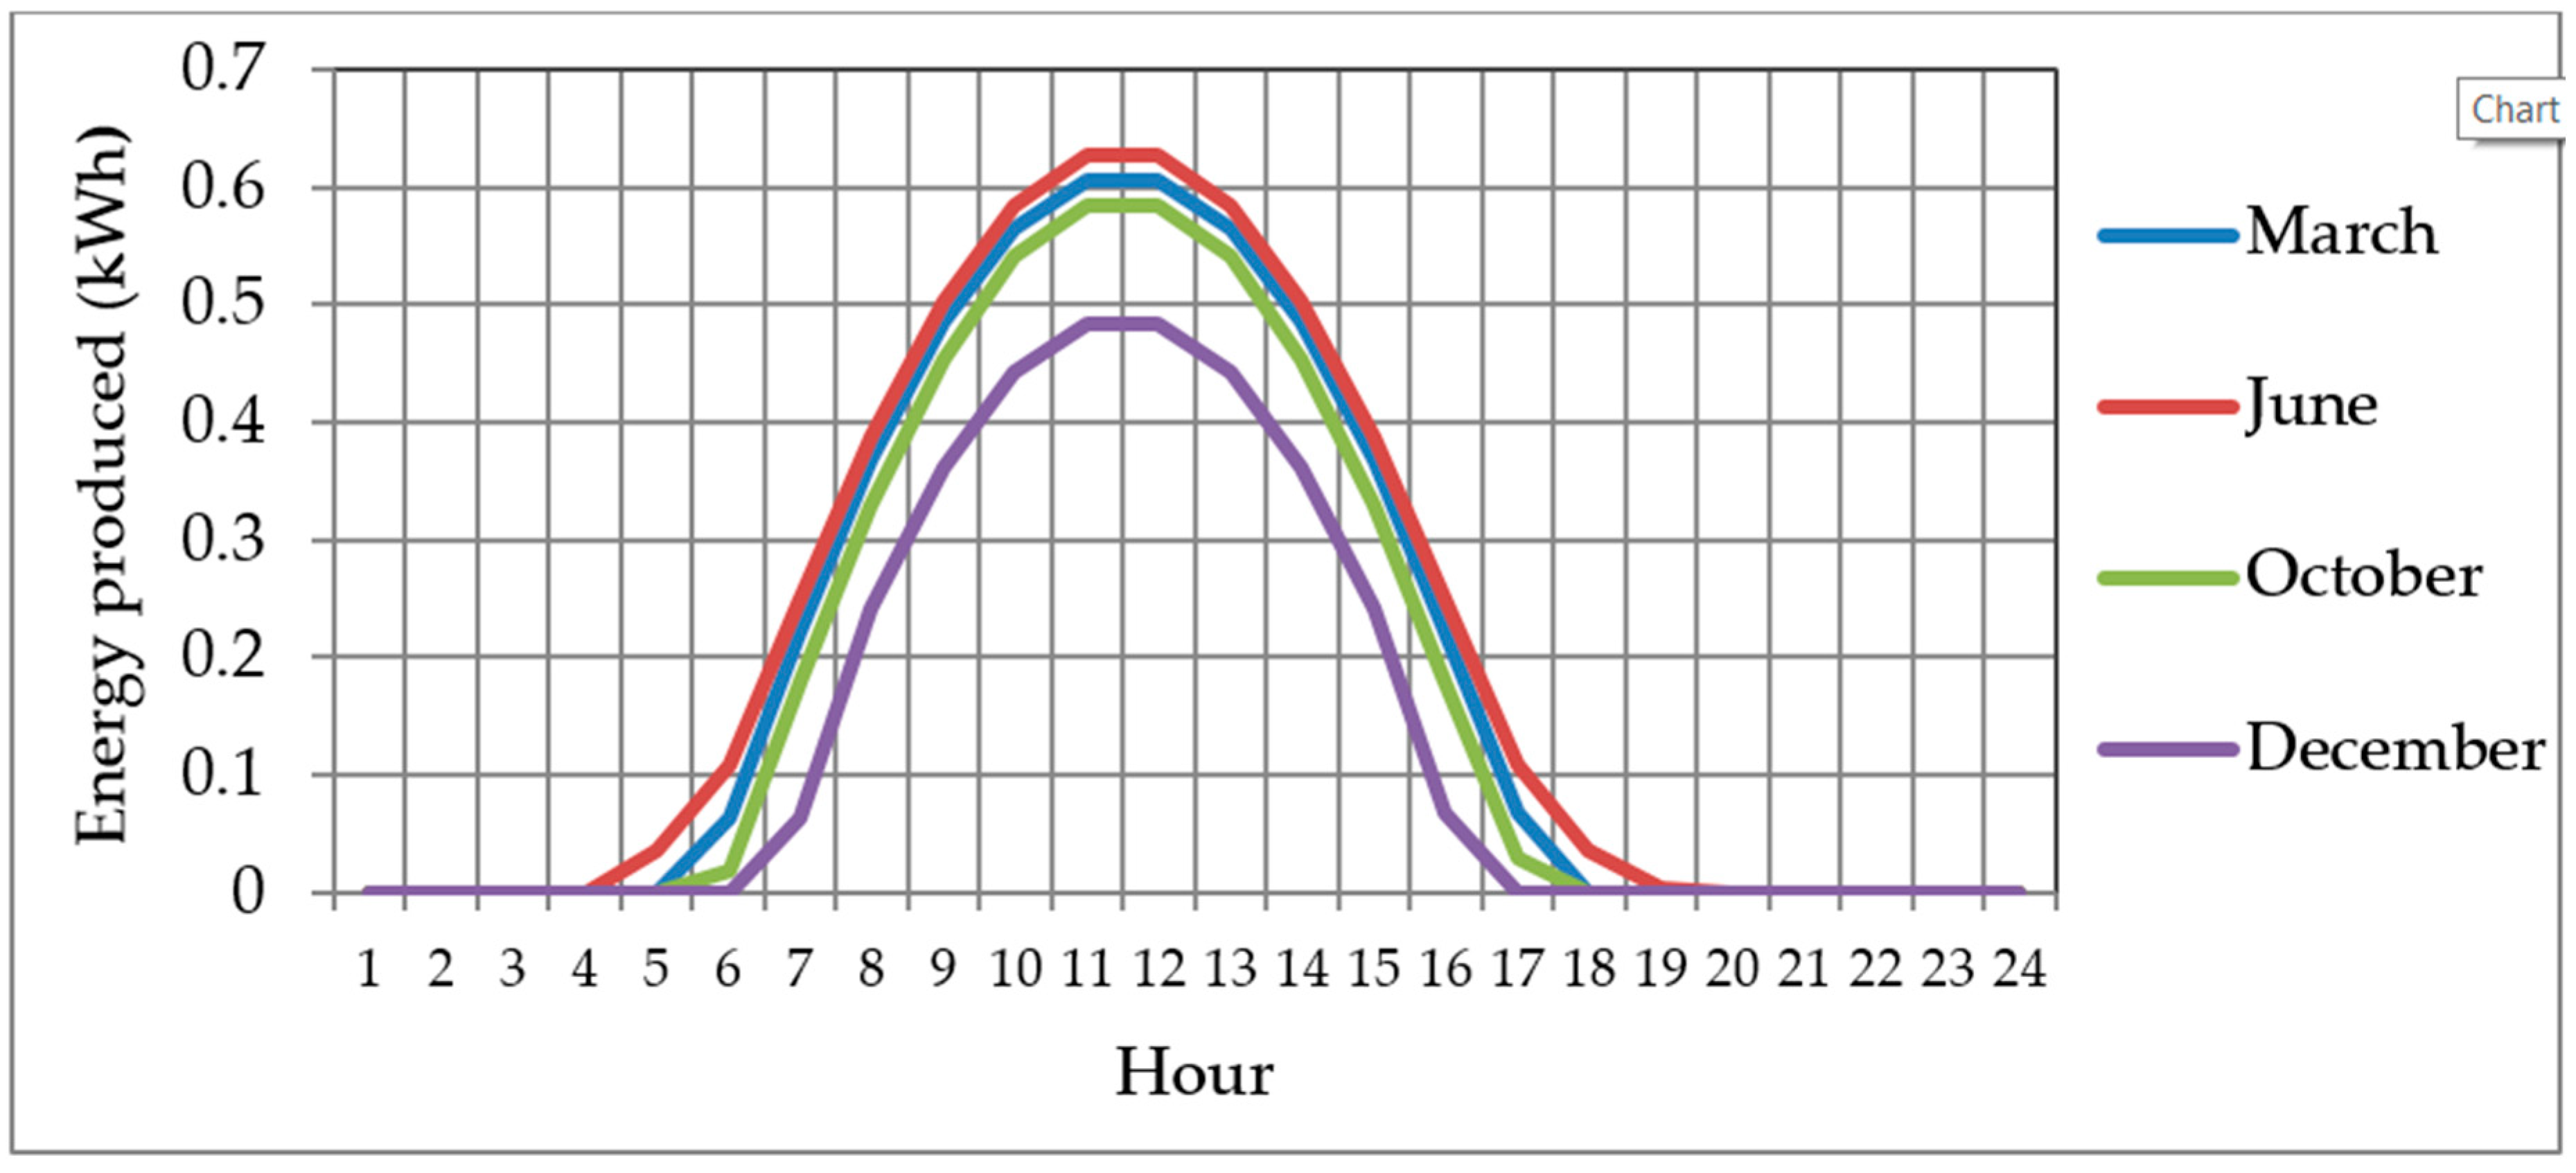
The curve of the hourly energy generated ( E P V ) by a 1.0 kWp PV panel located at Seville City is shown in Figure 7, taking the first day of March, June, September and December as references.
Note that the maximum energy production for a PV panel ( E P V ) happens around 12:00 regardless of the month considered. Moreover, as the production depends on the solar irradiation received, the summer months present the higher production rates, while the winter months present the lower rates. An important thing to note is that the time slot in which the panels produce energy is longer in summer months (approximately two hours earlier in the morning and two hours later in the evening) as a consequence of the greater amount of sun hours.
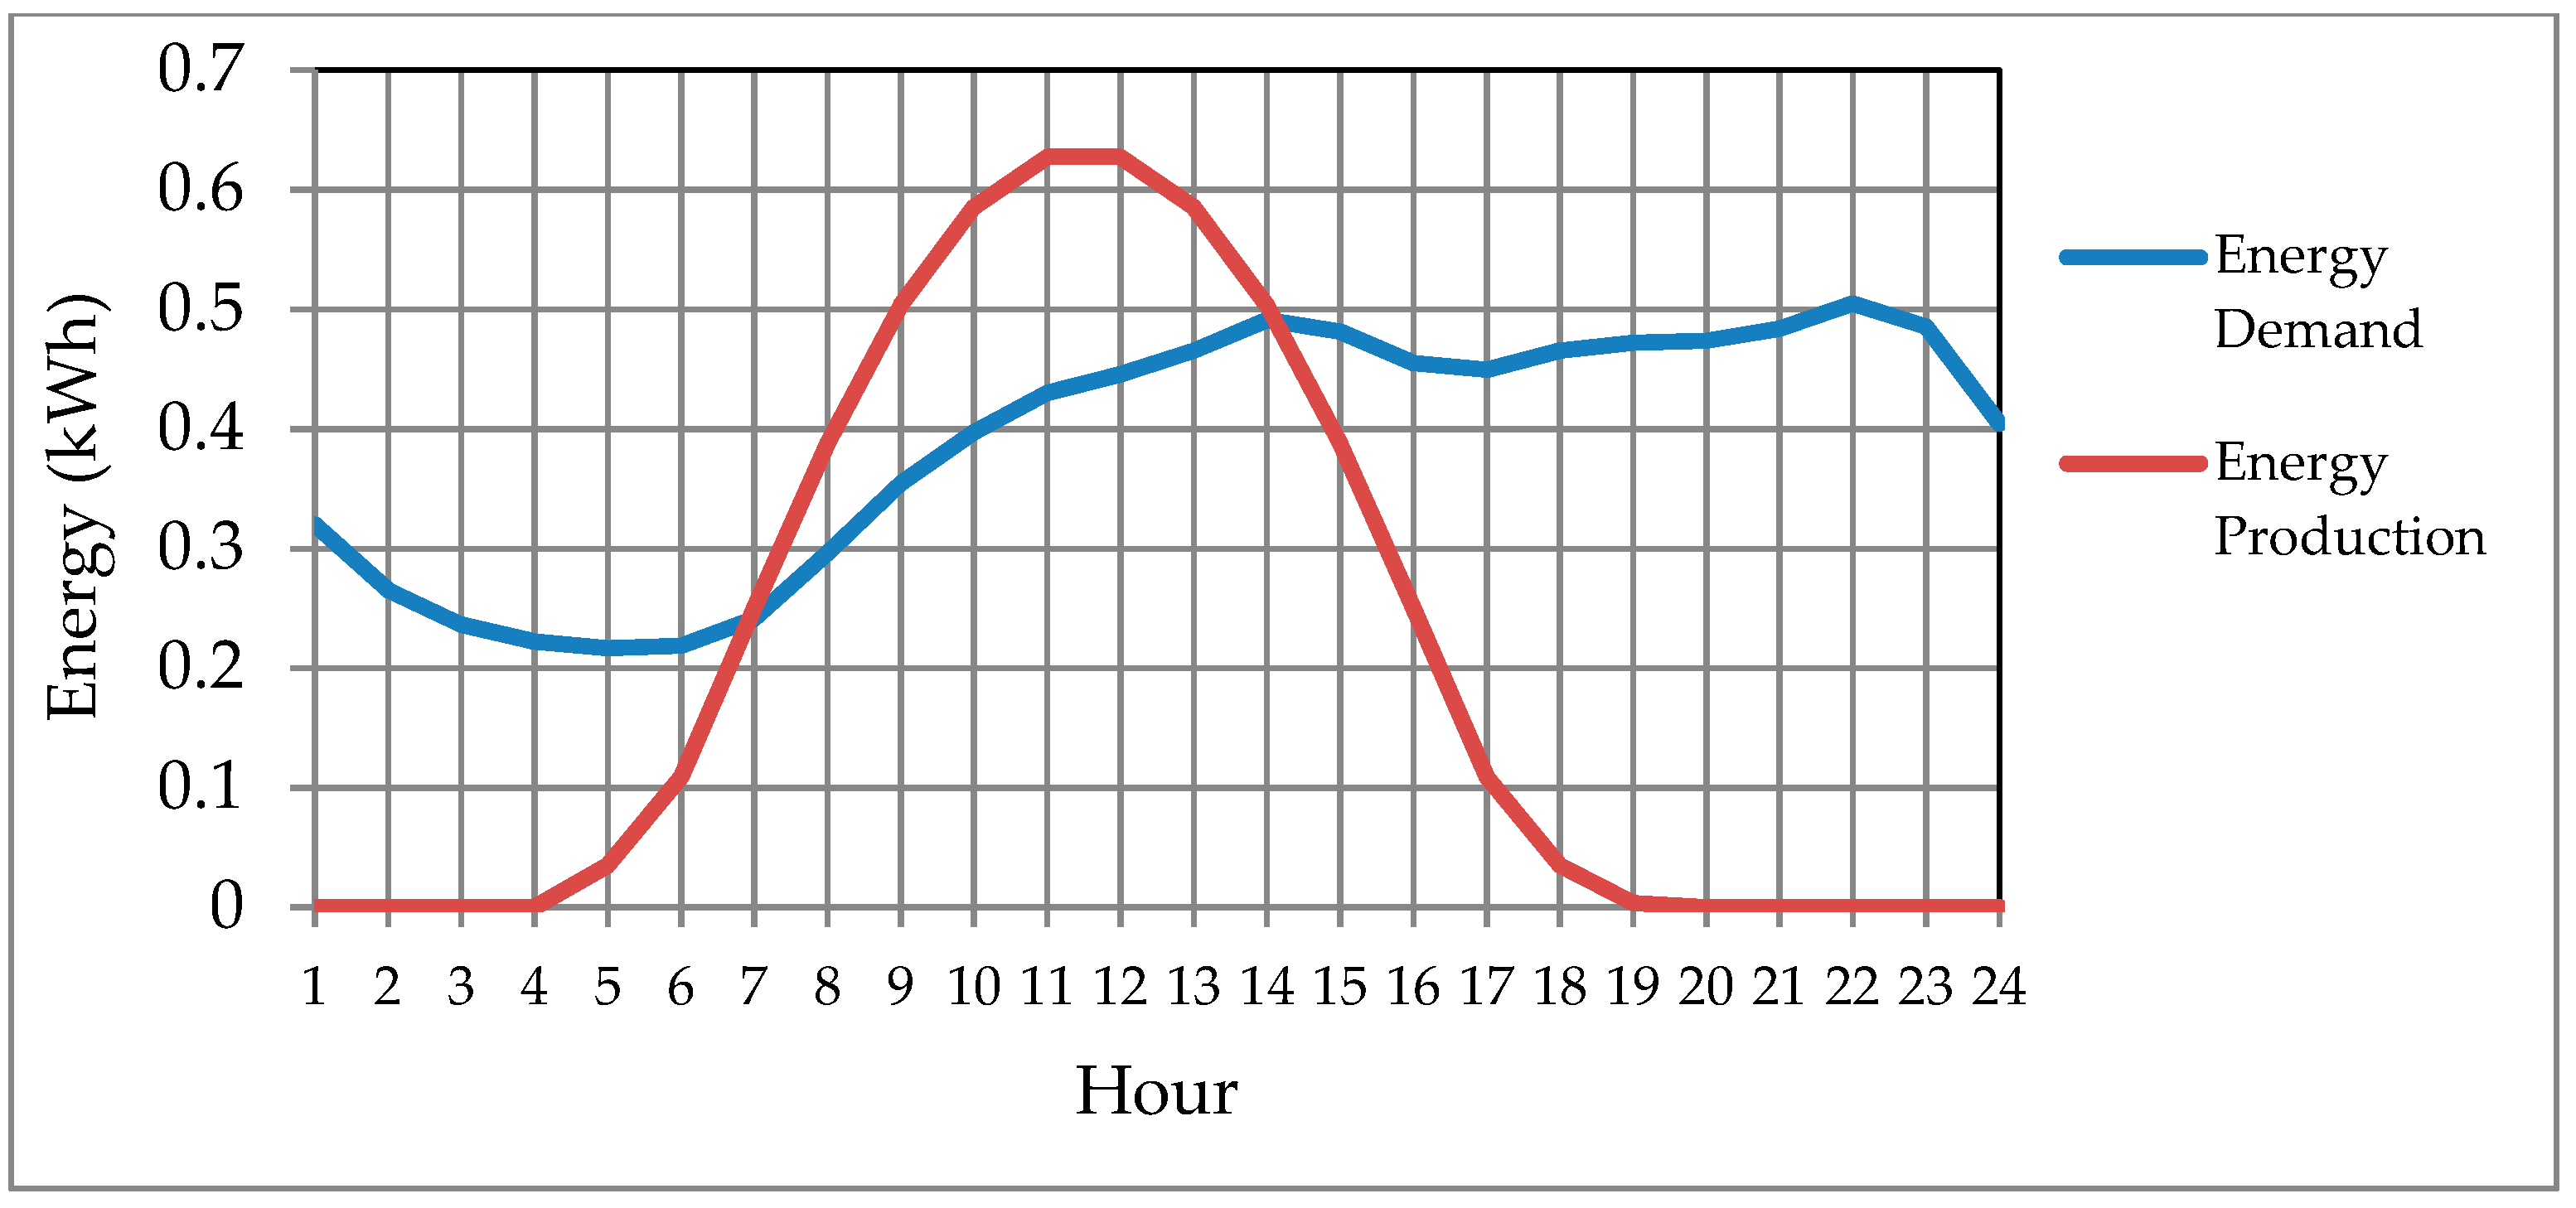
The superposition of the demand profile ( E D ) and the production curve ( E P V ) during the day will show the intervals where the facility is able to fully cover household demand. Figure 8 represents both curves for 24 June 2018.
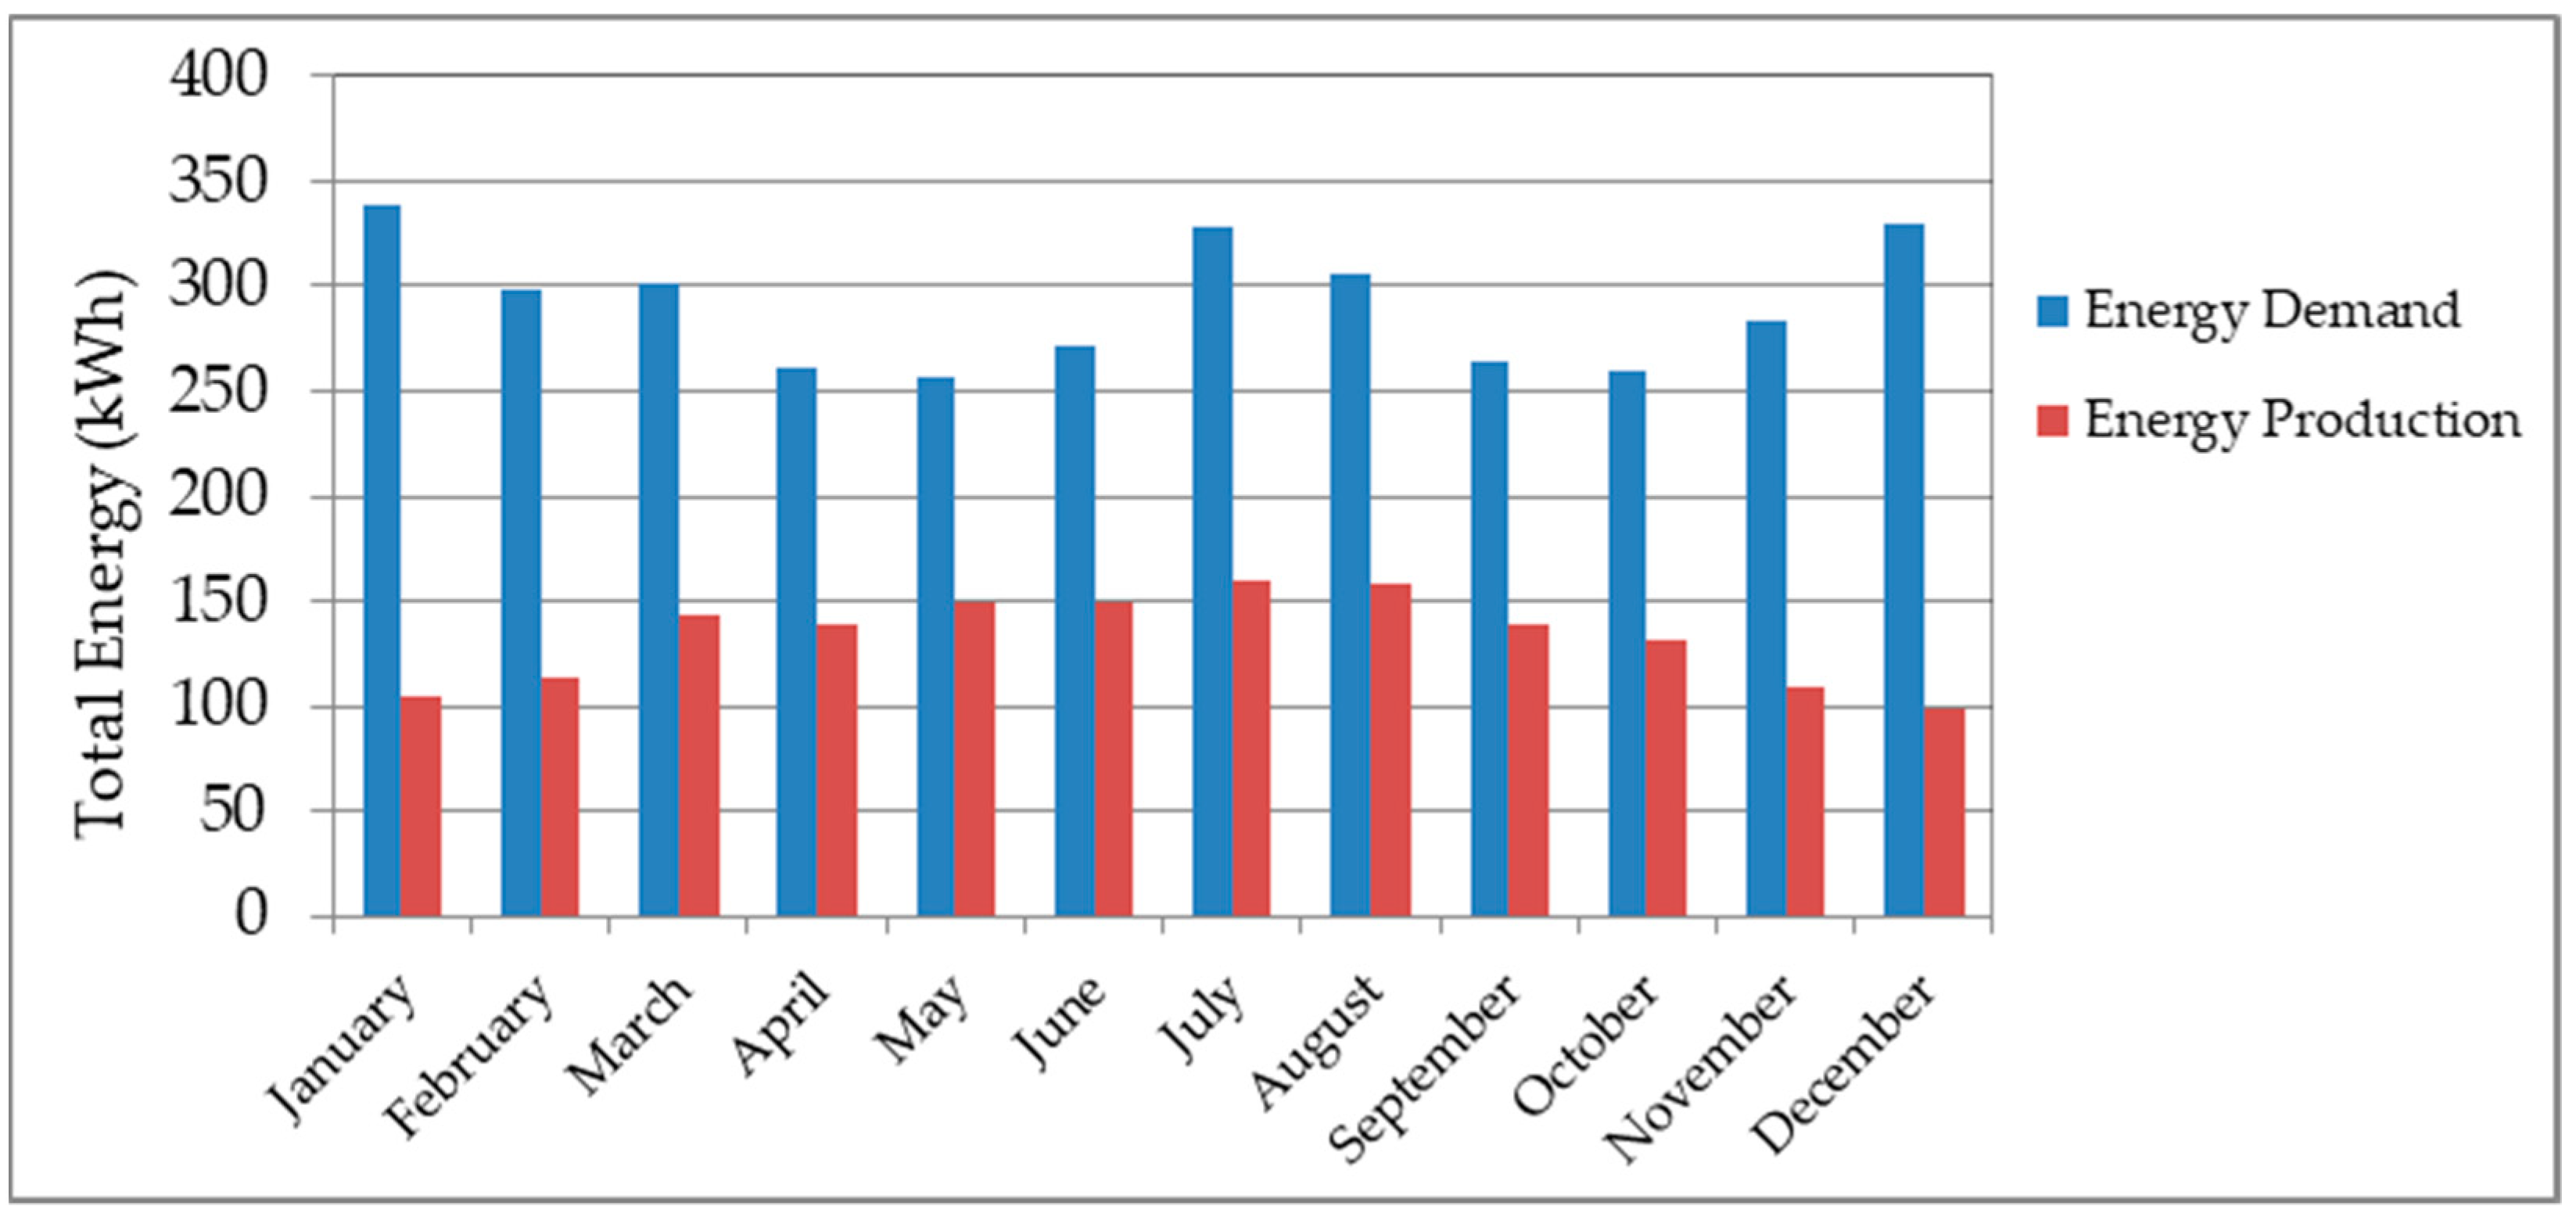
For the hourly slot from 7:00 to 14:00, the facility is able to fully cover the demand ( E D ) directly with the production of the PV panels ( E P V ) and, at the same time, produces surplus energy ( E E X ), which can be used to feed into the network ( E S ) or stored in the battery ( E C H ), Equation (4)). From 14:00, the energy production is lower than the demand and the household needs to be supported firstly from the battery ( E C B ) and secondly, if necessary, from the network ( E P ), Equation (5)). Figure 9 shows the total monthly energy consumed and produced for our representative household.
The energy generated ( E P V ) covers around 30% of the annual energy demand ( E D ) during the winter months (January and December), while in the summer months it can cover above 50%, allowing a greater amount for consumption ( E F ) and sales ( E S ), and generating greater sales (IC) and savings (S)—Equations (6) and (7).

3. Technical and Financial Results of the Self-consumption Model

In this section, technical and financial results are presented for the residential facility with or without BESS. The life of the project has been fixed at 25 years, with a discount rate of 6.5% [45]. The shelf life of the BESS corresponds to 5000 charge cycles. If we assume one charge cycle per day, it would be necessary to replace the BESS after the thirteenth year. However, we have decided to replace it in year twelve in order to avoid battery malfunction problems. Note that the investment produced in that year will negatively affect its corresponding cash flow (Equation (8)). Our analysis allows us to measure the economic effect of changes in domestic consumption and in the prices of the panels and the BES System.

3.1. Household PV Panels Without Storage

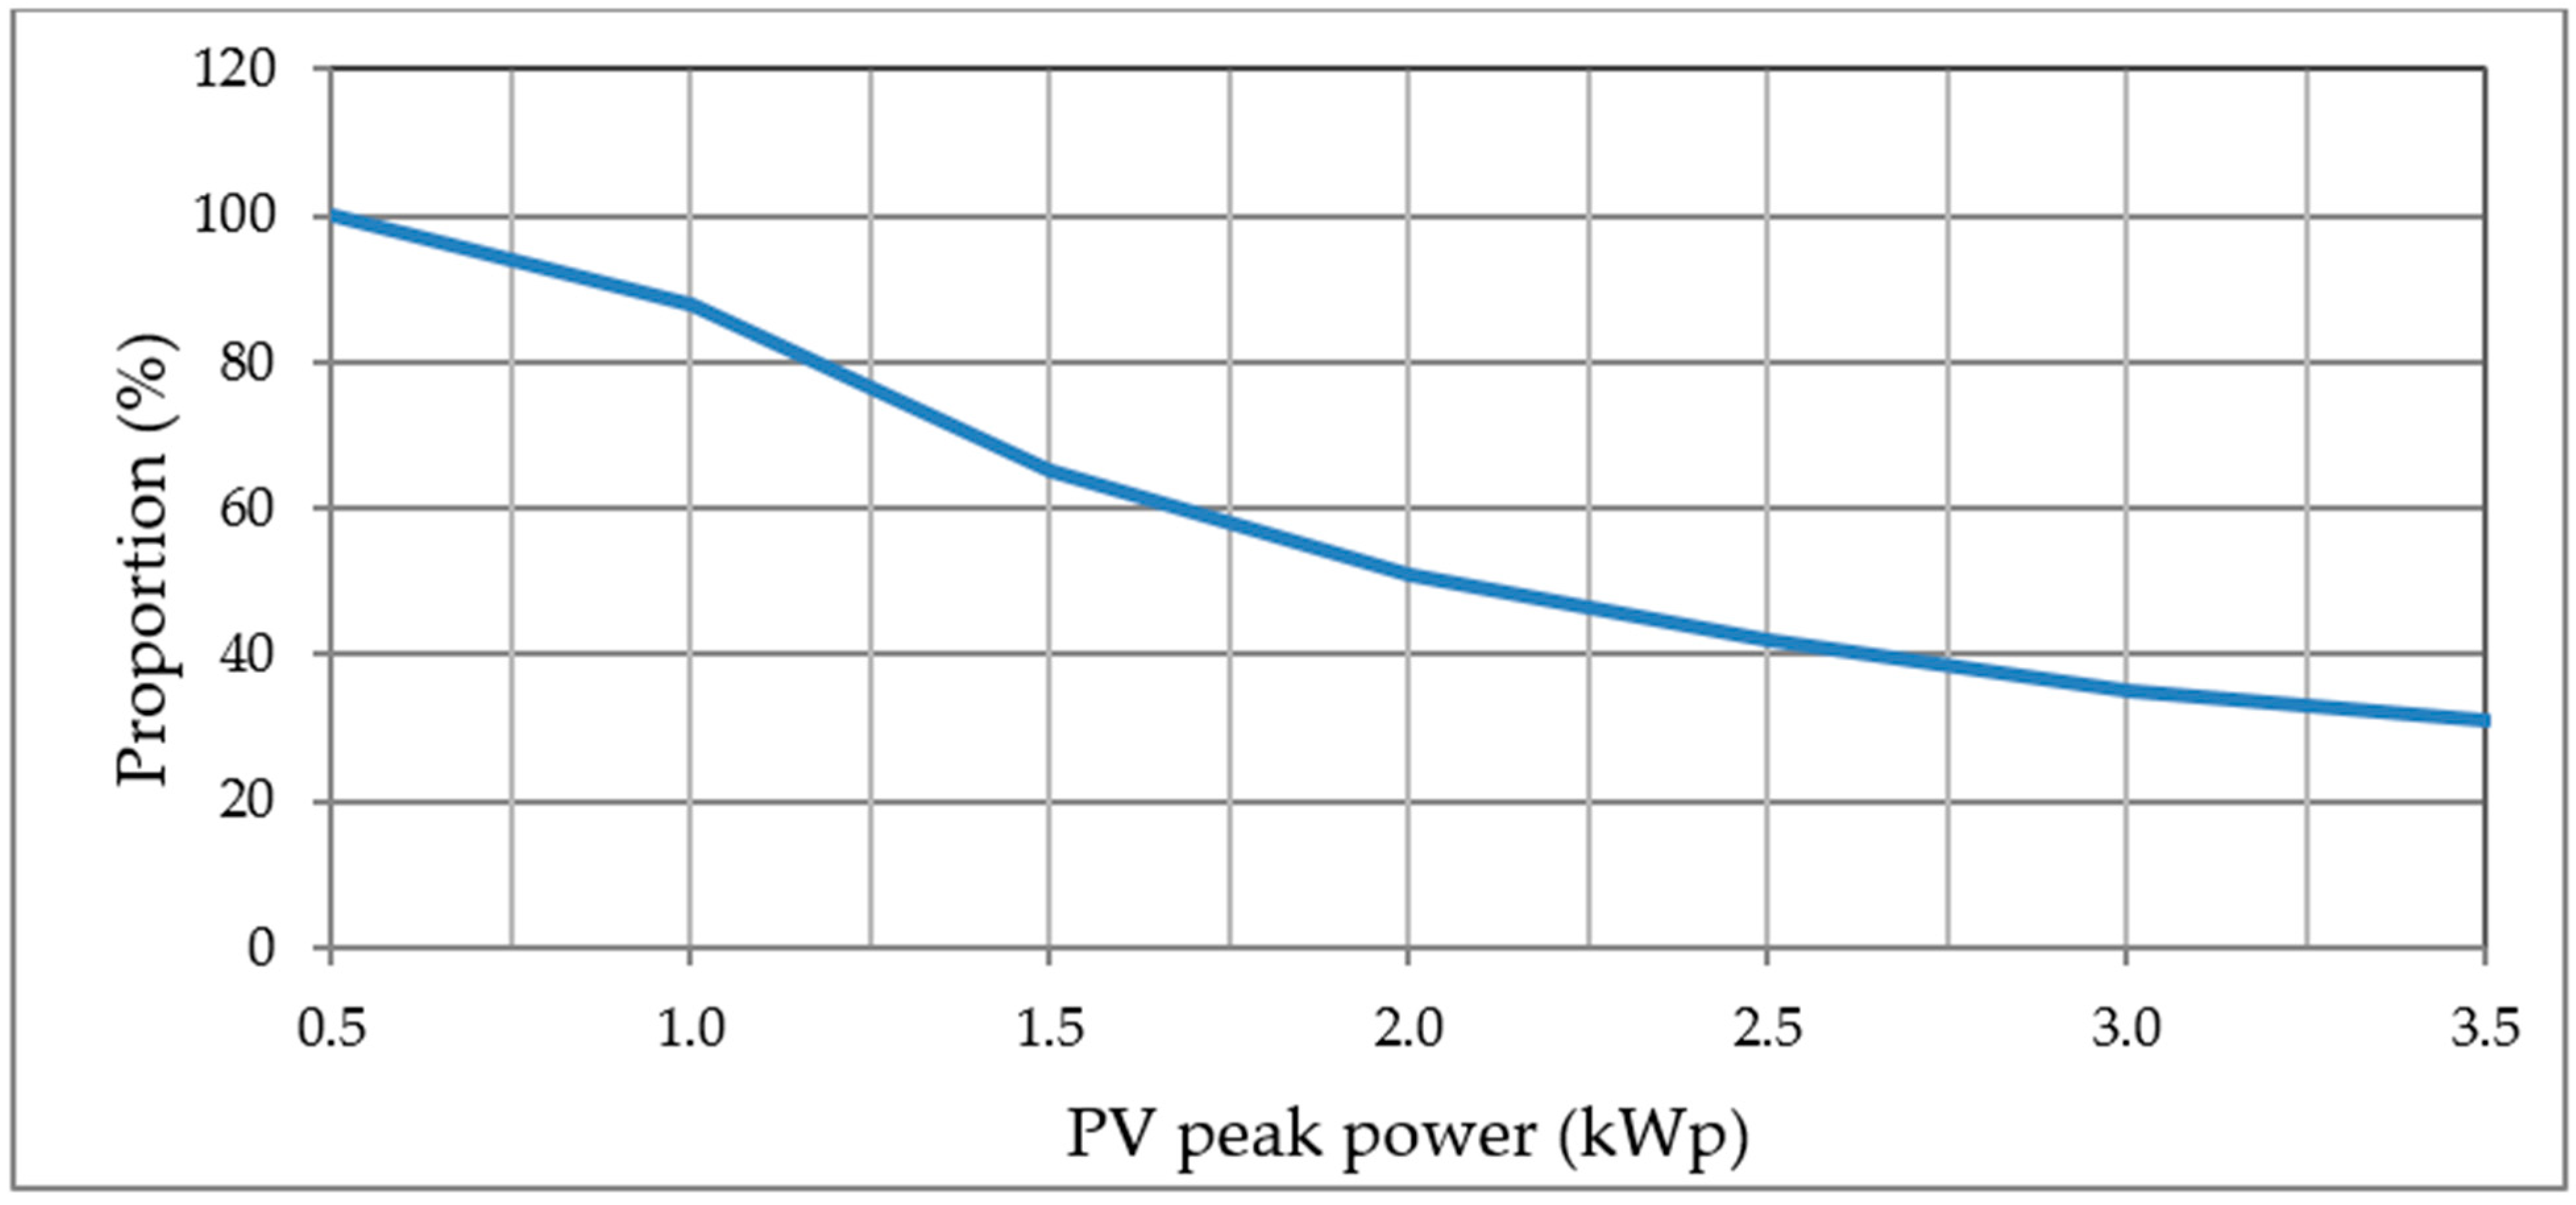
The energy production of the facility ( E P V ) increases with the peak power of the PV panel installed ( P P V ), making the household more autonomous (less dependent on the network) and the savings (S) and incomes (IC) higher. The annual proportion of facility energy production (D/ E P V ) which is intended for self-consumption ( E F ) depends on the peak power of the panels, as is shown in Figure 10 for domestic demand (D) of 3500 kWh.
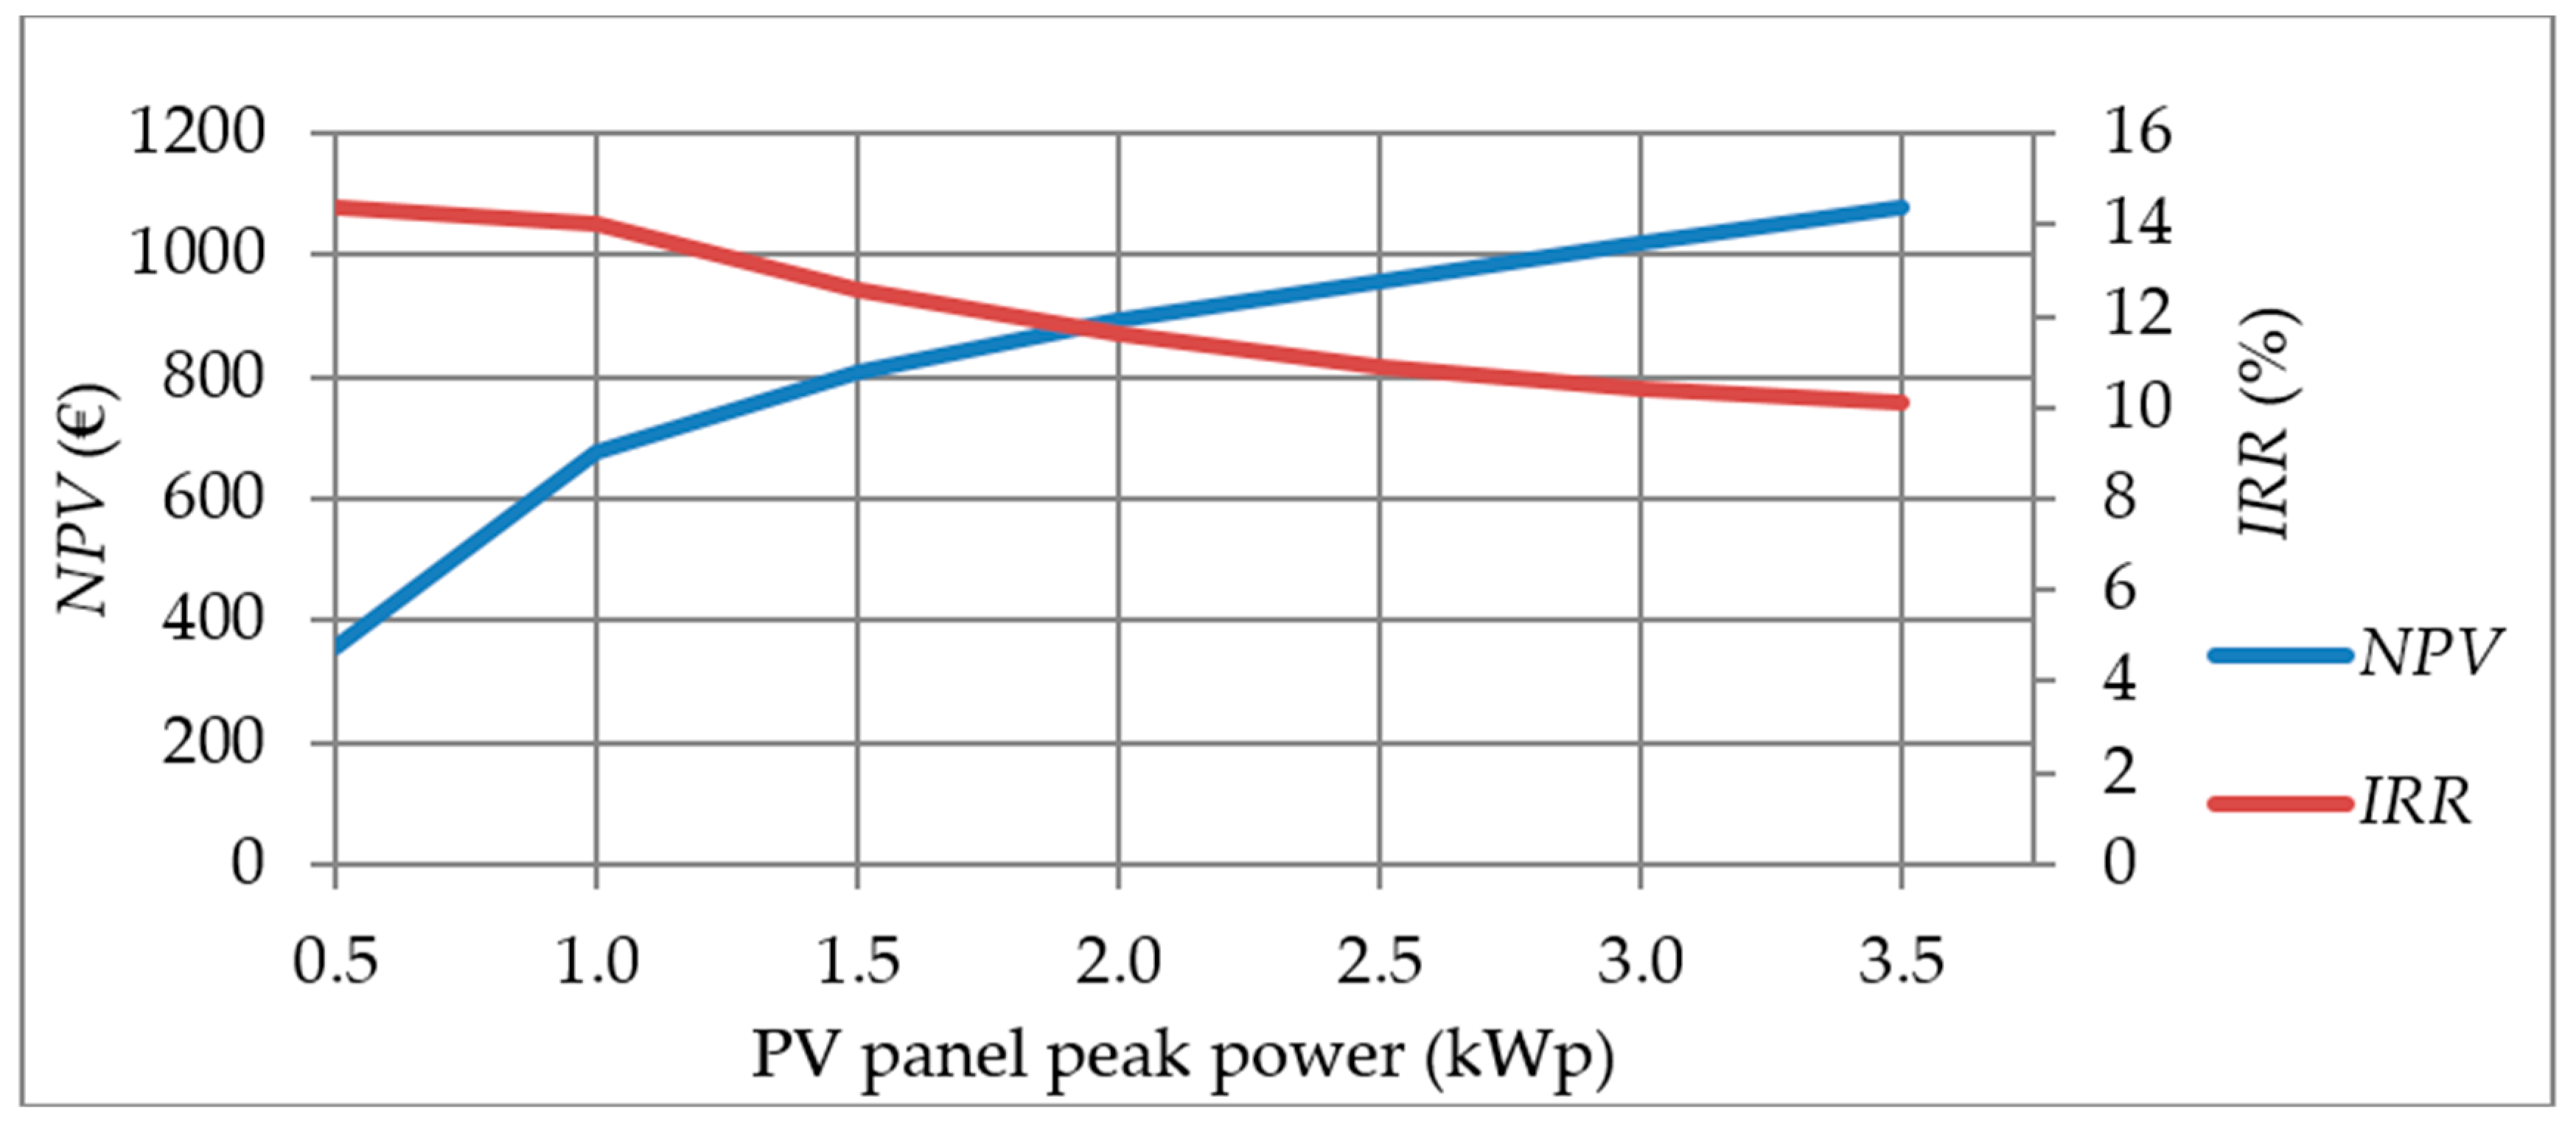
The curve reveals that this proportion falls with higher panel peak power, going from 100% for a 0.5 kWp panel to 30% for a 3.5 kWp panel. When the peak power ( P P V ) increases, the cash flow (CF) from sales (IC) and savings (S) increases as well, but the key question is whether this cash flow increase offsets the cost of more expensive panels ( C P V ) and, therefore, the greater investment needed ( I 0 , Equation (11)). Technical and economic outcomes are shown in Table 5 for a residential demand (D) of 3500 kWh without BESS; also, the financial indicators can be graphically inspected in Figure 11 (NPV and IRR) and Figure 12 (IR).
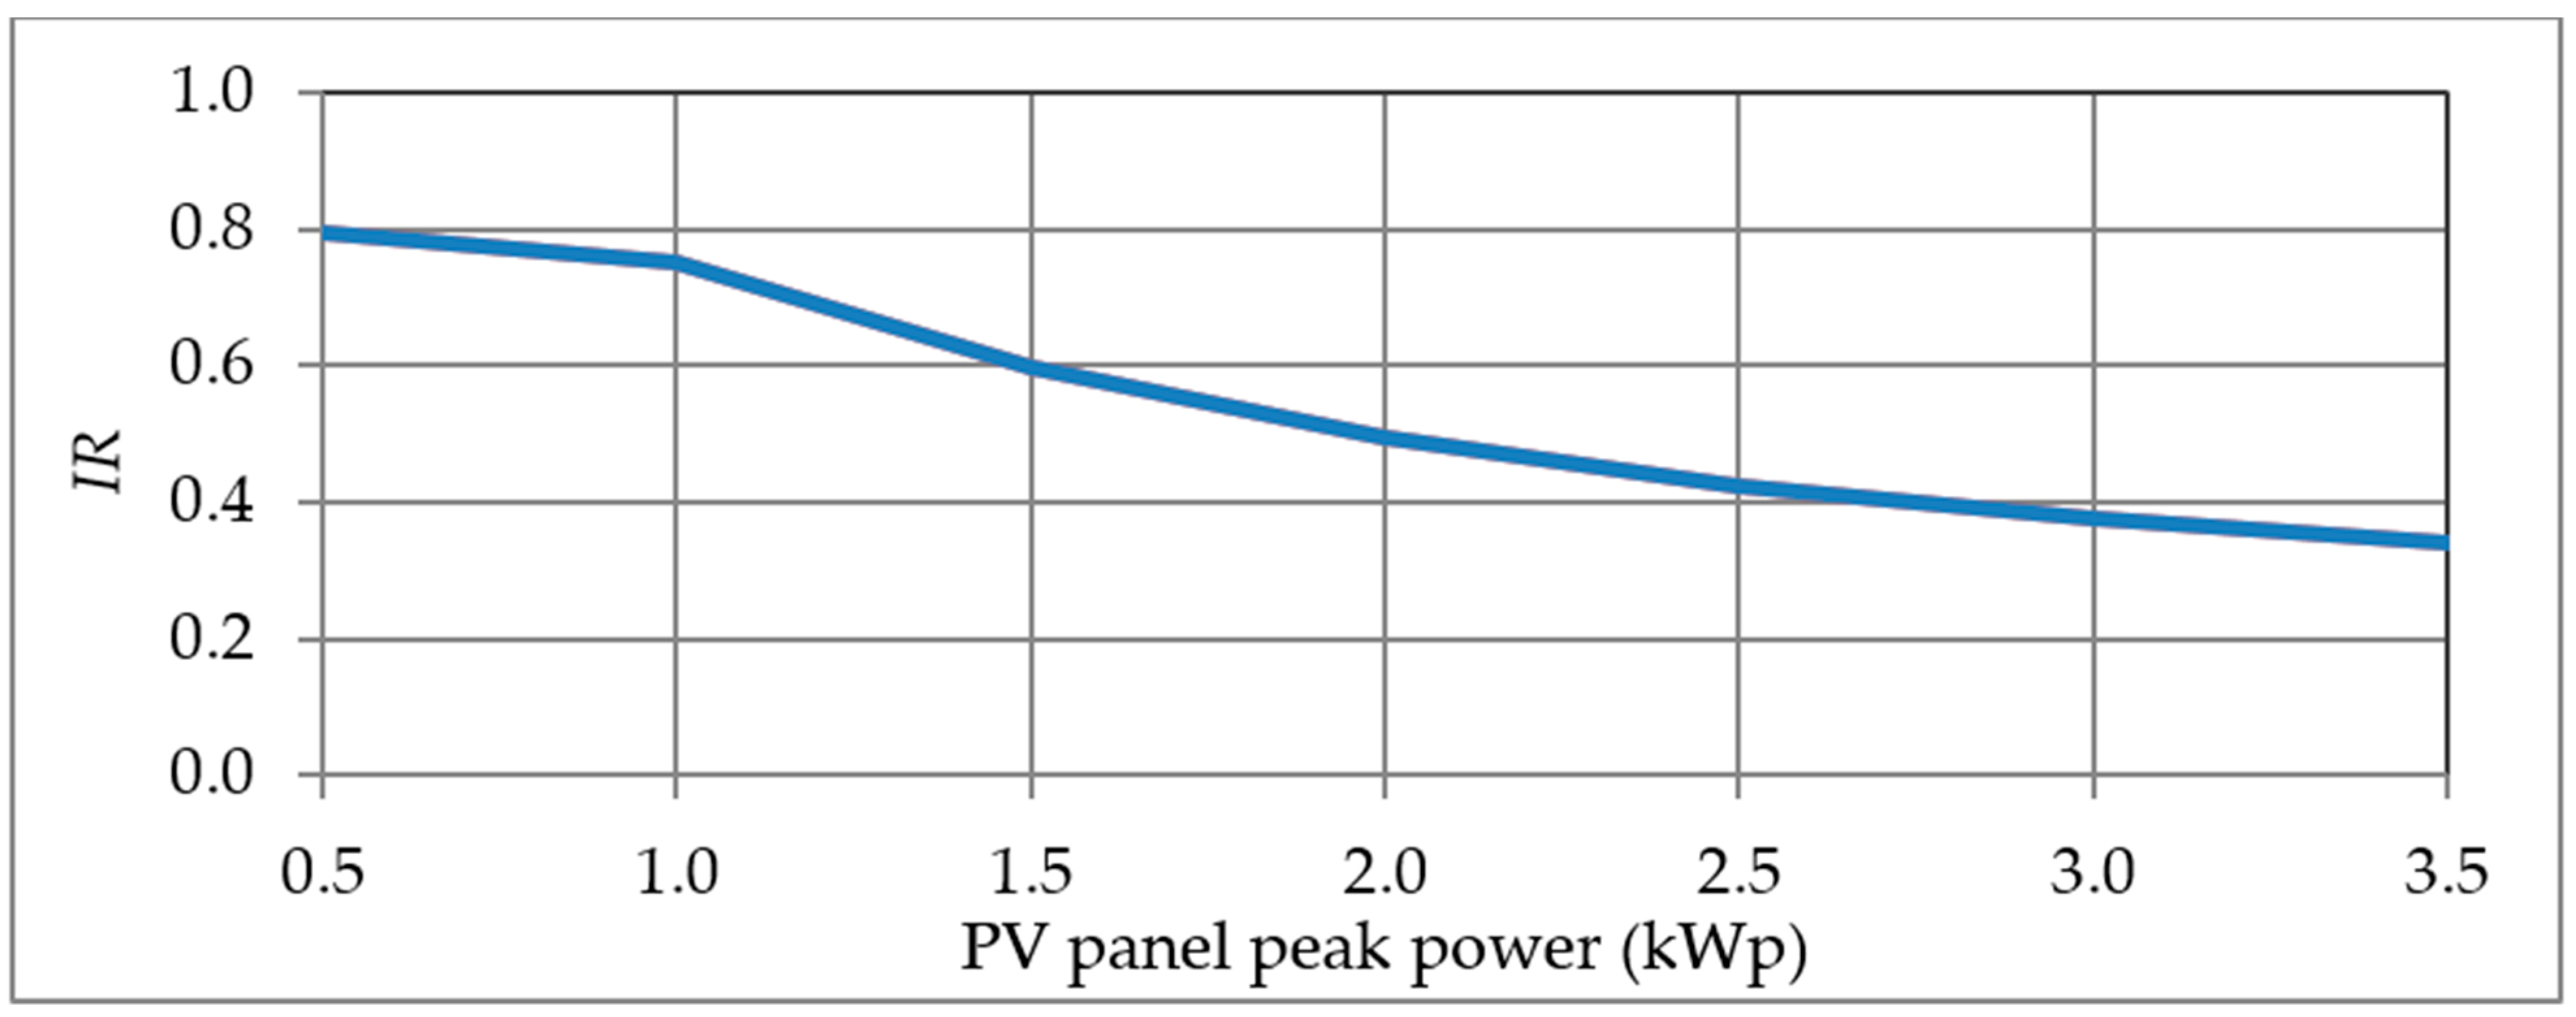
The facility with 0.5 kWp PV panels (the lowest peak power considered) shows the best IRR and IR ratios, reaching the values 14.4% and 0.8 respectively—observe that for this panel size, all the PV energy is used for self-consumption (no PV energy is wasted), thus generating the corresponding savings (S). The IR decreases with the peak power ( P P V ) because the NPV increase is lower than the increase in the investment ( I 0 ,   I 12 ) assumed for the acquisition of PV panels with higher peak powers. In this way, notice that the investment required for a 3.5 kWp facility is seven times the cost of a 0.5 kWp one, while the NPV is nearly three times higher. Therefore, the IR decreases gradually from 0.8 to 0.34; note also that the NPV grows with P P V because the discounted cash-flows (savings plus incomes) grow more than the initial investment when the peak power of the panel increases.
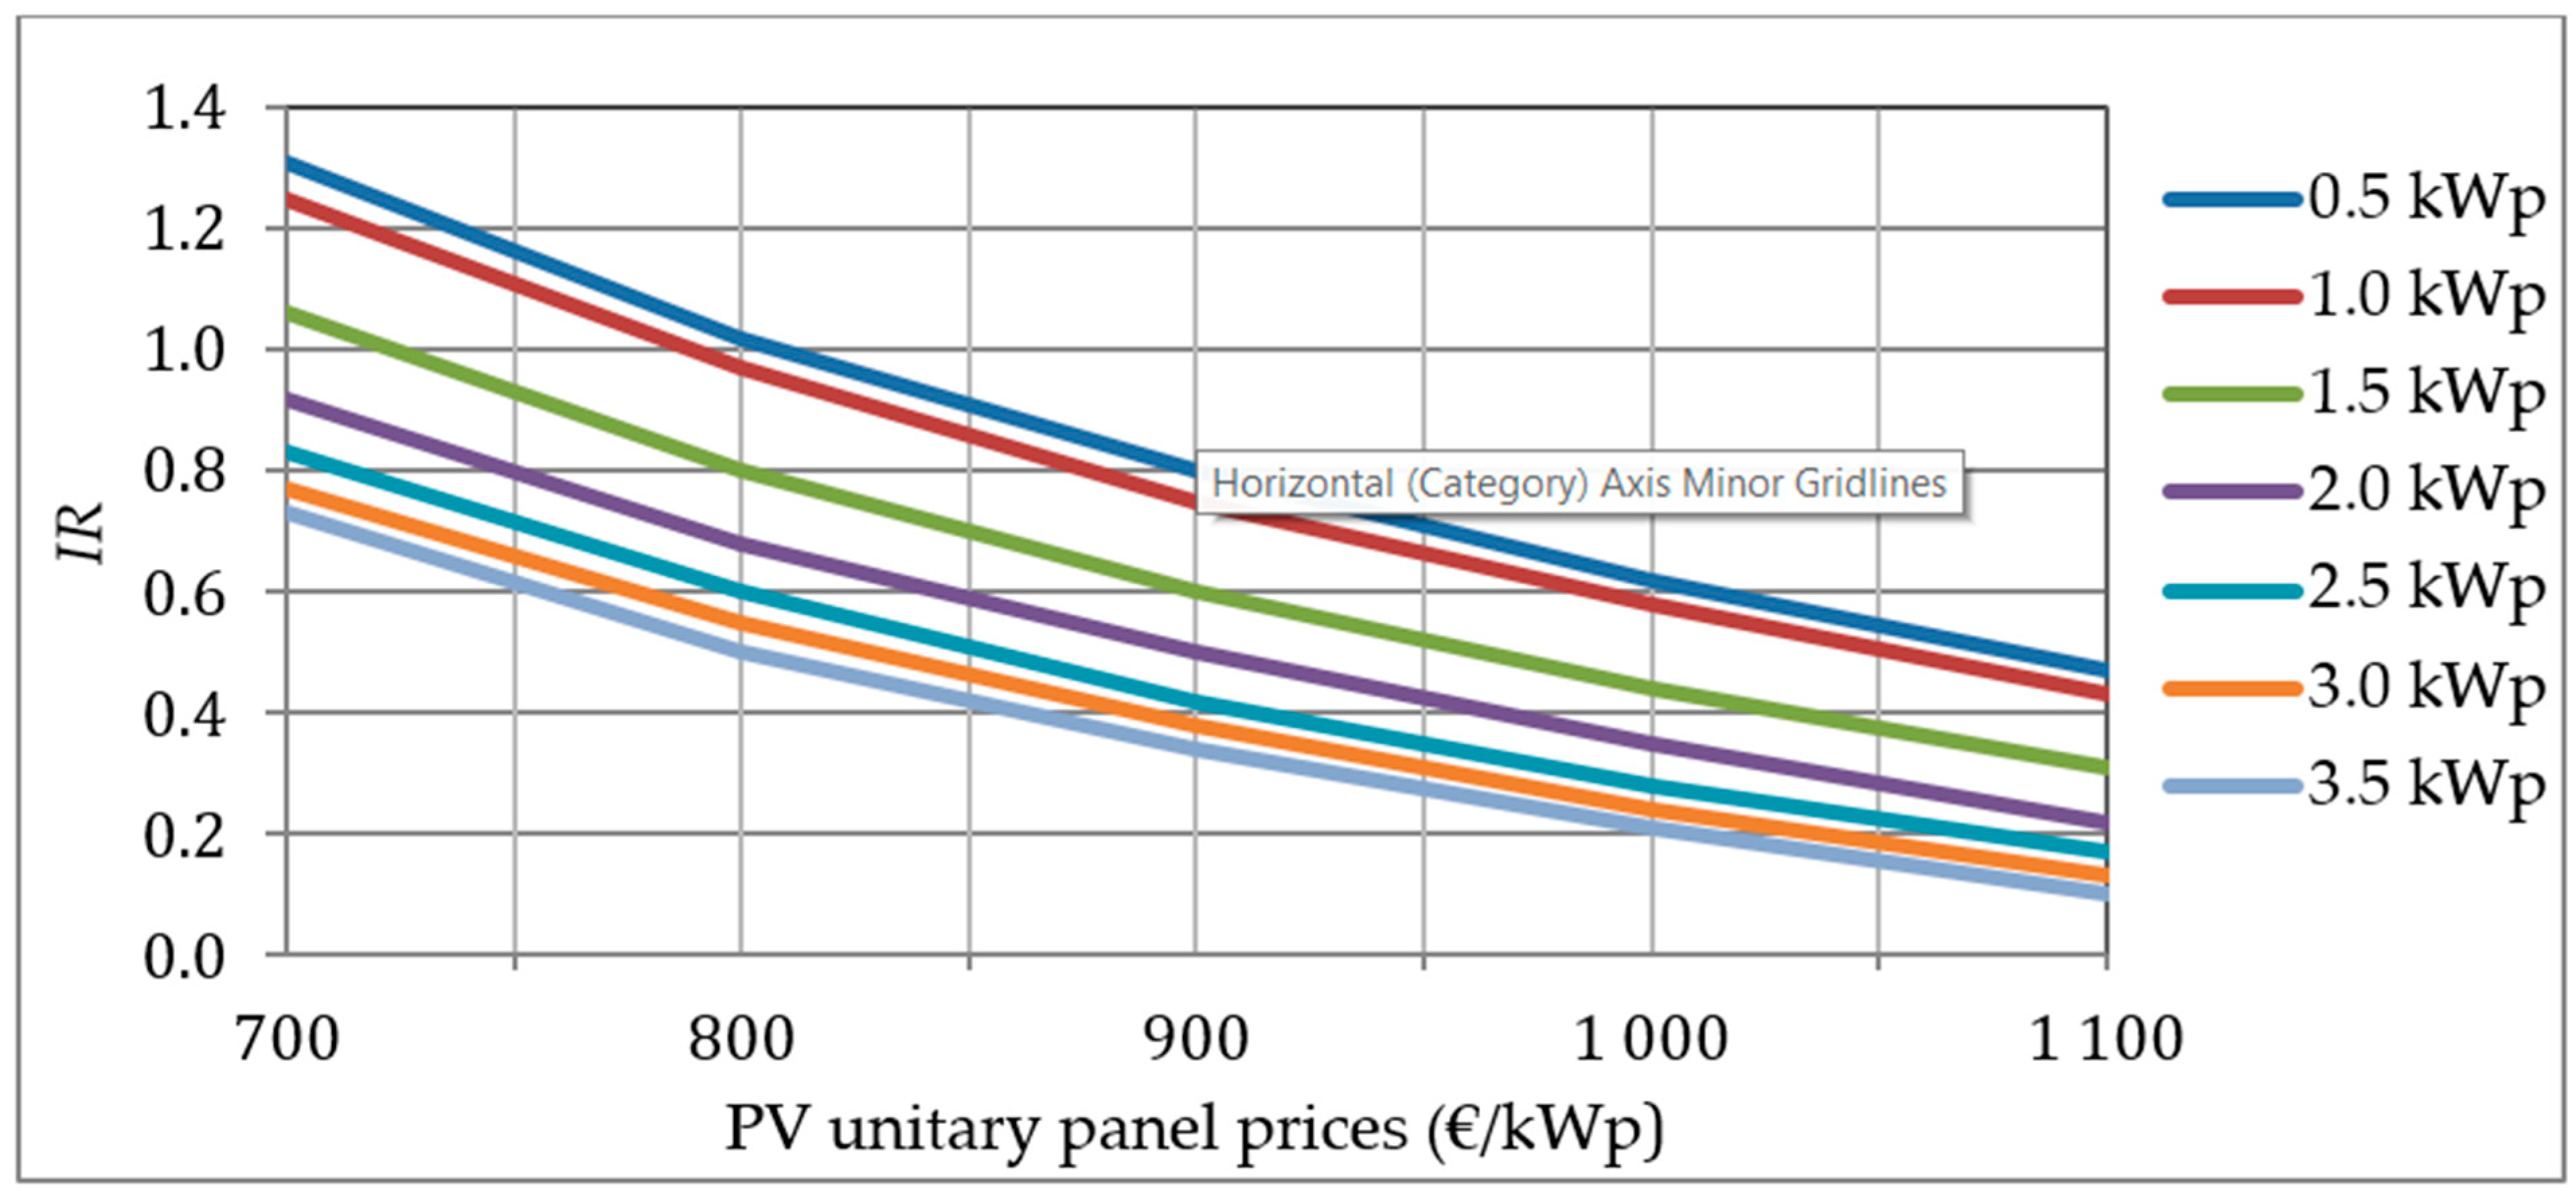
The investment performed ( I 0 ,   I 12 ) is one of the key elements of the financial optimisation; for this reason, an analysis based on different PV panel unitary prices ( C u P V ) has been performed in order to figure out the effect of that price on the economic assessment. Figure 13 shows the results of the IR indicator with different PV panel unitary prices ( C u P V ) and for each PV peak power considered.
As observed in Figure 10 for the case of 900 €/kWp panel cost, Figure 13 shows that, for any panel cost considered, the optimal size of the facility is the smallest one (0.5 kWp). Furthermore, as would be expected, given a panel peak power, it can be observed that the financial indicator improves as the unitary cost of the panel is assumed to be lower—we would be obtaining the same cash flows with a lower investment. For instance, there is nearly a linear relation between the IR and the unitary cost of the panel independently of the peak power of it. A fall of 100 €/kWp in the unitary price of the PV panel ( C u P V ) would cause an increase of the IR index of approximately 0.2.
Finally, we wonder if a higher demand (D) can make profitable the installation of a higher power facility, as this can cover more energy demanded by the domestic household and therefore increase the savings on the bill (S). Figure 14 represents the IR indicator for different PV peak powers and levels of residential power demand.
In this simulation, the 0.5 kWp facility again shows the best IR ratio; however, notice that this ratio does not change with the power demand, as the total PV energy produced is used for self-consumption at all residential demand levels. For values of 2.5 kWp or higher, the IR ratios are nearly straight lines with a slope of 0.1 per 1 500 kWh of residential demand. Taking into account that higher levels of demand (D) imply greater self-consumption and therefore greater savings (and fewer possibilities of selling energy to the market), these positive slopes would indicate that a scenario of high demand, where the main source of cash-flow is given by savings, is more profitable than a scenario of low demand, where the incomes from selling off the surplus energy have a greater weight.

3.2. Household PV Panels with Storage

In this scenario, the PV panels are connected to a BESS where the part of the energy produced (and not consumed) is stored ( E B L > 0 ) during off-peak hours if the battery is partially charged, B B L < P B (Equation (1)). The advantage of the use of the BESS is that the surplus energy ( E E X ) is not immediately sold as in the first configuration but can be stored for further self-consumption, making the savings greater than in a non-storage scenario, or sold to the market when the energy tariff is more expensive. As we saw in Section 2.1, when the BESS is fully charged ( E B L = P B ), the surplus energy is sold to the market regardless of the time of day (peak or off-peak hour).
BESS units with different capacities are simulated in this section (from 0.5 kWh to 3.0 kWh) for a residential consumption of D = 3500 kWh and a unitary panel cost of 900 €/kWp. Sales (IC) and savings (S) are discounted to determine the NPV, IRR and IR indicators for each configuration. Figure 15 depicts the NPV values; an almost linear positive relationship can be observed between the NPV and the BESS capacity ( P B ) for any given value of PV peak power ( P P V ). Moreover, the NPV grows with the power of the PV panels. Both technical attributes, P B and P P V , allow an increase in savings (a greater amount of energy demand is covered with the facility, E F ) and sales (a greater amount of energy is sold to the market, E S ). However, it is assumed that the user has limited economic resources to invest in the facility so that it is necessary to find the optimal configuration concerning the IRR and IR indicators.
Figure 16 shows the IRR values regarding the PV panel peak power ( P P V ) and BESS capacity ( P B ). The IRR tends to decrease with the peak power of the PV panel and to increase with the capacity of the battery, although the latter happens only up to a certain level of BESS capacity that oscillates between 2.0 and 2.5 kWh. The exception to this behaviour is observed in the panel of the lowest peak power (0.5 kWp), whose IRR rate tends to fall with the size of the battery; it seems that when the panel is too small there is no point in investing in a battery which is too large, given the limited capacity of the panel to generate savings and sales. We can conclude that, in optimal terms, both sizes (panel and battery) have to be consistent; we should not combine a very small panel with a very large battery, nor a very large panel with a very small battery. For instance, in our case, the optimal configuration is reached for a 1.0 kWp PV panel and a BESS of 2.0 kWh, which generates an IRR of 14.4%.
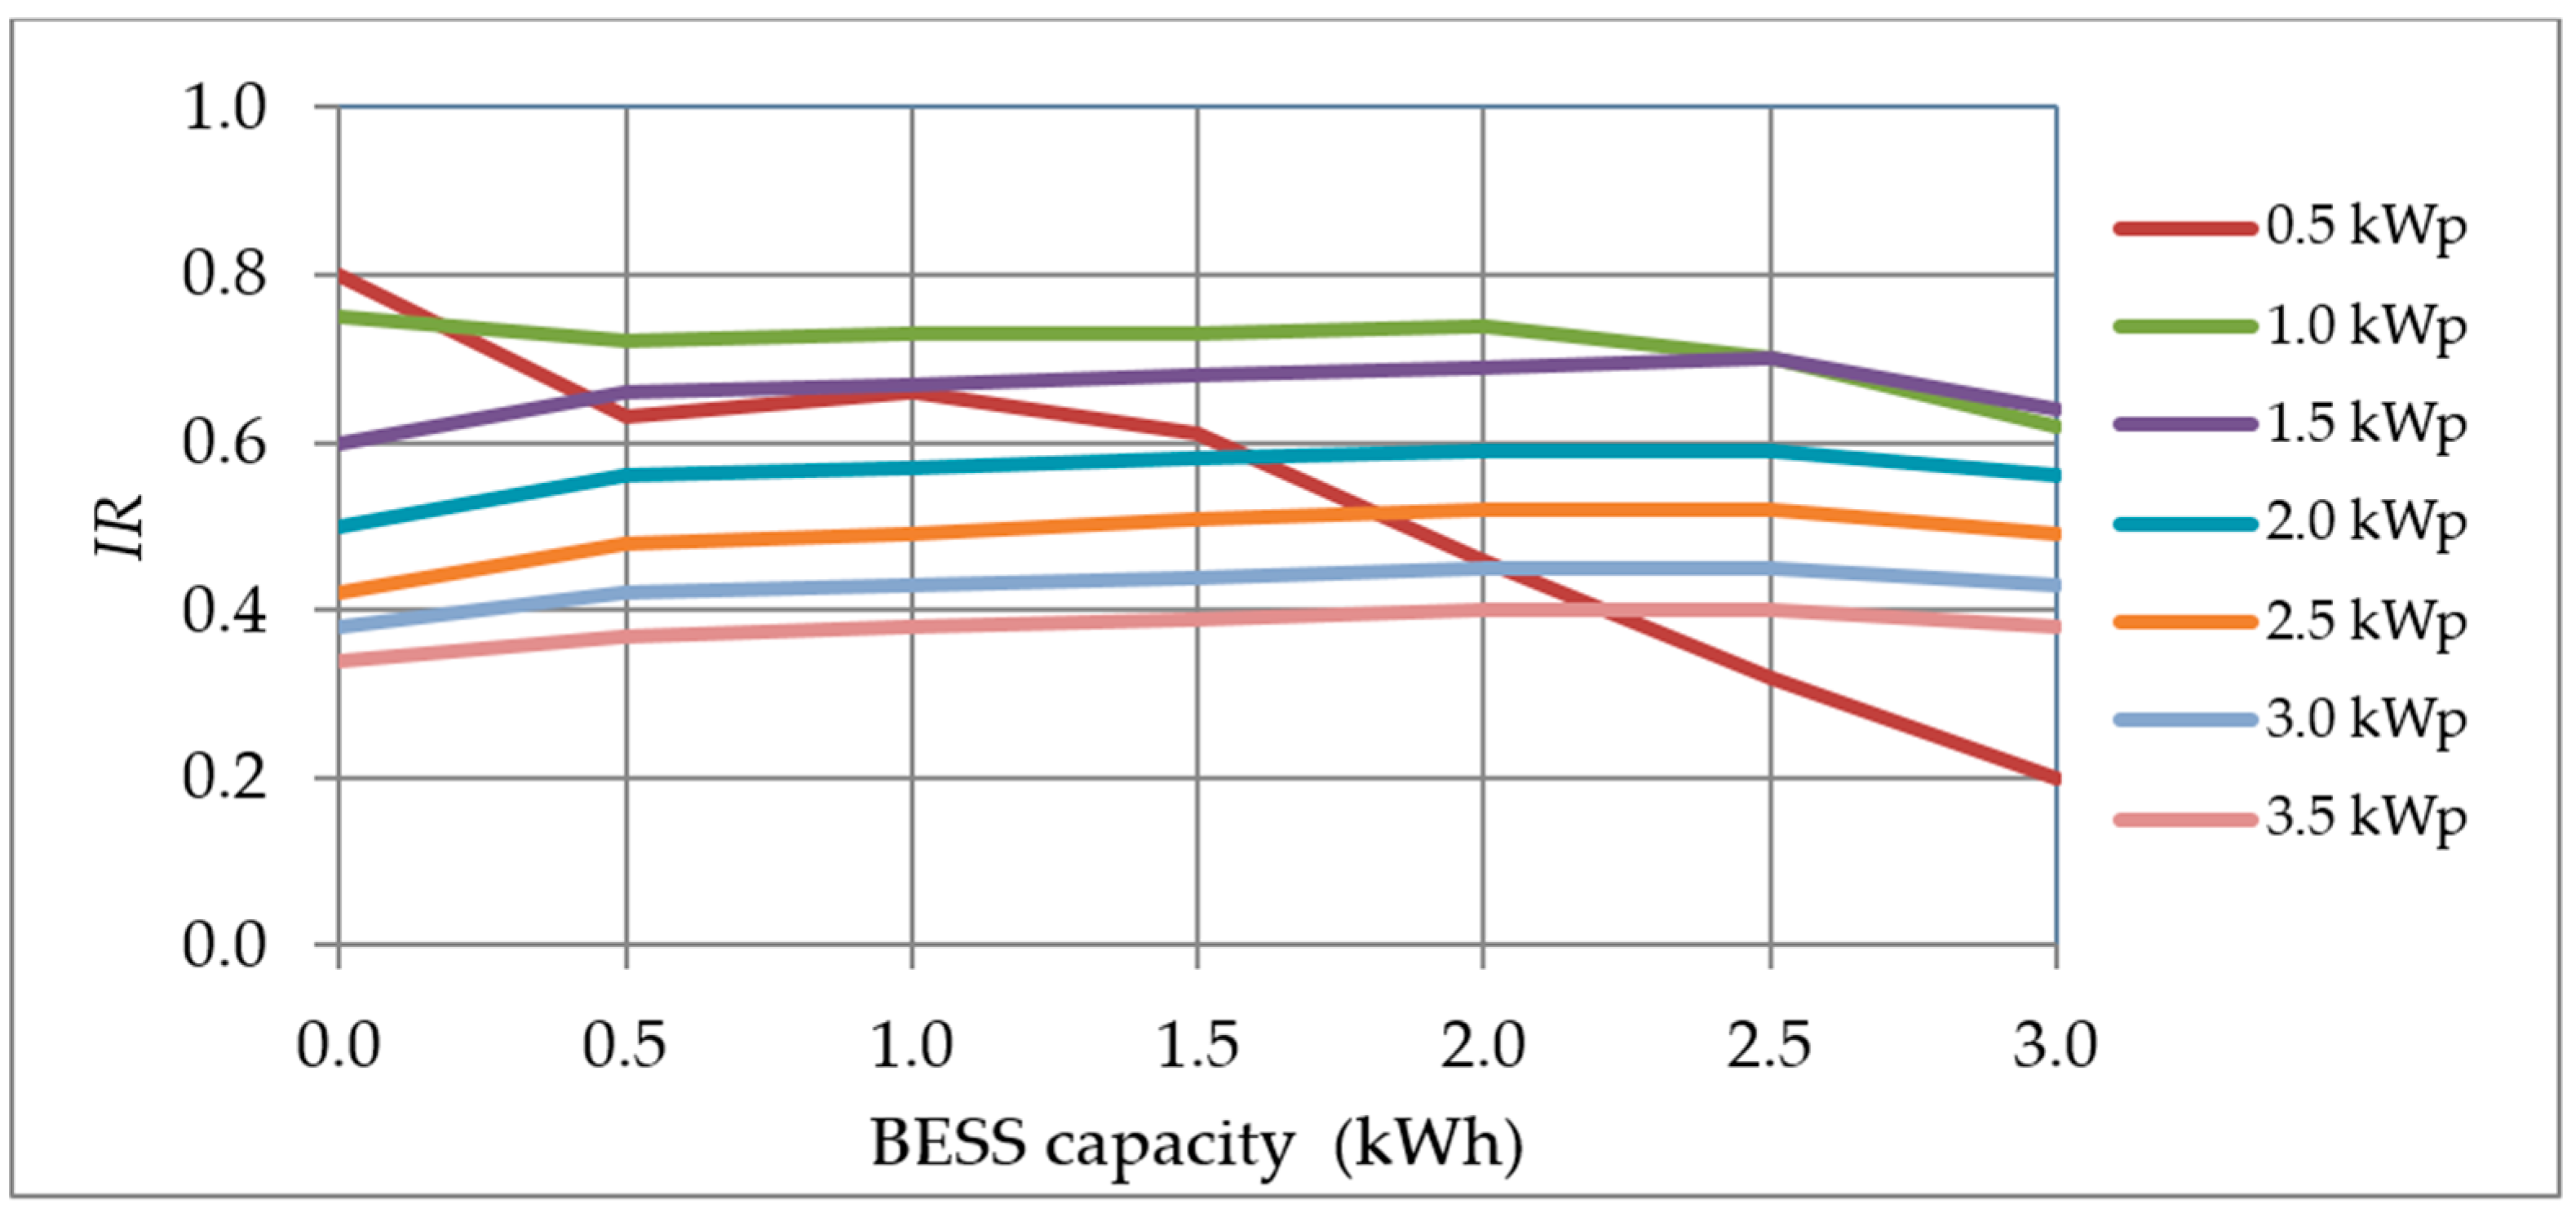
Figure 17 shows the IR indicator for different configurations of PV panel peak power ( P P V ) and battery capacity ( P B ). For a battery capacity greater than zero, the 1.0 kWp PV panel with a BESS capacity from 0.5 to 2.0 kWh presents the highest IR values, which move in a range between 0.72 and 0.74. The facility with a 1.0 kWp PV panel and a 2.0 kWh capacity is the optimal configuration for a residential demand (D) of 3500 kWh and a unitary panel cost of 900 €/kWp; this is because it obtains the maximum IR (0.74) and IRR (14.4%) indicators and an NPV (812.14 €) which is relatively high within 1.0 kWp panels. In any case, for those panels greater than 0.5 kWp, the IR indicator behaves roughly flatly when presented, depending on the battery size (at least up to a size of 2.5 kWh); that is because the greater savings and NPV that a larger battery allows is offset by the greater investment required.
The unitary cost of panels ( C u P V ) and BESS ( C u B ) has fallen during recent years causing a reduction in the investment considered in our study ( I 0 ,   I 12 ) and, therefore, an increase in the financial indicators. On the other hand, a higher residential demand (D) could require a greater BESS capacity or PV panel peak power in the optimal configuration, so that the energy consumed directly from the facility ( E F ) would increase, expanding both savings and cash flows. For this reason, an analysis is performed varying the unitary costs of the PV panel ( C u P V ) and BESS ( C u B ), and the residential demand (D) in order to find the most suitable configuration in each of the cases. For this analysis, we take the optimal panel of 1.0 kWp, a battery cost of 100 €/kWh (This quantity comes from real offers made by local contractors, and includes both the battery, as well as the structures, wiring, control and measurement systems, …), and a demand (D) of 3500 kWh. Table 6 shows the financial indicators for the optimal BESS capacity ( P B ) to be used at different panel unitary prices ( C u P V ) from 700 €/kWp to 1200 €/kWp.
We find that an increase in the unitary cost of the panel ( C u P V ) affects the optimal BESS capacity ( P B ) to be installed depending on the financial indicator considered. According to the NPV criterion, the optimal BESS capacity is of 2.0 kWh independently of the unitary cost of the panel ( C u P V ), while this one needs to be lower for cheaper unitary cost if IR or IRR criteria are used. We also observe that as the unitary cost of panels increases all the indicators tend to decrease due to the higher investment; note that the cash flows generated by the facility do not depend on the cost of the panel but on its peak power (Equations (6)–(8)), which remains fixed at 1.0 kWp in Table 6. When the panel unitary cost falls below the reference value (900 €/kWh), the optimal BESS capacity begins to depend on the financial indicator used. If we follow the NPV criterion, the 2.0 kWh BESS capacity is the optimal one, but if the IRR or IR indicators are used, the optimal BESS capacity ( P B ) is progressively reduced till the value of 0.5 kWh for a unitary panel cost of 700 €/kWp. In this case, the reduction in the investment (due to a cheaper panel and lower BESS capacity) is higher (in absolute value) than that of the cash flows; the cash-flow reduction being due to operating with a smaller battery.
In the same way, the unitary BESS cost ( C u B ) affects the financial indicators as the investment in the facility varies both in the initial year and in the year of replacement of the battery (year 12). It is important to note that, in practice, the cost of the BESS has fallen during the last few years due to technical and production developments. Table 7 represents the optimal BESS capacity for different unitary costs ( C u B ) for a demand (D) of 3500 kWh and a 1.0 kWp PV panel at the current cost price of 900 €/kWp ( C u P V ).
The fall in the BESS unitary cost ( C u B ) involves an increase in all the financial indicators and the installation of a BESS with higher capacity due to the lower investment required. The reduction in the BESS unitary cost price allows the installation of higher BESS capacity, which improves the cash flows (CF) through the increase of the saving (S) of the energy directly consumed from BESS ( E C B , Equation (3)) and therefore reaches higher financial indexes.
When the NPV criterion is used, we observe that the BESS unitary price ( C u B ) needs to fall to 90 €/kWh to change from the 2.0 kWh BESS capacity (current optimal configuration) to the one of 2.5 kWh—this size (2.5 kWh) represents the optimal BESS capacity within the range of 50 to 100 €/kWh. The IR and IRR criteria need the unitary price ( C u B ) to be 50 €/kWh to switch from the current optimal BESS capacity (2.0 kWh) to the one of 2.5 kWh.
Finally, an analysis of the optimal configuration of PV panel peak power ( P P V ) and BESS capacity ( P B ), at their current unitary cost prices ( C u P V = 900 €/kWp, C u B = 100 €/kWh), has been carried out for different residential demands (D). Table 8 reveals that as long as the demand (D) increases, the peak power of panels ( P P V ) and the capacity of the BESS ( P B ) need to be increased as well, thus improving all the financial indicators. In this situation, the cash flow generated by the savings (S) and energy sold to the market ( E S ) associated with a higher residential demand covers the increase in the investment for the acquisition of higher PV panel power and BESS capacity (I).
Note that an increase in residential demand implies an increase in the consumption of energy from the facility ( E F ). For this to be possible, the BESS capacity ( P B ) or the peak power of the panels ( P P V ) needs to be higher according to Equation (3). If the NPV criterion is used, the PV panel peak power needs to be as high as possible (3.5 kWp), as there is a positive relationship with energy production ( E P V ) and, therefore, with the cash-flows through savings and sales. At the same time, the consumption from the grid ( E P ) is also reduced to satisfy residential demand when the panel is larger. The BESS capacity gradually increases with the demand (D) from 1.5 kWh to the highest value of 5.0 kWh when demand reaches 8000 kWh.
According to the IR and IRR criteria, the peak power of the panel ( P P V ) and the BESS capacity ( P B ) increase gradually with residential demand (D), but in this case, the values obtained for panel and BESS sizes are lower than those obtained with the NPV criterion. Note also that the IRR index is in the range (13.57%, 14.01%), while the IR is always above 0.69 with no significant changes from a residential demand of 5000 kWh and above, varying from 0.84 to 0.86. This is because the NPV generated with higher devices has approximately the same increase in its own acquisition cost. It should also be highlighted that an increase of 1500 kWh in demand involves an increase of 0.5 kWp in the panel size and 1.0 kWh in the BESS capacity.

4. Discussion

The current situation of energy policies in Spain and the improved performance achieved by PV facilities combined with BESS units make economic research necessary in order to determine whether they are profitable for domestic self-consumption. Considering a standard residential household located in Seville City, the research conducted reveals that the facility of PV panels without BESS obtains a maximum investment return (IR) of around 0.8 (being the IRR 14.4%) with low peak power PV panels ( P P V ) (not higher than 1.0 kWp). The acquisition investment of more powerful panels is not compensated by the cash flows received by both the energy sold to the market and the monetary savings from the energy self-consumption. In the case that the unitary panel cost ( C u P V ) falls below 900 €/kWp, the 0.5 kWp panels also obtain the best IR and IRR for each unitary PV cost price. We observed a linear dependency of the IR with the unitary cost price of the 1.0 kWp panel, and in the case that the unitary cost price ( C u P V ) falls from 900 €/kWp to 700 €/kWp, the IR increases from 0.8 to 1.3. Only when the user demand (D) is increased, the use of more powerful PV panels ( P P V ) is recommended, as the cash flows generated are higher and cover the increase in the investment. In this way, a facility can gradually increase the peak power of the panels, as long as the residential demand is increased as well.
The use of BESS is feasible in order to store the surplus energy produced in the off-peak hours by the panels and, therefore, to increase the savings because of the energy consumed from the BESS. The analysis indicates that a 2.0 kWh BESS with a 1.0 kWp PV panel is the optimal configuration for a 3500 kWh residential demand (D), reaching 0.78 of IR and 14.43% of IRR under the current unitary prices of PV panels ( C u P V = 900 €/kWp) and BESS ( C u B = 100 €/kWh). In this case, it is also shown that the cash flows obtained by the use of more powerful panels and BESS units do not compensate for the increase in the required investment for the given demand (3500 kWh).
Attending to the IR and IRR criteria, the cost analysis conducted reveals that the optimal BESS capacity ( P B ) needs to be decreased when the unitary cost of the 1.0 kWp PV panels ( C u P V ) decreases as well (ceteris paribus) because the cash flow generated by savings and sales do not compensate for the investment in a BESS with higher capacity. In the case that the unitary cost of the 1.0 kWp PV panel falls 22% from the current price (from 900 €/kWp to 700 €/kWp), the IR is increased by approximately 100% since it goes from 0.8 to 1.17. The fall in the unitary cost of the BESS ( C u B ) from 100 €/kWh to 50 €/kWh (–50%) requires an increase in the optimal BESS capacity from 2.0 kWh to 2.5 kWh, which increases the IR index by about 25%. Given the current unitary costs of the devices ( C u P V =   900 €/kWp and C u B = 100 €/kWh), we also observe a positive linear dependency of the PV peak power and the BESS capacity with respect to the residential demand. In this way, if the residential demand (D) is increased in 1500 kWh, the PV peak power ( P P V ) needs to be increased in 0.5 kWp and the BESS capacity ( P B ) in 1.0 kWh.

5. Conclusions

The model presented in this paper uses data from user smart meters and a defined location of a PV facility in order to find the optimal configuration of the BESS equipment and the PV panels in a domestic environment. With the current unitary cost prices of BESS and PV panels, a facility without a BESS (the first scenario analysed) located in Seville City (Southern Spain) needs to install a 0.5 kWp PV panel to obtain the best IRR index (14.0%) and return of investments (IR = 0.8), having also an NPV of 358 €. On the other hand, the facility with BESS (the second scenario analysed) needs to install a 1.0 kWp PV panel with a 2.0 kWh BESS to reach the optimal configuration, obtaining an IRR of 14.43%, an IR of 0.78, and an NPV of 812.54 €.
The technology improvements in BESS and PV panels during the last few years makes them less and less expensive. For an optimal facility with BESS, the conclusion is that the elasticity of the IRR index to the current PV price is −1.59; that elasticity being −2.18 for the IR indicator. In the case of the current BESS price, the battery cost elasticity of the financial indicators has been determined in −0.28 and −0.54 for the IRR and IR indicators respectively. In both cases, as long as the unitary prices fall, the facility allows the installation of higher power PV panels and BESS.
Finally, we should highlight that this model is useful for users (prosumers), electrical installers, engineering consultants and also Governments, since it provides the formula (to be used at any facility location) to determine the optimal configuration (in financial terms) of PV panels and BESS capacity and, at the same time, measure the effect of changes in PV panels and BESS prices on the profitability of the facility. This tool contributes also to the sustainability of the electrical market and the stability of the grid, as less energy is produced and transported through the network.

Author Contributions

J.A.B.-G. was responsible for the introduction (literature review) and the data collection; F.N. was responsible for the method and modeling; A.A.-V. was responsible for the research design, economic discussion and conclusions. All authors have read and agreed to the published version of the manuscript.

Funding

This research received no external funding.

Institutional Review Board Statement

Not applicable.

Informed Consent Statement

Not applicable.

Data Availability Statement

Data sharing is not applicable to this article.

Acknowledgments

The authors would like to thank the former master’s degree student Juan Felipe Hinestroza.

Conflicts of Interest

The authors declare no conflict of interest.

Nomenclature

BESSBattery Energy Storage Systems
BoSBalance of Systems
EPCEngineering Procurement and Construction
EUEuropean Union
HDTHourly Discrimination Tariff
IRENAInternational Renewable Energy Agency
LCOELevelized Cost Energy
Li-ionLithium-Ion
OMIEIberian Electricity Market Operator
PVPhotovoltaic
PVGISPhotovoltaic Geographical Information System
ROIReturn On Investment
VATValue Added Tax
Variables
ATAccess tariffs (€/kWh)
C B Cost of the battery (€)
CFCash Flow (€)
CoPContrated power (kW)
C P V Cost of the PV panels (€)
C u B Unitary cost of the battery (€/kWh)
C u P V Unitary cost of the PV panels (€/kWh)
DAnnual demand of the household (kWh)
E B L Energy level of the battery (kWh)
E C B Energy supplied by the battery (kWh)
E C P V Energy supplied by the PV panels and directly consumed by the household(kWh)
E C H Energy from PV panels used to charge the battery (kWh)
e D Energy demand mean (kWh)
E D Energy demanded by the household (kWh)
E E X Surplus energy generated by the PV panels over the household demand (kWh)
E F Total energy consumed from facility (kWh)
e G Energy generation mean (kWh)
E P Energy purchased in the market (kWh)
E P V Total energy generated by the PV panels (kWh)
E S Energy sold and injected into the market (kWh)
IInvestment (€)
ICIncomes from the energy sale (€)
IRInvestment return (%)
IRRInternal rate of return
kInterest rate (%)
NNormal Distribution
NPVNet present value (€)
P B Capacity of the battery (kWh)
PEPrice of energy (€/kWh)
PPPrice of the contrated power (€/kWh x year)
P P V Power of PV panel (kWp)
SSaving in the energy consumption (€)
tYear of the project (year)
u G Error term of the energy generation (kWh)
v D Error term of the energy demand (kWh)
ηRound trip efficiency of the battery (%)
σuStandard deviation of normal distribution

References

  1. European Parliament. Council of the EU Directive (EU) 2019/944 on Common Rules for the Internal Market for Electricity and Amending Directive 2012/27/EU; European Parliament: Brussels, Belgium, 2019; Volume 944.
  2. Ministerio de Transición Ecológica. Royal Decree 244/2019; Ministerio de Transición Ecológica: Madrid, Spain, 2019.
  3. Arcos, A. Un nuevo modelo de mercado eléctrico europeo: The citizen is king. DYNA Ingenieria e Industria 2019, 94, 590–591. [Google Scholar] [CrossRef]
  4. Dusonchet, L.; Telaretti, E. Economic analysis of different supporting policies for the production of electrical energy by solar photovoltaics in Western European Union countries. Energy Policy 2010, 38, 3297–3308. [Google Scholar] [CrossRef]
  5. Campoccia, A.; Dusonchet, L.; Telaretti, E.; Zizzo, G. An analysis of feed-in tariffs for solar PV in six representative countries of the European Union. Sol. Energy 2014, 107, 530–542. [Google Scholar] [CrossRef]
  6. Del Rio, P.; Mir, P. Support for solar PV deployment in Spain: Some policy lessons. Renew. Sustain. Energy Rev. 2012, 16, 5557–5566. [Google Scholar] [CrossRef]
  7. Bayod, A.; Burgio, A.; Leonowicz, Z.; Mennit, D.; Pinnarelli, A.; Sorrentino, N. Recent developments of photovoltaics integrated with battery storage systems and related feed-in tariff policies: A review. Int. J. Photoenergy 2017, 2017. [Google Scholar] [CrossRef]
  8. Del Coso, G.; Del Canizo, C.; Sinke, W.C. The impact of silicon feedstock on the PV module cost. Sol. Energy Mater. Sol. Cells 2010, 94, 345–349. [Google Scholar] [CrossRef] [Green Version]
  9. Chen, K. Technology improves solar PV competitiveness. Electr. Light Power 2011, 89, 48. [Google Scholar]
  10. Zhu, D.; Wang, Y.; Yue, S.; Xie, Q.; Pedram, M.; Chang, N. Maximizing return on investment of a grid-connected hybrid electrical energy storage system. In Proceedings of the 18th Asia and South Pacific Design Automation Conference (IEEE), Yokohama, Japan, 22–25 January 2013; pp. 638–643. [Google Scholar] [CrossRef]
  11. Zhang, H.; Van Gerven, T.; Baeyens, J.; Degrève, J. Photovoltaics: Reviewing the European feed-in-tariffs and changing PV efficiencies and costs. Sci. World J. 2014, 2014. [Google Scholar] [CrossRef]
  12. Ghiassi-Farrokhfal, Y.; Kazhamiaka, F.; Rosenberg, C.; Keshav, S. Optimal design of solar PV farms with storage. IEEE Trans. Sustain. Energy 2015, 6, 1586–1593. [Google Scholar] [CrossRef]
  13. Lorenzi, G.; Santos, C. Comparing demand response and battery storage to optimize self-consumption in PV systems. Appl. Energy 2016, 180, 524–535. [Google Scholar] [CrossRef]
  14. Mondol, J.; Hillebrand, S. Grid parity analysis of solar photovoltaic systems in Europe. Int. J. Ambient Energy 2014, 35, 200–210. [Google Scholar] [CrossRef]
  15. Chiacchio, F.; D’urso, D.; Aizpurua, J.; Campagno, L. Performance assessment of domestic photovoltaic power plant with a storage system. IFAC PapersOnLine 2018, 51, 746–751. [Google Scholar] [CrossRef]
  16. Chiacchio, F.; Famoso, F.; D’urso, D.; Cdola, L. Performance and economic assessment of a grid-connected photovoltaic power plant with a storage system: A comparison between the North and the South of Italy. Energies 2019, 12, 2356. [Google Scholar] [CrossRef] [Green Version]
  17. Shin, H.; Geem, Z.W. Optimal design of a residential photovoltaic renewable system in South Korea. Appl. Sci. 2019, 9, 1138. [Google Scholar] [CrossRef] [Green Version]
  18. Zhu, D.; Wang, Y.; Chang, N.; Pedram, M. Optimal design and management of a smart residential PV and energy storage system. In Proceedings of the Design, Automation, Test in Europe Conference and Exhibition (IEEE), Dresden, Germany, 24–28 March 2014; pp. 1–6. [Google Scholar] [CrossRef]
  19. Talavera, D.; Muñoz, E.; Ferrer, J.; Nofuentes, G. Evolution of the cost and economic profitability of grid-connected PV investments in Spain: Long-term review according to the different regulatory frameworks approved. Renew. Sustain. Energy Rev. 2016, 66, 233–247. [Google Scholar] [CrossRef]
  20. Colmenar, A.; Campíñez, S.; Pérez, C.; Castro, M. Profitability analysis of grid-connected photovoltaic facilities for household electricity self-sufficiency. Energy Policy 2012, 51, 749–764. [Google Scholar] [CrossRef]
  21. Bernal, J.; Dufo, R. Economical and environmental analysis of grid connected photovoltaic systems in Spain. Renew. Energy 2006, 31, 1107–1128. [Google Scholar] [CrossRef]
  22. Lopez, J.; Steinenger, K. Photovoltaic self-consumption regulation in Spain: Profitability analysis and alternative regulation schemes. Energy Policy 2017, 108, 742–754. [Google Scholar] [CrossRef]
  23. Rosales, E.; Simon, M.; Borge, B.; Perez, A.; Colmenar, A. An expert judgement approach to determine measures to remove institutional barriers and economic non-market failures that restrict photovoltaic self-consumption deployment in Spain. Sol. Energy 2019, 180, 307–323. [Google Scholar] [CrossRef]
  24. Sarasa, C.; Dufo, R.; Bernal, J. Evaluating the effect of financing costs on PV grid parity by applying a probabilistic methodology. Appl. Sci. 2019, 9, 425. [Google Scholar] [CrossRef] [Green Version]
  25. Hinestroza, J. Autoconsumo residencial: Análisis de rentabilidad y tamaño óptimo. In Trabajo Final de Carrera; Universidad de Sevilla (US): Seville, Spain, 2019. [Google Scholar]
  26. Arcos, Á.; Cansino, J.; Román, R. Economic and environmental analysis of a residential PV system: A profitable contribution to the Paris agreement. Renew. Sustain. Energy Rev. 2018, 94, 1024–1035. [Google Scholar] [CrossRef]
  27. Zhang, Z. Smart grid in America and Europe. Public Util. Fortn. 2011, 149, 32–40. [Google Scholar]
  28. Arcos, A.; Lugo, D.; Núñez, F. Residential peak management: A storage and control system application taking advantages of smart meters. Energy Syst. 2018, 102, 110–121. [Google Scholar] [CrossRef]
  29. OMIE, Iberian Electricity Market Operator. Available online: https://www.omie.es/es/market-results/daily/daily-market/daily-hourly-price (accessed on 23 July 2020).
  30. Carbonero, A. Efecto sobre el bienestar económico de un aumento en la potencia instalada fotovoltaica. Una aplicación al sistema eléctrico español. In Trabajo final de Carrera; Universidad de Sevilla (US): Seville, Spain, 2018. [Google Scholar]
  31. Jäger-Waldau, A. PV Status Report 2019, EUR 29938 EN; Publications Office of the European Union: Luxembourg, 2019. [Google Scholar] [CrossRef]
  32. Keiner, D.; Manish, R.; Barbosa, L.; Bogdanov, D.; Breyer, C. Cost optimal self-consumption of PV prosumers with stationary batteries, heat pumps, thermal energy storage and electric vehicles across the world up to 2050. Sol. Energy 2019, 185, 406–423. [Google Scholar] [CrossRef]
  33. Ram, M.; Bogdanov, D.; Aghahosseini, A.; Oyewo, S.; Gulagi, A.; Child, M.; Breyer, C.; Caldera, U.; Sadovskaia, K.; Farfan, J.; et al. Global Energy System Based on 100% Renewable Energy—Power, Heat, Transport and Desalination Sectors; Study by Lappeenranta University of Technology and Energy Watch Group: Lappeenranta, Finland; Berlin, Germany, 2019. [Google Scholar]
  34. European Commission, Joint Research Centre. Photovoltaic Geographical Information System—Interactive Maps. PVGIS. Available online: https://re.jrc.ec.europa.eu/pvg_tools/es/#PVP (accessed on 19 July 2020).
  35. Arcos, A.; Canca, D.; Núñez, F. Impact of battery technological progress on electricity arbitrage: An application to the Iberian market. Appl. Energy 2020, 260, 114273. [Google Scholar] [CrossRef]
  36. Gómez, A.; Sudria, A.; Alvarez, E.; Díaz, J.; Pérez, J.; Arcos, A.; Pérez de Vargas, J. El Almacenamiento de Energía en la Distribución Eléctrica del Future; Real Academia de la Ingeniería: Madrid, Spain, 2017. [Google Scholar]
  37. Segui, P. Todo Sobre Baterías y Almacenamiento de Energía. Available online: https://www.barriolapinada.es/baterias-almacenamiento-energia/ (accessed on 19 July 2020).
  38. Bardo, S. Almacenamiento distribuido en viviendas para alisar la curva de demanda de energía eléctrica. In Trabajo Final de Carrera; Universitat Politècnica de Catalunya (UPC): Barcelona, Spain, 2010. [Google Scholar]
  39. Hernández, A. Análisis económico de un sistema de almacenamiento para la disminución de desvíos de producción en un parque eólico. In Trabajo Final de Master; Escuela Técnica Superior de Ingeniería: Seville, Spain, 2016. [Google Scholar]
  40. Battery University. Learn About Batteries. Available online: https://batteryuniversity.com/learn/ (accessed on 19 July 2020).
  41. Jofemar Energy. Almacenamiento Electroquímico con Baterías de Flujo. Available online: http://www.f2e.es/uploads/doc/20160704075330.f2e_jofemar.pdf (accessed on 19 July 2020).
  42. Vélez, S. Estudio de un sistema de almacenamiento de energía eólica por medio de baterías. In Trabajo Final de Carrera; Universidad Politécnica de Madrid (UPM): Madrid, Spain, 2012. [Google Scholar]
  43. Clean Technica. Batteries Keep on Getting Cheaper. Available online: https://cleantechnica.com/2017/12/11/batteries-keep-getting-cheaper/ (accessed on 19 July 2020).
  44. IRENA. Accelerating the global energy transformation. In International Renewable Energy Agency; United Arab Emirates: Abu Dhabi, UAE, 2017. [Google Scholar]
  45. Comisión Nacional de los Mercados y la Competencia. Available online: https://www.cnmc.es/2018-11-02-la-cnmc-publica-la-metodologia-de-calculo-de-la-tasa-de-retribucion-financiera-de-las (accessed on 19 July 2020).
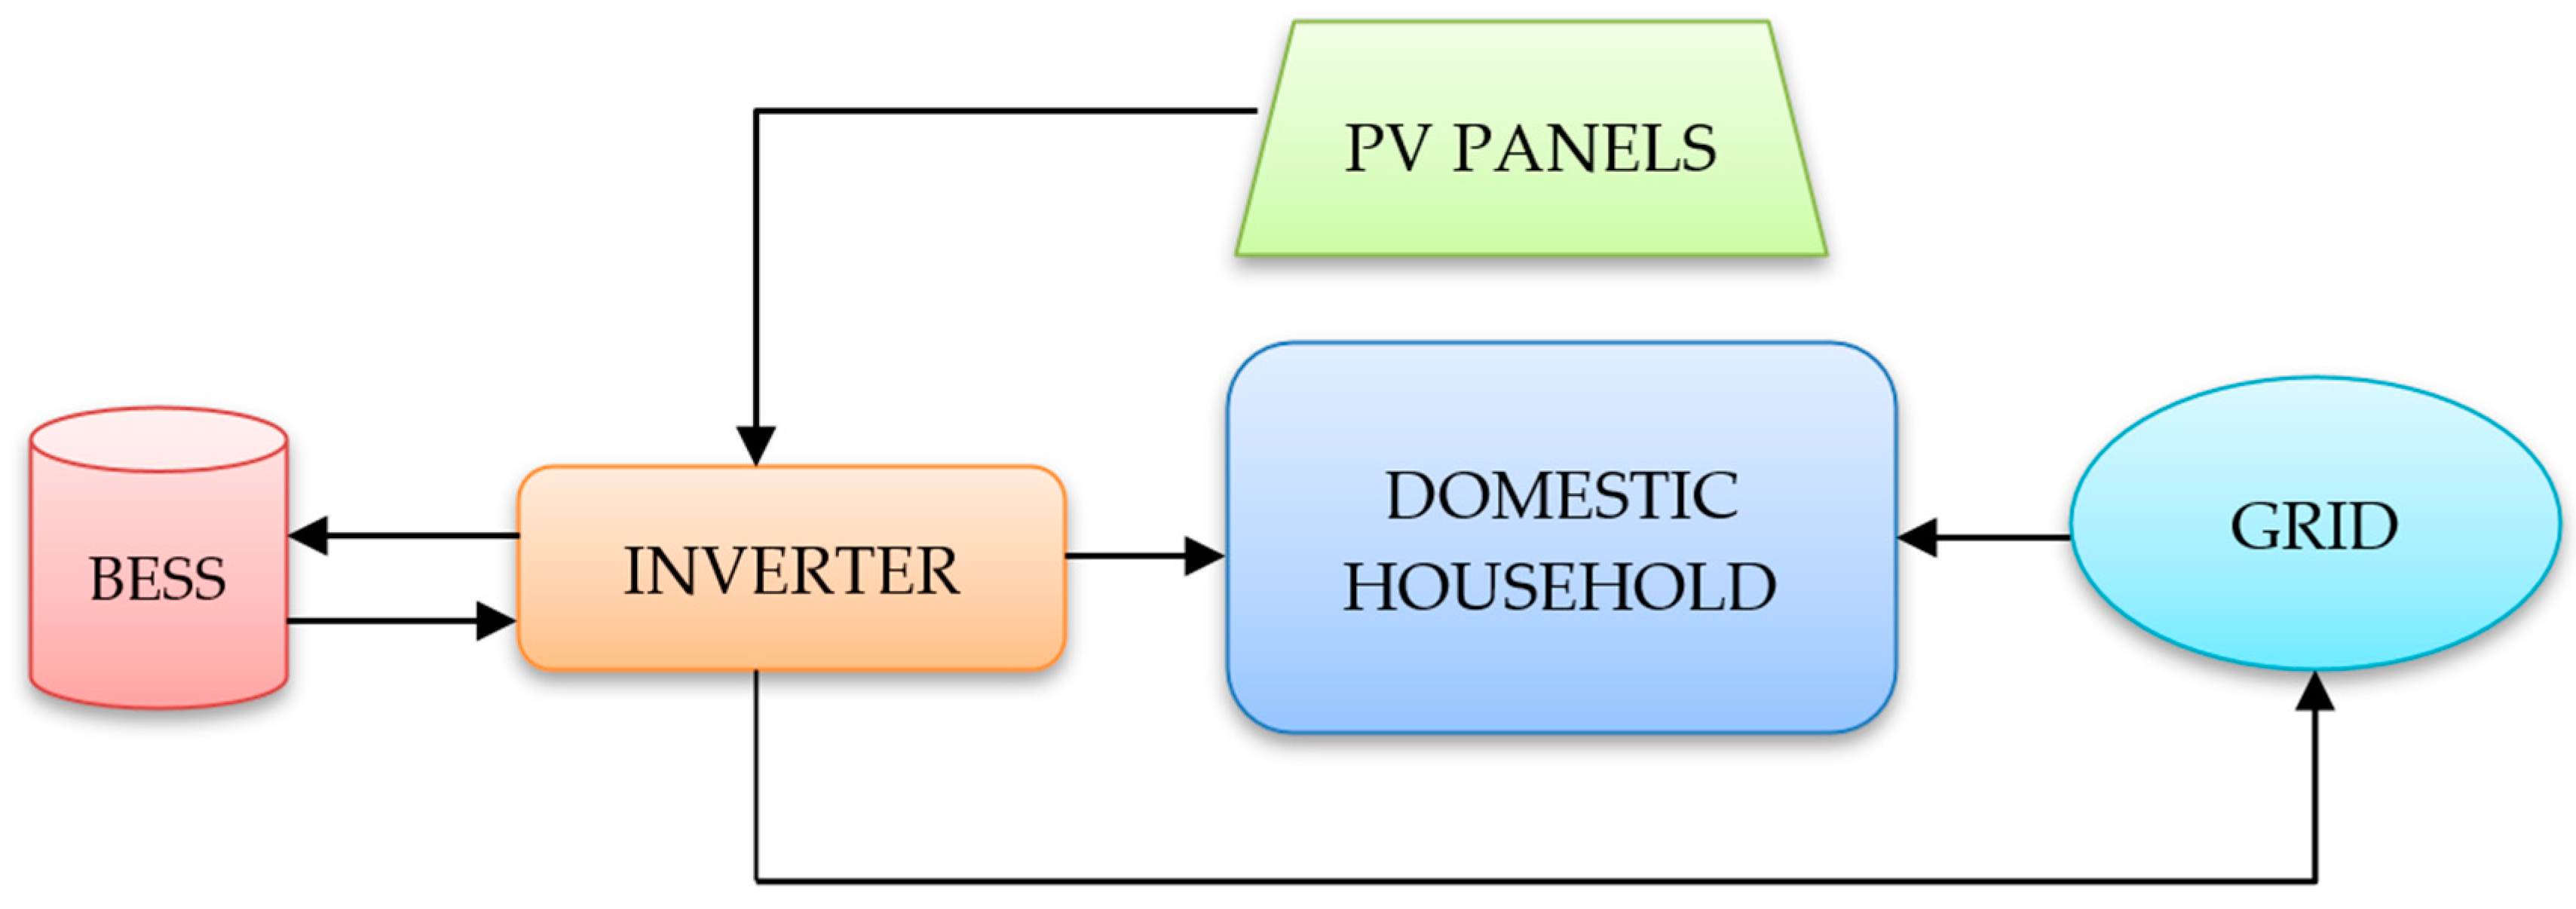
Figure 1. Facility configuration and energy flows. Source: own elaboration.
Sustainability 13 00575 g001
Figure 2. Hourly consumption from the grid ( E P ) along a day. Source: OMIE [29].
Sustainability 13 00575 g002
Figure 3. Total monthly energy consumption. Source: OMIE [29].
Sustainability 13 00575 g003
Figure 4. Demand and bid curves on 28 February 2019. Source: OMIE [29].
Sustainability 13 00575 g004
Figure 5. Average hourly market price during a month. Source: OMIE [29].
Sustainability 13 00575 g005
Figure 6. Energy generation ( E P V ) for different photovoltaic (PV) peak powers ( P P V ) at Seville City on 21 June. Source: Photovoltaic Geographical Information System (PVGIS) [34].
Sustainability 13 00575 g006
Figure 7. Hourly energy generation ( E P V ) for a 1.0 kWp PV panel located at Seville City on 1 March, June, September and December. Source: PVGIS [34].
Sustainability 13 00575 g007
Figure 8. Hourly residential demand ( E D ) and production ( E P V ) for a 1.0 kWp PV panel located at Seville City on 24 June 2018. Source: PVGIS [34].
Sustainability 13 00575 g008
Figure 9. Monthly energy demand and PV production at Seville City. Source: PVGIS [34].
Sustainability 13 00575 g009
Figure 10. Annual proportion of energy produced (D/ E P V ) used for self-consumption ( E F ). Source: own elaboration.
Sustainability 13 00575 g010
Figure 11. Evolution of Net Present Value (NPV) and Internal Rate of Return (IRR) with the PV panel peak power ( P P V ), without BESS. Source: own elaboration.
Sustainability 13 00575 g011
Figure 12. Evolution of Return of Investment (IR) with the PV panel peak power ( P P V ), without BESS. Source: own elaboration.
Sustainability 13 00575 g012
Figure 13. Investment returns (IR) with different unitary panel prices ( C u P V ). Source: own elaboration.
Sustainability 13 00575 g013
Figure 14. Investment returns (IR) and residential demand (D). Source: own elaboration.
Sustainability 13 00575 g014
Figure 15. NPV for domestic demand (D) of 3500 kWh. Source: own elaboration.
Sustainability 13 00575 g015
Figure 16. IRR for domestic demand (D) of 3500 kWh. Source: own elaboration.
Sustainability 13 00575 g016
Figure 17. IR for domestic demand (D) of 3500 kWh. Source: own elaboration.
Sustainability 13 00575 g017
Table 1. Operating model for the facility. Source: own elaboration.
ScenariosOperations
PV Generation > Domestic ConsumptionBESS fully charged(I) PV consumption + Sale to market
BESS partially chargedPeak hour
Off-peak hour(II) PV consumption + BESS charging *
* We move to (I) when charging is completed
PV Generation < Domestic Consumption(III) PV consumption +
BESS consumption (charged or partially charged) + Network consumption (if necessary)
PV Generation = Domestic Consumption(IV) PV consumption
Table 2. Fixed and variable tariffs for grid access. Source: own elaboration.
ItemValue
Annual demand of the household (D)(kWh)3500
Contracted Power (CoP) (kW)4.4
Yearly price of the contracted power (PP) (€/kW)38.04
Access tariff (AT) (€/kWh)WinterPeak (12:00–22:00)0.062012
WinterOff-peak (22:00–12:00)0.002215
SummerPeak (13:00–23:00)0.062012
SummerOff-peak (23:00–13:00)0.002215
Table 3. Main features of Li-Ion batteries. Source: [35,36,37,38,39,40,41,42,43,44].
ItemValue
Specific energy (Wh/kg)130–147
Energy density (Wh/L)250–730
Specific power (W/kg)250–340
Nominal voltage (V)3.6
Charge/discharge (cycles)5000
Monthly self-discharge (%)3.0%
Round-trip efficiency, η (%)92.0%
Unitary Cost, C u B (€/kWh)100
Shelf life (years)12
Table 4. Location and parameters for the PV panels. Source: PVGIS [34].
ItemValue
Location (Seville) (º):37.389–5.995 (Seville)
Database used:PVGIS-SARAH
PV technology:Crystalline silicon
PV installed (kWp):1.0
Surface (m2)5.0
Number of panels2
System efficiency (%):18
Slope angle (°):34
Azimuth angle (°):2
Yearly PV energy production (kWh):1599.92
Yearly in-plane irradiation (kWh/m2):2187.31
Table 5. Parameters for PV installation without battery energy storage systems (BESS) (Domestic demand 300 kWh).
P P V
(kWp)
I 0 (€) E P V
(kWh)
E C P V / E P V
(%)
I C
(€)
S
(€)
C F
(€)
NPV
(€)
IRR
(%)
IR
0.54507981006506535814.40.80
1.09001600881221013267614.00.75
1.513502390651384218080812.60.60
2.018003180511448022489311.60.50
2.5225039804214811926795610.90.42
3.027004770351511603111 01910.40.38
3.531505570311532003531 07710.10.34
Source: own elaboration.
Table 6. Optimal BESS capacity and financial parameters with different panel costs ( P P V = 1.0 kWp, D = 3500 kWh). Source: own elaboration.
NPV CriterionIRR and IR Criteria
Unitary PV Panel Cost (€/kWp)BESS Capacity (kWh)NPV (€)BESS
Capacity (kWh)
IRR
(%)
IR
7002.01 012.540.517.861.17
8002.0912.531.515.680.92
9002.0812.562.014.030.74
10002.0712.632.012.640.59
11002.0612.542.011.430.47
12002.0512.542.010.380.37
Table 7. Optimal BESS capacity for different unitary cost prices ( P P V = 1.0 kWp, D = 3500 kWh). Source: own elaboration.
NPV CriterionIRR and IR Criteria
BESS Unitary Cost (€/kWh)BESS Capacity (kWh)NPV (€)BESS
Capacity (kWh)
IRR (%)IR
502.5991.132.516.080.97
702.5917.652.015.170.87
902.5844.162.014.410.78
1002.0812.542.014.030.74
1202.0753.750.513.480.69
1502.0665.570.513.690.67
Table 8. Optimal facility configuration for different residential demands (D). Source: own elaboration.
NPV CriterionIR and IRR Criteria
Residential Demand (kWh)PV Power (kWp)BESS Capacity
(kWh)
NPV (€)PV Power (kWp)BESS Capacity
(kWh)
IR (%)IRR
20003.51.5867.030.51.013.570.69
35003.52.51362.461.02.014.030.74
50003.53.51852.061.53.513.870.84
65003.55.02228.002.04.014.010.85
80003.55.02509.602.55.014.010.86
Publisher’s Note: MDPI stays neutral with regard to jurisdictional claims in published maps and institutional affiliations.