1. Introduction
Nowadays, air transport continues to grow at an average growth rate per annum of 4.5 to 5 percent [
1]. Based on the “Announcement of Civil Aviation Industry Development Statistics” issued by the General Administration of Civil Aviation of China, the total transportation turnover of the entire industry in 2018 has reached 120.653 billion tons kilometers, an increase of 11.4% over the previous year. Chinese civil airport flights taking off and landing sorties, passenger flow, cargo and mail flow increased by 7.6%, 10.9%, and 4.6%, respectively, to 4.694 million, 611.7377 million, and 7.853 million tons [
2], which makes China the second largest air transport market of the world. However, in the current situation, air transport industry provides great convenience and brings a series of environmental problems, such as the greenhouse effect caused by the discharge of various pollutants has caused public concern [
3,
4]. Aviation emissions caused by air transport are increasing distinctly at an annual mean growth rate of 3.6% [
5]. It is estimated that by 2040, CO
2 emissions related to air transport will increase by 21%, and NO
x emissions will increase by 16% [
6,
7]. The US Environmental Protection Agency pointed out that pollutant emissions caused by air transport have a negative impact on human health, and the number of heart diseases, neurasthenia, respiratory disorders, cancer, and even early deaths continued to increase, which has caused widespread public concern. Aviation emissions are various substances emitted by the mixing and combustion of fuel in the combustion chamber with air. Complete combustion of fuel produces oxygen (O
2), nitrogen(N
2), CO
2, water vapor (H
2O), etc.; incomplete combustion of fuel produces toxic gases (including nitrogen oxides (NO
x), carbon monoxide (CO), hydrocarbons (HC), etc.) Furthermore, it poses a direct or indirect threat to the atmospheric environment for the human lives around the airport. Among them, CO
2 is a gas that causes global warming and the greenhouse effect, and toxic gases are not conducive to the physical and mental health of the human body. Consequently, in the current fast-developing air transport industry, the number of aircraft operations has increased, producing a large amount of pollutants, which has a serious impact on the atmospheric environment. According to the OECD [
8] report on the environmental impact caused by transport, it outlines the issue: “the hub-and-spoke network may have a good environmental impact due to its economies of scale: the use of large aircraft allows passenger traffic to have lower emissions per seat in fewer segment connections. From another perspective, due to the large number of take-offs and landings sorties at the hub airport, the environmental impact around the airport may also increase.” Therefore, the analysis and evaluation of the environmental impact of aircrafts during operation is a major issue that needs to be resolved [
9].
In order to cope with the current situation, the government, aviation authorities and relevant departments adopted stricter environmental protection policies to encourage airlines to become more focused on the green aviation [
10]. The concept of “Green Aviation” is a new condition of the air transport industry to protect the ecological environment. It also plays a decisive role in the competitiveness and sustainable development of airlines. In 2011, the National Aeronautics and Space Administration (NASA) formulated the “Green aviation plan with the goal to be safer, greener and more effective”, and carried out examples of the usage of alternative fuels, evasion of severe weather, and efficient air traffic control strategies to save fuel burn and reduce emissions [
11].
As far as airlines are concerned, their network is the foundation, which stipulates the services’ scale and scope of airlines, shows the industry competitiveness. In the context of the current rapid growth of the Chinese civil aviation transport industry, the airlines’ network structure has also developed from the initial city-to-city network to the hub-and-spoke network and the latter refers to a network that includes hubs and non-hubs [
12]. It has convenience, accessibility, range economy and excellent flexibility, which can significantly boost efficiency, reduce operating costs, and lay a solid foundation for the development of airlines [
13]. In addition, the “Thirteenth Five-Year Plan for the Development of Civil Aviation in China” proposed to accelerate the construction of green civil aviation, research an annual evaluation mechanism for the energy conservation and emission reduction of civil aviation emissions from airlines and airports, and support airlines to establish data-based flight operations in the whole process management. Therefore, comprehensive consideration of economy and environmental protection is necessary for hub-and-spoke networks, which can provide certain guidance for airlines and help sustainable development of Chinese civil aviation.
In this paper, we introduce a new evaluation method. It resembles the classical hub-and-spoke network research, our method is designed to minimize the total passenger flow transportation cost. Unlike the previous studies, it establishes aircraft emission assessment model and environmental externality measurement model under the condition of the lowest passenger flow transportation cost and quantitatively analyzes the environmental impact and external costs of the hub-and-spoke network. For robustness checks, we adopt the methods of comparative analysis and sensitivity analysis to verify the computational example.
The contribution of this paper is to analyze the impact and external costs of the environment associated with hub-and-spoke in air transport. Firstly, based on the required passenger flow, flight distance, given number of hubs, distance cost matrix, and passenger flow demand matrix, we build a hub-and-spoke network. Secondly, evaluating the environmental impact, which mainly includes the calculation of fuel burn and pollutant emissions. To make the evaluation more accurate, the emission factors of pollutants are revised in conjunction with the meteorological conditions during the flight data period collected. For the purpose to study the airlines network deeply, this paper introduces the city-to-city network for contrastive analysis and draws some conclusions. Thirdly, we build a model for calculating the environmental externalities of the airline network, which included the environmental external cost of toxic gases (NOx, CO, HC), and greenhouse gas (GHG) (CO2), and the emission intensity of GHG. After that, considering the changes in aircrafts’ types, a sensitivity analysis of the two airlines’ networks is conducted.
2. Literature Review
Under the current situation, the network has become a competitive weapon for airlines. The research on hub-and-spoke network started early. It was studied for the first time by O’Kelly by using two heuristic algorithms to settle the quadratic programming model [
14,
15]. Mohammad et al. [
16] studied the robustness of single-allocation hub selection without capacity limitation, and also took the passenger satisfaction into considered. Campbell et al. [
17] emphasized the need to go beyond the classical model to define new models to better solve the problem of hub location in actual scenarios. The deregulation of the European Union market has stimulated the reorganization of airlines’ networks. Wit et al. [
18] constructed the wave-system structure to study the hub-and-spoke network of European airlines, and found that large hubs have better performance than non-hubs, which attracted more airports to connect and greatly promoted the increase in total passenger traffic. Zhang et al. [
19] showed that European airports prefer to have a similar “stand” between two airports, which corresponded with the “hub” and “hub-and-spoke network” in the development direction of the European transportation market. By indirect connection, European airlines employed a hub to connect the two small airports, thereby attracting more passengers [
20]. Števárováa et al. [
13] considered the condition that a hub airport can simultaneously connect multiple origins and multiple destinations, explored the performance of hub-and-spoke network. As for city to-city network, Fu et al. [
21] analyzed the spatial layout characteristics of the city-to-city network by constructing a spatial probability model. The results showed that the operating capabilities of city pairs between different airlines are spatially related, which were conducive to the reasonable development strategies for emerging low-cost airlines. Bokor et al. [
22] applied the city-to-city network to engineering practice projects, and the changes of specified projects have an impact on the whole. Never et al. [
23] found the potential driving factors and obstacles related to airline network connectivity, guided by innovation diffusion theory, and analyzed qualitative and quantitative data using the method of triangulation to provide references for airlines to make plans. Seabra et al. [
24] took the capacity and connectivity variables of the network as input, built a panel data model to explore the determinants of airlines’ attractiveness to passengers.
Environmental factors play an increasingly important role in the context of the rapid development of traffic. Morris et al. [
25] described the pollutant emissions produced by aircrafts during flight phases and found that it effected the global atmospheric environment. Kesgin et al. [
26] estimated the aircraft pollutant emissions of 40 Turkish airports during the landing and take-off (LTO) cycle. Turgut et al. [
27] established the fuel flow rate empirical equations during the cruise phase to research the aircrafts fuel consumption in the changing situation. Bo et al. [
28] estimated the aviation emissions of all civil airports in mainland China and analyzed the atmospheric environmental impact of pollutants on the airport. Schipper et al. [
29] analyzed the effect of environmental external costs on the welfare benefits of the liberalization in the aviation market and concluded that the impact of airlines deregulation could reduce the environmental impact and welfare benefits. Lu et al. [
30] discussed the relationship between environmental costs and passenger demand under different operational modes of airlines. Morrell et al. [
31] established a model to evaluate the environmental impact costs of the hub-hub network and hub by-pass network. Schipper et al. [
32] showed that the use of large aircraft with a relatively high load factor to operate in the hub-and-spoke network was conducive to reducing the total CO
2 emissions, but it would damage the environment of the hub airport to a certain extent. Kim et al. [
33] studied the impact of external costs such as aviation emissions charges on airlines’ networks, and predicted the future CO
2 price from a long-term perspective. Cui et al. [
34] used a network structure to construct a three-stage efficiency evaluation mechanism to assess the environmental efficiency of airlines. By using the proposed network range-adjusted measure to calculate, the evaluation results of 29 airlines around the world are obtained. Leurent et al. [
35] considered the local and global environmental impacts, developed a method based on the urban regional transportation system, and used a Macroscopic Fundamental Diagram to model the road network. Li et al. [
36,
37] proposed a new Network Environmental Production Function to study the impact of the EU ETS emissions trading system on airline pollutant emission costs, and analyzed the changes in pollutant abatement costs under EU ETS and without EU ETS emission trading systems.
The above studies show that most of the current work on the hub-and-spoke network mostly think about the transportation costs on the hub location problem. Plenty of the studies take the aircrafts’ pollutant emissions during the LTO cycle into account, and fewer studies consider the environmental impact and environmental external costs of aircrafts in the airlines’ network. Therefore, our study takes the overall operation characteristics of aircrafts into account, quantitatively examine the environmental impact associated with the hub-and-spoke network. Through the construction model of the environmental externality in the airlines’ networks, the cost of toxic gas and GHG are estimated and analyzed. This allows the air transport industry to use market means to provide technical support for controlling the emissions and help the common development of civil aviation and social economy. Considering the trend of vigorously developing green aviation in China, by deep analysis of the operating environmental impact and environmental external costs associated with the hub-and-spoke network, comprehensive consideration of economy and environmental protection, which provide a certain decision support for the current airline operations and help Chinese air transport industry grow into green and sustainable development.
3. The Approach
3.1. Alternative Networks
An airline network refers to a network structure in which airlines are connected in a certain way. The passenger market between origin and destination use direct flights or transfer flight through the intermediate nodes. Therefore, city-to-city network and hub-and-spoke network have existed. The city-to-city network is also called the point-to-point network, which is employed indirect flights. Passengers arrive at the destination directly from origin, and there is no need to transit or stop through the third node/city. Due to the fierce competition in the air transport industry, powerful airlines are gradually chasing the economy of routes and scale, thus forming a hub airport. The hub-and-spoke network mainly reduces the passenger traffic flow transportation costs through economies of scale. It also uses light medium aircraft to gather passengers from surrounding small and medium airports to hub airports, which is called collection component (from origin to hub) and then airlines arrange heavy aircraft with a lower unit cost to transfer passengers to other hub airports, which is called transfer component (between hubs). Finally, the light medium aircraft are adopted for distribution component (from hub to destination). Although the cost from a non-hub airport to a hub airport is high, it can be compensated by the low cost of transfer between hubs, and the low cost between hubs is a manifestation of economies of scale. Hence, the hub-and-spoke network is becoming more and more effective in the network system.
To obtain the airline allocation in the hub-and-spoke network, it is necessary to get information including the distance of the segment, the number of given hubs, and the passenger flows between city pairs. In consideration of the fact that there are distinct deviations in different operating scenarios during the LTO cycle phase, this research focuses on the climb-cruise-descent phase of environmental impact and external costs in the airline network.
In this section, we construct a hub-and-spoke network. To satisfy our given assumptions of this research, the number of hub airports is given, and capacity restrictions are not considered in airport and airline. Direct passenger traffic is not allowed between non-hub airports. On the contrary, passenger flows departing from non-hub airports must pass through the hub airport together. We assume that the flow of the airport can be divided and directly transported to or from multiple hub airports, which constitutes a multiple allocation connection. After satisfying the above assumptions, the p-hub median problem of multiple allocations without capacity limitation is formed. We use an integer linear programming model to solve this problem.
A complete graph is considered, which stands for a set of nodes and connected edges composed of nodes. The nodes set is denoted by , and the collection of connecting edges indicated as .
The volume of passenger flows with each city pair of nodes
are expressed as
Mml, and we make this assumption:
Mmm = 0,
Mml = Mlm. The transportation cost for per unit flow from node
m to node
l is considered as
Cml, which is proportional to the Euclidian distance and associated with each pair of nodes [
38]. Especially,
,
,
. To reach the economies of scale and manage the passenger flow in the hub-and-spoke network, airlines collect flights with lower passenger flow to hub airports in collection component, transfer them between hub airports in transfer component, and/or distribute passenger flows to destinations through hub airports in distribution component. There are unit discount coefficients of
,
,
in these three components. Certainly, not that all traffic flow needs via the above three components, and one or more components can be experienced is just fine. Hence, unit traffic flow cost in each component can be expressed as
,
and
, respectively, and
p and
q denote hub nodes,
m is a non-hub node, and
l stands for a non-hub node. In accordance with the classification for aircraft, the available aircraft types are selected as heavy aircraft and light medium aircraft, which possess more than 200 seats and 151–200 seats respectively [
37].
The economic features of the scope and scale in the hub-and-spoke network have consolidated the core competition ability of airlines [
38]. Therefore, the minimum total transportation cost is the objective function for all origin–destination (OD) pairs by the stated airlines’ allocation. To develop our model, we primarily employ the mathematical formulation stated by Ebery et al. [
39]. The mathematical model is given as followed.
Formula (1) represents the minimization of passenger transportation costs. Cmlpq denotes the transportation cost of conveying one unit of passenger traffic flow from node m to node l via hub p and q, which is expressed by . is the proportion of passenger traffic flow from origin node m to destination node l, passing through hubs p and q, . Constraint 2 indicates that the number of given hub airports is r. Constraint 3 defines the decision variables hp. Constraint 4 shows that the total passenger traffic flow Mml are supposed to be conveyed through hubs p and/or q. Constraint 5 and 6 request that if a hub airport p or q is established, passenger traffic flow between each city pair must be conveyed via it. hp and hq are decision variables. If there is only one hub airport from origin to destination, constraint 7 and 8 ensure the maximum number of transfers is 1. If the origin and destination are both hub airports, use the direct transportation method.
3.2. Fuel Burn and Pollutant Emissions
Nowadays, increased care about air quality and human health due to aircraft emissions are observed. The aircrafts bring convenience, but also emits a large number of pollutants. Aircraft activities generate massive amounts of emissions, such as CO, HC, NOx, CO2, and other pollutants. Although these emissions will not make a significant difference to the environment in a short period, the longstanding vicious cycle will have a severe impact on the environment, causing humans to have chronic diseases. This research takes toxic gases and GHG as pollutants, analyzes the environmental impact and external costs involved in the hub-and-spoke network and city-to-city network.
Based on the Aviation Environmental Design Tool (AEDT) that is accredited by Federal Aviation Administration (FAA), it is recognized that the aviation emissions relative to pollutant emission factor, aircraft operating time, number of engines, and fuel flow. When in an international standard atmosphere (ISA), the fuel flow and pollutant emission factor can be obtained directly from Engine Emissions Data Base (EEDB) published by ICAO. Therefore, the mathematical model about the environmental impact is established [
40], and the pollutant emissions produced by aircraft are suggested in Equation (9):
where
(kg) denotes the mass of emissions for pollutant
.
suggests emission factor of
u type aircrafts concerning pollutant
, which means the mass of pollutants
produced by burning 1kg of fuel.
(kg/min) indicates the fuel flow of a single engine of
u type aircrafts in the elapsed time
(s).
Nuu denotes the number of engines of
u type aircrafts.
The fuel flow of aircrafts is calculated by referring to the performance parameters in Base of Aircrafts Data (BADA) [
41], and the mathematical model is as follows in Formulas (10)–(13):
where
(kg/min),
(kg/min) and
(kg/min) are the fuel flow for the aircrafts of type
u during the climb, decent and cruise, respectively.
(kt) denotes true airspeed,
(feet) is flight altitude.
(kg/(min·kN)),
(knots) denote the fuel burn factor of the first unit thrust and second unit thrust,
(kg/min),
(feet) and
(dimensionless) are the fuel flow factors of the first descent phase, the second descent phase and the cruise phase, respectively.
(kg) is the mass of fuel burn. Formulas (10)–(12) denote the fuel flow of the aircraft during the climb, descent and cruise phases, respectively. In Formula (9), the value of
is obtained using the values of
,
,
in Formulas (10)–(12).
The emission factors in the EEDB are obtained by ICAO under the test of ISA; hence, changes in the external atmospheric conditions will affect them. To evaluate aircraft emissions accurately, the meteorological data are introduced to correct the pollutant emission factors in the EEDB. The revised methods are shown in Equations (14)–(21):
where
(g/kg) is the revised emission factor of NO
x,
(g/kg) is the revised emission factor of CO and
(g/kg) is the revised emission factor of HC.
(g/kg),
(g/kg) and
(g/kg) are the reference emission factor of NO
x, CO and HC provided by EEDB.
denotes temperature ratio,
is pressure ratio, R
H (%) is relative humidity,
is humidity ratio,
H shows the humidity coefficient,
EW (hpa) is saturated water pressure,
T denotes atmospheric temperature (°C),
Pr (hpa) indicates atmospheric pressure.
3.3. The Environmental Externalities of Aircrafts’ Emissions Based on the Airlines Network
The environmental external cost of aircrafts’ emissions is mainly affected by factors such as flight operation, engine type, and emission factor. In addition, when the aircraft is operating, it will emit toxic gases such as NOx, CO, HC, and GHG, which will have an adverse impact on the atmospheric environment. Therefore, for the accuracy and convenience of the research, this paper establishes a calculation model of toxic gases and GHG to evaluate and analyze the environmental external costs of aircraft operations.
3.3.1. Environmental External Costs of Toxic Gases
According to the study [
30], the average unit external cost of various pollutants in the relevant year is determined according to the exchange rate of international currencies and the inflation rate in China. Therefore, we get the unit environmental external cost of each pollutant in 2018 as shown in
Table 1.
According to the average unit external cost of each pollutant in
Table 1, the environmental external cost of emissions generated by using aircrafts’ type
u can be obtained as
where
(
$) denotes the environmental external cost of
u type aircrafts’ emissions;
(
$/kg) is the average unit external cost of pollutant
;
(kg) shows the mass of pollutant
, which can be obtained from Formula (9).
contains three types of pollutants: NO
x, CO, and HC.
3.3.2. Environmental External Cost and Emission Intensity of CO2
On 5 February 2018, according to the “Trends in Global CO
2 and Total GHG Emissions: 2018 Report” released by the Dutch Environmental Assessment Agency, the GHG emissions of China are increasing at a rate of 1.3% in 2017, reaching 100 million tons of CO
2 equivalent. Under the current situation, CO
2 has become the second largest source of emissions from air transport, accounting for 2% of the total global anthropogenic emissions [
42]. Regarding the calculation of CO
2 emissions, the United Nations Intergovernmental Panel on Climate Change (IPCC) has proposed three feasible measurement methods based on the actual conditions of different countries for reference by each country. ICAO has also issued a series of standard calculation methods for aircrafts’ engine emissions. The generation of CO
2 is a continuous process, and it is less sensitive to the aircrafts’ location, flight altitude, and surrounding atmospheric environment. Therefore, the CO
2 emission factor is a fixed value. This study uses the pollutant emission calculation method published in ICAO to calculate the CO
2 emissions in the airlines network. The calculation formula for CO
2 emissions is as follows
EICO2 is the emission factor of CO
2 (3.157 kg CO
2/kg fuel) [
43];
u is the aircraft type;
FuelCO2 denotes the mass of fuel burn of aircraft type
u in CO
2.
ECO2 indicates the mass of CO
2 emission.
where
UCO2 is the average unit external cost of CO
2, C
CO2 denotes the environmental external cost of CO
2. According to the average unit external cost of CO
2 in
Table 1, combined with Formula (24), the environmental external cost of CO
2 can be obtained.
Regarding the “carbon emission” index for measuring the level of GHG emissions, there are two different views. Some scholars employed it to mean the emission of carbon molecules, and some scholars referred to it as the abbreviation for CO
2 emissions. In response to global warming, China has been using CO
2 index to formulate relevant emission reduction measures and the CO
2 emission intensity is defined as the CO
2 emissions per unit of Gross Domestic Product (GDP). This index is mainly used to measure the relationship between a country’s economy and carbon emissions; that is, if a country’s CO
2 emissions per unit of GDP decrease while its economy grows, it indicates that this country has achieved a low-carbon development model. The intensity of CO
2 emission of airways can directly reflect the efficiency of aviation kerosene and CO
2 emission level. Analogous to the calculation formula of airlines’ CO
2 emission intensity, the calculation formula of CO
2 emission intensity in the airlines network used in this study is obtained as follows.
Fuelu (kg) represents the aviation kerosene consumption of aircraft u during the flight time Timeu, which can be obtained from Formula (13). Gu (kg/km) is the CO2 emission intensity in the airlines network; ku (kg/t·km) represents the fuel consumption per ton-kilometer of the aircraft type u; R (TJ/Gg) denotes the net heating value of aviation kerosene, and its value is 44.1 TJ/kg; F (kg/TJ) is the net heating emission factor of aviation kerosene, its value is 71,500 kg/TJ; nu is the number of aircraft type u.
4. Computational Example
4.1. Case Study
For the sake of better solving the problem, we considered the actual problems in the operation project and made the following assumptions [
44] in
Table 2:
According to the ranking of passenger throughput of civil aviation airports in 2018, there are 26 airports with an annual passenger flow of more than 15 million. Given the range that can be covered by the airlines network, the passenger flow of each city, the geographic position of the city, the availability of data, and the actual operation situation of Chinese cities, selected cities with worthwhile value for research. Hence, the case study selects 10 airports from the top 26 airports for research purpose. According to the annual passenger flow, the top 26 airports are divided into three equal parts, and some cities are selected according to our research objectives. Select Beijing, Guangzhou, Chengdu, Kunming, and Xian in the first equal ranking of airports, and record them as 1, 2, 3, 4, and 5, respectively. Select Nanjing, Zhengzhou, and Qingdao in the second equal ranking of airports, denoted as 6, 7, and 8, respectively. Urumqi and Shenyang are selected in the third equal ranking of airports, with 9 and 10, respectively. Employing distance and passenger traffic flow as the distance cost and demand cost, respectively. The data can be obtained from the book “ Statistics Data on Civil Aviation of China “ and websites.
To conduct in-depth analysis, we introduce a city-to-city network for comparative analysis, which can evaluate the fuel burn, pollutant emissions, and implication of environmental costs in the two airline networks.
Considering the operational features and scale economy of the hub-and-spoke network, it is necessary to allocate aircraft types reasonably. We employ heavy aircrafts with more than 200 seats when transferring between hubs, including two types of aircraft, A330-200 and A300, each type is 50. The collection and distribution components between non-hub and hub employ light medium aircraft with about 151–120 seats, including two types of aircraft, A320 and B737, each with 100 [
9]. By the Flight Aware official website, the selected four aircraft types with practical flight trajectory data during normal operation (excluding special cases such as diversion, return flight, and alternate landing) are obtained. The EEDB was used to calculate the aircraft emissions during LTO cycle, but for the cruise phase, the EEBD does not provide a specific reference method. Therefore, this research employs the method of Zhou et al. [
46] to calculate the aviation emissions during the cruise phase.
Table 3 shows the relevant basic parameters of each type of aircraft, including engine type, passenger capacity, and pollutant emission factor. The fuel burn factors of the four types of aircrafts can be obtained from BADA.
According to
Table 3, we know the basic parameters of each aircraft. For example, for A320 aircraft, it can accommodate 150 passengers, and its engine model is CFM56-5A1. The mass of toxic gases (including NO
x, HC, and CO) produced by burning 1 kg of fuel is expressed as
EINOx,
EIHC, and
EICO, respectively. In the climbing and descending phases of aircraft, NO
x emission factors are 19.60 g NO
x/kg fuel and 8.00 g NO
x/kg fuel. Analogously, during the climbing and descending phases, the HC emission factors are 0.23 g HC/kg fuel, 0.40 g HC/kg fuel, respectively. In climbing phase, CO emission factor is 0.90 g CO/kg fuel, and in descending phase, CO emission factor is 2.50 g CO/kg fuel.
Considering the atmospheric environmental impact during flight, this research employs meteorological sounding data to revise the emission factor at various altitudes. The sounding data include the data such as atmospheric pressure, geopotential height, temperature, relative humidity, and so on. The laboratory of the University of Wyoming [
47] has published the data of the sounding meteorological data needed by this research. In hub-and-spoke network, meteorological data from a sounding station on a typical schedule day closest to the hub airport is used as a representative. Similarly, in city-to-city network, select the average meteorological data of sounding stations of each city pair on a typical schedule day.
4.2. Analysis of Results
4.2.1. Results of Airline Networks
Based on Formulas (1)–(8), by running MATLAB2016a on a CPU3.6 computer, the specific airline network allocations are shown in
Table 4.
In
Table 4, we learn that
h3 = h7 = 1, suggesting node 3 and node 7 are hub nodes, and the optimal total transportation cost is
$2.0778 × 10
6.
x2237 = 1 denotes origin is Guangzhou, passing hub nodes Chengdu and Zhengzhou, and finally return to Guangzhou.
x2433 = 1 means the passenger flow between Guangzhou and Kunming pass through the hub node Chengdu for transfer.
x11077 = 1 suggests that the origin is Beijing, through the hub node Zhengzhou for transfer, and reach the destination Shenyang.
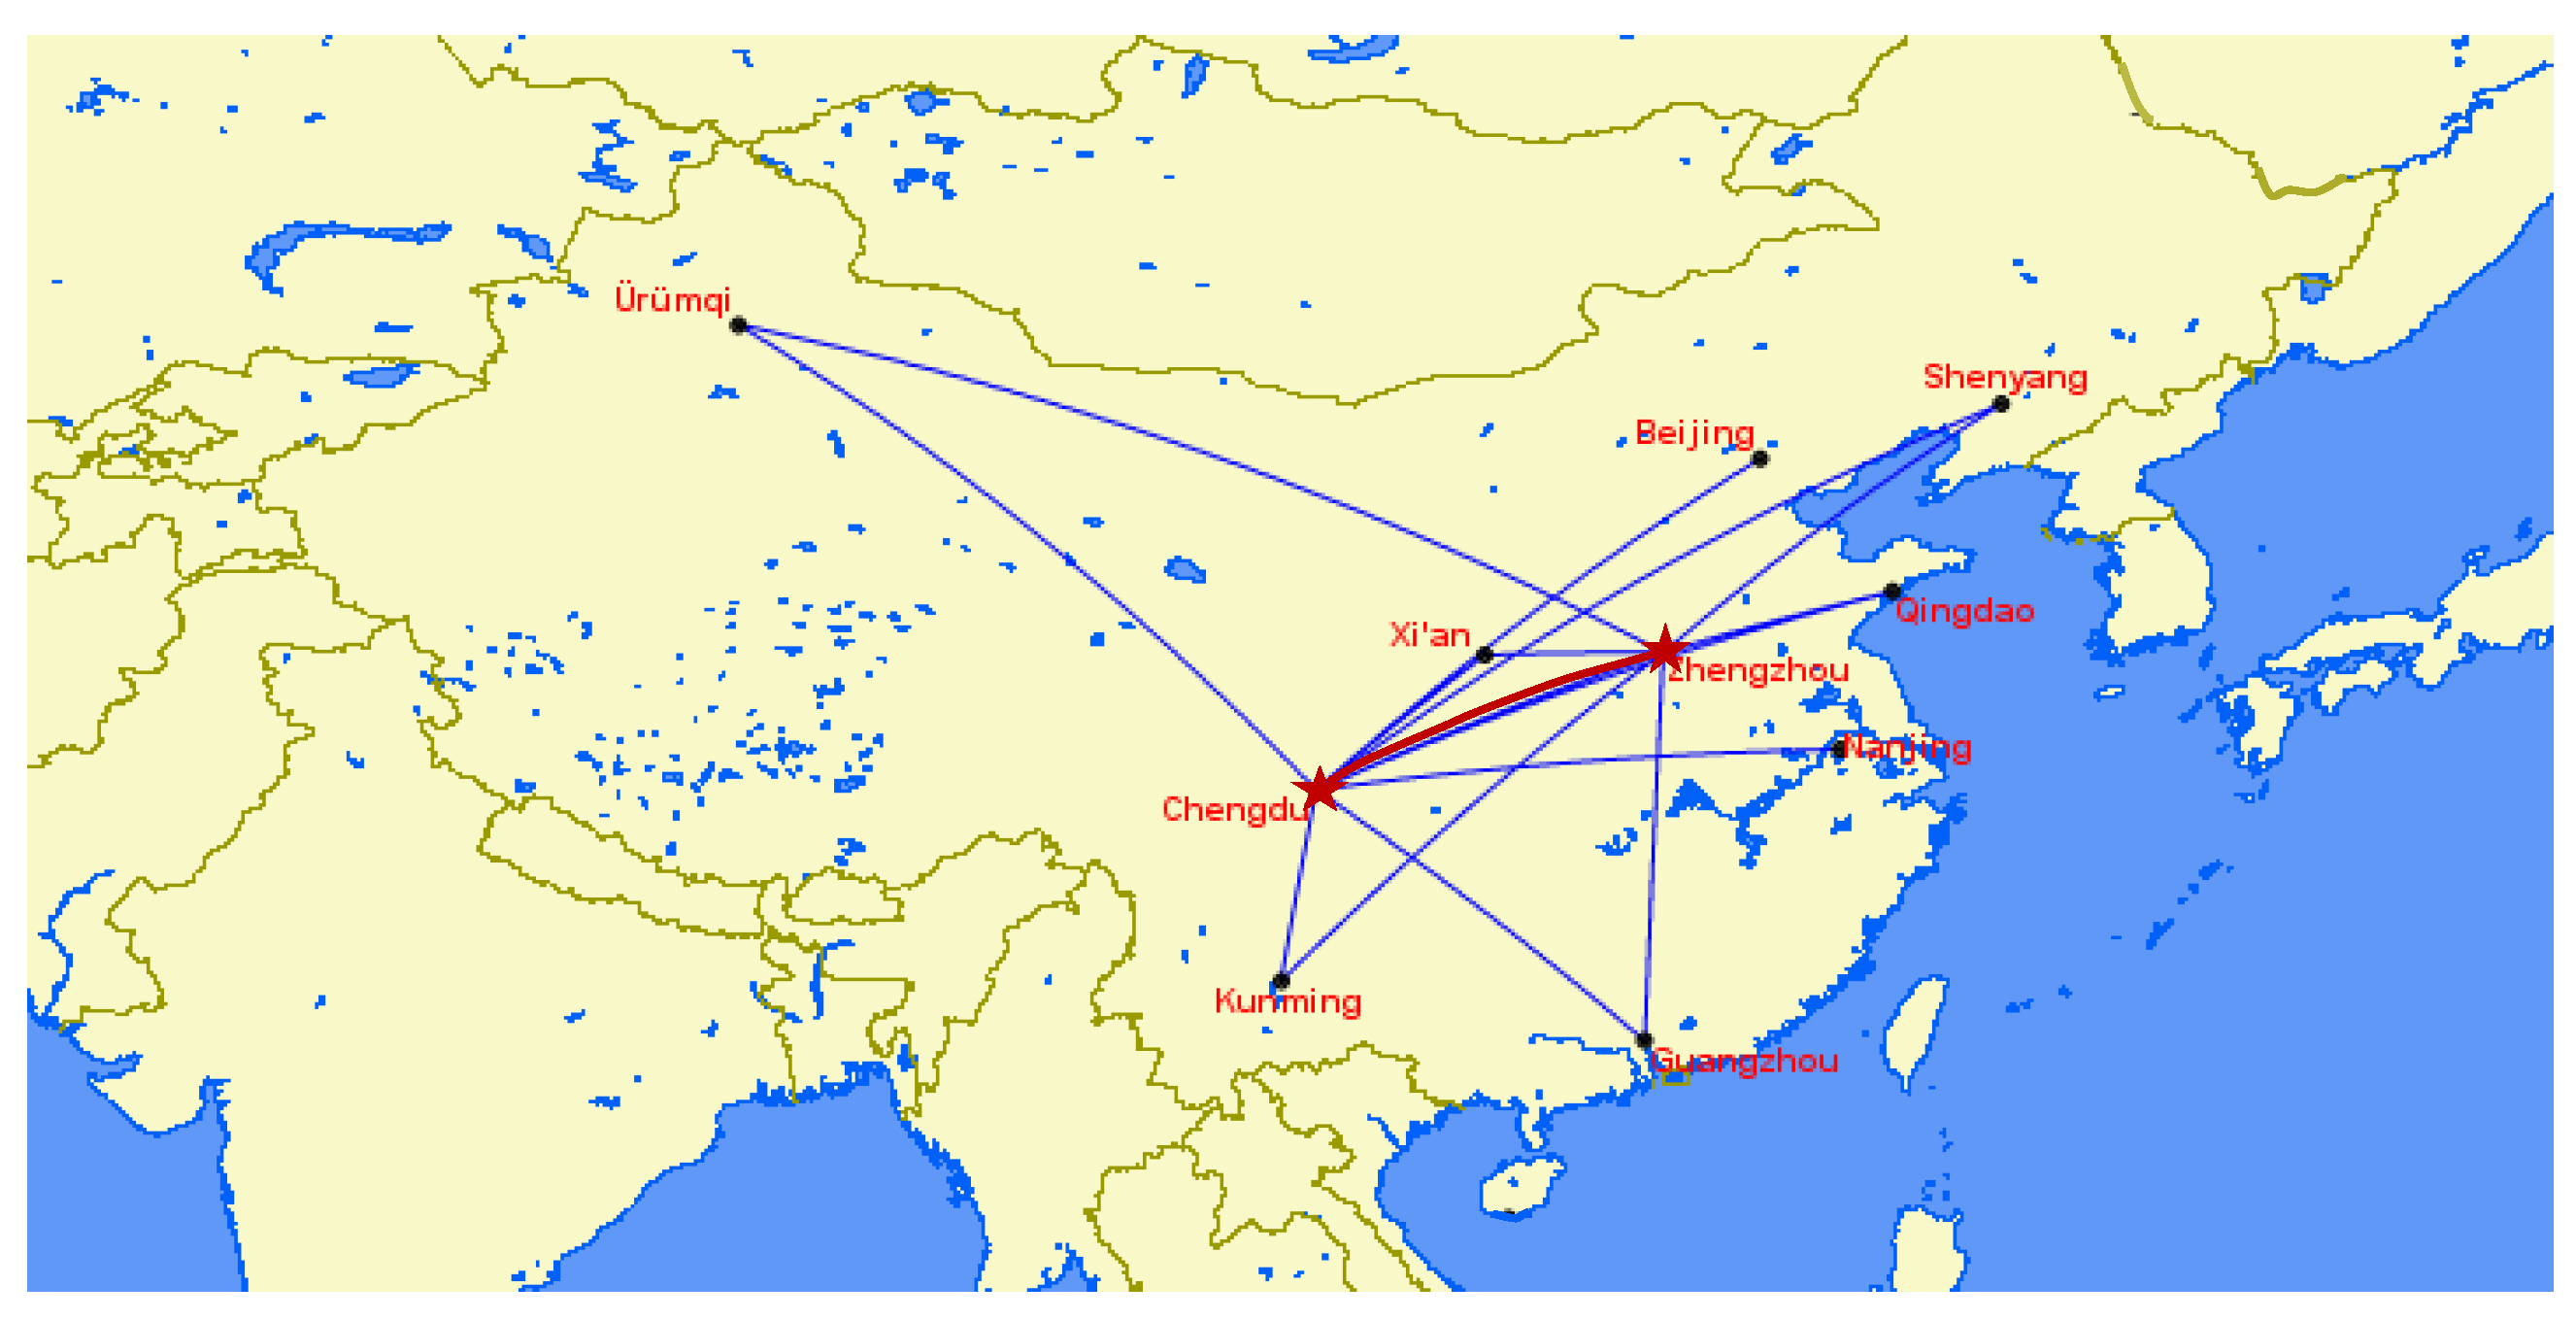
x101037 = 1 shows that the origin and destination are both Shenyang, and through the hub nodes Chengdu and Zhengzhou for transfer. The allocations of other airlines are similar to the above situation and will not be repeated here. Based on the above results, we get the location of the hub airport and the airline allocations, thereby constructing an example of hub-and-spoke network as depicted in
Figure 1.
In
Figure 1, there are ten cities in the hub-and-spoke network, city 3 and city 7 are hub nodes, and other cities are non-hub nodes, which denotes Chengdu and Zhengzhou are hub airports, Beijing, Guangzhou, Kunming, Xian, Nanjing, Qingdao, Urumqi, and Shenyang are non-hub airports.
In the city-to-city network, each two cities are combined into a city pair. According to relevant statistics [
2], the 10 city pairs, including Beijing–Zhengzhou, Chengdu–Xian, Kunming–Qingdao, Kunming–Urumqi, Kunming–Shenyang, etc. have no passenger flow. Hence, 35 city pairs shown in
Table 5 are obtained, namely Beijing–Guangzhou, Beijing–Nanjing, Guangzhou–Kunming, Guangzhou–Xian, Qingdao–Guangzhou, and so on.
4.2.2. The Data Analysis
To ensure the balance of passenger traffic flow between the hub-and-spoke network and the city-to-city network, we combine the passenger capacity of each aircraft type to make reasonable arrangements for the number of aircrafts employed in each flight segment. The data analysis of city-to-city network is similar to the hub-and-spoke network, we only give the clear description of the latter in this research to make this paper concise. In the hub-and-spoke network, the segment containing Chengdu–Zhengzhou is divided into two parts, one is the Chengdu–Zhengzhou segment, and the other is the segment containing other nodes. For example, the flight segment of Beijing-Chengdu–Zhengzhou–Shenyang is divided into the hub transfer segment, Chengdu-Zhengzhou, the collection and distribution segments of Beijing–Chengdu, Zhengzhou–Shenyang. This division will help us in the calculation of pollutant emissions later. For segments that do not include the Chengdu–Zhengzhou segment and only include one of the Chengdu node or Zhengzhou node, they are divided into collection and distribution components. For instance, the Guangzhou–Zhengzhou–Qingdao segment is divided into Guangzhou–Zhengzhou and Zhengzhou–Qingdao segments for research. Combining the actual operating situation of the flight in
Figure 1, the hub segment between Chengdu and Zhengzhou is the transfer, Beijing–Chengdu, Zhengzhou–Shenyang, Guangzhou–Chengdu, Zhengzhou–Guangzhou, etc. are collection and distribution components.
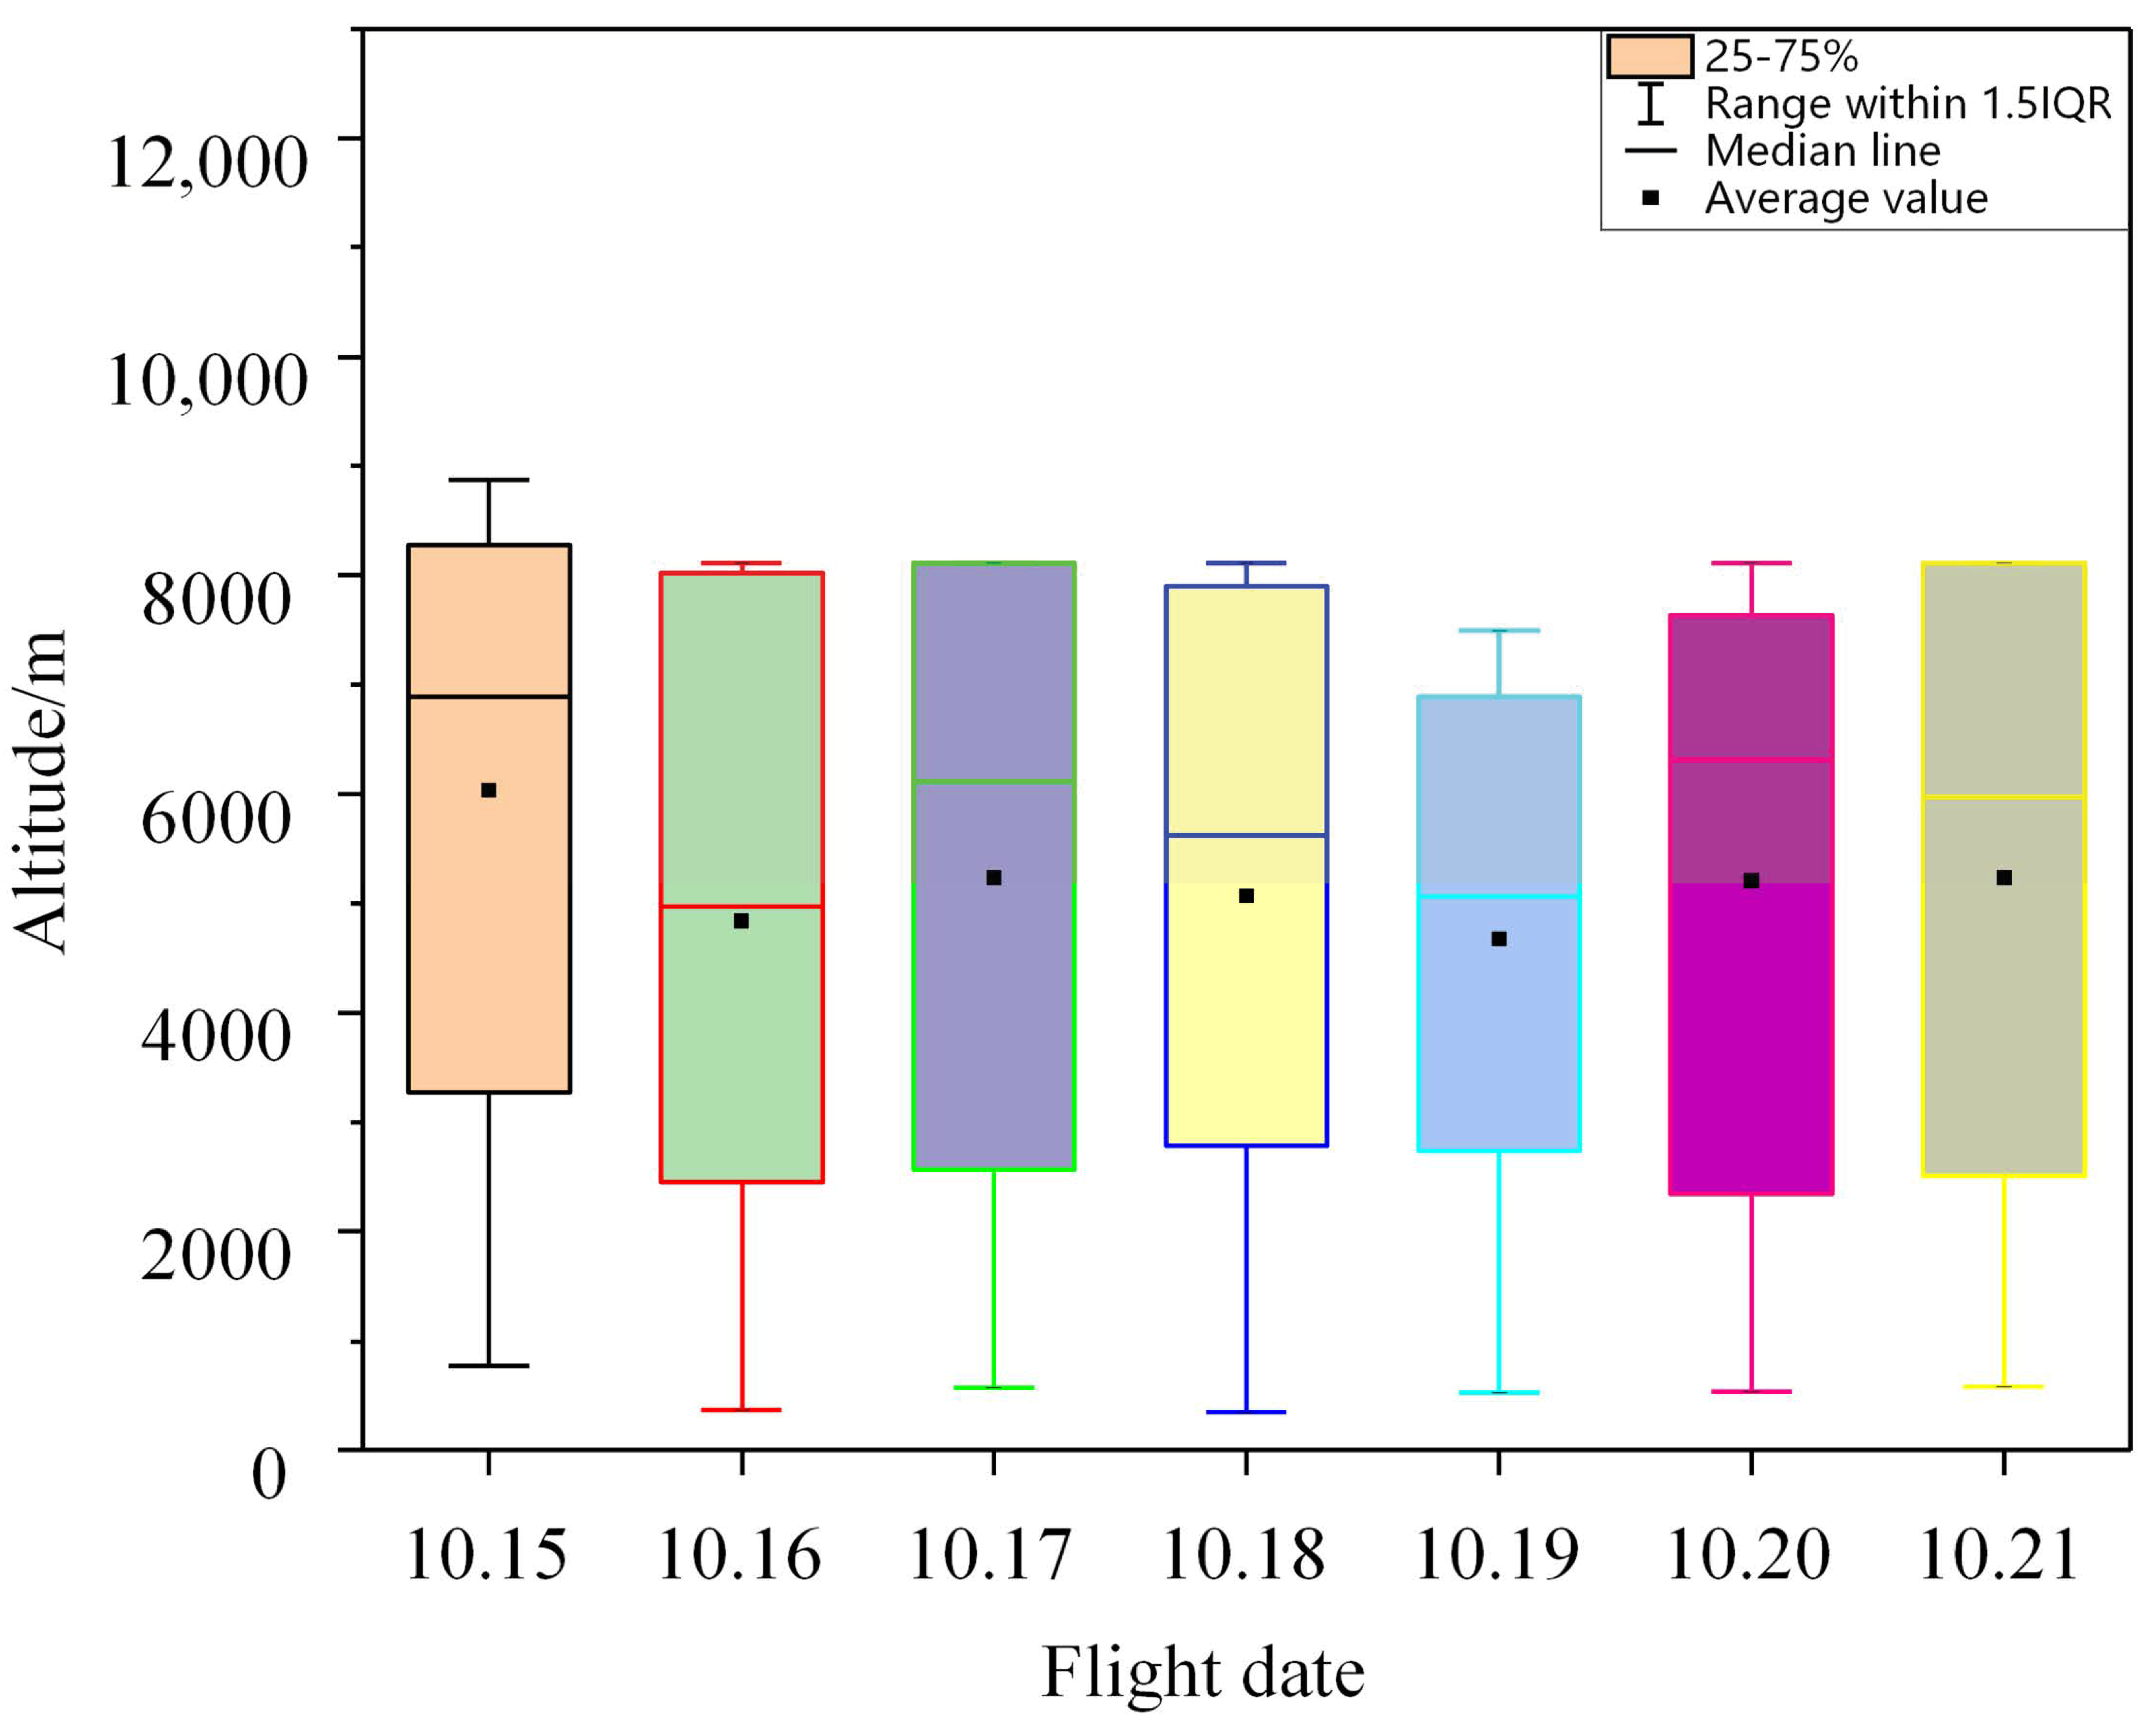
Figure 2 shows the actual flight operation data of the heavy aircraft A330-200 between hubs.
The actual schedule date is from 15 October 2019 to 21 October 2019 (a total of seven days) for a computational example.
Figure 2 depicts the operating situation between hub nodes, the median line indicates that the Chengdu–Zhengzhou segment has a flight altitude of 5000 to 7000 m, and the average altitude is about 5000 to 6000 m. Except for October 19, the height and position of the quartile range are almost the same. According to the upper and lower limits of the box plot, except for slightly different altitudes of the flights on October 15 and October 19, the running situation of the flights on other schedule dates are almost the same. As mentioned above, the operating situation in Chengdu–Zhengzhou segment is relatively stable at the corresponding schedule date. In terms of collection and distribution, on the same schedule date, the light medium aircraft A320 is used, and for other cases (including the collection and distribution components and the segments that do not include the Chengdu–Zhengzhou segment and only includes the Chengdu or Zhengzhou node) the data is also stable. For details, please refer to the study [
38] for analogy analysis.
Because even between the same segments, different schedule dates may result in different flight trajectories. Therefore, to facilitate later calculation of fuel burn and pollutant emissions, the significance of schedule date and flight trajectories are analyzed by one-way analysis of variance (one-way ANOVA). This research only considers the environmental impact caused during the climb, cruise, and descent phases. Through SPSS software, we get the analysis results of one-way ANOVA for the Chengdu–Zhengzhou segment, and we get the significance is 0 and less than 0.05, the average flight value for different schedule dates is significant. To find the flight with a specific schedule date, the analysis is continued using similar category subsets.
By the analysis of similar category subsets, we obtained the results that using the two methods of Student–Newman–Keuls (S-N-K) and Duncan in Chengdu–Zhengzhou segment. These two methods are to find similar category groups in the sample, and there is no difference in the level of the same group. The results show that each method divides the schedule dates into three groups, and then concludes that the flight data of October 18, 2019, is required for this research. Because of large number of segments, we select representative segments for analysis. Using the same method to perform one-way ANOVA on the data of other city pairs, the typical schedule date in transfer, collection and distribution components are obtained. According to the analysis results, the typical schedule dates of Beijing–Chengdu, Zhengzhou–Shenyang, Guangzhou–Chengdu, and Zhengzhou–Guangzhou are 19 October, 16 October, 20 October, and 15 October, respectively. The Chengdu–Kunming, Zhengzhou–Qingdao, Chengdu–Qingdao, and Chengdu–Nanjing segments can be implemented on 16 October, 15 October, 17 October, and any specific day. For the sake of calculation, this research chooses 15 October as the typical schedule date for the Chengdu–Nanjing segment. Each typical schedule date obtained above is taken as a typical day for each segment, and the flight profile graphs under the typical days are drawn, to pave the way for our later research.
Figure 3 shows the flight profile on a typical day of A330-200 in Chengdu–Zhengzhou hub segment.
Figure 3a denotes the two-dimensional vertical profile of the horizontal axis for flight time and the vertical axis for altitude. It is shown that the aircraft’s climb, cruise, and descent times are 871 s, 3257 s, and 1755 s, respectively, which provide a reference for the subsequent environmental impact analysis.
Figure 3b depicts the overall situation of the aircraft on a typical day in the form of a three-dimensional flight profile graph, which is expressed by a red curve. Similarly, the two-dimensional vertical profile and three-dimensional flight profile in other cases are analogous.
4.2.3. Results of Environmental Impact and External Costs
As the aircraft is affected by the external environment during operation, the pollutant emission factors are revised shown in
Appendix A. The revised method can refer to
Table 3 and Equations (13)–(21).
By using the mathematical model in Formulas (9)–(21), we obtain our desired results of the environmental impact associated with the hub-and-spoke network in
Figure 4. Likewise, if a city-to-city network is adopted, a direct segment is formed between every two cities. Combined with the passenger seating capacity of each aircraft in
Table 3, aircraft A320 and B737 are arranged to be 194 and 191 respectively to insure the equivalence of passenger traffic flow under the two airline network conditions. The calculated results of the environmental impact of city-to-city network are shown in
Figure 4.
As is shown in
Figure 4, we use “total” to accumulate the total fuel burn and total toxic gases emissions (including NO
x, CO, and HC) of the aircraft during the climbing, cruising, and descending phases, and obtain the environmental impact caused by the two airline networks. Similarly, it can be concluded from
Figure 4 that the environmental impact of the hub-and-spoke network is lower than that of the city-to-city network. The specific performances are: the total fuel burn of the hub-and-spoke network is 6.71 × 10
7 kg, which is 64.38% lower than that of the city-to-city network with 1.88 × 10
8 kg. In the hub-and-spoke network, the total NO
x emission is 2.69 × 10
9 kg, the total CO emission is 7.86 × 10
8 kg, and the total HC emission is 1.48 × 10
8 kg. In the city-to-city network, the total NO
x emission is 5.53 × 10
9 kg, the total CO emission is 1.90 × 10
9 kg, the total HC emissions is 4.14 × 10
8 kg. The former reduces NO
x emissions, CO emissions, and HC emissions by 51.38%, 58.64%, and 64.10%, respectively.
Regarding the environmental externalities of the airline network, this study mainly considers toxic gases and the GHG, and measured the GHG emission intensity. Combining Formulas (22)–(25), the environmental impact related to GHG in the two networks is shown in
Table 6. As for the environmental external cost of toxic gases, it can be obtained in
Table 7.
In
Table 6, the total GHG emission in total phase of city-to-city network is 2.81 times as hub-and-spoke network and its GHG environmental external cost is much higher than the hub-and-spoke network. In view of the impact of passenger flow, the average GHG emission per passenger conveyed is 2.81 times higher at city-to-city network than that of hub-and-spoke network. Considering the transportation distance, the average GHG emission per pax km by city-to-city network is 5.80 times as that of hub-and-spoke network. However, when only considering the operating conditions of a certain type of airline network (a hub-and-spoke network or a city-to-city network), the situation will be different. In hub-and-spoke network, the average GHG emission per passenger km is 4.10, and the average GHG emission per passenger is 4.17, the former is 1.54% less than the latter. This is because the special components (collection, transfer, and distribution) in the hub-and-spoke network increases the passenger load factor, flight distance, and reduces the average GHG emission per passenger. Moreover, in the city-to-city network, the average GHG emission per passenger km is 2.04 times higher than the average GHG emission per passenger. The reason is that the city-to-city network needs direct flights and do not need additional transfer, and accumulates the flight distances between each city pair.
It is also suggested from
Table 6 that the hub-and-spoke network and the city-to-city network have a difference in aviation kerosene consumption and GHG average emission intensity. The former’s aviation kerosene consumption and the average GHG emission intensity are 6.71 × 10
4 tons and 63.67 kg/km, respectively. The latter’s aviation kerosene consumption and GHG average emission intensity are 1.88 × 10
5 kg and 178.72 kg/km, respectively. When considering the number of aircraft used in airlines network, the GHG emission intensity of city-to-city network is 10.81 times as that of hub-and-spoke network.
5. Sensitivity Analysis
In order to conduct a sensitivity analysis, we consider the changes in aircraft types to analyze the environmental impact and external costs of the two airline networks. Specific for: replacing A320 and B737 with aircraft types A319 and A321, and substituting A300-200, A300 with aircraft types B747, B777. Therefore, in the hub-and-spoke network, aircraft B747 and B777 are used in the transfer component, and aircraft A319 and A321 in the collection and distribution part. In the city-to-city network, each segment employs A319 and A321 to complete the flight. In the hub-and-spoke network, the numbers of A319, A321, B747, and B777 are 100, 85, 50, and 41, respectively. In the city-to-city network, the numbers of A319 and A321 are 210 and 156, respectively. The environmental impact, environmental external cost, and GHG emission parameters obtained by sensitivity analysis are depicted in
Table 7.
In
Table 7, the base case is the same as used in the computational example without sensitivity analysis. It can be seen that the environmental impact of the hub-and-spoke network (including fuel burn, toxic gas emissions, and GHG emissions) is smaller than that of the city-to-city network. In a horizontal comparison, in the hub-and-spoke network, the environmental impact caused by the substituted aircraft type is less than that of the base case. In the city-to-city network, except for HC emissions, other parameters, including fuel burn, toxic gases emissions, have severe environmental impacts than the hub-and-spoke network.
It is also suggested in
Table 7 that in the hub-and-spoke network, in addition to the external cost of CO emissions, the external costs of other pollutants (NO
x and HC) and GHG related parameters are lower than the city-to-city network. In a horizontal comparison, in the hub-and-spoke network, the environmental external costs caused by the substituting aircraft type are all smaller than the base case. In the city-to-city network, the external cost of CO, HC, and GHG are lower than the base case, and the environmental external costs of other pollutants and GHG related parameters are higher than those of the hub-and-spoke network.
In summary, whether in terms of environmental impact or environmental external costs, the hub-and-spoke network has less harmful than the city-to-city network. After the substituting of aircraft types, due to the difference in the number of aircraft seats and the reduced number of aircraft, which in turn has a certain impact on the airlines network.
6. Discussion and Conclusions
This research introduces alternative airline networks, builds a mathematical model to determine the location of the hub airport and allocate the airline connections. Through a mathematical model about the air transport, we quantify the impact of the environment (including fuel burn, toxic gases emissions, and GHG emission) associated with the network. In consideration of the operational benefits of airlines, we establish relevant formulas to measure the environmental externalities. Particularly, the pollutants in this study mainly including toxic gases (NOx, CO, and HC) and GHG (CO2). By comparing the hub-and-spoke network and the city-to-city network, we find that the former reduces NOx emissions, CO emissions, and HC emissions by 51.38%, 58.64%, and 64.10%, respectively. The former has lower fuel burn than the latter. The total GHG emission in total phase of city-to-city network is 2.81 times as the hub-and-spoke network and the former GHG environmental external cost is much higher than the latter. The average GHG emission per passenger conveyed (kg/pax) and the average GHG emission per pax km are 2.81 times and 5.8 times higher at the city-to-city network than that of the hub-and-spoke network. In general, the latter has less influence than the former in terms of environmental impact and environmental externality. The different structure of the airlines network is a reason for this effect. The hub-and-spoke network has its own unique characteristics. It is economical in scale at the hub airport, which makes the environmental impact less under the condition of ensuring the lowest passenger traffic flow cost. The city-to-city network employs direct flight between city pairs, which cannot meet the travel needs of all passengers, there is a need to increase the number of additional aircrafts to be used and that make a worse environmental impact. The variety in the scale of fleets is another reason for the difference in environmental impact and environmental externality. In the hub-and-spoke network, hub airports have adopted heavy aircraft with a larger number of seats, which has increased the passenger load factor, reduced passenger flow costs, lessened environmental impact and environmental externality. In the city-to-city network, light medium aircraft with a medium number of seats are used between cities. In order to meet the travel requirements among different cities, the number of aircraft will increase, and even some segments have low passenger load factors, which wastes fleet resources, enhances fuel burn and pollutant emissions, and increases the average GHG emissions per passenger/pax km.
During the operation of the aircraft, the fuel and the atmosphere are fully combusted in the combustion chamber to produce high-temperature gases, including NOx. However, when aviation fuel undergoes incomplete combustion, toxic gases such as CO and HC will also be emitted. It is known that NOx can stimulate the lungs, making it more difficult for people to resist respiratory diseases such as colds. Especially for asthma patients with respiratory problems, they are more susceptible to NO2. Moreover, NOx, mainly NO and NO2, are important factors in the formation of photochemical smog and acid rain. CO is toxic and can cause different degrees of poisoning to humans, and then harm the human brain, liver, and other organs or tissues, causing breathing difficulties and even death. HC and NOx will undergo a photochemical reaction when exposed to strong sunlight to produce peroxidation products, mainly ozone (O3) and aldehydes, called photochemical smog, which also has a serious impact on the atmospheric environment. Based on cases and sensitivity analysis, the pollutant emissions sequence of the hub-and-spoke network and the city-to-city network have a certain regularity. Sort according to the mass of emissions, we get the relevant situation of the pollutants in the two airline networks: the emissions mass of the order is NOx > CO > GHG > HC, and the emissions of NOx are about 3.3 times as much as CO. In terms of environmental external costs, the order is as follows: NOx > HC > GHG > CO. Therefore, when an airline is laying out its network, they should fully consider the environmental impact caused by aircraft operations. Moreover, under the premise of ensuring aviation safety, they are supposed to rationally arrange their fleet, make full use of the economies of scale of the airline network, and give priority to hub-and-spoke network under the same circumstances, which is better conform to the development trend of green aviation.
In summary, this study takes the environmental perspective as the point of penetration, and analyzes the impact and externality of environment on hub-and-spoke network, selects a city-to-city network for contrastive analysis. Further, the research of this topic points out the direction for airlines to better achieve environmental protection, and expedite related research and application in the field of civil aviation.


