
Dairy Buffalo Life Cycle Assessment (LCA) Affected by a Management Choice: The Production of Wheat Crop

 ,
,  ,
, 
 and
and 
Abstract
:1. Introduction
2. Materials and Methods
2.1. The Farms
2.2. Life Cycle Assessment (LCA) Methodology
2.2.1. Goal and Scope Definition
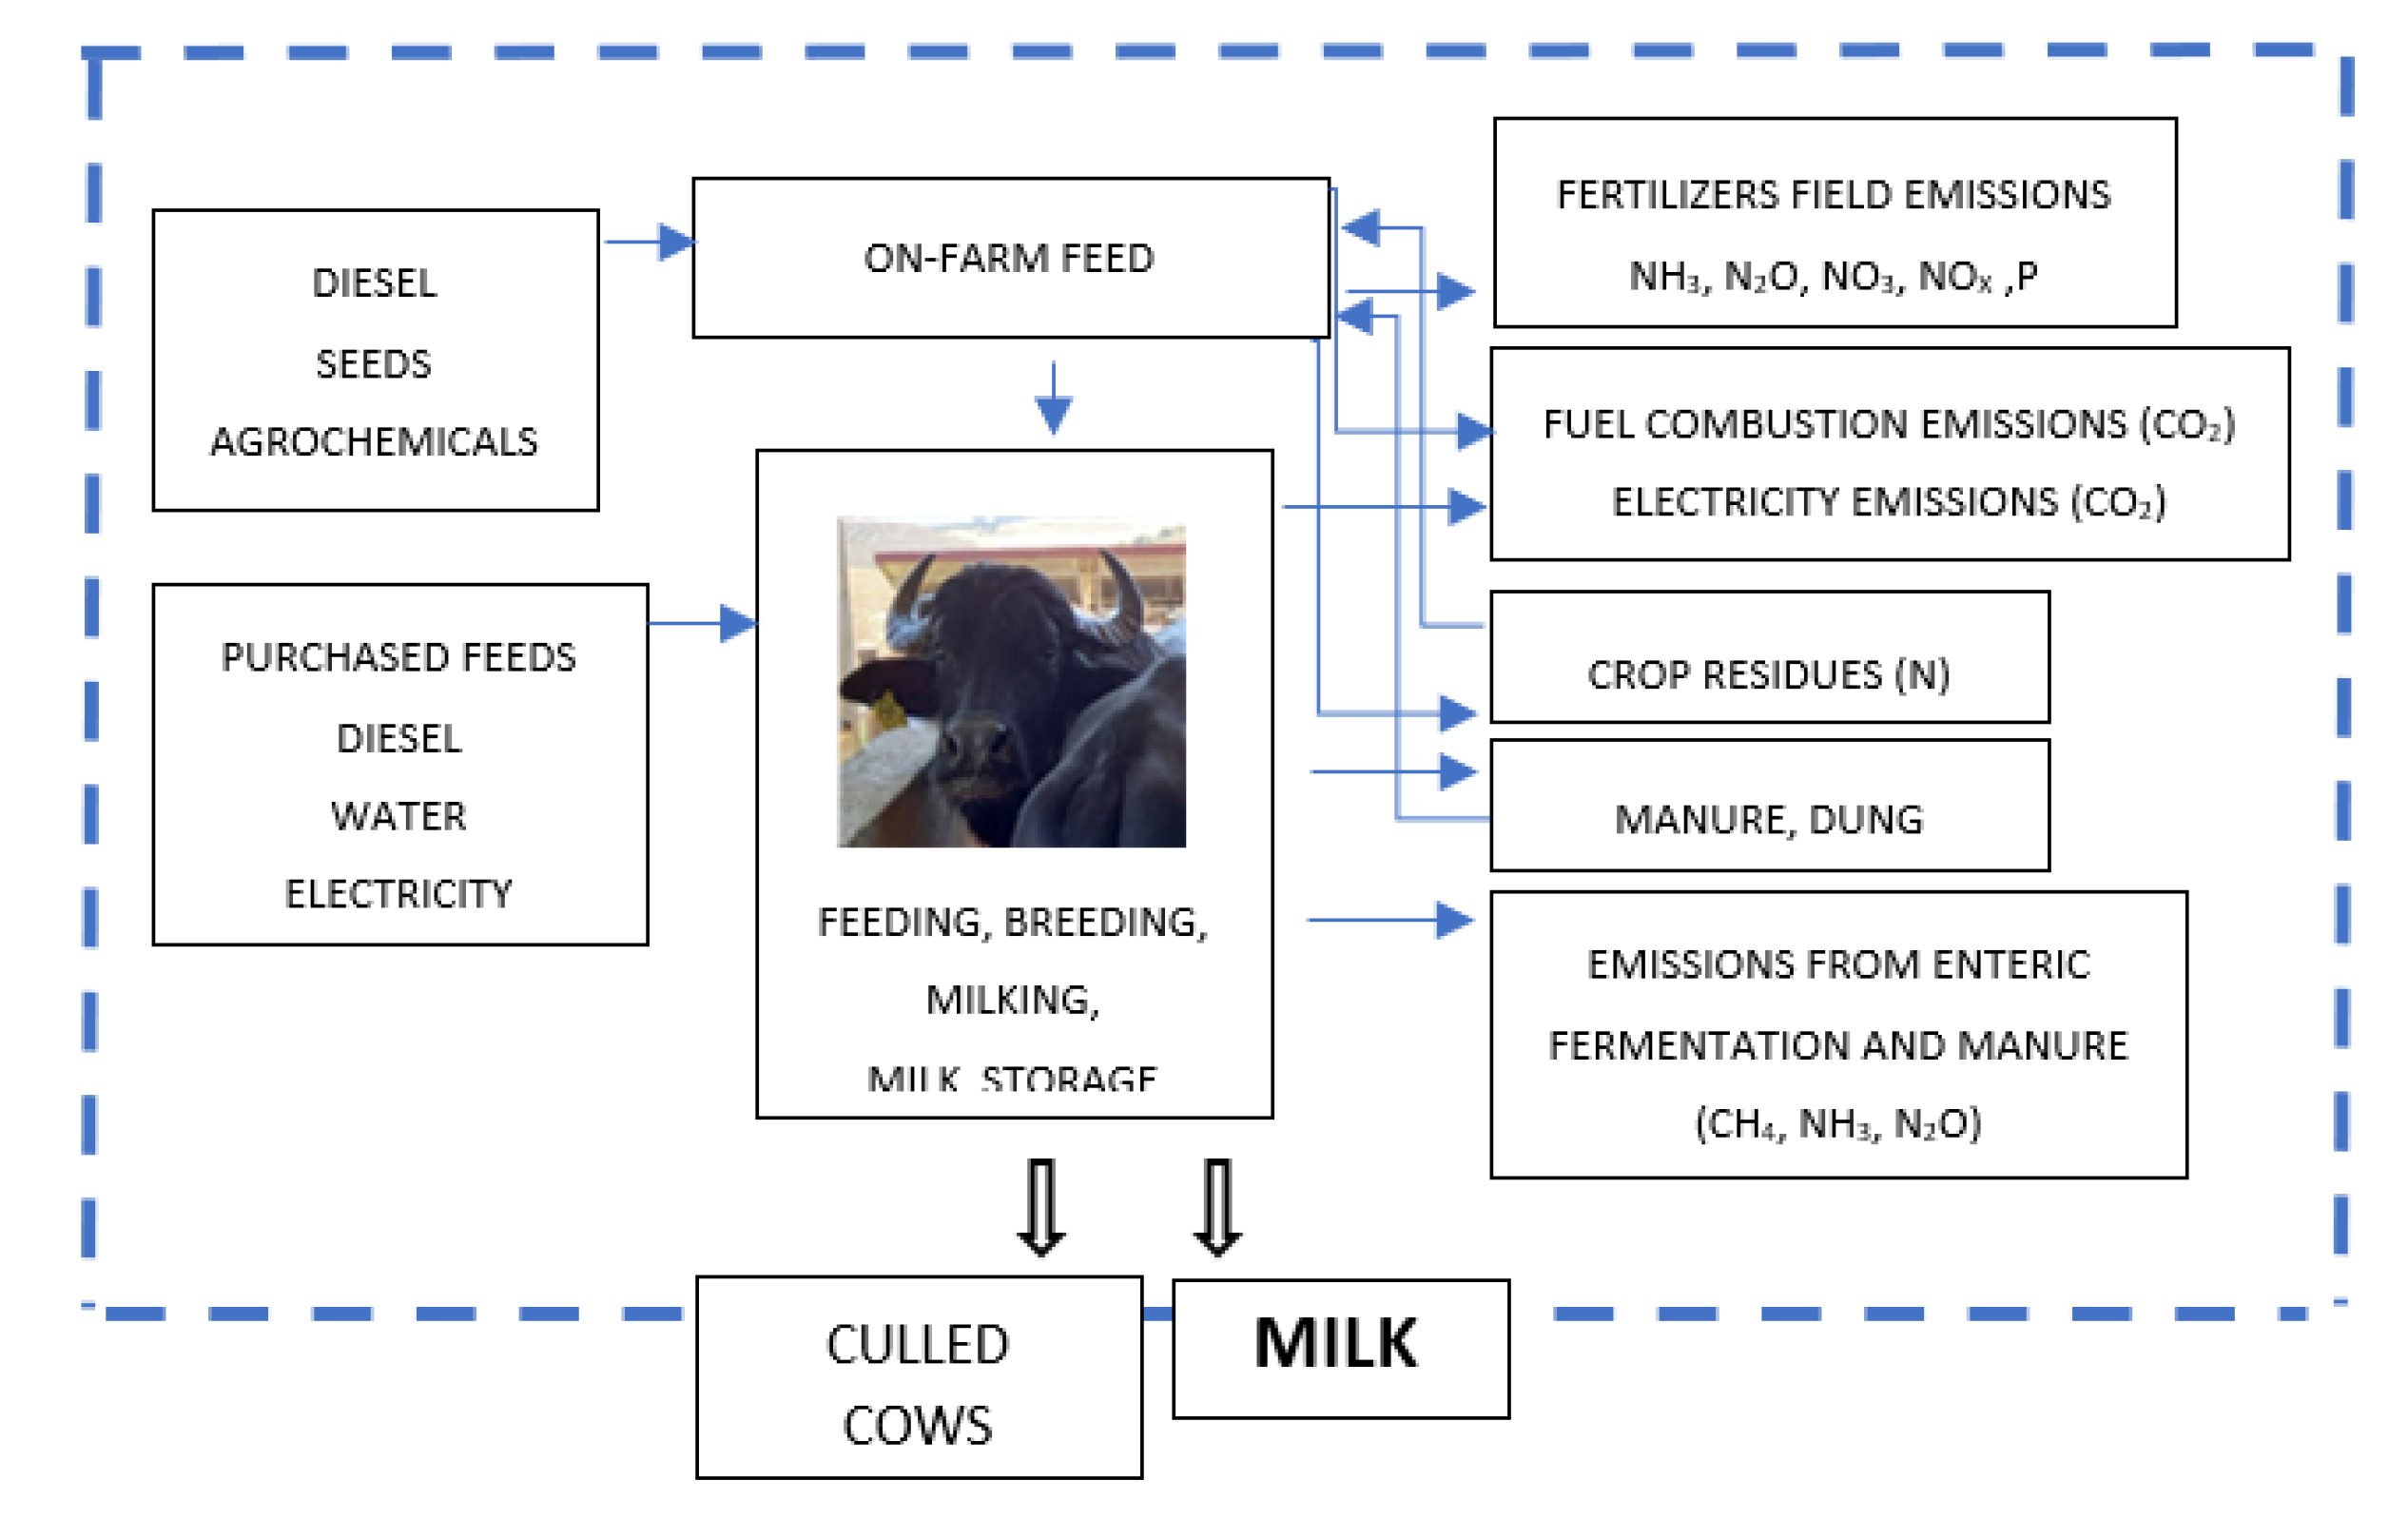
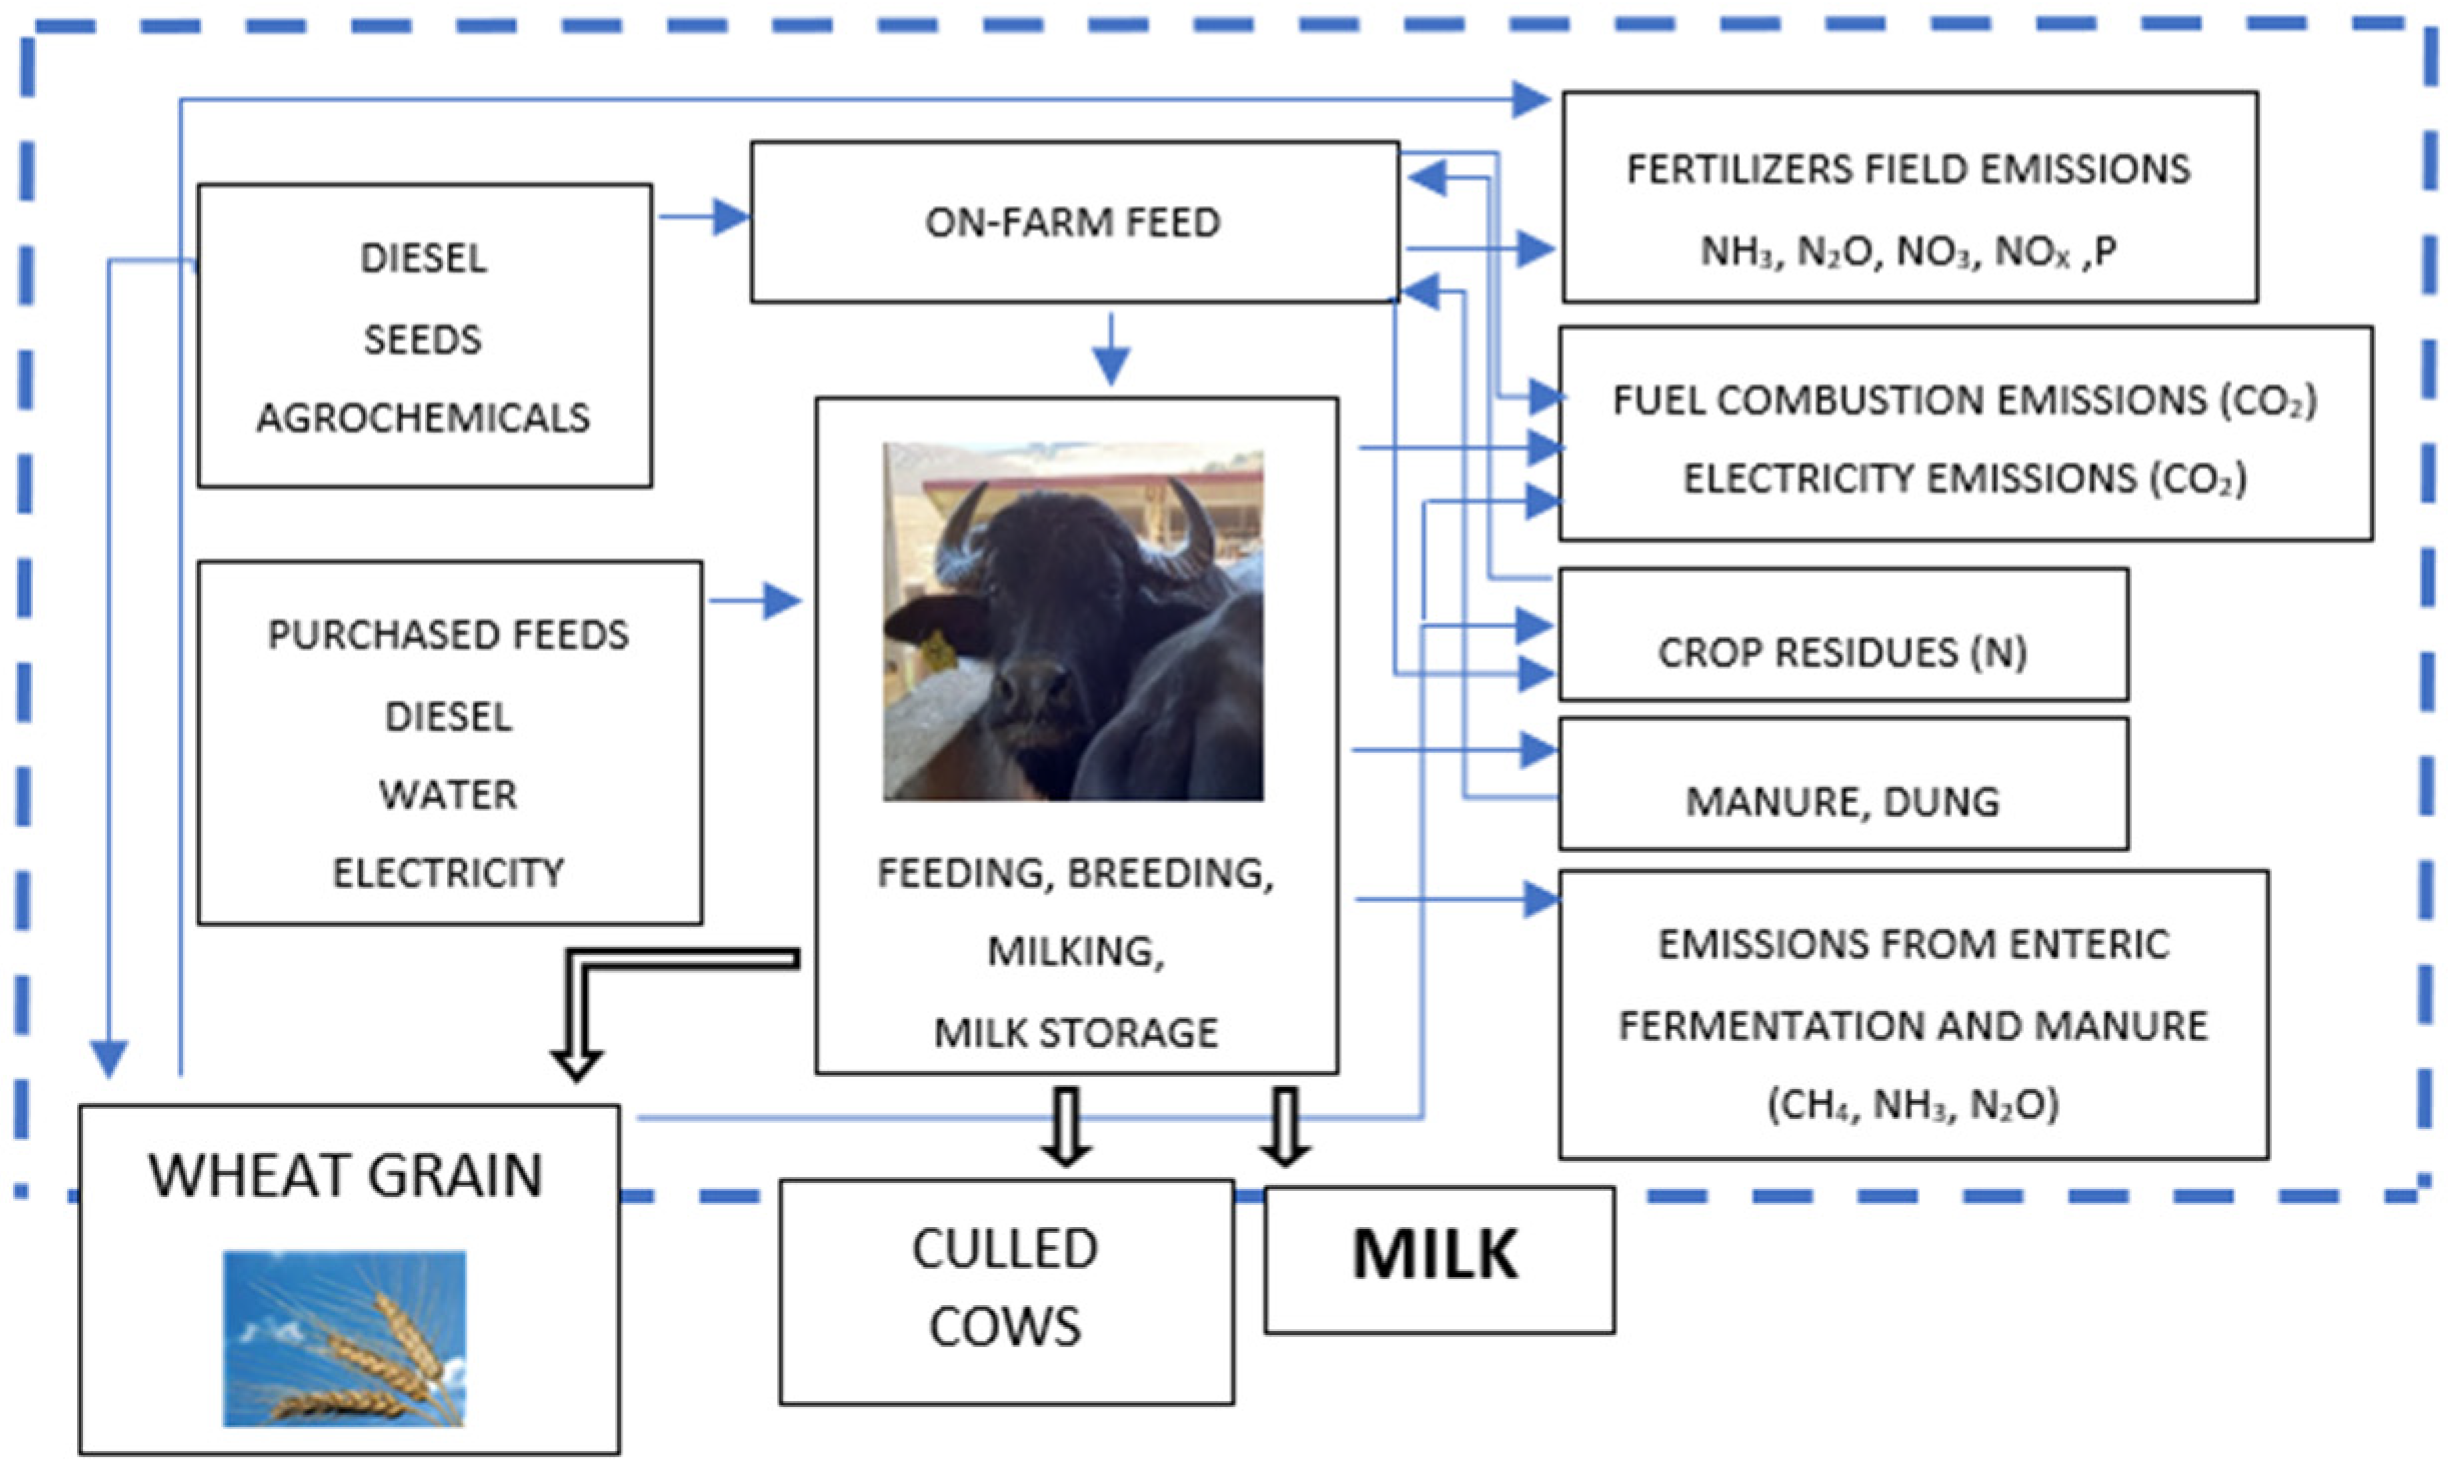
2.2.2. System Boundary Definition
2.2.3. Allocation Criterion
- A significant income in addition to milk.
- The wheat also provides straw, adopted as fodder (mainly for dry cows) and litter. The With Wheat Crop (WWC) farms benefit from full forage self-sufficiency.
2.2.4. Inventory Analysis and Input Data
2.3. Emissions
2.3.1. Enteric Emissions
2.3.2. Methane Emissions from Manure Management
2.3.3. N2O Emissions from Manure Management
Direct N2O Emissions
Indirect N2O Emissions
2.3.4. Ammonia
2.3.5. CO2 Emissions from Livestock, Emissions from Crop, Soil Residues and Synthetic Fertilizers
2.3.6. Emissions from Electricity and Diesel Fuel
2.4. Impact Assessment and Software
3. Statistical Analysis
4. Results and Discussion
4.1. Role of the Allocation
4.2. LCA Categories. Results and Discussion
5. Conclusions
Author Contributions
Funding
Institutional Review Board Statement
Informed Consent Statement
Data Availability Statement
- a)
- CLAL, 2019. Production of Mozzarella di Bufala Campana PDO. Italy. https://www.clal.it/index.php/section=mozzarella_bufala_campana (accessed on 5 August 2021).
- b)
- FAOSTAT, 2020. www.fao.org/faostat/en/#data (accessed on 5 August 2021).
- c)
- INRAE, www.inrae.fr. https://mediatheque.inrae.fr/ (accessed on 5 August 2021).
- d)
- ENAMA, 2005. Handbook of fuel consumption for agricultural subsidized use (Prontuario dei consumi di carburante per l’impiego agevolato in agricoltura). Available from: http://www.enama.it/php/pageflip.php_pdf_enama_int_prontuario.pdf&dir/it/pdf/monografie (accessed on 5 August 2021).
- e)
- R Core Team. R: A Language and Environment for Statistical Computing; R Foundation for Statistical Computing: Wien, Österreich, 2019; Available online: https://www.R-project.org/ (accessed on 15 August 2021).
- f)
- Laercio Junio da Silva. laercio: Duncan Test, Tukey Test and Scott-Knott Test. R Package Version 1.0-1. 2010. Available online: https://CRAN.R-project.org/package=laercio (accessed on 15 August 2021).
Acknowledgments
Conflicts of Interest
References
- Berlese, M.; Corazzin, M.; Bovolenta, S. Environmental sustainability assessment of buffalo mozzarella cheese production chain: A scenario analysis. J. Clean. Prod. 2019, 238, 117922. [Google Scholar] [CrossRef]
- Borghese, A. Buffalo livestock and products in Europe. Buffalo Bull. 2013, 32, 50–74. [Google Scholar]
- CLAL, 2019. Production of Mozzarella di Bufala Campana PDO. Italy. Available online: https://www.clal.it/index.php/section=mozzarella_bufala_campana (accessed on 5 August 2021).
- Sabia, E.; Napolitano, F.; Claps, S.; De Rosa, G.; Braghieri, A.; Pacelli, C. Dairy buffalo life cycle assessment as affected by heifer rearing system. J. Clean. Prod. 2018, 192, 647–655. [Google Scholar] [CrossRef]
- Pirlo, G. Cradle-to-farm gate analysis of milk carbon footprint: A descriptive review. Ital. J. Anim. Sci. 2012, 11, e20. [Google Scholar] [CrossRef]
- Mu, W.; Van Middelaar, C.E.; Bloemhof, J.M.; Engel, B.; De Boer, I.J.M. Benchmarking the environmental performance of specialized milk production systems: Selection of a set of indicators. Ecol. Indic. 2017, 72, 91–98. [Google Scholar] [CrossRef]
- Romano, E.; Roma, R.; Tidona, F.; Giraffa, G.; Bragaglio, A. Dairy farms and Life Cycle Assessment (LCA). The allocation criterion useful to estimate undesirable products. Sustainability 2021, 13, 4354. [Google Scholar] [CrossRef]
- ISO 14040, Environmental Management—Life Cycle Assessment—Principles and Framework; International Organization for Standardization ISO Central Secretariat Chemin de Blandonnet, 8CP 401—1214 Vernier; ISO: Geneva, Switzerland, 2006.
- ISO 14044, Environmental Management—Life Cycle Assessment—Requirements and Guidelines; International Organization for Standardization ISO Central Secretariat Chemin de Blandonnet, 8CP 401—1214 Vernier; ISO: Geneva, Switzerland, 2006.
- Di Palo, R. Produzione di Latte Nella Bufala con Diete Tradizionali e con l’impiego di Acidi Grassi. Ph.D. Thesis, University of Naples, Naples, Italy, 1992. [Google Scholar]
- Pirlo, G.; Carè, S.; Fantin, V.; Buttol, P.; Terzano, G.M.; Masoni, P.; Pacelli, C. Factors affecting life cycle assessment of milk produced on 6 Mediterranean buffalo farms. J. Dairy Sci. 2014, 97, 6583–6593. [Google Scholar] [CrossRef]
- PRe Consultants, 2013. Introduction to LCA with SimaPro. Available online: www.pre-sustainability.com/download/SimaPro8IntroductionToLCA.pdf (accessed on 16 August 2021).
- Bragaglio, A.; Napolitano, F.; Pacelli, C.; Pirlo, G.; Sabia, E.; Serrapica, F.; Serrapica, M.; Braghieri, A. Environmental impacts of Italian beef production: A comparison between different systems. J. Clean. Prod. 2018, 172, 4033–4043. [Google Scholar] [CrossRef]
- FAOSTAT. 2020. Available online: www.faofaostat/en/#data (accessed on 5 August 2021).
- Nguyen, T.L.T.; Hermansen, J.E.; Mogensen, L. Environmental consequences of different beef production systems in the EU. J. Clean. Prod. 2010, 18, 756–766. [Google Scholar] [CrossRef]
- IPCC. Chapter 10: Emissions from livestock and manure management. In Agriculture, Forestry and Other Land Use; Refinement to the 2006 IPCC Guidelines for National Greenhouse Gas Inventories; IPCC: Geneva, Switzerland, 2019; Volume 4, pp. 1–87. Available online: https://www.ipcc-nggip.iges.or.jp/public/2019rf/pdf/4_Volume4/19R_V4_Ch10_Livestock.pdf (accessed on 5 August 2021).
- IPCC. Chapter 11: N2O emissions from managed soils, and CO2 emissions from lime and urea application. In Agriculture, Forestry and Other Land Use; Refinement to the 2006 IPCC Guidelines for National Greenhouse Gas Inventories; IPCC: Geneva, Switzerland, 2019; Volume 4, pp. 1–54. Available online: https://www.ipcc_nggip.iges.or.jp/public/2019rf/pdf/4_Volume4/19R_V4_Ch11_Soils_N2O_CO2.pdf (accessed on 5 August 2021).
- INRAE. Available online: www.inrae.fr. https://mediatheque.inrae.fr/ (accessed on 5 August 2021).
- Singh, K.; Kundu, S.S.; Kushwaha, B.P.; Maity, S.B. Dietary energy levels response on nutrient utilization, nitrogen balance and growth in Bhadawari buffalo calves. Livest. Res. Rural Dev. 2009, 21, 8. [Google Scholar]
- Neglia, G.; Balestrieri, A.; Gasparrini, B.; Cutrignelli, M.I.; Bifulco, G.; Salzano, A.; Cimmino, R.; Varricchio, E.; D’Occhio, M.J.; Campanile, G. Nitrogen and Phosphorus Utilisation and Excretion in Dairy Buffalo Intensive Breeding. Ital. J. Anim. Sci. 2014, 13, 3362. [Google Scholar] [CrossRef] [Green Version]
- Patra, A.K.; Pal, K.; Lalhriatpuii, M. Prediction of nitrogen excretion in buffalo production systems using dietary and animal variables. Agric. Syst. 2020, 182, 102845. [Google Scholar] [CrossRef]
- Addison, P.F.E.; De Bie, K.; Rumpff, L. Setting conservation management thresholds using a novel participatory modeling approach. Conserv. Biol. 2015, 29, 1411–1422. [Google Scholar] [CrossRef] [PubMed] [Green Version]
- ENAMA. Handbook of Fuel Consumption for Agricultural Subsidized Use (Prontuario dei Consumi di Carburante per L’impiego Agevolato in Agricoltura). 2005. Available online: http://www.enama.it/php/pageflip.php_pdf_enama_int_prontuario.pdf& dir/it/pdf/monografie (accessed on 5 August 2021).
- Bragaglio, A.; Braghieri, A.; Pacelli, C.; Napolitano, F. Environmental impacts of beef as corrected for the provision of ecosystem services. Sustainability 2020, 12, 3828. [Google Scholar] [CrossRef]
- Huijbregts, M. Life-cycle Impact Assessment of Acidifying and Eutrophying Air Pollutants. Calculation of Equivalency Factors with RAINS-LCA; Interfaculty Department of Environmental Science, Faculty of Environmental Science, University of Amsterdam: Amsterdam, The Netherlands, 1999. [Google Scholar]
- Heijungs, R.; Guinee, J.B.; Huppes, G.; Lankreijer, R.M.; Udo de Haes, H.A.; Wegener-Sleeswijk, A.; Ansems, A.M.M.; Eggels, P.G.; van Duin, R.; de Goede, H.P. Environmental Life Cycle Assessment of Products: Guide and Backgrounds; Centre of Environmental Science (CML), Leiden University: Leiden, The Netherlands, 1992; Available online: http://hdl.handle.net/1887/8061 (accessed on 16 August 2019).
- Gerssen-Gondelach, S.J.; Lauwerijssen, R.B.G.; Havlík, P.; Herrero, M.; Valin, H.; Faaij, A.P.C.; Wicke, B. Intensification pathways for beef and dairy cattle production systems: Impacts on GHG emissions, land occupation and land use change. Agric. Ecosyst. Environ. 2017, 240, 135–147. [Google Scholar] [CrossRef]
- Hoekstra, A.Y. A critique on the water-scarcity weighted water footprint in LCA. Ecol. Indic. 2016, 66, 564–573. [Google Scholar] [CrossRef] [Green Version]
- Hoekstra, A.Y. Water Footprint Assessment: Evolvement of a New Research Field. Water Resour. Manag. 2017, 31, 3061–3081. [Google Scholar] [CrossRef] [Green Version]
- R Core Team. R: A Language and Environment for Statistical Computing; R Foundation for Statistical Computing: Wien, Österreich, 2019; Available online: https://www.R-project.org/ (accessed on 15 August 2021).
- Da Silva, J.L.; Duncan Test, Tukey Test and Scott-Knott Test. R Package Version 1.0-1. 2010. Available online: https://CRAN.R-project.org/package=laercio (accessed on 15 August 2021).
- De Assis Santos e Silva, F.; De Azevedo, C.A.V. Comparison of means of agricultural experimentation data through different tests using the software Assistat. Afr. J. Agric. Res. 2016, 11, 3527–3531. [Google Scholar] [CrossRef]
- Cederberg, C.; Stadig, M. System expansion and allocation in life cycle assessment of milk and beef production. Int. J. Life Cycle Assess. 2003, 8, 350–356. [Google Scholar] [CrossRef]
- Pirlo, G.; Lolli, S. Environmental impact of milk production from samples of organic and conventional farms in Lombardy (Italy). J. Clean. Prod. 2019, 211, 962–971. [Google Scholar] [CrossRef]
- Mahath, C.S.; Mophin Kani, K.; Dubey, B. Gate-to-gate environmental impacts of dairy processing products in Thiruvananthapuram. India Resour. Conserv. Recycl. 2019, 141, 40–53. [Google Scholar] [CrossRef]
- EIP-AGRI Focus Group. Profitability of Permanent Grassland. How to Manage Permanent Grassland in a Way That Combines Profitability, Carbon Sequestration and Biodiversity. 2014. Available online: http://ec. europa.eu/eip/agriculture/sites/agrieip/files/fg9_permanent_grassland_profitability_starting_ paper_2014_en.pdf (accessed on 16 August 2019).
- Lal, R. Soil carbon sequestration impacts on global climate change and food security. Science 2004, 304, 1623–1627. [Google Scholar] [CrossRef] [Green Version]
- Braghieri, A.; Pacelli, C.; Bragaglio, A.; Sabia, E.; Pacelli, C. The hidden costs of livestock environmental sustainability: The case of Podolian cattle. In The Sustainability of Agro-Food and Natural Resource Systems in the Mediterranean Basin; Vastola, A., Ed.; Springer: Cham, Switzerland, 2015. [Google Scholar] [CrossRef] [Green Version]
- Gerber, P.; Vellinga, T.; Opio, C.; Steinfeld, H. Productivity gains and greenhouse gas emissions intensity in dairy systems. Livest. Sci. 2011, 139, 100–108. [Google Scholar] [CrossRef]
- Guerci, M.; Knudsen Trydeman, M.; Bava, L.; Zucali, M.; Schönbach, P.; Kristensen, T. Parameters affecting the environmental impact of a range of dairy farming systems in Denmark, Germany and Italy. J. Clean. Prod. 2013, 5, 133–141. [Google Scholar] [CrossRef]
- Sabia, E.; Napolitano, F.; Claps, S.; De Rosa, G.; Barile, V.L.; Braghieri, A.; Pacelli, C. Environmental impact of dairy buffalo heifers kept on pasture or in confinement. Agric. Syst. 2018, 159, 42–49. [Google Scholar] [CrossRef]
- Baldini, C.; Bava, L.; Zucali, M.; Guarino, M. Milk production Life Cycle Assessment: A comparison between estimated and measured emission inventory for manure handling. Sci. Total Environ. 2018, 625, 209–219. [Google Scholar] [CrossRef] [PubMed]
- Bartl, K.; Gomez, C.A.; Nemecek, T. Life cycle assessment of milk produced in two smallholder dairy systems in the highlands and the coast of Peru. J. Clean. Prod. 2011, 13, 1494–1505. [Google Scholar] [CrossRef]
- Battini, F.; Agostini, A.; Tabaglio, V.; Amaducci, S. Environmental impacts of different dairy farming systems in the Po Valley. J. Clean. Prod. 2016, 112, 91–102. [Google Scholar] [CrossRef]
- De Boer, I.J.M.; Hoving, I.E.; Vellinga, T.V.; Van de Wen, G.W.J.; Leffelaar, P.A.; Gerber, P.J. Assessing environmental impacts associated with freshwater consumption along the life cycle of animal products: The case of Dutch milk production in Noord-Brabant. Int. J. Life Cycle Assess. 2013, 18, 193–203. [Google Scholar] [CrossRef] [Green Version]
- Mekonnen, M.M.; Hoekstra, A.Y. A Global Assessment of the Water Footprint of Farm Animal Products. Ecosystems 2012, 15, 401–415. [Google Scholar] [CrossRef] [Green Version]
- Mekonnen, M.M.; Hoekstra, A.Y. The green, blue and grey water footprint of crops and derived crop products. Hydrol. Earth Syst. Sci. 2011, 15, 1577–1600. [Google Scholar] [CrossRef] [Green Version]
- Noya, I.; González-García, S.; Berzosa, J.; Baucells, F.; Feijoo, G.; Moreira, M.T. Environmental and water sustainability of milk production in Northeast Spain. Sci. Total Environ. 2018, 616–617, 1317–1329. [Google Scholar] [CrossRef] [PubMed]
- Cosentino, C.; Adduci, F.; Musto, M.; Paolino, R.; Freschi, P.; Pecora, G.; D’Adamo, C.; Valentini, V. Low vs high “water footprint assessment” diet in milk production: A comparison between triticale and corn silage based diets. Emir. J. Food Agric. 2015, 27, 312–317. [Google Scholar] [CrossRef] [Green Version]
- Freschi, P.; Musto, M.; Paolino, R.; Cosentino, C. Grazing and biodiversity conservation: Highlights on a natura 2000 network site. In The Sustainability of Agro-Food and Natural Resource Systems in the Mediterranean Basin; Vastola, A., Ed.; Springer International Publishing AG: Basel, Switzerland, 2015; pp. 271–288. [Google Scholar] [CrossRef] [Green Version]


| No Wheat Crop (NWC) | With Wheat Crop (WWC) | |||||
|---|---|---|---|---|---|---|
| NWC1 | NWC2 | NWC3 | WWC1 | WWC2 | WWC3 | |
| Geographical place (Province) | Foggia | Potenza | Potenza | Matera | Foggia | Foggia |
| Total crop area, Ha | 20 | 65 | 80 | 65 | 225 | 270 |
| Hay, Ha | 20 | 50 | 40 | 40 | 50 | 140 |
| Barley, Ha | - | - | 10 | - | - | - |
| Maize silage, Ha | - | 15 | 30 | - | 15 | 15 |
| Maize grain, Ha | - | - | - | - | 10 | 20 |
| Wheat, Ha | - | - | - | 25 | 150 | 95 |
| Herd, heads n. | 197 | 303 | 446 | 203 | 479 | 613 |
| Lactating cows, n. | 60 | 120 | 150 | 52 | 160 | 185 |
| Dry cows, n. | 25 | 50 | 80 | 60 | 180 | 185 |
| Heifers, n. | 90 | 80 | 185 | 50 | 100 | 175 |
| Young < 365 days, n. | 20 | 45 | 25 | 35 | 30 | 60 |
| Bulls, n. | 2 | 8 | 6 | 6 | 9 | 8 |
| Urea, t y−1 | - | 10.0 | 20.0 | 37.5 | 45.0 | 59.5 |
| Ammonium nitrate, t y−1 | - | - | 7.0 | - | - | - |
| Phosphate, t y−1 | - | - | - | - | 0.8 | 1.6 |
| Potassium chloride, t y−1 | - | - | 5.2 | - | - | - |
| Concrete area (shed, services), m2 | 1500 | 4000 | 3500 | 1000 | 6000 | 11,000 |
| Milking parlor size, m2 | 200 | 200 | 400 | 150 | 300 | 300 |
| Milk tank, liters | 1400 | 6000 | 5000 | 2500 | 4000 | 6000 |
| Diesel, liters y−1 | 18,800 | 23,500 | 76,500 | 21,200 | 64,700 | 70,500 |
| Electricity, kWh y−1 | 45,700 | 65,000 | 97,000 | 50,000 | 76,000 | 87,600 |
| Item | Unit | NWC1 | NWC2 | NWC3 | WWC1 | WWC2 | WWC3 |
|---|---|---|---|---|---|---|---|
| FPCM yield | kg/year | 254,405 | 370,400 | 481,800 | 146,000 | 438,000 | 474,850 |
| Average FPCM per lactation * | kg/head | 3137 | 3087 | 2374 | 2076 | 2025 | 1897 |
| Fat mean ± SD | % | 7.38 ± 0.31 | 7.46 ± 0.45 | 7.83 ± 0.40 | 7.54 ± 0.41 | 8.30 ± 0.41 | 8.57 ± 0.53 |
| Protein mean ± SD | % | 4.63 ± 0.12 | 4.25 ± 0.16 | 4.48 ± 0.07 | 4.42 ± 0.21 | 4.65 ± 0.09 | 4.68 ± 0.14 |
| Bacterial count mean ± SD | cfu/mL | 76,670 ± 50,796 | 316,224 ± 25,215 | 131,667 ± 113,900 | 91,167 ± 37,649 | 73,077 ± 67,661 | 97,947 ± 47,339 |
| NWC1 | NWC2 | NWC3 | ||||||||||
|---|---|---|---|---|---|---|---|---|---|---|---|---|
| Category | LC | DC | HF | YA | LC | DC | HF | YA | LC | DC | HF | YA |
| Forage kg/head/day | ||||||||||||
| Meadow hay | 8.0 | 5.5 | 3.5 | 2.0 | 10.0 | 7.0 | 5.0 | 3.0 | 3.2 | - | 3.2 | 1.5 |
| Alfalfa hay | 2.0 | - | 1.8 | - | - | - | - | - | - | - | - | - |
| Straw | - | 5.5 | - | - | - | 4.0 | 2.0 | 1.0 | - | 7.0 | 2.0 | - |
| Maize silage | - | - | - | - | 8.0 | 5.0 | 3.0 | 2.0 | 19.0 | 6.0 | 13.0 | 2.0 |
| Raw concentrate kg/head/day | ||||||||||||
| Maize flour/grain | 4.0 | - | 1.3 | - | - | - | - | - | 4.0 | - | - | 0.5 |
| Barley | 1.5 | - | 0.4 | 1.0 | - | - | - | - | 2.0 | 2.0 | - | 1.0 |
| Soybean meal | 1.1 | - | - | - | - | - | - | - | - | - | - | - |
| Wheat flour shorts | - | 2.0 | - | - | - | - | - | - | - | - | - | - |
| Market concentrate g/head/day | ||||||||||||
| Soybean seeds (roasted) | 310 | - | - | - | - | - | - | - | - | - | - | - |
| Soybean seeds (dehulled/flaked) | 240 | - | 480 | 400 | 2600 | - | 800 | 400 | 1650 | 260 | 200 | 150 |
| Sunflower meal | 480 | - | 440 | 360 | 2000 | - | 600 | 260 | 450 | 380 | 300 | 220 |
| Cotton seeds | 540 | - | - | - | 1600 | - | 500 | 220 | 450 | - | - | - |
| Maize flour | 450 | - | - | - | 300 | - | 100 | 80 | - | 130 | 100 | - |
| Fava bean # | 480 | - | - | - | - | - | - | - | - | - | - | - |
| Wheat flour shorts | 280 | - | 480 | 400 | - | - | - | - | - | 700 | 560 | 80 |
| Beet pulp | 280 | - | - | - | - | - | - | - | - | - | - | 350 |
| Linseeds | 240 | - | - | - | - | - | - | - | - | - | - | - |
| Wheat flour | 220 | - | - | - | - | - | - | - | - | - | - | - |
| Bran | - | - | 440 | 360 | - | - | - | - | 800 | 680 | 540 | 400 |
| Maize germ meal | - | - | 220 | 180 | - | - | - | - | - | 130 | 100 | - |
| Maize distillers | - | - | 60 | 50 | - | - | - | - | 800 | 130 | 100 | 80 |
| Palm oil | 60 | - | - | - | - | - | - | - | - | - | - | - |
| Molasses | 50 | - | 60 | 50 | - | - | - | - | - | 130 | 100 | 80 |
| Chemical composition (%) | ||||||||||||
| Dry matter (DM) * | 17.8 | 11.7 | 8.2 | 4.4 | 18.1 | 11.4 | 8.3 | 5.0 | 18.2 | 12.1 | 10.5 | 4.6 |
| Crude protein (%DM) | 12.45 | 9.65 | 15.50 | 15.00 | 14.00 | 9.70 | 12.35 | 14.20 | 14.25 | 9.05 | 11.80 | 14.50 |
| Ether extract (%DM) | 5.80 | 3.50 | 3.45 | 3.70 | 3.15 | 2.75 | 2.90 | 3.40 | 4.40 | 3.25 | 3.15 | 4.15 |
| Crude fiber (%DM) | 22.70 | 36.60 | 28.00 | 18.70 | 27.60 | 35.90 | 26.65 | 32.20 | 21.40 | 29.85 | 25.20 | 18.95 |
| Ash (%DM) | 7.60 | 7.00 | 8.35 | 8.35 | 7.25 | 3.90 | 5.45 | 4.10 | 7.20 | 7.05 | 7.45 | 6.75 |
| WWC1 | WWC2 | WWC3 | ||||||||||
|---|---|---|---|---|---|---|---|---|---|---|---|---|
| Category | LC | DC | HF | YA | LC | DC | HF | YA | LC | DC | HF | YA |
| Feed kg/head/day | ||||||||||||
| Oat hay | - | - | - | - | 3.0 | - | 1.5 | 2.0 | 3.5 | 8.0 | 10.0 | 3.5 |
| Mixed meadow hay § | 10.0 | - | 5.0 | 2.8 | - | - | - | - | - | - | - | - |
| Straw | - | 7.5 | - | - | 1.5 | 8.5 | 2.0 | 1.0 | 2.0 | 3.0 | - | - |
| Maize silage | - | - | - | - | 15.0 | - | 3.0 | 1.5 | 15.0 | - | - | - |
| Raw concentrate kg/head/day | ||||||||||||
| Maize grain/flour | - | - | - | - | 6.5 | 2.0 | 4.0 | 1.0 | 4.0 | - | - | - |
| Barley | - | - | - | - | - | - | - | - | - | - | - | - |
| Soybean meal | - | - | - | - | 2.9 | 0.8 | 2.0 | 0.5 | 1.0 | - | - | - |
| Fava bean # | - | - | - | - | - | - | - | - | 2.0 | - | - | - |
| Pea ‡ | - | - | - | - | - | - | - | - | 1.0 | - | - | - |
| Market concentrate g/head/day | ||||||||||||
| Maize flour | 3200 | 750 | 1100 | 660 | - | - | - | - | - | - | - | 400 |
| Soybean seeds (dehulled/flaked) | 1800 | 400 | 400 | 240 | - | - | - | - | - | - | - | 100 |
| Soybean seeds (roasted) | - | - | 1100 | 660 | - | - | - | - | - | - | - | 80 |
| Barley | 1400 | - | - | - | - | - | - | - | - | - | - | - |
| Molasses | 400 | 50 | 120 | 70 | - | - | - | - | - | - | - | 50 |
| Bran | 200 | 900 | 360 | 220 | - | - | - | - | - | - | - | 270 |
| Palm oil | 100 | - | - | - | - | - | - | - | - | - | - | - |
| Sunflower meal | - | 300 | - | - | - | - | - | - | - | - | - | 250 |
| Beet pulp | - | 100 | 900 | 550 | - | - | - | - | - | - | - | - |
| Wheat flour shorts | - | - | - | - | - | - | - | - | - | - | - | 380 |
| Chemical composition (%) | ||||||||||||
| Dry matter (DM) * | 16.0 | 9.5 | 7.9 | 4.6 | 17.5 | 10.3 | 9.6 | 4.5 | 17.1 | 9.8 | 8.9 | 4.5 |
| Crude protein (%DM) | 13.50 | 8.20 | 12.15 | 12.40 | 14.10 | 8.30 | 14.55 | 12.60 | 13.30 | 9.90 | 12.00 | 13.80 |
| Ether extract (%DM) | 3.60 | 2.15 | 3.20 | 3.30 | 5.30 | 3.40 | 5.75 | 5.55 | 4.30 | 2.75 | 3.00 | 3.45 |
| Crude fiber (%DM) | 22.25 | 32.60 | 22.20 | 21.80 | 22.30 | 33.50 | 21.60 | 23.00 | 25.35 | 36.70 | 35.00 | 29.65 |
| Ash (%DM) | 4.85 | 5.80 | 4.25 | 4.25 | 5.20 | 4.25 | 4.90 | 5.00 | 5.15 | 3.30 | 3.00 | 4.10 |
| Category | Main Elementary Flow | Characterization Factor | Source |
|---|---|---|---|
| Global Warming Potential, kg CO2 eq | CO2 | 1 | |
| CH4 | 28 | IPCC 2019 [15] | |
| N2O | 265 | ||
| Acidification, kg SO2 eq | NH3 | 1.6 | |
| NOx | 0.76 | Huijbregts 1999 [25] | |
| SO2 | 1.2 | ||
| Eutrophication, kg PO43 eq | NO3 | 0.1 | |
| P2O3 | 3.06 | Heijungs et al. 1992 [26] |
| NWC1 | NWC2 | NWC3 | NWC Mean | WWC1 | WWC2 | WWC3 | WWC Mean | |
|---|---|---|---|---|---|---|---|---|
| Milk income EUR/kg | 1.60 | 1.60 | 1.55 | 1.58 | 1.50 | 1.50 | 1.60 | 1.53 |
| Milk yield/year kg | 254,405 | 370,400 | 481,800 | 368,868 | 146,000 | 438,000 | 470,850 | 351,617 |
| Total milk income EUR | 407,050 | 592,640 | 746790 | 582,160 | 219,000 | 657,000 | 752930 | 542,977 |
| Wheat income EUR/kg | - | - | - | - | 0.33 | 0.30 | 0.27 | 0.30 |
| Wheat yield/year kg | - | - | - | - | 75,000 | 450,000 | 332,000 | 285,670 |
| Total wheat income EUR | - | - | - | - | 24,750 | 135,000 | 89,775 | 83,175 |
| Culled cows income EUR/head | 300 | 300 | 300 | 300 | 300 | 300 | 300 | 300 |
| Culled cows head/year | 8 | 20 | 25 | 18 | 5 | 16 | 16 | 12 |
| Total culled cows income EUR | 2400 | 6000 | 7500 | 5300 | 1500 | 4800 | 4800 | 3700 |
| Milk income % | 99.41 | 99.00 | 99.01 | 99.14 | 89.30 | 82.45 | 88.85 | 86.86 |
| Wheat income % | 0.00 | 0.00 | 0.00 | 0.00 | 10.09 | 16.94 | 10.59 | 12.54 |
| Culled cows income % | 0.59 | 1.00 | 0.99 | 0.86 | 0.61 | 0.60 | 0.57 | 0.59 |
| SYSTEM | FARMS | GWP kg CO2 eq | AC g SO2 eq | EU g PO43-eq | ALO m2y−1 | WD m3 |
|---|---|---|---|---|---|---|
| No Wheat Crop | NWC1 | 4.65 | 50.23 | 13.27 | 8.52 | 2.26 |
| NWC2 | 5.14 | 39.96 | 14.42 | 10.64 | 1.55 | |
| NWC3 | 4.95 | 37.81 | 15.62 | 11.56 | 1.56 | |
| mean NWC | 4.91a | 42.66a | 14.43a | 10.24b | 1.79a | |
| standard deviation | 0.24 | 6.63 | 1.17 | 1.56 | 0.41 | |
| With Wheat Crop | WWC1 | 5.30 | 38.07 | 11.73 | 13.70 | 1.84 |
| WWC2 | 5.51 | 30.75 | 11.21 | 15.69 | 1.57 | |
| WWC3 | 4.75 | 39.24 | 12.17 | 15.04 | 1.65 | |
| mean WWC | 5.19a | 36.02a | 11.70b | 14.81a | 1.69a | |
| standard deviation | 0.39 | 4.60 | 0.48 | 1.01 | 0.14 |
Publisher’s Note: MDPI stays neutral with regard to jurisdictional claims in published maps and institutional affiliations. |
© 2021 by the authors. Licensee MDPI, Basel, Switzerland. This article is an open access article distributed under the terms and conditions of the Creative Commons Attribution (CC BY) license (https://creativecommons.org/licenses/by/4.0/).
Share and Cite
Romano, E.; De Palo, P.; Tidona, F.; Maggiolino, A.; Bragaglio, A. Dairy Buffalo Life Cycle Assessment (LCA) Affected by a Management Choice: The Production of Wheat Crop. Sustainability 2021, 13, 11108. https://doi.org/10.3390/su131911108
Romano E, De Palo P, Tidona F, Maggiolino A, Bragaglio A. Dairy Buffalo Life Cycle Assessment (LCA) Affected by a Management Choice: The Production of Wheat Crop. Sustainability. 2021; 13(19):11108. https://doi.org/10.3390/su131911108
Chicago/Turabian StyleRomano, Elio, Pasquale De Palo, Flavio Tidona, Aristide Maggiolino, and Andrea Bragaglio. 2021. "Dairy Buffalo Life Cycle Assessment (LCA) Affected by a Management Choice: The Production of Wheat Crop" Sustainability 13, no. 19: 11108. https://doi.org/10.3390/su131911108
APA StyleRomano, E., De Palo, P., Tidona, F., Maggiolino, A., & Bragaglio, A. (2021). Dairy Buffalo Life Cycle Assessment (LCA) Affected by a Management Choice: The Production of Wheat Crop. Sustainability, 13(19), 11108. https://doi.org/10.3390/su131911108