Article

Assessment of Water Quality Target Attainment and Influencing Factors Using the Multivariate Log-Linear Model in the Nakdong River Basin, Republic of Korea

1
Water Quality Assessment Research Division, Water Environment Research Department, National Institute of Environmental Research, Hwangyeong-ro 42, Seo-gu, Incheon 22689, Korea
2
Yeongsan River Research Center, National Institute of Environmental Research, Cheomdangwagi-ro 208, 5, Buk-gu, Gwangju 61011, Korea
3
Han River Research Center, National Institute of Environmental Research, 42 Dumulmeori-gil 68beon-gi, Yangseo-myeon, Yangpyeong-gun, Incheon 12585, Korea
*
Author to whom correspondence should be addressed.
Sustainability 2021, 13(19), 11094; https://doi.org/10.3390/su131911094
Submission received: 9 July 2021 / Revised: 29 September 2021 / Accepted: 30 September 2021 / Published: 7 October 2021

Abstract

:
Because identifying the factors affecting water quality is challenging, water quality assessment of an individual component based on the arithmetic mean method cannot adequately support management policies. Therefore, in this study, we assessed the water quality target attainment at 24 sites in the Nakdong River Basin by applying multivariate log-linear models to identify factors influencing water quality, including flow and season. The temporal and seasonal water quality trend and flow were also analyzed using the calculated model coefficients. Specifically, weekly data on biological oxygen demand (BOD), total phosphorous (TP), and flow during 2013–2018 were used to investigate the 2018 water quality target attainment level for this river. The significance and suitability of the models were analyzed using the F-test, root mean squared error (RMSE), mean absolute percent error (MAPE), and adjusted R2 values. All 24 models applied in this study showed statistical significance and suitability for the prediction of BOD and TP concentrations. Moreover, flow was identified as the main factor affecting water quality and had a predominant effect on BOD and TP concentrations in tributaries and the main stream, respectively. Furthermore, among the 24 sites, BOD and TP targets were evidently attained at 18 and 17 sites, respectively.

1. Introduction

Presently, to assess the quality of public waters, each year, the Ministry of Environment (MOE) in the Republic of Korea uses the arithmetic means of biological oxygen demand (BOD) and total phosphorous (TP) concentrations based on mean annual data to calculate water quality targets and determine the extent to which these targets are being attained. Additionally, the analysis of long-term data on water quality trends is used to identify the effects of national water quality management policies on the quality of public waters [1].
Water quality assessment based on the arithmetic mean method is widely used and easy to apply. However, it has limited applicability in assessing water quality due to seasonality, non-normality of data distribution, and ambiguous decision criteria for missing data and outliers. Further, during water quality assessment, we must account for the changes in water quality due to external environmental factors, such as abnormal climate phenomena (e.g., intense heat, extreme cold, droughts, and floods) and changes in flow owing to the presence of artificial structures, such as dams and weirs.
In particular, water quality is related to flow [2,3,4], which may be an important influencing factor for changes in water quality [4]. In the Republic of Korea, simple log-linear models as well as multivariate log-linear models [5] have been applied to clarify the relationship between water flow and quality in the South Han River, North Han River, and Gyeongan Stream, which flow into Lake Paldang; the suitability of these models in this regard has been compared along with the analysis of the water quality trend [6]. Additionally, various studies have been conducted to calculate loads, estimate parameters, and predict suspended particle loads using the LOADEST multivariate regression mode, which is based on log-linear models [7,8,9]. Regarding studies on water quality assessment based on other methods, the attainment of water quality targets has been assessed using the arithmetic assessment method, which only uses total organic carbon (TOC) data [10]. Further, the exceedance of water quality targets has also been assessed by comparing the loads calculated for each section using the load duration curve [11,12,13,14,15]. In other countries, more detailed studies have also been conducted to assess water quality and loads using multivariate statistical models [5,16] that can explain the influence of different factors that contribute to water quality changes, including flow fluctuation, time, and season [17,18,19]. Specifically, Hirsch (2014) [20] investigated the negative effect of the presence of bias in large datasets on items, such as dissolved nitrate and TP contents using the five-parameter LOADEST model (L5), the seven-parameter LOADEST model (L7), and the weighted regression on time, discharge, and season (WRTDS), which are based on the multivariate regression model developed by Cohn et al. (1992) [5]. Furthermore, in 2019, the U.S. Geological Survey (USGS) analyzed the suspended sediment, total nitrogen, and TP contents as well as loads of the Kankakee River, which is located in Shelby (India), using regression analysis [21]. In Japan, the 75 percentile is applied when evaluating the degree of achievement of organic substances, and if it is satisfied, it is considered that the target standard has been achieved [22].
However, in the Republic of Korea, water quality assessment methods that consider environmental factors, such as flow and season, have not yet been actively applied, implying that new water quality assessment methods that consider such parameters are required. Therefore, in this study, the attainment of water quality targets was determined by applying multivariate log-linear models that consider water quality, flow, and season for sites with corresponding data on flow among representative sites in the sub-basin of the Nakdong River. The water quality trend as well as its dependence on flow as a function of time and season were also assessed using model coefficient values. The results of this study contribute to the development of specific water quality management policies that can be applied in the management of water quality influencing factors in future. It is also expected that the method proposed in this study can serve as an objective assessment method that can be employed to identify the effects of water quality management policies on the realization of water quality targets.

2. Materials and Methods

This study was conducted in three steps as shown in Figure 1. First, dam water quality, stream flow, and hydrologic data corresponding to the 2013–2018 period were collected at 24 sites in the Nakdong River sub-basin. Second, a multivariate log-linear model was applied to calculate the regression coefficients of seven parameters, and the F-test was used to validate the statistical significance of the model using a statistical analysis program, SPSS (IBM spss USA; version 18.0). Third, the water quality trend as well as the main water quality influencing factors were identified using the calculated multivariate log-linear model, and the accuracy of the calculation was verified by considering the difference between the predicted and observed values. Finally, the reference flow was set from 2013 to 2016, and the attainment of the 2018 water quality target was evaluated using the models that showed statistical significance.

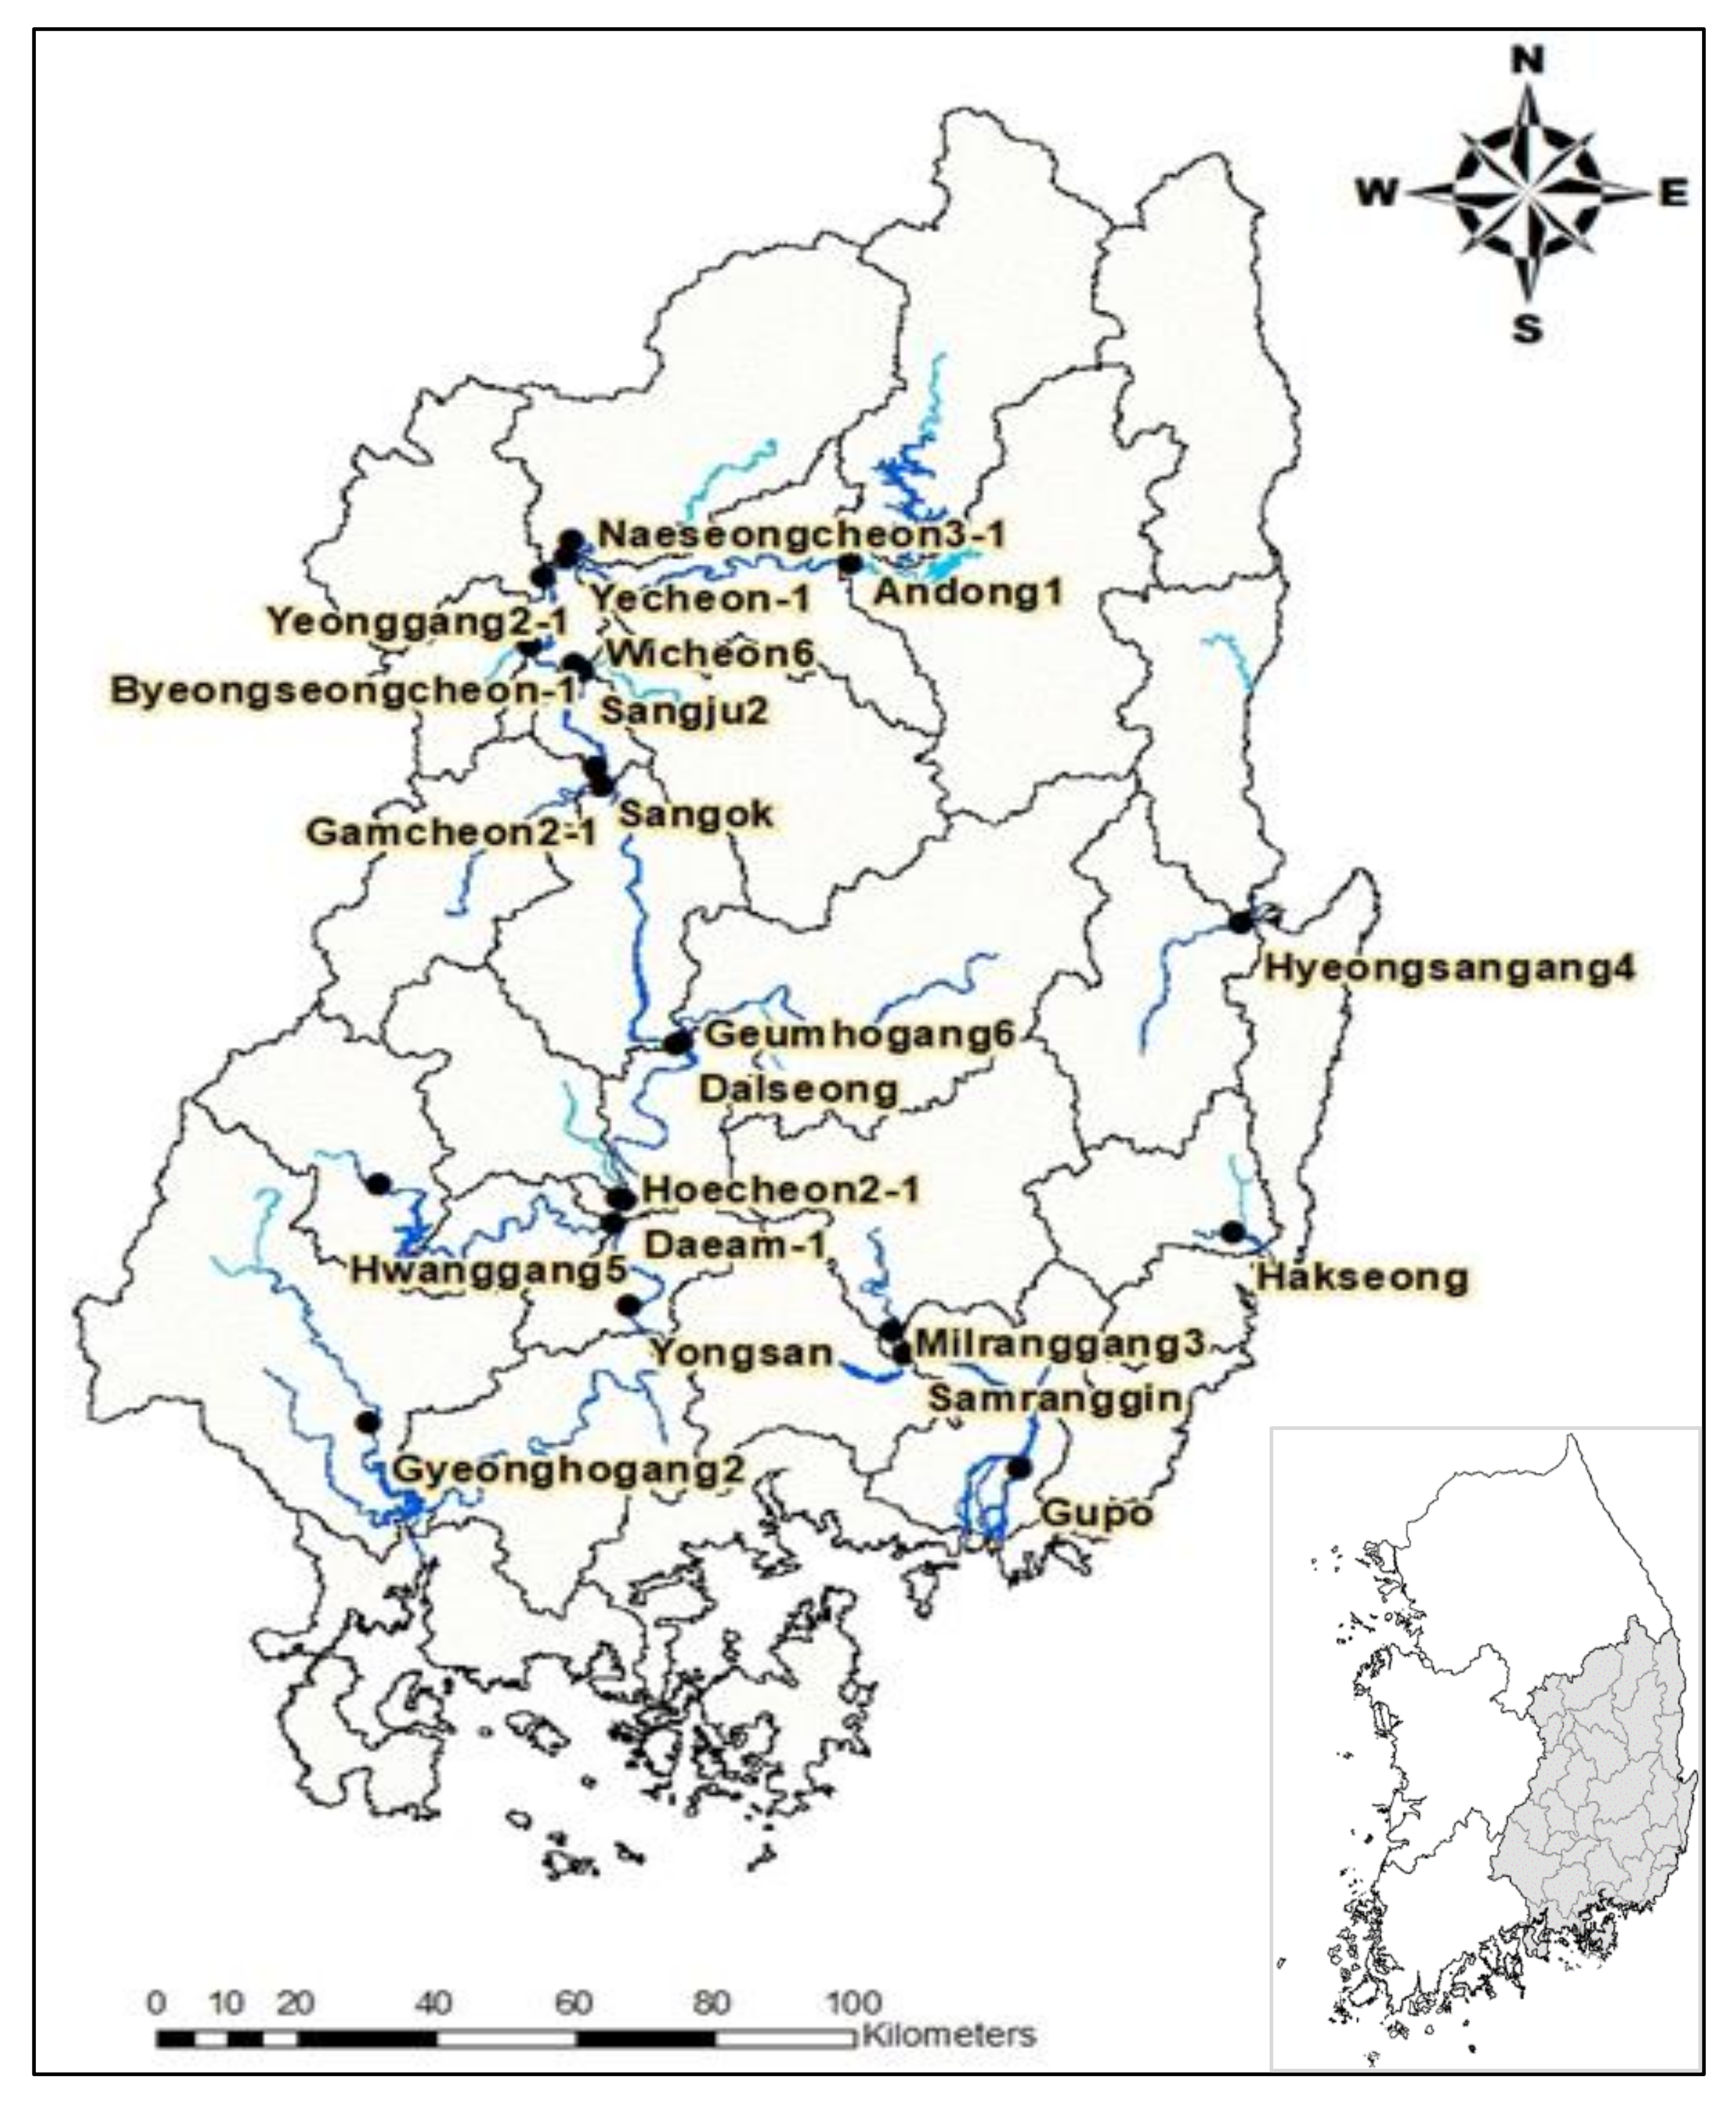
2.1. Description of the Study Area

The Nakdong River (Figure 2), which is one of the four major rivers in the Republic of Korea, serves as an important water resource for major cities, such as Daegu, Ulsan, and Busan. It is 525 km long, and its watershed area is 23,817 km2 (from latitude 35–37° N and longitude 124–131° E). Water from the Nakdong River basin supports a total population of over 13 million and is used for various purposes, including industrial and residential purposes (21.6%), agricultural purposes (51.0%), and flow maintenance (27.4%). Within the last few decades, rapid population growth coupled with industrial and urban development has resulted in the deterioration of the quality of water in this river. This is because contaminants, such as organic and inorganic materials, nitrates, and phosphates, are constantly introduced into this river [23]. Additionally, within the 2010–2011 period, eight weirs that are approximately 14–44 km apart were constructed along this river to manage water resources and control water flow [24]. The Sangju weir, which is the first, is located upstream, while the Changnyeong Haman weir is located downstream. The average annual precipitation in the central basin of this river (the Busan weather station) between 2004 and 2018 was 1050 mm, with more than half (57.5%) corresponding to the summer season, which is characterized by the highest temperatures, humidity levels, and evaporation rates [25]. Further, the Nakdong River basin occupies approximately 24% of the Korean land, and approximately 17.3% (5505 km2) of the total basin area is used for agricultural purposes. Among these, forest cover amounts to 68.6%, while wet paddy fields, dry paddy fields, urban areas, and others occupy 10.4%, 6.9%, 6.7%, and 7.4%, respectively [26]. The geological strata in the Nakdong River basin predominantly consists of sedimentary rocks, while metamorphic and igneous rocks are sparsely distributed. Of the 33 midwatershed representative sites along this river, 24 sites, with both water quality and quantity data, were selected for the assessment of the attainment of the 2018 water quality target using multivariate log-linear regression models.

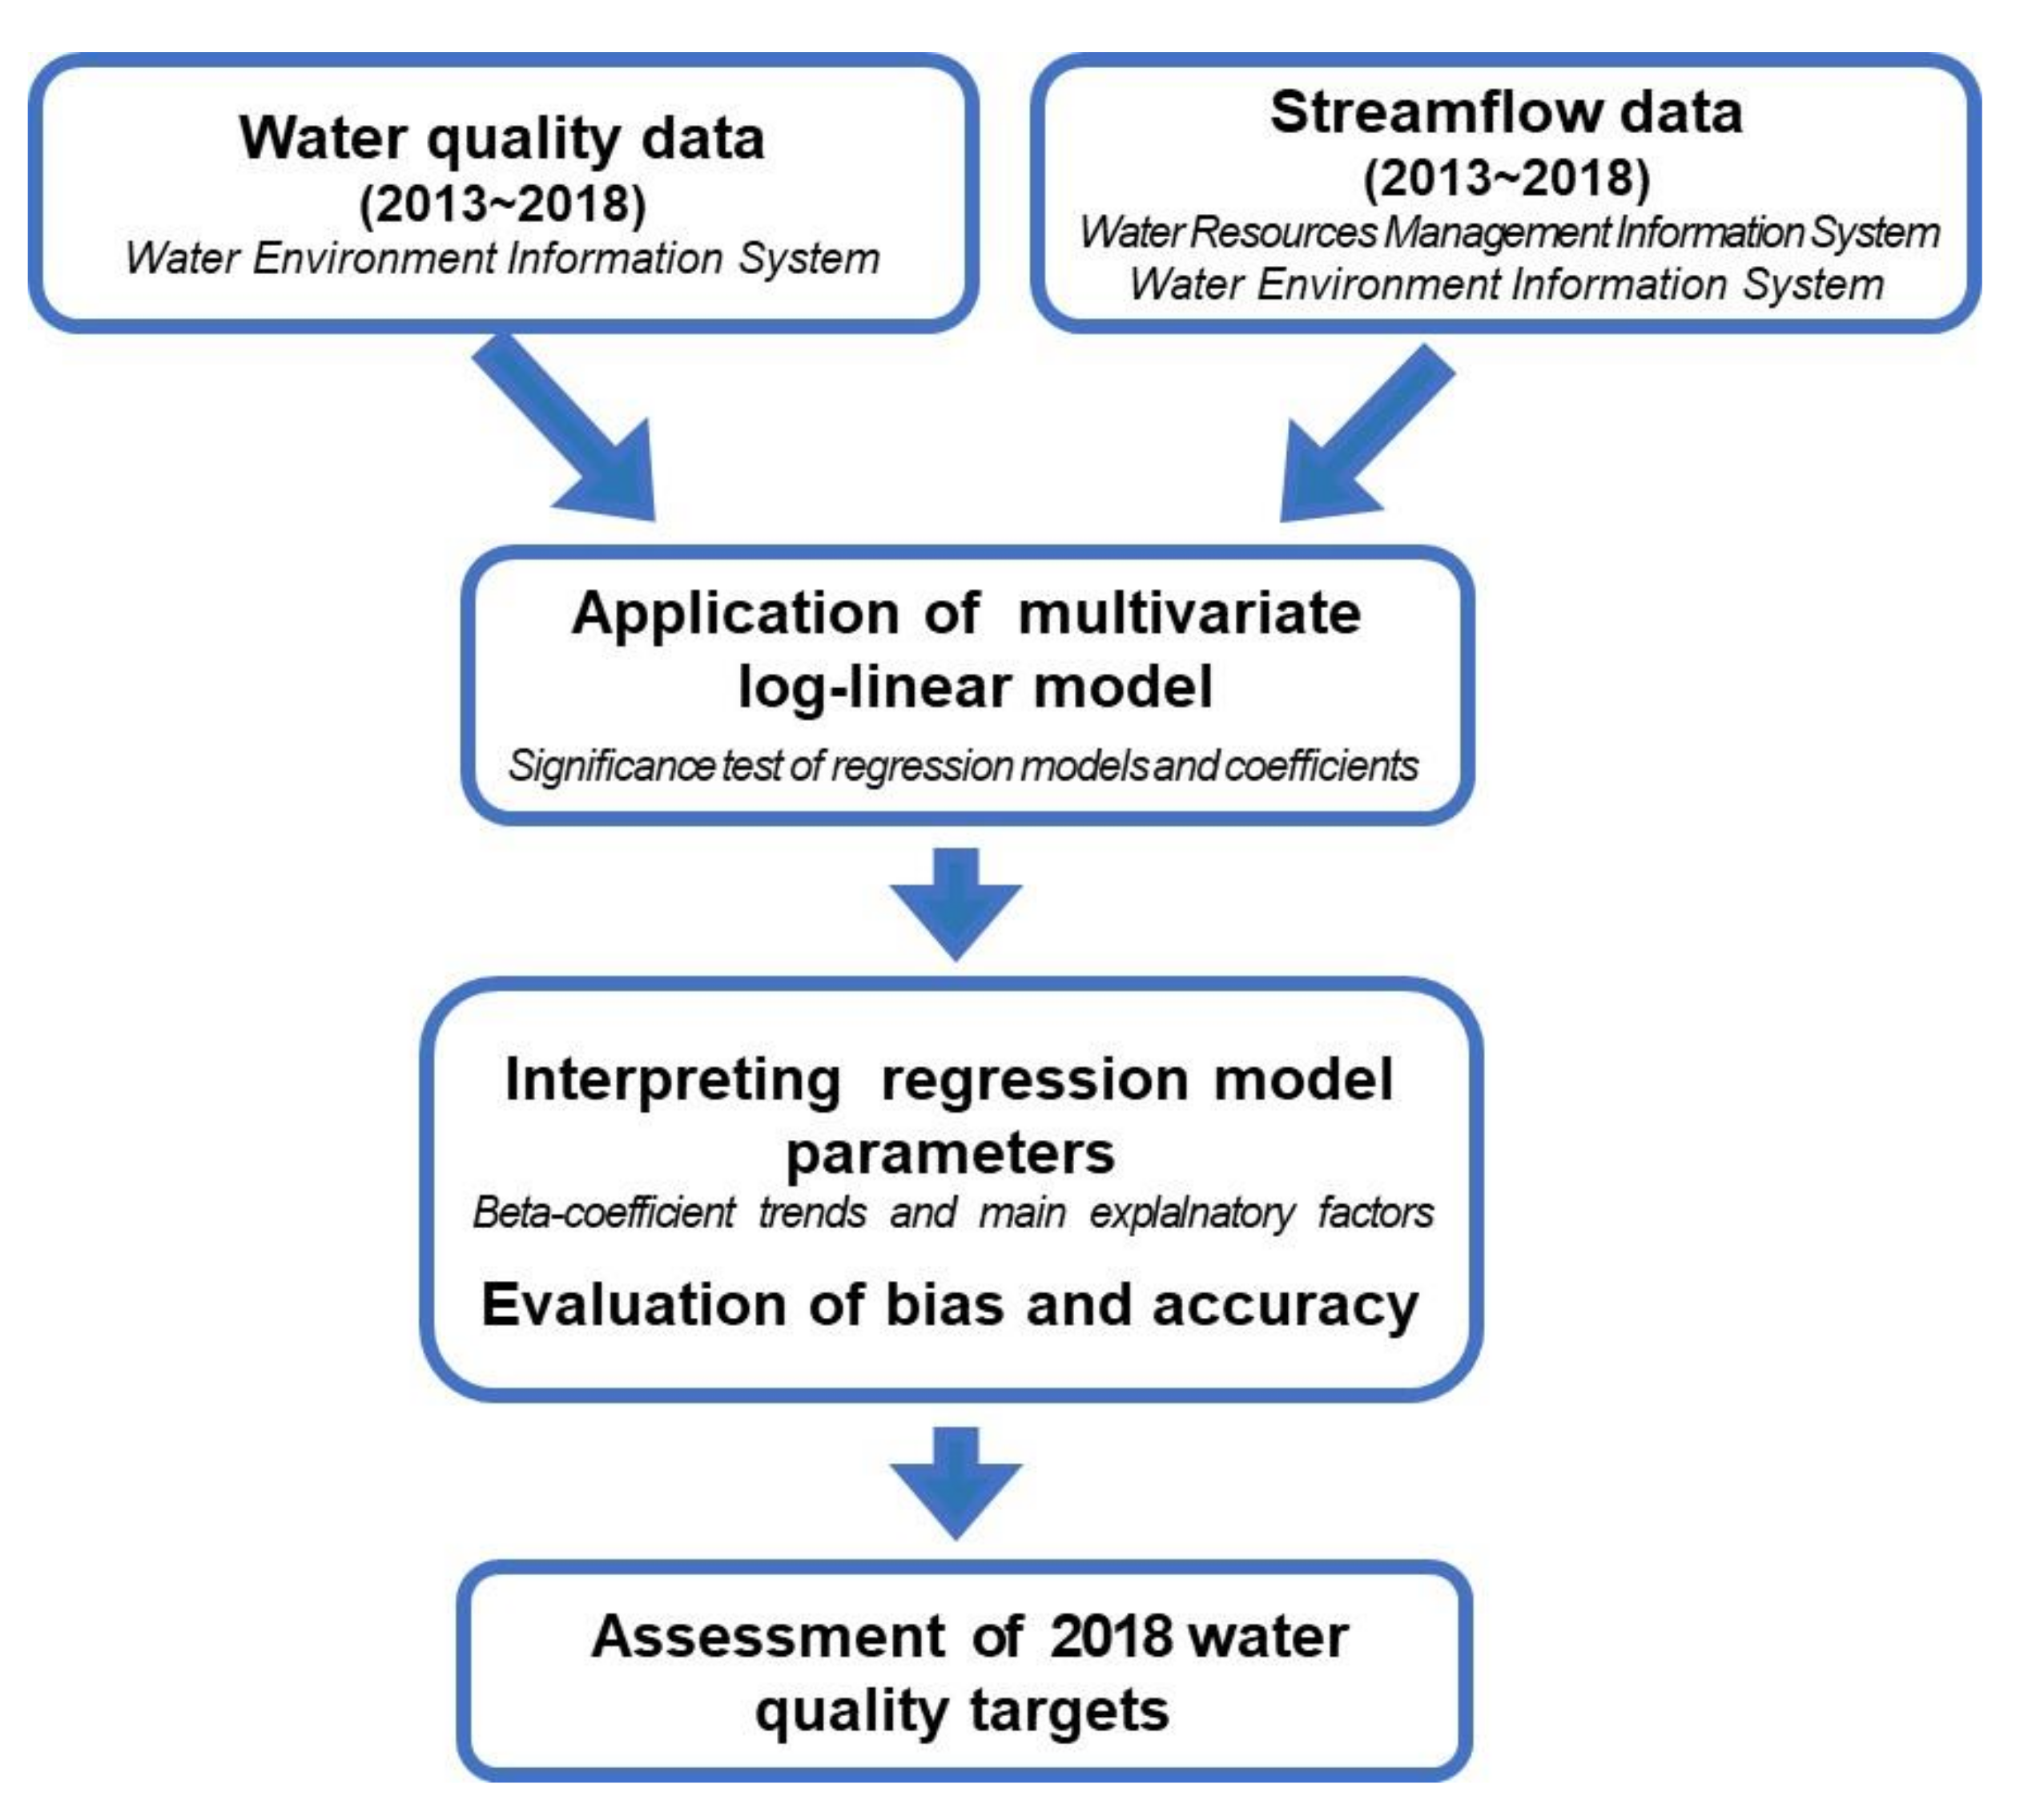
2.2. Approach Methods

2.2.1. Method of Data Collection

Three parameters, namely, BOD, TP, and stream flow, were selected for the analysis and assessment of the attainment of the 2018 water quality target. Daily data (2013–2018) on these parameters collected on a weekly basis from the 24 representative sites considered in this study were obtained from the Water Environment Information System (WEIS) [27], which is the largest national water quality database in the Republic of Korea. Further, daily dam hydrologic data were obtained from two databases, the national Water Resources Management Information System (WAMIS) [28] and My Water System [29].
Regarding flow data, K-water observation data were used for the Andong1, Sangju2, Sangok, Dalseong, Hwanggang1-1, and Samrangjin sites, while MOE flow observation data were used for the other sites. For analysis, the flow data were coupled with water quality data based on the water quality data collection day.

2.2.2. Description of Multivariate Log-Linear Model

The multivariate statistical regression model proposed by Cohn et al. (1992) [5] was used to estimate concentrations and loads on the basis of trend, discharge, and seasonality. The model included seven independent parameters: an intercept parameter, two parameters for quadratic fit to the logarithm of discharge, two parameters for quadratic fit to time, and two parameters for the sinusoidal function of seasonality. The model was defined as:
ln C = β 0 + β 1 ln Q Q ˜ + β 2 ln Q Q ˜ 2 + β 3 T T ˜ + β 4 T T ˜ 2 + β 5 s i n 2 π T + β 6 c o s 2 π T + ε
where C represents concentration (mg/L), Q represents discharge (m3/s), T represents time in decimal years, Q ˜ and T ˜ represent centering variables, β1 and β2 represent regression coefficient corresponding to flow, β3 and β4 represent regression coefficients corresponding to time, β5 and β6 represent regression coefficients corresponding to seasonality, and ε represents the error, which was assumed to be independent and normally distributed, with a zero mean and a constant variance. In this study, Equation (1) was used to calculate the regression coefficients corresponding to the seven parameters, and finally these regression coefficients were used to assess the attainment of the water quality target.
Q ˜ and T ˜ were defined to reduce covariance among the independent parameters and enhance estimation precision. They were calculated via simplification, without affecting the prediction results according to Equations (2) and (3), respectively [5].
T ˜ = T ¯ i = 1 N T i T ¯ 3 2 i = 1 N T i T ¯ 2
where T ˜ represents the center of the calibration data, T ¯ represents the mean of the data, Ti represents the ith sampled data, and N represents the number of observations in the calibration dataset.
T ¯ = 1 N i = 1 N T i

2.2.3. Evaluation Method for the Multivariate Log-Linear Model

The significance of the regression models determined using the weekly 2013–2018 water quality and flow data was determined using the F-test. In this regard, the null hypothesis, H0 was βi = 0, while the alternative hypothesis, H1, was βi ≠ 0. After determining the significance of the models (rejection of the null hypothesis based on the results of the F-test), the significance (α = 0.1 confidence intervals) and the values of each regression coefficient were estimated by conducting t-tests. Thus, the model was determined to be highly significant when the p-value was 0.01 (1% significance level), marginally significant when the p-value ranged between 0.01 and 0.1 (1–10% significance level), and nonsignificant when it was above 0.1 (10% significance level) [5,6].
Among the calculated regression coefficients, β1 and β3 represent flow- and time-related coefficients, respectively, and when β1 is positive (+), it implies that the water quality concentrations have a tendency to increase as the flow increases, indicating that the watershed is highly affected by nonpoint pollution sources. Conversely, when it is negative (−), it implies that the water quality concentrations decrease as flow increases, indicating that the watershed is highly affected by point pollution sources. Further, when the time coefficient, β3, is positive (+), it implies that the water quality concentrations increase with time, and it is indicative of an increase in the influence of pollution sources or a change in land use, for example, urbanization and the construction of agricultural and livestock complexes and industrial facilities. However, when it is negative (−), it implies that the water quality concentrations decrease with time, indicating an improvement in water quality owing to the influence of corresponding water management policies, such as the introduction of environmental management facilities.
The more influential of the two explanatory factors, time and flow, was considered as the main explanatory factor by comparing the absolute values of the standardized flow and time coefficients. Additionally, the regression coefficients, β5 and β6, which are related to seasonal changes, offered the possibility to identify seasonal water quality trends [6].
To minimize the bias of the estimates calculated using the multivariate regression models and improve their accuracy, the suitability of the models was assessed using the root mean square error (RMSE), mean absolute percent error (MAPE), and adjusted R2 values corresponding to the prediction error based on the comparison of the estimated and observed values corresponding to each site. The RMSE is suitable for the verification of the reliability of the absolute prediction error between predicted and observed values [30] calculated over a short period of time, whereas the MAPE, which is the percentage average of the absolute values of the errors between the actual and predicted values, can compensate for the shortcomings of size-dependent errors, such as units. Specifically, RMSE and MAPE can be expressed as shown in Equations (4) and (5), respectively; for both of them, a lower value can be interpreted as a higher suitability with lower bias [31].
  Root   mean   square   error   RMSE = 1 n i = 1 n H i o H i e 2
Mean   absolute   percent   error   MAPE = 1 n i = 1 n H i e H i o H i o × 100   ( % )  
where n represents the total number of observed data, Hio represents the i-th observed value, and Hie represents the i-th estimated value. Table 1 shows the accuracy interpretation criteria for MAPE values proposed by Lewis (1982) [32]. MAPE values below 10 are interpreted as highly accurate forecasting, while values above 50 are considered to be inaccurate forecasting. Further, based on the model suitability assessment results, 2018 BOD and TP concentrations were estimated, and the attainment of water quality targets for this year with respect to BOD and TP at the 24 sites considered in this study were assessed using the corresponding 2018 flow data.

3. Results and Discussions

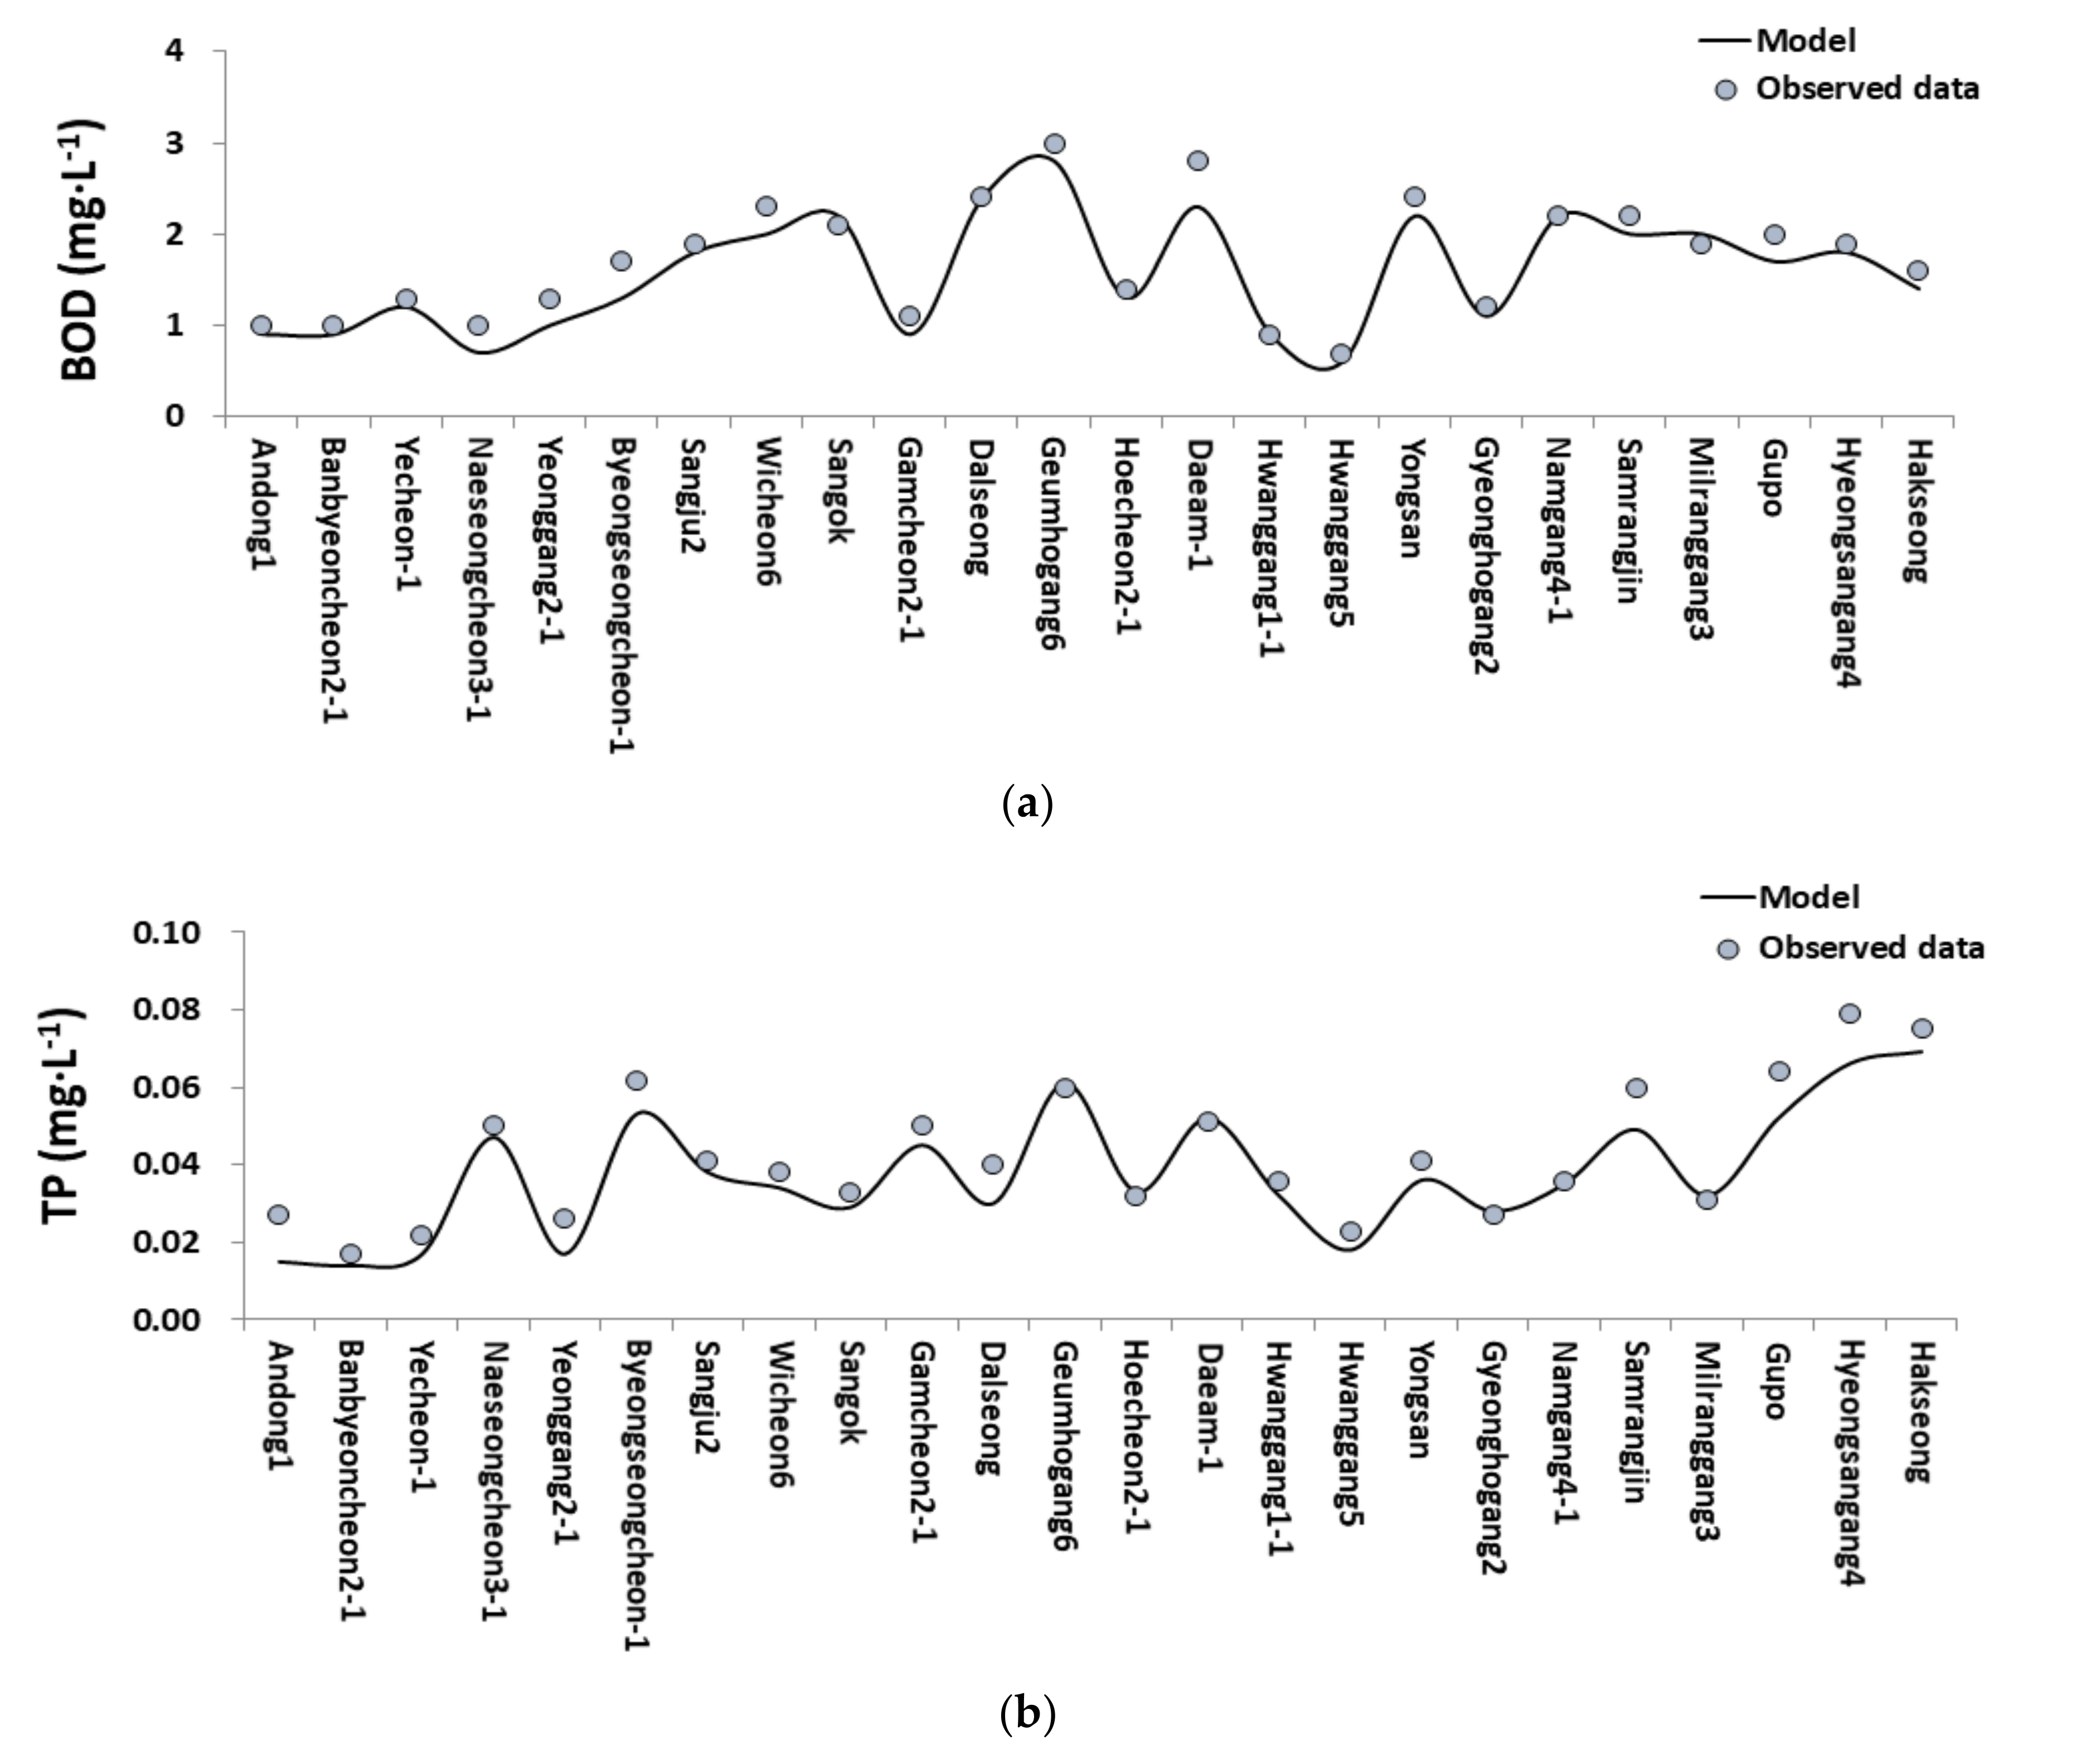
3.1. Application of Multivariate Log-Linear Model

Table 2 shows the F-test results and the adjusted R2 values obtained using the multivariate log-linear models for each site. Specifically, the F-test results indicated that all the regression models for the 24 sites showed a highly significant linear relationship between the explanatory and response factors (p < 0.001). The adjusted R2 values, which represent the explanatory power of a regression equation, ranged from 0.100 to 0.573 for the BOD models, with the explanatory power corresponding to tributaries (31.4% on average) being higher than that corresponding to the main stream (24.7% on average). Further, for the TP models, the adjusted R2 values ranged from 0.197 to 0.803, with the explanatory power corresponding to tributaries (57.6% on average) being higher than that corresponding to the main stream (37.3% on average), as was the case with the BOD models. However, the explanatory powers corresponding to the TP models were higher than those corresponding to the BOD models.
Furthermore, the explanatory powers of the BOD and TP models at the Geumhogang6 (40.0%) and Hoecheon2-1 (67.0%) sites in the midstream section were found to be higher than those in the upstream and downstream sections. Regarding BOD concentration, the Hakseong site in the Taehwa River watershed exhibited the highest explanatory power (57.0%), and regarding TP concentration, the Naeseongcheon3-1 site, a tributary in the midstream section of the Nakdong River, showed the highest explanatory power (79.9%).
Generally, it is known that multivariate log-linear models can explain approximately 10–50% of the variability (explanatory power) of continuously observed concentrations [5]. The multivariate log-linear models calculated in this study explained approximately 10–60 and 10–80% of BOD and TP concentrations, respectively, indicating that they are suitable for predicting parameter concentrations and identifying the water quality trend taking flow into consideration. Further, the explanatory powers of these models were found to be higher in tributaries, which are sensitive to the influence of flow, than in the main stream.

3.2. Interpreting of Model Parameters

Table 3 shows the results of the examination of the coefficients of the regression models for the Nakdong River basin and their statistical significance. Further, Table 4 shows the results of the analysis of the water quality trend for each site within the 2013–2018 period. The flow-related regression coefficients, β1 and β2, were highly significant or significant for all the sites, except for the Yongsan site, while the time-related regression coefficients, β3 and β4, were highly significant or significant for all the sites, except the Yeonggang2-1, Sangju2, Daeam-1, Hwanggang5, and Yongsan sites. Furthermore, the coefficients β5 and β6, which are regression coefficients corresponding to seasonality, were significant for all the sites. Specifically, the flow-related regression coefficients (β1) of BOD and TP concentrations were more significant than their time-related regression coefficients (β3). Further, the flow-related coefficients of TP concentration, which ranged from −0.219 to 0.501, showed statistical significance at all sites, except for the Hwanggang1-1 and Milyanggang3 sites, while that of BOD concentration as shown in Table 3, which ranged from −0.216 to 0.256, was statistically significant mainly at the upstream and downstream sites. Furthermore, organic matter concentration showed a tendency to decrease owing to an increase in flow rather than time, and a clear tendency of improved water quality was observed, particularly in the downstream section. Regarding BOD concentration, the regression coefficient corresponding to time (β3) was significant at 13 out of the 24 sites. For TP concentration, it ranged from −0.266 to 0.082 and showed statistical significance for all sites except the Sangju2, Sangok, Hakseong, Hyeongsangang4, and Hakseong sites. This implies that time had an effect on nutrient concentration, which, however, was more dependent on flow than time. Unlike BOD concentration, TP concentration showed more vulnerability to the inflow of nonpoint pollutants than to the pollutant dilution effect owing to an increase in flow during rainfall. The regression coefficients for seasonality (β5 and β6) were also found to be statistically significant at all the sites. In Table 4, the change in BOD concentration at the main stream sites varied depending on the site. Additionally, flow and time were identified as the main explanatory factors for four and seven sites, respectively, and regarding the change in BOD concentration in the tributaries, flow was identified as the main explanatory factor for 10 out of the 13 tributary sites. Further, regarding the change in TP concentration, flow was identified as the main explanatory factor for 9 of the 11 main stream sites. It was also observed that TP concentration showed a tendency to increase across the basin but tended to decrease over time. This is considered to be due to the water quality improvement effect resulting from an increase in investments aimed at improving the TP treatment capacities of water treatment facilities for the removal of point pollutants in the main stream sections of the four major rivers in the Republic of Korea from 2009 [33,34]. Considering the 13 tributary sites, flow and time were identified as the main explanatory factors for six sites and seven sites, respectively. For the main stream sites, the main explanatory factor for TP concentration was flow rather than time, and it was different for each site in the tributaries.

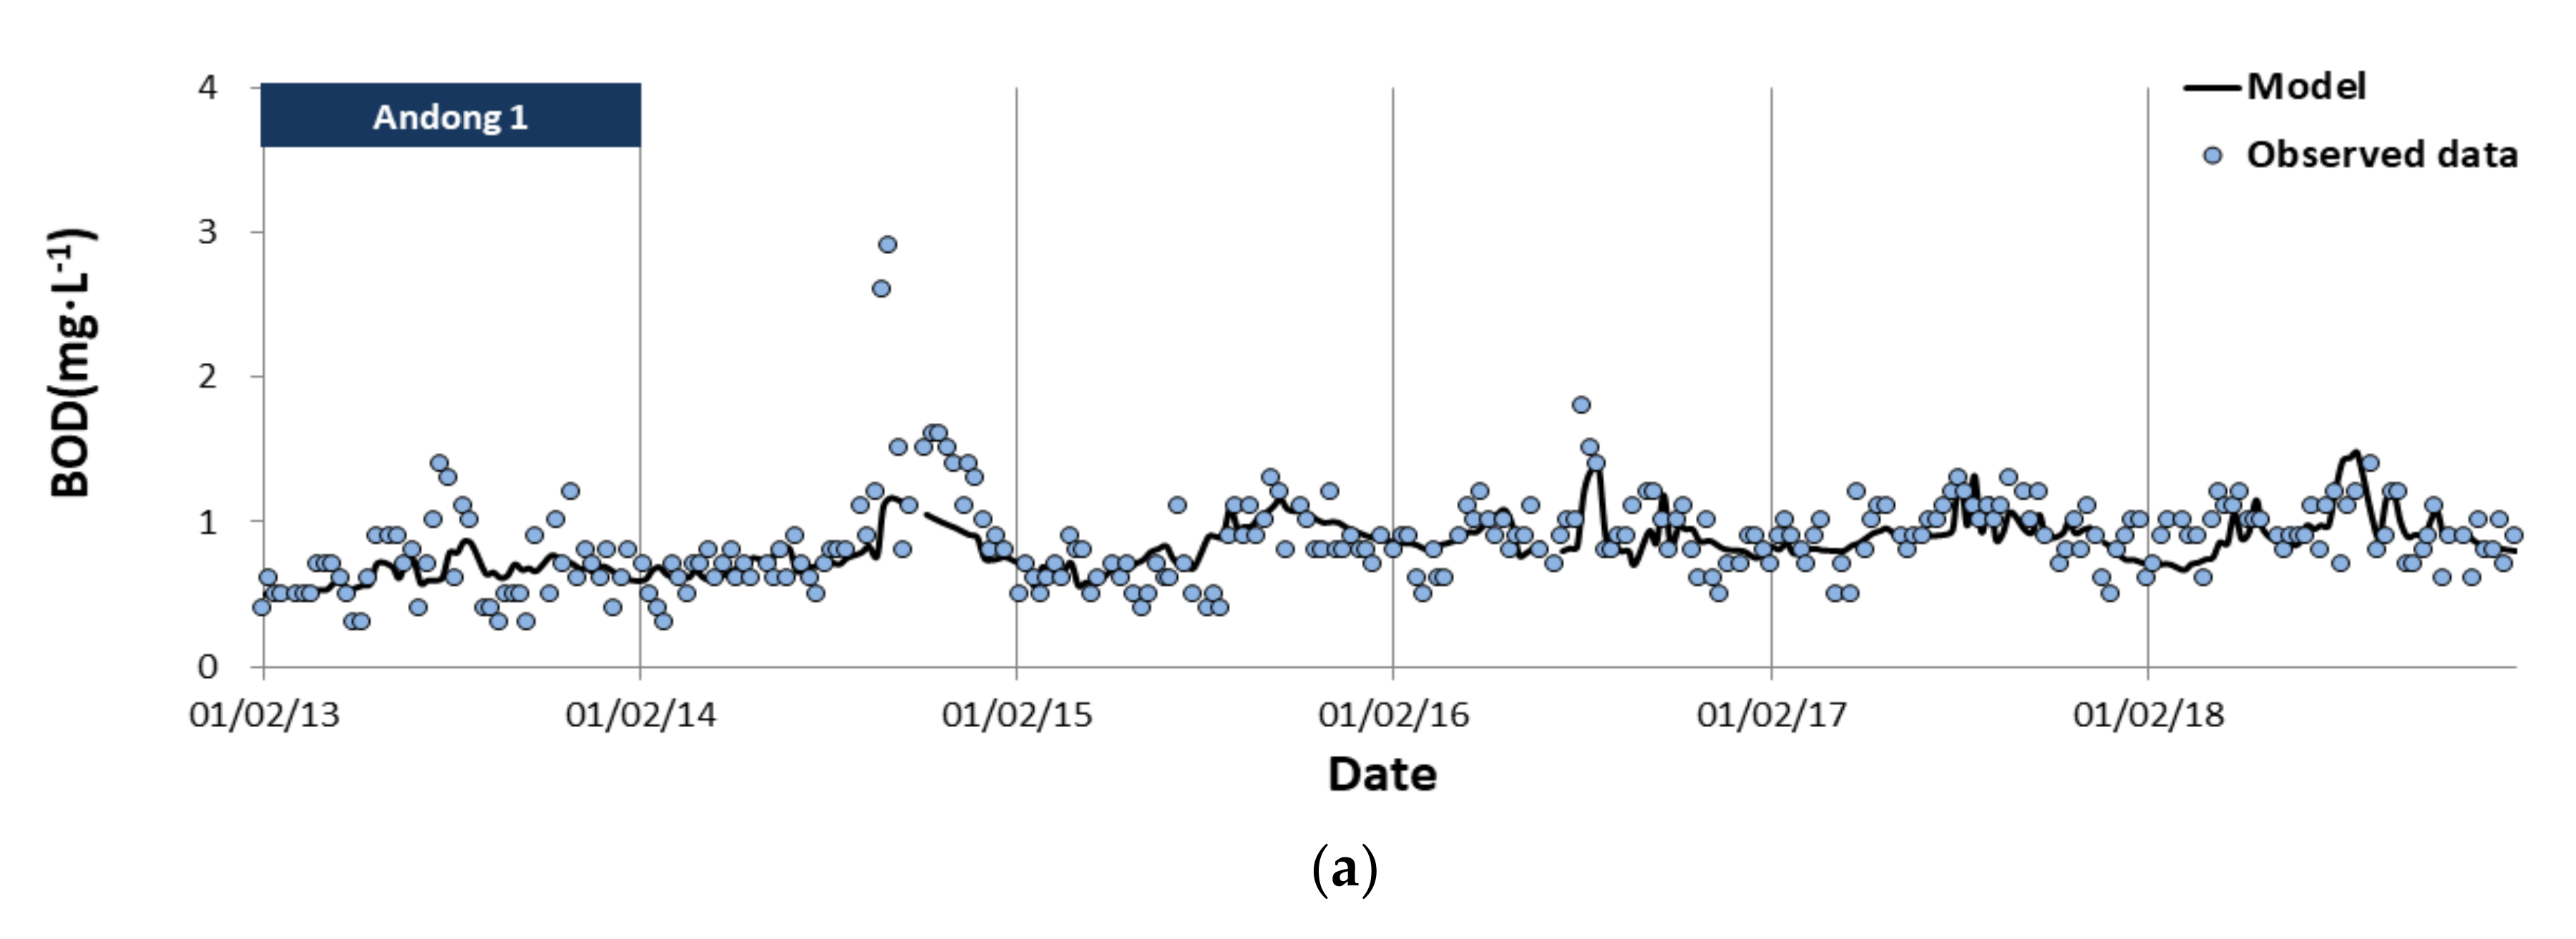
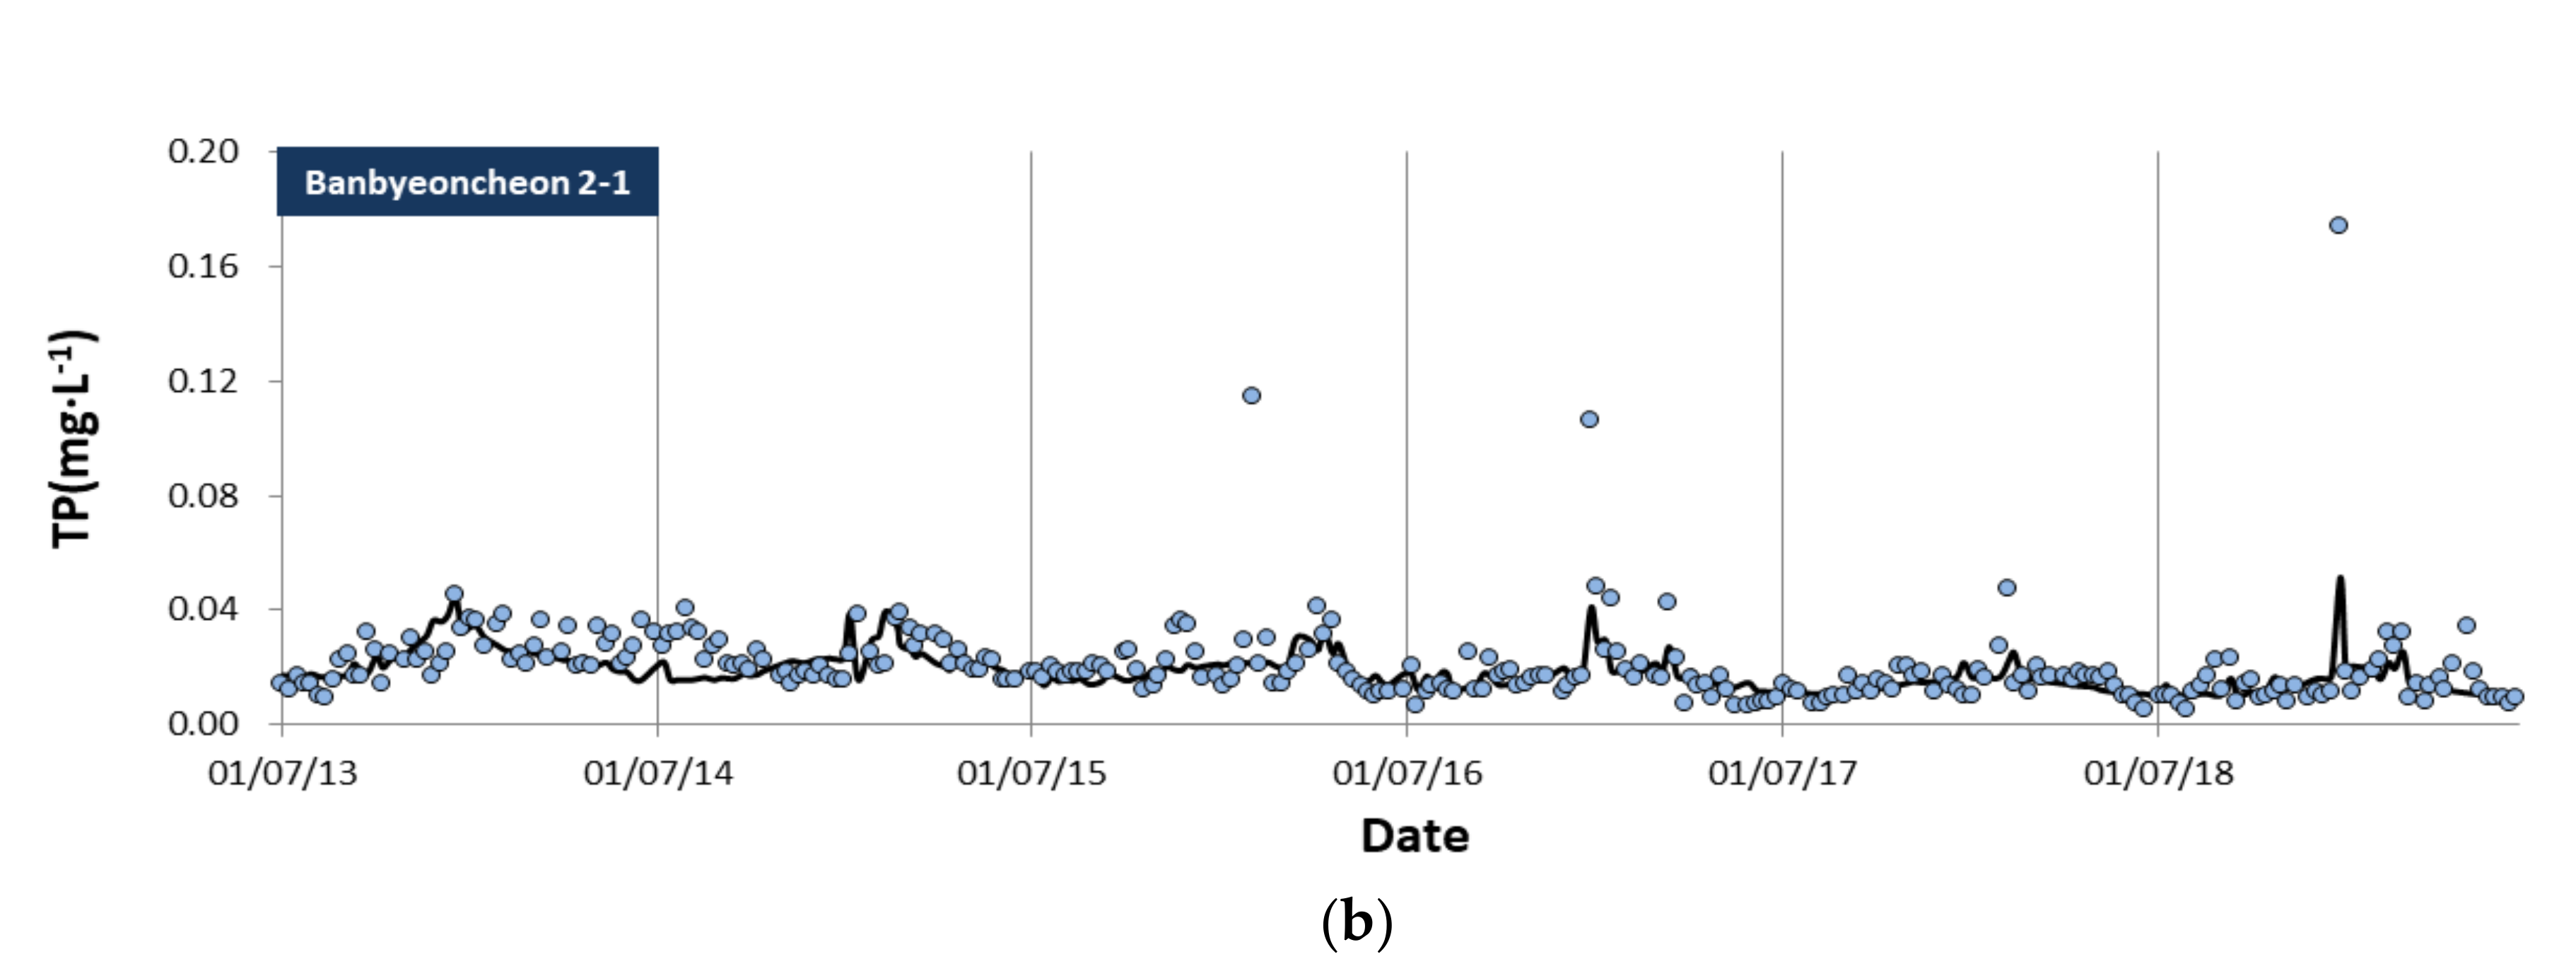
3.3. Evaluation of Bias and Accuracy Estimations

Table 5 shows the results of the analysis of the accuracy of the multivariate log-linear models in predicting 2018 water quality parameters. Overall, the predicted TP concentration values reflected the observed values to a greater extent than the predicted BOD concentration values. Further, the observed values were better reflected at the mid-upstream sites than at the downstream sites, and MAPE was below 50% for all the sites; this is indicative reasonable forecasting. Furthermore, the RMSE values obtained for BOD and TP concentrations were in the ranges 0.3–1.5 and 0.012–0.064 mg/L, respectively, and among the 24 sites, Andong1 and Banbyeoncheon2-1 sites exhibited the highest prediction accuracies for BOD and TP concentrations, respectively, i.e., RMSE values of 0.3 and 0.012 mg/L, respectively (Figure 3).
The observed and predicted 2018 data for the 24 sites were compared using the verified models as shown in Figure 4, and the comparison showed similar tendencies throughout the basin. When the accuracy of the predicted 2018 data was evaluated, the RMSE and MAPE values for BOD concentration were 0.2 mg/L and 10.6%, respectively, and for TP concentration, they were 0.007 mg/L and 13.7%, respectively, indicating the excellent suitability of the model results.

3.4. Assessment of the Attainment of the 2018 Water Quality Target

When the attainment of the 2018 water quality targets at the 24 sites was assessed using the multivariate log-linear models that considered changes in flow within the 2013–2018 period (Table 6), it was observed that the water quality targets with respect to BOD and TP concentrations were attained at 75.8% and 70.8% of the sites, respectively. These values are higher than those obtained using the annual average observed concentration method (58.3% and 50.0% for BOD and TP, respectively) [35]. Regarding BOD concentration, the nonattainment of water quality targets changed to attainment for the large tributaries, which are affected to a greater extent by flow, compared with the main stream sites, and for TP concentration, the attainment rate was improved for both the main stream and tributary sites. This appears to be due to the organic pollutant dilution effect resulting from an increase in flow and the influence of continuous efforts to improve water quality, such as the reinforcement of water quality standards for the water discharged from public sewage treatment facilities and the expansion of TP treatment capacity of sewage and wastewater treatment facilities [32,36].

4. Conclusions

In this study, among 32 representative sites in the sub-basin of the Nakdong River, multivariate log-linear models were applied to 24 sites where flow data were available to analyze the water quality trend and assess the water quality targets. The significance and suitability of the models were evaluated using the F-test, RMSE, MAPE, and adjusted R2 values. Thus, it was observed that all the 24 models showed statistical significance. Specifically, the explanatory power for TP concentration was higher than that for BOD concentration, and the explanatory power corresponding to tributaries was higher than that corresponding to the main stream.
Further, based on the multivariate linear models, flow was identified as the main factor that affects water quality with respect to BOD and TP. In particular, flow had a dominant effect on TP and BOD concentrations at main stream and tributary sites, respectively. This observation is highly related to organic pollutant concentration dilution resulting from an increase in flow and the increase in water quality owing to the inflow of nutrients as a result of the discharge of nonpoint pollutants during rainfall. For tributaries with low stream flow, it was observed that the change in water quality was sensitive to the inflow of pollutants. Considering each water quality parameter, BOD concentration tended to decrease, while TP concentration tended to increase as flow increased. However, both BOD and TP concentrations showed a tendency to improve over time. This is considered to be the effect of investments related to environmental improvement, such as the expansion of treatment facilities for biodegradable organic matter and TP treatment over the last 30 years.
Furthermore, based on the RMSE and MAPE values obtained, the multivariate log-linear models showed suitability in the prediction of water quality parameters. The evaluation of the 2018 water quality target attainment rate on this basis showed that the BOD concentration target was attained to a greater extent than the TP concentration target. This could be attributed to the positive effects resulting in significant improvement in BOD concentration in severely polluted main rivers owing to the dilution effect brought about by the increase in flow as well as the implementation of the drastic water quality management policies in the 1980s and 1990s.
Based on their effectiveness in accurately explaining the water quality parameters, the multivariate regression models applied in this study were determined to be more suitable for the prediction of nutrient concentrations instead of organic matter concentrations and the prediction of the water quality of tributaries rather than that of the main stream. This water quality assessment method allowed the identification of water quality influencing factors by linking water quality, flow, and time (seasonality). It is expected that the results derived in this study will be used as basic data for the preparation of water quality-flow integrated management plans as well as objective assessment methods for the identification of the effects of water quality management policies on water quality. In the future, it will be necessary to conduct further research with higher accuracy by expanding the number of survey sites for both water quality and flow and by securing long-term observation data.

Author Contributions

Conceptualization, M.-A.K., S.L., E.N. and S.P.; methodology, E.N. and S.P.; formal analysis, M.-A.K. and S.L.; data curation, M.-A.K. and S.L.; writing—original draft preparation, M.-A.K.; writing—review and editing, M.-A.K. and S.L.; supervision, S.L.; project administration, T.K., S.L. and E.N. All authors have read and agreed to the published version of the manuscript.

Funding

This research was funded by the National Institute of Environmental Research (NIER), grant number NIER-2020-04-02-129.

Institutional Review Board Statement

Not applicable.

Informed Consent Statement

Not applicable.

Data Availability Statement

Not applicable.

Acknowledgments

This research was funded by the National Institute of Environmental Research (NIER), under the Ministry of Environment (MOE) of the Republic of Korea, grant number NIER-2020-04-02-129.

Conflicts of Interest

The authors declare no conflict of interest.

References

  1. Ministry of Environment (MOE). Republic of Korea, The Evaluation Regulations of Water Quality Target; Ministry of Environment (MOE): Sejong, Korea, 2019; p. 1.
  2. Johnson, N.M.; Likens, G.E.; Bormann, F.H.; Fisher, D.W.; Pierce, R.S. A working model for the variation in stream water chemistry at the Hubbard Brook Experimental Forest, New Hampshire. Water Resour. Res. 1969, 5, 1353–1363. [Google Scholar] [CrossRef]
  3. Hirsch, R.M.; Slack, J.R.; Smith, R.A. Techniques of trend analysis for monthly water quality data. Water Resour. Res. 1982, 18, 107–121. [Google Scholar] [CrossRef] [Green Version]
  4. Smith, R.A.; Hirsch, R.M.; Slack, J.R. A Study of Trends in Total Phosphorous Measurements at Stations in the NASQAN Network; Technical Report Water Supply Paper 2190; U.S. Geological Survey: Reston, VA, USA, 1982; pp. 1–8.
  5. Cohn, T.A.; Caulder, D.L.; Gilroy, E.J.; Zynjuk, L.D.; Summers, R.M. The validity of a simple log-linear model for estimation fluvial constituent loads—An empirical study involving nutrient loads entering Chesapeake Bay. Water Resour. Res. 1992, 28, 2353–2364. [Google Scholar] [CrossRef]
  6. Na, E.H.; Park, S.S. Continuity simulation and trend analysis of water qualities in incoming flows to Lake Paldang by log linear models. Korean J. Limnol. 2003, 36, 336–343. [Google Scholar]
  7. Shin, M.H.; Seo, J.Y.; Choi, Y.H.; Kim, J.; Shin, D.; Lee, Y.J.; Jung, M.S.; Lim, K.J.; Choi, J. Evaluation of LOADEST model applicability for NPS pollutant loads estimation from agricultural watershed. J. Korean Soc. Water Qual. 2009, 25, 212–220. [Google Scholar]
  8. Park, Y.S.; Lee, J.M.; Shin, Y.; Shin, M.H.; Park, J.H.; Hwang, H.; Ryu, J.; Park, J. Evaluation of regression models in LOADEST to estimate suspended solid load in Hangang Waterbody. J. Korean Soc. Agric. Eng. 2015, 57, 37–45. [Google Scholar]
  9. Kim, K.; Kang, M.S.; Song, J.H.; Park, J. Estimation of LOADEST coefficients according to watershed characteristics. J. Korean Water Resour. 2018, 51, 151–163. [Google Scholar]
  10. Lee, J.H.; Lee, S.H.; Lee, S.H.; Lee, J.K. Evaluation of attainment ratio on water quality goal of the mid-watershed representative station. J. Korean Soc. Water Environ. 2017, 33, 525–530. [Google Scholar]
  11. U.S. Environmental Protection Agency (EPA). An Approach for Using Load Duration Curves in the Development of TMDLs; U.S. Environmental Protection Agency: Washington, DC, USA, 2007.
  12. Hwang, H.S.; Park, B.K.; Kim, Y.S.; Park, K.J.; Cheon, S.U.; Lee, S.J. Research on the applicability of the load duration curve to evaluate the achievement of target water quality in the unit watershed for a TMDL. J. Korean Soc. Water Environ. 2011, 27, 885–895. [Google Scholar]
  13. Park, J.H.; Kim, K.S.; Hwang, K.S.; Lee, Y.W.; Lim, B.G. Application of load duration curve and estimation of delivery ratio by flow durations using discharge load rating curve at Jiseok Stream Watershed. J. Korean Soc. Water Environ. 2013, 29, 523–530. [Google Scholar]
  14. Kim, E.K.; Ryu, J.C.; Kim, H.T.; Kim, Y.S.; Shin, D.S. Application of the load duration curve (LDC) to evaluate the achievement rate of target water quality in the Han-River Watersheds. J. Korean Soc. Water Environ. 2015, 31, 732–738. [Google Scholar] [CrossRef] [Green Version]
  15. Ha, D.W.; Kim, S.G.; Song., C.S.; Ko, G.Y. Effect analysis on target water quality change by measurement data in Yochon a point using load duration curve. J. Korean Soc. Environ. Technol. 2016, 17, 105–113. [Google Scholar]
  16. Hesel, D.R.; Hirsch, R.M. Statistical Methods in Water Resources: U.S. Geological Survey, Techniques of Water-Resources Investigations, 04-A3; U.S. Geological Survey: Reston, VA, USA, 2002; p. 522.
  17. Lystrom, D.J.; Rinella, F.A.; Rickert. D., A.; Zimmermann, L. Multiple Regression Modeling Approach for Regional Water Quality Management; Environmental Research Laboratory, EPA-600/778-198; U.S. Environmental Protection Agency, U.S. Department of the Interior: Portland, OR, USA, 1978; p. 60.
  18. Lizárraga, J.S. Nutrient and Sediment Concentrations, Trends, and Loads from Five Subwatersheds in the Patuxent River Basin, Maryland, 1986–1996; U.S. Geological Survey Water-Resources Investigations Report 98-4221; U.S. Geological Survey: Reston, VA, USA, 1999; p. 31.
  19. Runkel, R.L.; Crawford, C.G.; Cohn, T.A. Load Estimator (LOADEST)—A Fortran Program for Estimating Constituent Loads in Streams and Rivers; U.S. Geological Survey Techniques and Methods, 4-A5; U.S. Geological Survey: Reston, VA, USA, 2004; p. 69.
  20. Hirsch, R.M. Large biases in regression-based constituent flux estimates: Causes and diagnostic tools. J. Am. Water Resour. Assoc. 2014, 50, 1401–1424. [Google Scholar] [CrossRef]
  21. Lathrop, T.R.; Bunch, A.R.; Downhour, M.S. Regression Models for Estimating Sediment and Nutrient Concentrations and Loads at the Kankakee River, Shelby, Indiana, December 2015 through May 2018; U.S. Geological Survey Scientific Investigation Report 2019-5087; U.S. Geological Survey: Reston, VA, USA, 2019; p. 13.
  22. Choi, J.Y.; Han, D.H. Development of Water Quality Standard for TOC as Organic Matter Index. Seoul Stud. 2001, 12, 173–184. [Google Scholar]
  23. Nakdong River Environment Research Center (NIER). Changes of Water Environment and Phytoplankton Community Structures in the Nakdong River; 11-1480523-001712-01; National Institute of Environmental Research: Incheon, Korea, 2013; pp. 3–5.
  24. Park, J.S.; Wang, D.; Lee, W.H. Evaluation of weir construction on water quality related to algal blooms in the Nakdong River. Environ. Earth Sci. 2018, 77, 408. [Google Scholar] [CrossRef]
  25. Korea Meteorological Administration (KMA). Available online: http://data.kma.go.kr (accessed on 17 December 2019).
  26. National Institute of Environmental Research (NIER). Report of the National Pollution Source Survey; Based on the 2017, 11-1480523-000429-10; National Institute of Environmental Research: Incheon, Korea, 2019; p. 143.
  27. Water Environment Information System (WEIS). Available online: http://water.nier.go.kr (accessed on 15 December 2019).
  28. Water Resources Management Information System (WAMIS). Available online: http://www.wamis.go.kr (accessed on 15 December 2019).
  29. My Water System (K-Water). Available online: http://www.water.or.kr (accessed on 17 December 2019).
  30. Rim, C.S. Comparison of incoming solar radiation equations for evaporation estimation. CNU J. Agric. Sci. 2011, 38, 129–143. [Google Scholar]
  31. Park, H.S.; Park, S.J.; Lim, J.G. Forecasting advertising communication effects using TV advertising exposure data. Broadcast. Commun. 2018, 19, 165–197. [Google Scholar]
  32. Lewis, C.D. Industrial and Business Forecasting Methods; Butterworth Publishing: London, UK, 1982; p. 40. [Google Scholar]
  33. Ministry of Environment (MOE). The 2nd Basic Plan for Water Environment Management; 11-1480000-001483-14; Ministry of Environment (MOE): Sejong, Korea, 2018; p. 28.
  34. Ahn, J.H.; Han, D.H.; Cho, J.H.; Kim, S.B.; Lee, S.M. Assessing the Feasibility of Strengthening Point-Source Nitrogen Management Policy. Korea Environment Institute: Sejong, Korea, 2018; p. 52. [Google Scholar]
  35. National Institute of Environmental Research (NIER). Report of the National Water Quality Assessment; 11-1480523-002395-10; National Institute of Environmental Research: Incheon, Korea, 2018; p. 29.
  36. Lee, B.K.; Kim, H.J.; Hyun, Y.J.; Jung, S.H.; Kim, E.Y. A Study for Integrated Management of Water Quantity and Quality to Improve the Water Environment of 4 Rivers Restoration Project; Research Report 2012-04; Korean Environment Institute (KEI): Sejong, Korea, 2012; pp. 525–530. [Google Scholar]
Figure 1. Flowchart representing the process used in the application of the multivariate log-linear models developed in this study.
Sustainability 13 11094 g001
Figure 2. Map showing the location of the Nakdong River basin and study sites.
Sustainability 13 11094 g002
Figure 3. Comparison of observed and modeled values for the most accurate sites of (a) BOD and (b) TP from 2013–2018.
Sustainability 13 11094 g003aSustainability 13 11094 g003b
Figure 4. Observed and modeled (a) BOD and (b) TP concentrations during 2018 across the 24 analysis sites across the Nakdong River Basin.
Sustainability 13 11094 g004
Table 1. Interpretation of typical mean absolute percent error (MAPE) values [32].
MAPEInterpretation
<10Highly accurate forecasting
10–20Good forecasting
20–50Reasonable forecasting
>50Inaccurate forecasting
Table 2. Significance (F-tests) and adjusted coefficients of determination (R2) of the multivariate regression models assessing biological oxygen demand (BOD) and total phosphorous (TP) in the Nakdong River Basin, from 2013 to 2018.
SiteBiological Oxygen Demand (BOD)
(mg·L−1)
Total Phosphorous (TP)
(mg·L−1)
Fp-ValueAdjusted R2Fp-ValueAdjusted R2
Andong127.806<0.0010.36213.000<0.0010.200
Banbyeoncheon2-113.374<0.0010.21038.986<0.0010.449
Yecheon-110.819<0.0010.22212.503<0.0010.253
Naeseongcheon3-116.892<0.0010.249191.481<0.0010.799
Yeonggang2-121.093<0.0010.33926.586<0.0010.395
Byeongseongcheon-118.263<0.0010.30661.599<0.0010.607
Sangju29.119<0.0010.21427.109<0.0010.467
Wicheon69.394<0.0010.17650.522<0.0010.558
Sangok13.680<0.0010.27427.223<0.0010.438
Gamcheon2-113.399<0.0010.240134.039<0.0010.773
Dalseong6.296<0.0010.10021.031<0.0010.295
Geumhogang632.781<0.0010.399101.119<0.0010.677
Hoecheon2-124.918<0.0010.37979.149<0.0010.666
Daeam-18.424<0.0010.16038.434<0.0010.491
Hwanggang1-112.837<0.0010.5047.893<0.0010.375
Hwanggang56.162<0.0010.11640.998<0.0010.505
Yongsan5.951<0.0010.11547.871<0.0010.551
Gyeonghogang227.419<0.0010.40396.821<0.0010.710
Namgang4-124.520<0.0010.33046.136<0.0010.486
Samrangjin19.445<0.0010.27827.334<0.0010.355
Milranggang329.914<0.0010.42518.705<0.0010.311
Gupo10.883<0.0010.17135.621<0.0010.420
Hyeongsangang416.382<0.0010.24411.476<0.0010.180
Hakseong14.588<0.0010.57319.902<0.0010.285
Table 3. Beta-coefficient values of statistically significant BOD and TP regression models within the Nakdong River Basin from 2013–2018.
SiteVariableβ0β1β2β3β4β5β6
Andong1BOD−0.016−0.148−0.0630.054−0.005−0.079−0.205
TP−3.843−0.219−0.193−0.0600.018−0.215−0.358
Banbyeoncheon2-1BOD0.150−0.0990.026−0.057−0.019−0.052−0.208
TP−4.1670.0350.066−0.115−0.002−0.134−0.214
Yecheon-1BOD0.1390.058−0.0050.097−0.012−0.0080.074
TP−4.2210.2750.0530.0820.0260.1030.026
Naeseongcheon3-1BOD−0.1480.2560.049−0.028−0.0480.208−0.203
TP−3.0700.5010.030−0.1660.024−0.203−0.013
Yeonggang2-1BOD0.229−0.0790.005−0.021−0.0320.237−0.311
TP−4.0120.0460.055−0.094−0.008−0.011−0.375
Byeongseongcheon-1BOD0.3440.1020.064−0.043−0.0170.257−0.312
TP−2.9650.3040.090−0.1390.031−0.015−0.224
Sangju2BOD0.5360.021−0.0130.0010.0040.1960.100
TP−3.7070.2970.1010.0200.0350.253−0.064
Wicheon6BOD0.730−0.017−0.019−0.0120.006−0.046−0.304
TP−3.6070.1340.058−0.1010.013−0.142−0.332
SangokBOD0.6280.014−0.0250.0720.0030.0960.108
TP−3.8680.2410.069−0.0050.0220.324−0.073
Gamcheon2-1BOD0.1670.0660.085−0.105−0.0260.274−0.032
TP−2.9450.3510.061−0.2660.039−0.117−0.113
DalseongBOD0.8270.003−0.0090.033−0.0030.000−0.102
TP−3.6010.1440.039−0.0630.016−0.329−0.129
Geumhogang6BOD1.147−0.1400.094−0.036−0.0330.194−0.455
TP−2.4780.1780.084−0.151−0.005−0.097−0.337
Hoecheon2-1BOD0.131−0.0380.060−0.039−0.0030.168−0.314
TP−3.5920.2450.069−0.0920.023−0.035−0.403
Daeam-1BOD0.8060.0050.0130.0050.0020.227−0.069
TP−3.1220.1150.026−0.1190.006−0.271−0.149
Hwanggang1-1BOD−0.218−0.1820.144−0.036−0.0130.305−0.328
TP−3.3630.0420.089−0.1260.012−0.087−0.382
Hwanggang5BOD−0.2580.1120.064−0.001−0.0540.028−0.085
TP−3.7660.3500.026−0.0860.001−0.191−0.142
YongsanBOD0.772−0.0190.002−0.0150.0030.049−0.201
TP−3.2120.1830.062−0.1420.015−0.369−0.198
Gyeonghogang2BOD0.063−0.0120.100−0.082−0.0130.185−0.234
TP−3.6530.2520.094−0.125−0.005−0.030−0.638
Namgang4-1BOD0.789−0.167−0.017−0.0030.0080.015−0.338
TP−3.2430.0790.038−0.1160.011−0.134−0.310
SamrangjinBOD0.611−0.0880.005−0.0300.0210.074−0.258
TP−3.1650.2460.071−0.0390.025−0.204−0.093
Milyanggang3BOD0.537−0.2160.0030.011−0.0110.131−0.448
TP−3.3430.0020.070−0.087−0.0100.018−0.181
GupoBOD0.589−0.0410.011−0.0400.0030.127−0.188
TP−3.2970.2100.027−0.0380.050−0.159−0.138
Hyeongsangang4BOD0.669−0.1530.0150.022−0.021−0.034−0.339
TP−2.640−0.1340.044−0.024−0.012−0.133−0.021
HakseongBOD0.522−0.0460.010−0.1080.0130.166−0.325
TP−2.6640.0880.017−0.010−0.015−0.246−0.205
Notes: Highly significant (p < 0.01): Sustainability 13 11094 i001 Significant (p < 0.05): Sustainability 13 11094 i002.
Table 4. Water quality trend description and identification of main explanatory factors.
SiteStreamVariableFlow (Q)Time (T)SeasonalityMain Explanatory Factor
Andong1MainBODOQ
TPOQ
Banbyeoncheon2-1TributaryBODOQ
TPOT
Yecheon-1MainBODOT
TP-Q
Naeseongcheon3-1TributaryBOD-OQ
TPOQ
Yeonggang2-1TributaryBOD-OQ
TPOT
Byeongseongcheon-1TributaryBODOQ
TPOQ
Sangju2MainBOD--OQ
TP-OQ
Wicheon6TributaryBOD--OQ
TPOQ
SangokMainBOD-OT
TP-OQ
Gamcheon2-1TributaryBOD-OT
TPOT
DalseongMainBOD-OT
TPOQ
Geumhogang6TributaryBODOQ
TPOT
Hoecheon2-1TributaryBOD-OT
TPOQ
Daeam-1MainBOD--OT
TPOT
Hwanggang1-1TributaryBOD-OQ
TP-OT
Hwanggang5TributaryBOD-OQ
TPOQ
YongsanMainBOD--OT
TPOT
Gyeonghogang2TributaryBOD-OT
TPOQ
Namgang4-1TributaryBOD-OQ
TPOT
SamrangjinMainBODOQ
TPOQ
Milyanggang3TributaryBOD-OQ
TP-OT
GupoMainBODOT
TPOQ
Hyeongsangang4MainBOD-OQ
TP-OQ
HakseongMainBOD-OT
TP-OQ
Notes: -, Nonsignificant; ↓, Decrease; ↑, Increase; Q, Flow; T, time.
Table 5. Evaluation of bias and accuracy estimate methods for BOD and TP concentrations from 2013 to 2018 across the 24 main stream and tributary sites of the Nakdong River Basin.
SiteBODTP
RMSE (mg·L−1)MAPE (%)RMSE (mg·L−1)MAPE (%)
Andong10.322.740.02847.66
Banbyeoncheon2-10.734.180.01229.31
Yecheon-10.421.330.06442.75
Naeseongcheon3-10.848.240.02524.28
Yeonggang2-10.735.740.02433.98
Byeongseongcheon-11.340.730.04026.34
Sangju20.625.830.01538.08
Wicheon60.933.560.01628.73
Sangok0.520.320.01439.85
Gamcheon2-10.945.190.03023.30
Dalseong0.619.820.02346.84
Geumhogang61.533.310.03022.51
Hoecheon2-10.633.360.01626.41
Daeam-10.929.840.02028.95
Hwanggang1-10.531.980.02335.47
Hwanggang50.441.300.01629.81
Yongsan0.930.650.01931.33
Gyeonghogang20.629.530.02030.69
Namgang4-10.828.230.02028.45
Samrangjin0.724.280.02533.94
Milranggang30.936.130.01426.55
Gupo0.829.680.02333.65
Hyeongsangang41.137.400.04036.28
Hakseong1.548.950.04833.79
Table 6. Comparison of observed and estimated BOD and TP attainment values for water quality targets across the Nakdong River Basin, 2018.
SiteBOD (mg·L−1)TP (mg·L−1)
Water Quality TargetAttainmentWater Quality TargetAttainment
ObservedEstimatedObservedEstimated
Andong1≤1≤0.02
Banbyeoncheon2-1≤2≤0.04
Yecheon-1≤1≤0.02
Naeseongcheon3-1≤1≤0.02
Yeonggang2-1≤1≤0.02
Byeongseongcheon-1≤2≤0.04
Sangju2≤1≤0.02
Wicheon6≤2≤0.04
Sangok≤1≤0.02
Gamcheon2-1≤1≤0.02
Dalseong≤2≤0.04
Geumhogang6≤3≤0.1
Hoecheon2-1≤2≤0.04
Daeam-1≤3≤0.1
Hwanggang1-1≤2≤0.04
Hwanggang5≤1≤0.02
Yongsan≤2≤0.04
Gyeonghogang2≤2≤0.04
Namgang4-1≤2≤0.04
Samrangjin≤2≤0.04
Milranggang3≤2≤0.04
Gupo≤2≤0.04
Hyeongsangang4≤3≤0.1
Hakseong≤3≤0.1
Publisher’s Note: MDPI stays neutral with regard to jurisdictional claims in published maps and institutional affiliations.

