Abstract
Improving regional innovation efficiency is the key to developing an innovative country. Exploring the spatio-temporal evolution characteristics of regional innovation efficiency is crucial in the formulation of regional policies and the choice of innovation models. This study used the superdata envelopment analysis method with undesirable outputs in evaluating the innovation efficiency of Chinese provinces. To assess the spatial spillover effects of innovation factors, the spatial autocorrelation and spatial Durbin model were adopted to characterize the spatio-temporal evolution, spatial correlation, and mechanisms of innovation efficiency. The highlights of the results are as follows: (1) The time-series changes in innovation efficiency showed a general trend from declining to increasing. (2) There were pronounced regional differences in innovation efficiency. The innovation efficiencies at the provincial level evolved from being decentralized to concentrated. The innovation efficiency was relatively stable in the eastern region and increased significantly in the central and western regions. The east–center–west evolution pattern gradually weakened. (3) The innovative efficiency exhibited spatial dependence, and the spatial agglomeration continued to increase. The extent of hot spots expanded, while cold spots shrunk slightly. (4) The scientific research environment, entrepreneurial environment, labor quality, and market environment were the essential elements that improved innovation efficiency. The impact of the different factors on innovation efficiency at different periods exhibited significant spatial heterogeneity.
1. Introduction
Innovation can reinforce the dominance of developed economies and further increase inequalities between regions or countries [1]; this is a way to promote the efficient output of production resources, which can improve the quality of the ecological environment, that is, the driving force for sustainable economic and social development [2]. Innovation efficiency is an indicator that characterizes the input–output relationship of innovation resources. China has emphasized the key role of technological innovation in socio-economic transformation development, leading to regional heterogeneity in innovation development [3]. Therefore, understanding the regional heterogeneity in China’s innovation efficiency can help decision makers improve policies and strategies to make the country more innovative and globally competitive.
One crucial indicator of innovation is innovation efficiency, used to measure the input–output relationship of innovation resources [4]. Numerous studies on innovation efficiency have been conducted in terms of content, scale, and methods, in particular, on evaluating innovation efficiency and its influencing factors. For instance, Luo et al. (2019) assessed the efficiency of China’s scientific and technological innovation in green development and found significant differences in green innovation efficiency between different industries [5]. Fan et al. (2021) explored the impact of environmental regulation heterogeneity on China’s innovation efficiency and found notable spatial spillover effects [6]. Min et al. (2020) evaluated South Korea’s innovation efficiency from innovation networks and innovation R&D investments and concluded that regional differences in innovation efficiency are urgent concerns that need to be resolved [7]. Lin and Luan (2020) investigated the relationship of government subsidies with the innovation efficiency of China’s wind energy industry and found a U-shaped correlation [8].
Previous studies have also explored factors that may affect innovation efficiencies, such as the level of economic development [9], foreign direct investments [10], and policy behavior [8]. These studies used various research scales, including country, provincial, and city levels [5,6,11,12]. Some researchers have studied innovation efficiencies at the micro-level, such as for different industries and companies [13].
In terms of research methods, quantitative analyses have been conducted using subjective and objective perspectives. One subjective approach is based on fuzzy evaluation and analytic hierarchy processes [14]. This method first determines each indicator’s weight, which could be highly subjective and result in biased evaluation results. Another approach uses non-parametric estimation methods [15], such as data packet models, which are widely used in measuring efficiency. The data envelopment analysis (DEA) model is a traditional data packet model used widely for the efficiency values of multiple decision-making units. As a result, many researchers have introduced improvements to the DEA model to allow more variables. Developed models include the super-efficient data envelopment analysis (Super DEA) model, the super-efficient slacks-based measure (Super SBM) model, and the global Malmquist–Luenberger model.
One major limitation to the traditional assessment of innovation efficiency is that previous research on provinces, economic belts, or regions often did not apply to the entire country, particularly in those with pronounced regional heterogeneity in resource endowments and socio-economic levels. This means that for studies to become comprehensive, they have to horizontally compare and analyze spatio-temporal differences in innovation efficiency for different regions. Furthermore, most existing studies often failed to consider the spatial component of innovation efficiency and overlooked the impact of spatial spillover effects of innovation factors.
To address these important research gaps, this paper evaluated 31 provinces (municipalities and autonomous regions directly under the central government) in China, evaluating their innovation efficiency for 2010–2018 using the bootstrapped DEA analysis method. This study analyzed the spatio-temporal evolution of innovation efficiency, spatial correlation, and effect mechanisms using spatial autocorrelation and SDM models and constructed a regional innovation efficiency analysis framework using a three-dimensional perspective of time and space. The study addresses the following research questions: (1) What is the temporal and spatial evolution pattern of China’s regional innovation efficiency? (2) Is there a spatial correlation in China’s innovation efficiency? (3) How does the spatial spillover effect of innovation factors affect innovation efficiency?
2. Materials and Methods
2.1. Calculation of Innovation Efficiency
2.1.1. Bootstrapped DEA
Innovation is a complex system with multiple inputs and outputs; it is difficult to calculate its efficiency. DEA is a method to comprehensively evaluate the relative effectiveness of the same types of departments with multi-index input and output. The traditional DEA method does not consider the influence of exogenous variables and random fluctuations on the efficiency value, so the results may be biased. Fried et al. developed a three-stage DEA method to better correct the errors caused by exogenous environmental variables on efficiency evaluation, making DEA efficiency evaluation more accurate [16].
Therefore, in this paper, we selected the three-stage DEA model to calculate the efficiency of innovation. However, DEA is a deterministic methodology. For this reason, the efficiency measurement cannot be used in statistical inference. To overcome the model’s shortcomings and resolve the problem of the radial distance, the bootstrapped DEA is proposed by Simar and Wilson [17]. Therefore, this paper used the bootstrapped DEA approach to obtain more robust innovation efficiency scores using the FEAR package in R and MaxDEA Ultra 6.19 [14]. The calculation steps of the bootstrapped DEA model are as follows:
Step 1: The adjusted input data and initial output data obtained by the three-stage DEA method were used to calculate the new efficiency value, as the initial efficiency value of bootstrap DEA:
Step 2: Using the repeated sampling method with return, and taking a paired bootstrap sample with scale n from θ as , the efficiency of the re-extracted sample value calculation was smoothed as follows:
is the smoothing parameter or bandwidth; is a random error belonging to standard normal distribution.
Step 3: After smoothing the efficiency value, it is also necessary to adjust the input data of the initial sample by using the following formula:
Step 4: The traditional DEA model was used to calculate the adjusted input and output data to obtain a new estimate of the efficiency value.
Step 5: The above process B (for example, B = 2000 times) was repeated to calculate the deviation of the efficiency score, so as to obtain the corrected efficiency value.
2.1.2. Selection of Input and Output Indicators
Considering data availability, various indicators were selected to calculate the efficiency of scientific and technological innovation.
The input indicators were as follows: personnel (full-time equivalent) for research and development (R&D) (unit: p), internal expenditure for R&D (unit: CNY 10,000), internal expenditure for R&D of industrial enterprise above the designated size (unit: CNY 10,000), urban construction land area (unit: square kilometer), total investment in fixed assets (unit: CNY 10,000), and urban employment (unit: people). The desirable output indicators were as follows [18]: the number of domestic patent grants and the number of Chinese scientific and technological papers included in major international search engines. Environmental factors were as follows: per capita GDP (unit: CNY /per person) and SO2 (unit: 10,000 t). For comparability purposes, all monetary indicators were adjusted for inflation and converted to 2000 values.
2.1.3. Spatial Autocorrelation Analysis
Spatial autocorrelation is used to assess whether the attribute value of a certain element is significantly related to its neighboring spatial points. This spatial analysis included global spatial autocorrelation and local spatial autocorrelation. Based on previous studies [19], the bivariate Moran’s for global autocorrelation and local autocorrelation was expanded to evaluate the correlation of the spatial distribution of different elements. The formula is as follows:
where is the value of the attribute of the spatial unit ; is the value of the attribute of the spatial unit ; and are the average values for attributes and , respectively; and and are the variances of the attributes and , respectively.
2.2. Analysis of Influencing Factors of Innovation Efficiency
2.2.1. SDM Model
Traditional assessment models assume that research objects are independent and often ignore spatial interactions. Goodchild (1992) posits that a region’s socio-economic conditions are interrelated with its neighbors, acknowledging the presence of spatial interactions between objects [20]. Additionally, as 3S technology has matured in recent years, spatial measurement methods have gradually become mainstream in regional economics [21,22]. Spatial measurement methods can simultaneously use cross-sectional and sequence data, providing abundant information for regression analyses and explaining spatial effects. Analyzing individual heterogeneity and cross-sectional dimensions can help explain the existence of spatial dependence
Existing spatial measurement models can be grouped into three types [23,24]: (1) the spatial lag model (SLM), which describes the influence of previously explained variables on the currently explained variable; (2) the spatial error model (SEM), which depicts the influence of error of adjacent region behavior on the currently explained variable; and (3) the spatial Durbin model (SDM), an expansion of the two other models that can simultaneously introduce spatial lag and error terms of the explained variable. In order to better characterize the spatial correlation of regional innovation efficiency and avoid estimation errors, this study used SDM in analyzing the influencing factors of innovation efficiency. SDM was applied in the MATLAB spatial metrology toolbox, where the spatial weight was an adjacency weight matrix calculated based on the latitude and longitude of the region’s centroids and the Euclidean distance methods. Three models were constructed for three different years (i.e., 2010, 2014, and 2018). To facilitate intuitive interpretation, the corresponding variables were directly utilized in the model, which uses the following formula:
where (dependent) is the value of innovation efficiency; is the explanatory variable; is the spatial adjacency matrix, ; and are the parameters to be estimated; is the random disturbance item. To reduce heteroscedasticity, all variables were normalized and de-dimensionalized. Moreover, to avoid non-stationarity and heteroscedasticity, natural logarithmic transformation was used on all variables.
2.2.2. Selection of Influencing Factors
An analysis index system of factors affecting innovation efficiency was constructed, combining the developed research framework with recommendations from previous research [7]. To account for the impact of infrastructure [25], scientific research environment [18], and entrepreneurial conditions on innovation and development [26], indicators such as Internet broadband access ports, science and technology expenditures, and R&D personnel of large industrial enterprises were selected. To assess the effects of market liberalization [27], labor quality [28], and financial environment on innovation and development [29], the following indicators were included in the study: total import and export in GDP, the number of people with at least a college degree, the per capita consumption expenditure, and the proportion of financial expenditure (Table 1). Data sources were derived from the China Statistical Yearbook (2011–2019) and China City Statistical Yearbook (2011–2019).

Table 1.
Index system of influencing factor analysis.
3. Results
3.1. The Temporal Characteristics of Innovation Efficiency
Table 2 presents the statistics of the three-stage efficiency and bias-corrected efficiency. The average three-stage efficiency (without bias correction) is 0.4924. Nevertheless, since DEA efficiency scores are biased upward, the mean score of the bias-corrected efficiency at 0.4440 suggests that three-stage efficiency could potentially decrease staff expenses by 9.82% on average. In addition, the Banker Charnes and Cooper efficient (BCC-efficient = 1) is made up of 50 decision-making units (DMUs) (17.92%), operating on the production frontier, while the maximum value of bias-corrected efficiency scores is 0.8904, indicating that there is no efficient area in our sample after correcting for bias.
Table 2.
Descriptive statistics of efficiency scores.
At the national level (see Figure 1), innovation efficiency declined from 2010 to 2012. The short-term impact of the 2008 global financial crisis on innovation activities resulted in reduced R&D expenditures. This caused a decline in innovation efficiency, with the average value dropping from 0.4371 in 2010 to 0.3993 in 2012. From 2013 to 2018, given the backdrop of innovation-driven development strategies, all provinces advanced in building a more efficient scientific research system, and the level of innovation efficiency exhibited a rapid growth trend. As a result, the average value for innovation efficiency rose from 0.3971 in 2013 to 0.4735 in 2018.
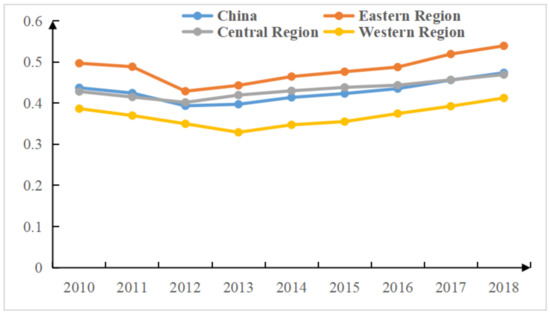
Figure 1.
Changing trends in China’s regional innovation efficiency.
At the regional level (see Figure 1), from 2010 to 2012, the innovation efficiency in the different regions was eastern region > central region > western region and exhibited a significant decrease. The average innovation efficiency in the eastern region fell from 0.4967 in 2010 to 0.4288 in 2012. In the central region, the value declined from 0.4281 in 2010 to 0.4016 in 2012, and from 0.3864 to 0.3497 in the western region. In 2013–2018, the innovation efficiencies in the different regions improved considerably. The innovation efficiency rose from 0.4429 in 2013 to 0.5390 in 2018 in the eastern region, from 0.4193 to 0.4691 in the central region, and from 0.3290 to 0.4123 in the western region. The increase rate in innovation efficiency was western region > central region > eastern region.
3.2. The Spatial Distribution Characteristics of Innovation Efficiency
In terms of spatial distribution (see Figure 2), regional innovation efficiency was generally characterized as high in the east and low in the west. From 2010 to 2013, high-efficiency zones decreased considerably, with many high-efficiency zones converted into medium–high-efficiency zones. On the other hand, medium–low-efficiency zones increased significantly, exhibiting a concentrated layout, while low-efficiency zones had marginal changes. From 2013 to 2016, high-efficiency areas expanded substantially. Some medium–low-efficiency areas were converted into medium–high-efficiency areas, resulting in the significant expansion of medium-high efficiency areas.
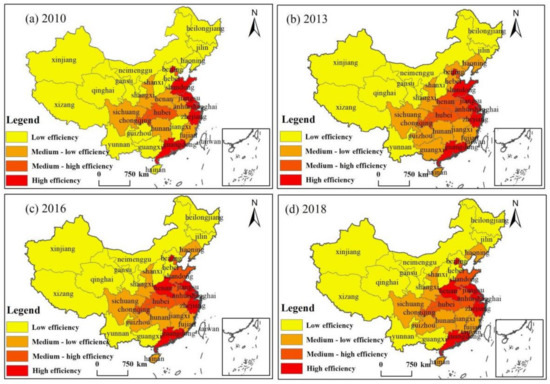
Figure 2.
The spatial distribution of China’s regional innovation efficiency: (a) innovation efficiency in 2010, (b) innovation efficiency in 2013, (c) innovation efficiency in 2016 and (d) innovation efficiency in 2018.
In contrast, low-efficiency areas greatly declined but still showed a concentrated layout. From 2016 to 2018, the change in innovation efficiency was largely consistent with the previous stage. High-efficiency and medium-high efficiency areas significantly expanded, while medium-low and low-efficiency areas considerably decreased. In general, the innovation efficiency at the provincial level for the research period 2010–2018 evolved from decentralized into concentrated configuration. The innovation efficiencies of provinces in the western regions had low efficiency in 2010 and 2018, while some improvements were observed in central and eastern regions.
3.3. Spatial Correlation Features
In terms of global spatial autocorrelation, the global Moran’s I values of innovation efficiency from 2010 to 2018 were positive and passed the significance test, indicating spatial dependence on innovation efficiency. Figure 3 graphs the global Moran’s I values for innovation efficiency during the research period. The slow rising trend in the figure suggests that the spatial difference in provincial innovation efficiency declined and that there is a large spatial correlation between variables. Therefore, in subsequent empirical analyses, the spatial correlation between adjacent regions has to be considered.
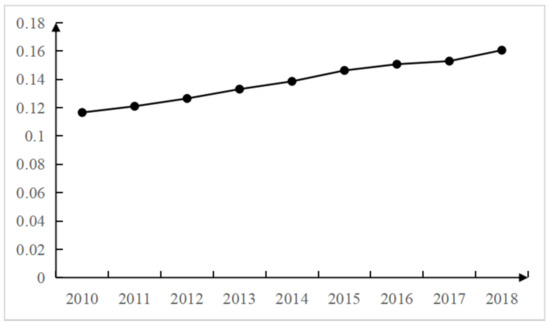
Figure 3.
Global Moran’s I of China’s regional innovation efficiency.
For local spatial autocorrelation (see Figure 4), the hot spots in 2010 were mainly concentrated in Jiangsu, while the cold spots were in Inner Mongolia. From 2013 to 2016, the hot spots expanded and were mainly located in Jiangsu and Anhui, while the cold spots also grew and were found in Inner Mongolia, Xinjiang, Gansu, and Ningxia. In 2018, the hot spots further expanded to include Jiangsu, Anhui, Shanghai, Zhejiang, and Fujian, while the cold spots slightly reduced and were located mainly in Inner Mongolia and Xinjiang. These values are generally consistent with the spatial distribution of innovation efficiency, presenting a pattern of high values in the east and low values in the west.
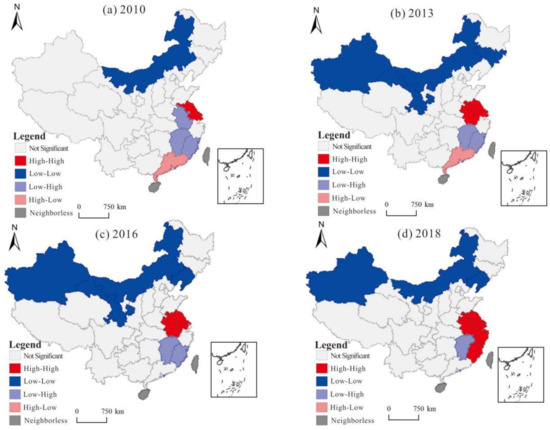
Figure 4.
Spatial distribution of hot and cold spots in China’s regional innovation efficiency: (a) local spatial autocorrelation in 2010, (b) local spatial autocorrelation in 2013, (c) local spatial autocorrelation in 2016 and (d) local spatial autocorrelation in 2018.
4. Discussion
4.1. Analysis of Influencing Factors of Innovation Efficiency
The SDM model was used to evaluate the spatial spillover effects of factors affecting innovation efficiency at different periods. The Variance Inflation Factor (VIF) and Condition Index were calculated in the SPSS software to test the multicollinearity among variables. The results showed that the VIF of each variable was less than five, while the Condition Index was less than 10. The validity of the panel data model was verified using the panel root unit test and the panel cointegration test. As shown in Table 3, the spatial lag coefficients for innovation efficiency at different periods were 0.252, 0.240, and 0.232, all significant at the 1% level.
Table 3.
Regression results of influencing factors of China’s regional innovation efficiency.
Table 3 shows that the different factors had varying impacts on innovation efficiency. The regression coefficients for infrastructure were 0.2204, 0.8540, and −0.4756, all significant at the 1% level. These values suggest that infrastructure had a significant positive effect on innovation efficiency in 2010 and 2014 and a significant negative effect in 2018. The regression coefficients for market liberalization (i.e., opening the markets to the outside world) were 0.1218, 0.2987, and −0.1161, indicating a change in the impact of market liberalization, from negative to positive effects. For the scientific research environment, the regression coefficients were 0.3612, 0.3176, and 0.3031, indicating the substantial influence of scientific research on innovation efficiency.
The regression coefficients for labor quality were 0.0807, 1.2764, and 0.8276, which shows that labor positively affects innovation efficiency. The regression coefficients for the market environment were 0.4664, 0.4357, and 0.2122, indicating that the market environment has a significant positive impact on innovation efficiency. For innovation level, the regression coefficients were 1.0134, 0.7296, and 0.4233, which implies that the level of innovation positively impacts innovation efficiency. The regression coefficients for the financial environment were −0.1203, 0.3256, and −0.0585. The results suggest that the financial environment negatively affected innovation efficiency in 2010 and 2018 while having a positive impact in 2014. Regional heterogeneity and spatial correlations are important aspects affecting the spatio-temporal distribution of technological innovation.
4.2. Analyses of the Mechanism of Innovation Efficiency
China’s infrastructure initially promoted innovation efficiency and then inhibited it [22]. As shown by the results, before 2014, infrastructure had a positive impact on innovation efficiency. During this period, 4G networks became more popular, which could have promoted innovation efficiency. In 2010 and 2014, the opening-up of the Chinese market to the international community positively impacted innovation efficiency. However, in 2018, China’s economic opening-up adversely affected innovation efficiency. Technology introduction produced a crowding-out effect on scientific and technological innovation to a certain extent, weakening enterprises at the time when they are engaged in funding R&D and innovation. When this occurs, the economic opening-up is not conducive to scientific and technological innovation investments and could adversely impact innovation efficiency.
Entrepreneurship is the carrier of innovation and could substantially impact innovation efficiency [26]. In 2014, large-scale entrepreneurship and innovation strategies were proposed, so that all provinces generated higher demands for entrepreneurial innovation. Therefore, innovation efficiency has a greater positive effect on the level of entrepreneurship. Labor quality can improve innovation efficiency. Innovation is knowledge intensive and results from human capital accumulation and allocation [28]. The market environment is an important mechanism for allocating innovation elements and related resources [29]. In 2010 and 2014, the market environment had a negative impact on innovation efficiency. The change from having a negative to a positive effect on innovation efficiency in 2018 suggests that institutional factors, such as intellectual property protection and legal system protection, have improved after decades of market-oriented reforms. These reforms in the market environment resulted in improvements to innovation efficiency. Innovation activities require considerable financial support, especially since long cycles and high costs of processes from input to output determine the stringent requirements for innovation efficiency in the financial environment [29]. The empirical results show that the financial environment fluctuated from negative to positive to negative effect on innovation efficiency. This finding differs from many previous studies. Some studies (e.g., Li et al., 2021) [18] found that the influence of financial agglomeration on innovation efficiency is positive, with the eastern region experiencing the strongest effect. Lv et al. (2021) [30] and others also concluded that the better the financial environment, the higher the innovation efficiency. One major reason for this different finding is that this study analyzed the phased impact of the financial environment to specifically be more reflective of its impact on innovation efficiency.
5. Conclusions
5.1. Conclusions
This paper used the bootstrapped DEA method to measure innovation efficiency for 31 provinces (municipalities and autonomous regions) in China and employed spatial autocorrelation and the SDM model to analyze the spatial correlation and influencing factors of innovation efficiency. The main conclusions are as follows:
- The time-series changes in innovation efficiency showed a general trend from decreasing to increasing. At the regional level, the innovation efficiency for 2010–2012 showed a pattern of eastern region > central region > western region. From 2013 to 2018, the innovation efficiency of the western region greatly improved, and the arrangement pattern between regions shifted considerably.
- The spatial change in innovation efficiency was generally characterized as high in the east and low in the west. The innovation efficiency at the provincial level demonstrated an evolution process from decentralized to concentrated. The innovation efficiency of provinces in the eastern region was relatively stable, while that of provinces in the central and western regions increased significantly. Additionally, the east–middle–west evolution pattern gradually weakened.
- Using the global spatial autocorrelation, innovation efficiency was found to have spatial dependence. The value of Moran’s I shows a slowly rising trend, indicating that the spatial agglomeration of innovation efficiency has continued to increase. In terms of the local spatial autocorrelation, the extent of hot spots continued to expand during the study period, while cold spots slightly decreased.
- In terms of the effect mechanism, different factors had varying effects on innovation efficiency at different periods. The results showed that scientific research environment, entrepreneurial environment, labor quality, and market environment had significant effects on innovation efficiency, and their impact varied considerably for different years.
5.2. Recommendations
Different regions should develop differentiated, innovative development paths. At the national level, improving the innovation environment involves determining the roles and functions of the government and the market in promoting innovation activities. To reduce regional differences in innovation efficiency, the requirements of each region in the innovation environment have to be identified and satisfied. For instance, the eastern region needs to modify its innovation environment structure from growth-promoting into an innovation-promoting environment. The central and western regions should offset their shortcomings in the innovation environment and promote the construction of innovation infrastructure to absorb more innovation resources and improve innovation efficiency. In addition, the exchange and cooperation of talents, funds, and technologies between regions should be strengthened to address regional disparities in innovation efficiency. Strategic regions, such as the Beijing-Tianjin-Hebei, Yangtze River Delta, and Pearl River Delta regions, should be effectively utilized in promoting new technologies, methods, and information to help narrow the gap in regional development and development quality.
The influencing factors of innovation efficiency need to be optimized [31]. First, policies and strategies that would improve the innovation environment, entrepreneurship, and quality of labor should be implemented. Medium–low- and low-efficiency regions should integrate their resources to attract high-quality talent and enhance the innovation potential of enterprises. Second, organizational models and paradigms that are compatible with leading technological innovation should be adopted. Universities, colleges, and other scientific research institutes should be supported in order for them to play their role in technological innovation. Third, market and financial trends should be continually evaluated and gauged, judiciously selecting technologically development projects and promptly transforming innovative resources into patented products [32].
This study explored the spatio-temporal patterns of innovation efficiency and its influencing factors, expounding the shortcomings and limitations of previous studies in innovation efficiency [33]. After multi-scale analyses of the spatio-temporal characteristics of innovation efficiency changes, the SDM model was used to analyze its influencing factors. Emerging economies that are still in the stage of building up their innovation capacities can use the findings of this study in developing their policies, strategies, or evaluation mechanisms for innovation efficiency.
However, this study has several limitations. Due to data availability concerns, the research scale was focused only on the provincial level. The spatio-temporal evolution mechanisms of innovation efficiency at the city, county, or district scale may significantly differ, resulting in highly divergent conclusions. Future research can also use new measurement techniques, such as high-resolution remote sensing, to generate and use more spatial information in the analyses.
Author Contributions
Conceptualization, Z.X. and X.Z.; methodology, Z.X. and X.O.; software, Z.X., X.O. and G.W.; validation, X.O. and G.W.; formal analysis, Z.X. and X.Z.; investigation, Z.X. and X.Z.; resources, Z.X. and X.Z.; data curation, Z.X. and X.O.; writing—original draft preparation, Z.X.; writing—review and editing, Z.X.; visualization, Z.X.; supervision, Z.X.; project administration, X.Z. and X.O.; funding acquisition, X.Z. and X.O. All authors have read and agreed to the published version of the manuscript.
Funding
This research was funded by the Major Program of National Social Science Foundation of China grant number 18ZDA040, and Natural Science Foundation of Hunan Province, grant number 2021JJ40015.
Institutional Review Board Statement
Not applicable.
Informed Consent Statement
Not applicable.
Data Availability Statement
Not applicable.
Conflicts of Interest
The authors declare no conflict of interest.
References
- Krugman, P. Development, Geography and Economic Theory; MIT Press: Cambridge, MA, USA, 1995. [Google Scholar]
- Ke, H.; Dai, S.; Yu, H. Spatial effect of innovation efficiency on ecological footprint: City-level empirical evidence from China. Environ. Technol. Innov. 2021, 22, 101536. [Google Scholar] [CrossRef]
- Lan, H.; Zhao, X. Spatial-Temporal Evolution and Innovation Environment Factors of Regional Innovation Efficiency in China. Econ. Geogr. 2020, 40, 97–107. (In Chinese) [Google Scholar]
- De Noni, I.; Orsi, L.; Belussi, F. The role of collaborative networks in supporting the innovation performances of lagging-behind European regions. Res. Policy 2018, 47, 1–13. [Google Scholar] [CrossRef]
- Luo, Q.; Miao, C.; Sun, L.; Meng, X.; Duan, M. Efficiency evaluation of green technology innovation of China’s strategic emerging industries: An empirical analysis based on Malmquist-data envelopment analysis index. J. Clean. Prod. 2019, 238, 117782. [Google Scholar] [CrossRef]
- Fan, F.; Lian, H.; Liu, X.; Wang, X. Can environmental regulation promote urban green innovation Efficiency? An empirical study based on Chinese cities. J. Clean. Prod. 2021, 287, 125060. [Google Scholar] [CrossRef]
- Min, S.; Kim, J.; Sawng, Y. The effect of innovation network size and public R&D investment on regional innovation efficiency. Technol. Forecast Soc. 2020, 155, 119998. [Google Scholar]
- Lin, B.; Luan, R. Are government subsidies effective in improving innovation efficiency? Based on the research of China’s wind power industry. Sci. Total Environ. 2020, 710, 136339. [Google Scholar] [CrossRef] [PubMed]
- Kalapouti, K.; Petridis, K.; Malesios, C.; Dey, P. Measuring efficiency of innovation using combined Data Envelopment Analysis and Structural Equation Modeling: Empirical study in EU regions. Ann. Oper. Res. 2020, 294, 297–320. [Google Scholar] [CrossRef]
- Omri, A.; Bel Hadj, T. Foreign investment and air pollution: Do good governance and technological innovation matter? Environ. Res. 2020, 185, 109469. [Google Scholar] [CrossRef] [PubMed]
- Bin, Q.; Zhao, X.; Hu, Z. Performance Evaluation of Technological Innovation Mode on the Equipment Manufacturing Industry of Shanxi Province. Procedia Eng. 2011, 15, 4908–4911. [Google Scholar] [CrossRef][Green Version]
- Jianmin, W.; Li, Y. Does factor endowment allocation improve technological innovation performance? An empirical study on the Yangtze River Delta region. Sci. Total Environ. 2020, 716, 137107. [Google Scholar] [CrossRef]
- Chen, M.; Sinha, A.; Hu, K.; Shah, M.I. Impact of technological innovation on energy efficiency in industry 4.0 era: Moderation of shadow economy in sustainable development. Technol. Forecast Soc. 2021, 164, 120521. [Google Scholar] [CrossRef]
- Zhao, P.; Zeng, L.; Lu, H.; Zhou, Y.; Hu, H.; Wei, X. Green economic efficiency and its influencing factors in China from 2008 to 2017: Based on the super-SBM model with undesirable outputs and spatial Dubin model. Sci. Total Environ. 2020, 741, 140026. [Google Scholar] [CrossRef]
- Liu, Y.; Dong, F. How technological innovation impacts urban green economy efficiency in emerging economies: A case study of 278 Chinese cities. Resour. Conserv. Recycl. 2021, 169, 105534. [Google Scholar] [CrossRef]
- Fried, H.O.; Lovell, C.A.K.; Schmidt, S.S.; Yaisawarng, S. Accounting for Environmental Effects and Statistical Noise in Data Envelopment Analysis. J. Prod. Anal. 2002, 17, 157–174. [Google Scholar] [CrossRef]
- Léopold, S.; Paul, W. Sensitivity Analysis of Efficiency Scores: How to Bootstrap in Nonparametric Frontier Models. Manag. Sci. 1998, 44, 49–61. [Google Scholar]
- Li, H.; Pang, S.; Cao, Y.; Gao, J. Research on the evaluation of comprehensive efficiency of technological innovation and eco-environment in China. J. Clean Prod. 2021, 283, 124603. [Google Scholar] [CrossRef]
- Griffith, D.A. Spatial Autocorrelation. In International Encyclopedia of Human Geography, 2nd ed.; Kobayashi, A., Ed.; Elsevier: Oxford, UK, 2020; pp. 355–366. [Google Scholar]
- Goodchild, M.F. Geographical data modeling. Comput. Geosci. 1992, 18, 401–408. [Google Scholar] [CrossRef]
- Yuan, J.; Beard, K.; Johnson, T.R. A quantitative assessment of spatial patterns of socio-demographic change in coastal Maine: One process or many? Appl. Geogr. 2021, 134, 102502. [Google Scholar] [CrossRef]
- Peng, W.; Yin, Y.; Kuang, C.; Wen, Z.; Kuang, J. Spatial spillover effect of green innovation on economic development quality in China: Evidence from a panel data of 270 prefecture-level and above cities. Sustain. Cities Soc. 2021, 69, 102863. [Google Scholar] [CrossRef]
- Elhorst, J.P. Dynamic spatial panels: Models, methods, and inferences. J. Geogr. Syst. 2012, 14, 5–28. [Google Scholar] [CrossRef]
- Wei, G.; Sun, P.; Jiang, S.; Shen, Y.; Liu, B.; Zhang, Z.; Ouyang, X. The Driving Influence of Multi-Dimensional Urbanization on PM2.5 Concentrations in Africa: New Evidence from Multi-Source Remote Sensing Data, 2000–2018. Int. J. Environ. Res. Public Health 2021, 18, 9389. [Google Scholar] [CrossRef]
- Pan, X.; Guo, S.; Li, M.; Song, J. The effect of technology infrastructure investment on technological innovation—A study based on spatial durbin model. Technovation 2021, 107, 102315. [Google Scholar] [CrossRef]
- Veiga, P.M.; Teixeira, S.J.; Figueiredo, R.; Fernandes, C.I. Entrepreneurship, innovation and competitiveness: A public institution love triangle. Socio-Econ. Plan. Sci. 2020, 72, 100863. [Google Scholar] [CrossRef]
- Moshirian, F.; Tian, X.; Zhang, B.; Zhang, W. Stock market liberalization and innovation. J. Financ. Econ. 2021, 139, 985–1014. [Google Scholar] [CrossRef]
- Novakova, L. The impact of technology development on the future of the labour market in the Slovak Republic. Technol. Soc. 2020, 62, 101256. [Google Scholar] [CrossRef]
- Zeng, W.; Li, L.; Huang, Y. Industrial collaborative agglomeration, marketization, and green innovation: Evidence from China’s provincial panel data. J. Clean. Prod. 2021, 279, 123598. [Google Scholar] [CrossRef]
- Lv, C.; Shao, C.; Lee, C. Green technology innovation and financial development: Do environmental regulation and innovation output matter? Energy Econ. 2021, 98, 105237. [Google Scholar] [CrossRef]
- Zhang, J.; Wu, Q.; Zhou, Z. A two-stage DEA model for resource allocation in industrial pollution treatment and its application in China. J. Clean. Prod. 2019, 228, 29–39. [Google Scholar] [CrossRef]
- Li, X.; Ma, D. Financial agglomeration, technological innovation, and green total factor energy efficiency. Alex. Eng. J. 2021, 60, 4085–4095. [Google Scholar] [CrossRef]
- Zhao, S.L.; Song, W.; Zhu, D.Y.; Peng, X.B.; Cai, W. Evaluating China’s regional collaboration innovation capability from the innovation actors perspective—An AHP and cluster analytical approach. Technol. Soc. 2013, 35, 182–190. [Google Scholar] [CrossRef]
Publisher’s Note: MDPI stays neutral with regard to jurisdictional claims in published maps and institutional affiliations. |
© 2021 by the authors. Licensee MDPI, Basel, Switzerland. This article is an open access article distributed under the terms and conditions of the Creative Commons Attribution (CC BY) license (https://creativecommons.org/licenses/by/4.0/).