Article

A Classification Analysis of the High and Low Levels of Global Competence of Secondary Students: Insights from 25 Countries/Regions

Department of Linguistics, School of International Studies, Zhejiang University, Hangzhou 310058, China
*
Author to whom correspondence should be addressed.
Sustainability 2021, 13(19), 11053; https://doi.org/10.3390/su131911053
Submission received: 7 September 2021 / Revised: 1 October 2021 / Accepted: 2 October 2021 / Published: 6 October 2021

Abstract

:
The reinforcement of global competence is vital for students to thrive in a rapidly changing world. This study explores the synergistic effects of both student and school factors on the classification of secondary students with high and low levels of global competence. Data are selected based on 208,556 secondary students from 6902 schools in 25 countries/regions and extracted from the Programme for International Student Assessment (PISA) 2018 datasets. Different from previous research, in this study, data science techniques, i.e., decision trees (DTs) and random forests (RFs), are adopted. Classification models are built to discriminate high achievers from low achievers and to discover the optimal set of factors with the most powerful impact on the discrimination of these two groups of achievers. The results show that both models have satisfactory classification abilities. According to the factor importance rankings in terms of discriminating global competence disparities, student factors play a major role. They especially emphasize students’ capacities to examine global issues, students’ awareness of intercultural communication, and teachers’ attitudes toward different cultural groups.

1. Introduction

As globalization has provided more opportunities for students to interact with foreign people and become exposed to different cultures, it has also caused tension and anxiety with respect to international competitiveness [1]. To adapt and respond to this challenge, people are looking to education to cultivate students with the ability to better appreciate and benefit from cultural differences; this is called global competence [2]. The 2030 Agenda for Sustainable Development also recognizes the critical role of education in ensuring the sustainable development of students and global sustainability [3]. According to the Programme for International Student Assessment (PISA), global competence is defined as ‘the capacity to examine local, global and intercultural issues, to understand and appreciate the perspectives and world views of others, to engage in open, appropriate and effective interactions with people from different cultures, and to act for collective well-being and sustainable development’ [4] (p. 7).
The enhancement of global competence helps students live harmoniously in multicultural communities, thrive in a changing labor market, effectively and responsibly use media platforms, and support Goal 4, quality education, of the Sustainable Development Goals [4,5,6]. With such benefits, global competence should be promoted as a normative education belief. However, different schools and education systems offer different levels of global competence education [7]. Thus, global competence education still requires further improvement. The identification of the relevant factors/variables of global competence becomes essential, as they help schools implement more targeted educational policies.
Previous studies focused on the relevant factors of global competence mainly at the student and school levels, including student experiences, language proficiency, socioeconomic backgrounds of families and parenting [8,9,10] at the student level, and teacher proficiency and school rankings [11,12,13] at the school level. However, few studies target students’ global competence disparities. The inequality between high and low achievers is worth special consideration because the great disparities in competence levels affect not only the chances of academic success later in life but also the likelihood of full participation in society [14]. Therefore, to better address the issue of educational inequity, it is vital to study the factors relevant to global competence level discrepancies.
Bronfenbrenner’s influential ecological system model suggests that the high achievement of students in terms of learning is the combined effort of all contextual factors rather than the effect of any particular factor [15]. Nevertheless, due to the lack of comprehensive global competence assessments, most extant studies examine the effects of factors at either the student or school level, and they fail to integrate factors from different levels together or test their combined influence on global competence. The PISA, one of the most large-scale international tests developed by the Organization for Economic Cooperation and Development (OECD), introduced global competence into its test for the first time in 2018. It designs questionnaires for students, teachers, parents, and schools to test their global competence levels and provides rich data on students’ and schools’ background information. Based on the elaborate PISA 2018 global competence assessment, this study aims to construct classification models of secondary students’ global competence levels with factors from both school and student levels to test their combined effect and identify the optimal set of factors with the most powerful impact on discrimination.

2. Literature Review

2.1. Relevant Factors of Global Competence

The identification of factors that are relevant to global competence has important implications regarding the risks and treatment in the critical developmental period of students [10]. Intensive studies have been conducted on the factors that are beneficial for the prediction of global competence; they were proposed at either the student or school level, as summarized in Table 1.

2.1.1. Student Factors

Most factors come from the student level and can be roughly divided into four categories: educational environments and experiences, language proficiency, life experiences, and family influences.
First, students’ global competence is enhanced by their international learning environment and experiences [8]. Studying abroad is considered a primary way for students to enhance their global competence by recognizing diversity and engaging more in intercultural communication [9]. Through surveys of college students in a U.S. university and a Korean university, researchers found that cross- and inter-cultural projects also had a significant positive impact on the communication skills and knowledge of the participants [8]. Even a local setting of a Chinese English as a foreign language (EFL) classroom can actualize global competence education, where students are exposed to a different system of thinking [7].
Second, language proficiency is crucial to global competence. Language is always a prerequisite for communication and interaction. The president of the American Council on the Teaching of Foreign Languages (ACTFL), Redmond, once stated that foreign languages or world language skills were at the core of students’ preparation for globalization and that the study of languages made global competence possible [16]. In contrast, language barriers impede communication and thus have a negative impact on global competence [8]. In addition, the extent to which language is used also influences international students [1]. As language proficiency is not sufficient for nonnative students, they should be further equipped with the knowledge about cultures, values, beliefs, and customs of the target country [17].
Third, life experiences are also significant to global competence. Mass media, mass migration, time zone differences, and contact with foreigners during daily life are relevant to global competence in that they influence individuals’ lifestyles, attitudes toward the global economy and consumption, and exposure to and understanding of foreign cultures [8,9].
Furthermore, global competence is greatly affected by family factors, mainly family backgrounds and parenting. On one hand, students who come from families with superior economic, social, and cultural states behave better in global competence tests [13]. There are fewer educational resources allocated to students in rural regions, those in poverty, and those whose parents are poorly educated, leading to poorer performance on global competence tests. On the other hand, family shapes a student’s early childhood characteristics. Negative parenting, maternal depression, and emotion dysregulation lead to lower adolescent global competence [10].

2.1.2. School Factors

Schools, as the primary source of global competence education, play an irreplaceable role. Global competence education is designed to facilitate students’ social and political engagement with people from different cultural groups, along with analysis and reflection [12]. This type of education teaches students’ dispositions, self-perceptions, and relationships in terms of interactions with other people. Overall, teachers and school rankings are the most prominent school factors.
First, teachers’ global competence levels and teaching techniques determine the quality of global competence education. Good teachers can create responsive learning environments and cultivate students with abundant cultural knowledge and communication skills with people from diverse cultural backgrounds [11]. Therefore, various study programs have been targeted at teachers. For instance, a short-term study abroad program was organized for teachers to enhance their instructional strategies [11], and an English-focused service learning project was launched for preservice language teachers to enhance their cultural awareness and deepen their cultural understanding through direct experiences [12].
Second, attending a key high school positively affects the global competence of the students, as higher-ranked schools tend to introduce more opportunities for cross-cultural communication and events [13].

2.2. Research Framework

Bronfenbrenner’s ecological system model emphasizes both individual and contextual systems and the interconnected relationship between the two systems [15]. This well-founded model includes five systems: a microsystem, a mesosystem, an exosystem, a macrosystem and a chronosystem. The questionnaires of the PISA 2018 global competence assessment mainly focus on contextual factors from the microsystem, exosystem and macrosystem. The microsystem refers to any environment in which the given child spends a great deal of time, while the exosystem includes contexts in which individuals are not situated but have an important indirect influence on their development, and the macrosystem indicates contexts encompassing any group whose members share the same values or beliefs [18]. In addition, the ecological system model argues that students’ learning progress is achieved by the integration of contextual factors from different systems rather than the effects of single factors. As most extant studies have concentrated on the effects of several features only at either the student or school level, this study intends to examine the combined influence of the factors from the microsystem, exosystem and macrosystem at the student and school levels.
This research is also grounded in the PISA 2018 global competence assessment, which has received intensive studies and critical examinations [5,19,20]. The PISA describes its assessment as “the world’s premier yardstick for evaluating the quality, equity, and efficiency of school systems” [21] (p. 11). Regarding PISA’s worldwide influence and reputation, this research is established upon the same assessment framework to build classification models that predict the global competence levels of 15-year-old students. In accordance with the global competence framework proposed in the PISA 2018 Global Competence Handbook, factors from both the student and school aspects contain four dimensions: (1) to examine issues regarding local, global, and cultural differences (examination); (2) to understand and appreciate the perspectives and viewpoints of others (understanding and appreciation); (3) to engage in open, appropriate, and effective interactions across cultures (engagement); and (4) to take actions for sustainable development and collective well-being (action). As shown in Figure 1, each dimension helps build specific knowledge, attitudes, values, and skills. Combined with the ecological system model, a global competence framework (Figure 1) is devised to classify students’ global competence levels and identify the most powerful factors with respect to discrimination to make suggestions for global competence education.
This study mainly discusses the following research questions:
  • To what extent can the student and school factors extracted from global competence questionnaires discriminate students with high levels of global competence from those with low levels of global competence?
  • What is the optimal set of factors with the most powerful impact on the discrimination of global competence discrepancies?

3. Materials and Methods

3.1. Data Sources

The PISA 2018 administered global competence questionnaires to both students and schools. The questionnaire data were stored in a student questionnaire dataset and a school questionnaire dataset (URL: http://www.oecd.org/pisa/data/2018database/ accessed on 1 December 2020). To obtain a comprehensive examination, this research selected all the countries that participated in the global competence assessment. There were 25 countries/regions in total (see Appendix A Table A1), covering Asia (Chinese Taipei, Korea, Thailand, etc.), Europe (Greece, Russian Federation, Spain, etc.), the Americas (Chile, Colombia, Panama, etc.), and Africa (Morocco).
Students were classified into high achievers (students with high-level global competence) and low achievers (students with low-level global competence). The classification criterion was an analogy with the official standard to divide resilient and nonresilient students. In the official PISA 2018 Insights and Interpretations document, resilient students were defined as those who scored in the top quarter in terms of reading performance, and nonresilient students consisted of the remaining 75% [22]. In the same way, among all the students, the students who ranked in the top 25% of the global competence performance results were labeled high achievers, and the rest were labeled as low achievers. After data preprocessing, the data of 208,556 secondary students from 6902 schools in these 25 countries were cleaned. The basic demographic information of the students is shown in Table 2.

3.2. Variables

Based on the conceptual framework, variables were extracted at the student level and school level from the student questionnaire dataset and the school questionnaire dataset, respectively, to establish a model to determine global competence disparities.
The PISA 2018 applied a multimethod and multiperspective approach for global competence assessment. On one hand, a cognitive test was designed to evaluate students’ background knowledge and cognitive skills for solving problems regarding global and intercultural issues. This test was objectively scored, which meant that each answer could be judged as right or wrong. Based on the students’ answers to the test, the PISA provided 10 plausible values (PVs) for each student as unbiased estimates of his or her global competence. A student’s total global competence score was then obtained by adding the 10 PVs together. Students with scores in the top 25% were tagged as high achievers, and the rest were tagged as low achievers [22]. The level of global competence served as the dependent variable. Additionally, the PISA provided a student weight for each student as the number of students in his or her group in the whole population. To achieve unbiased estimation [14,23], this study carefully considered the student weights.
On the other hand, a set of items in the global competence questionnaires collected self-reported information from students and schools concerning related knowledge, cognitive skills, and social skills and attitudes. Some variables were derived variables provided by the PISA, while others were computed based on the original indices. In Table 3, two examples are shown, one at the student level (self-efficacy regarding global issues) and one at the school level (attention to global competence in the curriculum).

3.3. Models

3.3.1. Previous Prediction Models

The establishment of prediction models helps educational stakeholders better design interventions and service programs for students’ development [24]. While most of these studies are dedicated to testing the relevance and predictability of latent factors, there is little research on the classification models concerning global competence. The only published study classified multicultural experiences into five categories using cluster analysis and matched the corresponding levels of global competence to these categories [25]. It found that students in the ‘foreign-friend’ type and ‘study-and-tour’ type had higher levels of global competence than those in other categories.
In recent years, data science methods have been increasingly applied to the establishment of prediction models with large-scale datasets [26]. Indeed, machine learning tools have outperformed traditional statistical models in many aspects. First, they do not require manual parameter settings. Their parameters are fine-tuned, and the models are improved automatically through training [27]. Second, they are not influenced by data multicollinearity, which is a critical hidden danger in regression models [28]. Third, they can capture and interpret the complex relationships between variables [29].
Several previous studies on classification tasks that utilize large-scale datasets have demonstrated the efficiency, accuracy, and robustness of data science models. The most frequently employed algorithms include decision trees (DTs) [28], random forests (RFs) [29], support vector machines (SVMs) [30,31], and eXtreme gradient boosting (XGBoost) [32].
As discussed before, the existing classification model for global competence implements a traditional statistical analysis method on small-scale samples. With the newly published PISA 2018 dataset, which is enormous and rigorous, machine learning techniques can be effectively utilized. In view of the strong abilities of DTs and RFs and their high accuracy in terms of classification [33,34], this research utilized DTs and RFs to build classification models that can discriminate global competence levels and retrieve the most powerful discrimination factors.

3.3.2. Decision Trees

The DT method can be used in both regression models and classification models. Generally, the ultimate goal is to divide all the input data points into a given number of categories based on a series of ‘if’ statements. To achieve this, a recursive binary greedy algorithm is implemented. During each step, the data points are separated into several regions according to the variable with the smallest error rate. This step is repeated until the stopping criterion is reached, as shown in Figure 2.
In classification models, the error rate refers to the ratio of training observations that do not fall into the most common category. However, classification error is not sensitive to tree growth after the tree had exceeded a certain size. To address this problem, when evaluating a particular step, two other measures are used more often: the Gini index and entropy. These metrics interpret the impurity of a node because when most of the observations of a node come from the same class, their values are very small. The reduction in impurity also helps a DT determine the importance of each input variable, with all variables’ importance values adding up to 1.
Trees are widely used due to their advantages. They are easy to construct and have the ability to handle qualitative predictors without dummy variables. Despite this, tree models also have some shortcomings. For instance, they are very sensitive to outliers.

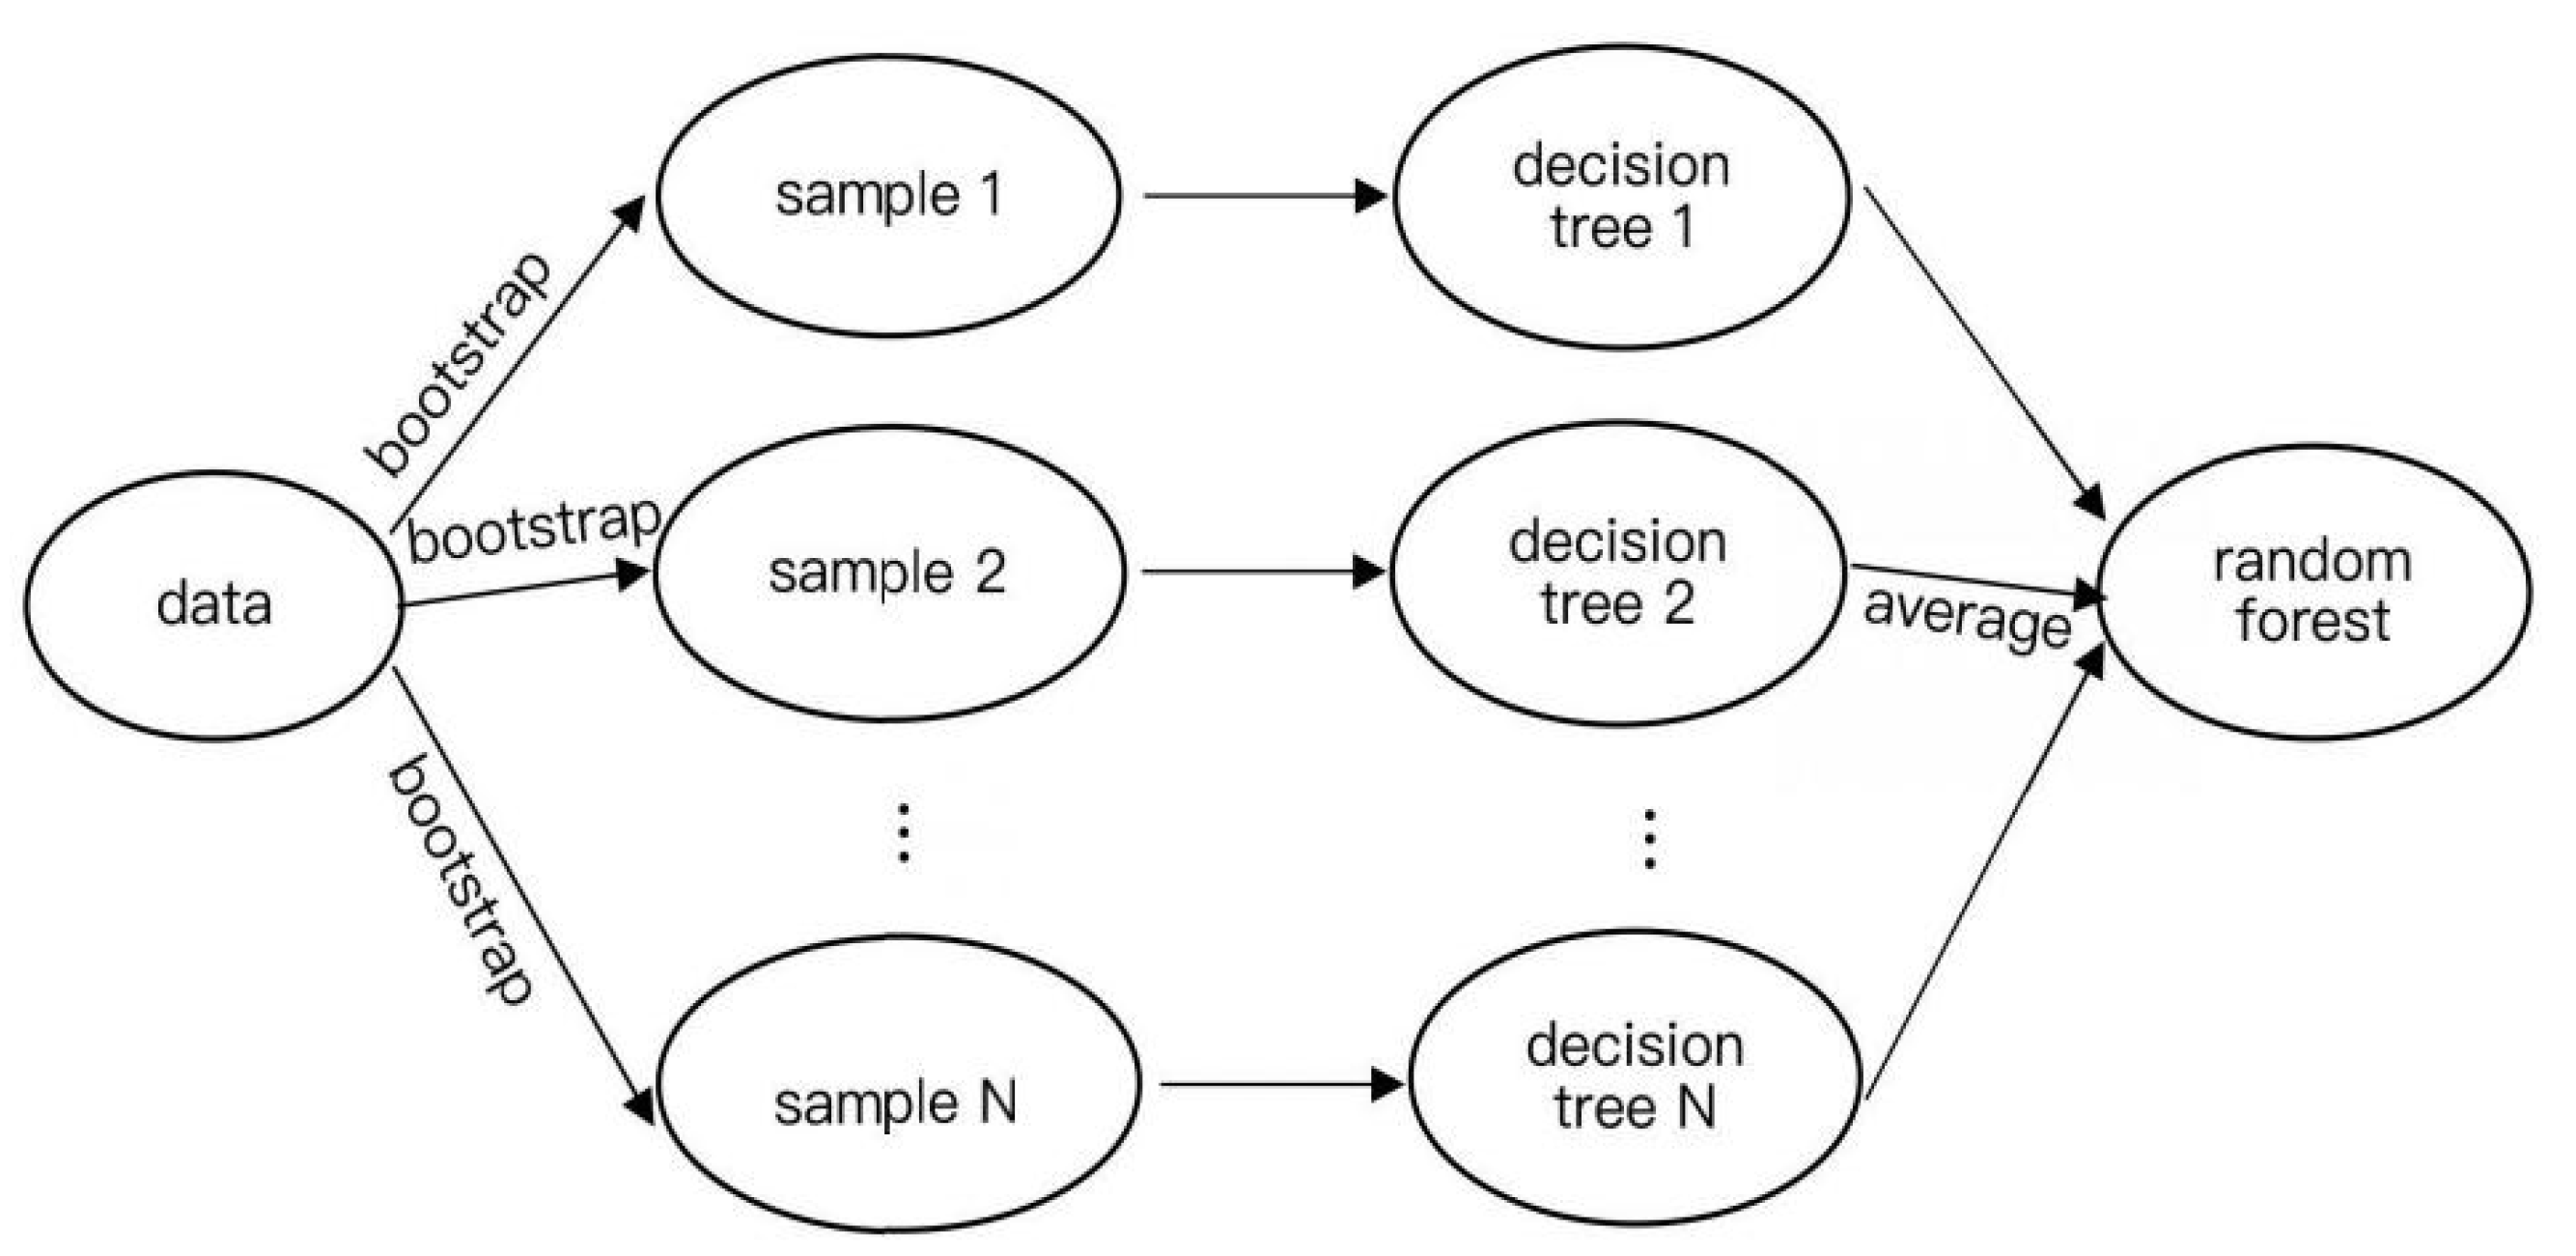
3.3.3. Random Forests

The RF algorithm is especially renowned for its high accuracy and high interpretability regarding complex interactions among predictors [29].
An RF is built upon bagging, which involves assembling many trees together and choosing the class with the maximal likelihood given their predictions. RFs have further introduced a random predictor selection mechanism. More specifically, to obtain a noncorrelated tree growing process, in each round the algorithm randomly selects a batch of predictors and chooses the best split among these predictors. However, this number is not very small, at approximately 1/3 of the total number of predictors. The steps required to build an RF are shown in Figure 3.
For an RF model, there are two main ways to rank the importance of predictors: using the out-of-bag (OOB) error metric or by decreasing impurity. As bootstrap sampling draws only a part of the original data for each DT, the rest of the data are called OOB data. To measure the importance of a variable, the OOB error is calculated as the error induced when fitting OOB data into the model. The score of the variable is calculated as the average of the OOB error differences before and after the permutation of all trees. The higher the score, the more important the variable is. Another way is to collect the average impurity reduction for each variable. The average value of all trees in a forest measures the importance of the variable. This method is known for its computational efficiency, as all the required values have already been computed during model training.
This research established two models based on RFs and DTs and compared their performances in terms of prediction accuracy and generalization ability. Because the mechanism of an RF is the aggregation of many DTs, the RF model should exhibit better prediction performance than the DT.

3.4. Data Preprocessing

The first step involved class labeling. For the output variables, a student’s score was computed as the sum of his or her 10 PVs. Students ranked in the top 25% were regarded as high achievers, and their levels were labeled 1. The rest of the students were low achievers, and their levels were labeled 0. The input variables were transformed into dummy variables, whose values were numbers determined according to the value scales in the global competence questionnaires. For instance, there were four possible values for question ST196Q02HA, as listed in Table 3. According to its value scale, ‘I could not do this’ was labeled as 1, ‘I would struggle to do this on my own’ was labeled as 2, etc. In this way, qualitative responses were converted into numerical values.
The second step was feature engineering. The variables whose values were not given in the dataset were computed as the summation of all their question responses. For example, the value of the variable “attention to global competence in the curriculum” equaled to the sum of the values of its questions (i.e., SC167Q01HA, SC167Q02HA… SC167Q06HA). Moreover, the variable data did not require normalization, as the RF and DT models do not compute the distances between different variables but work on the division boundaries of each variable [35]. Table 4 offers an overview of all the variables.
The final step concerned the imputation of missing values. Because students from the same school should have relatively similar contact for achieving global competence, it was reasonable to replace the nulls with the values of other students in the same school [30]. If none of the students from a particular school had values for this variable, the values of the students in the whole country were used alternatively. More specifically, for each variable, missing values were filled up with random values between the mean and the standard deviation [36]. After this step, if a student still had any missing fields, his or her record would be eliminated directly [32]. Ultimately, the data of 208,556 secondary students were cleaned for model training.

3.5. Model Training

The model training process required finding the optimal parameters with the highest accuracy, training models based on the optimal parameters, and examining the resulting models’ generalization abilities [35].
For the first stage, parameter tuning, a grid search with cross validation was implemented. First, the dataset was divided into two parts, with 80% as the training set and 20% as the testing set, both of which shared the same percentages of high achievers and low achievers with those of the original dataset. Next, the grid search method was used to examine the performances of a given set of parameters with the training set and returned the optimal parameters with the best performance. For the DT model, the tuned parameters were the maximum depth, loss criterion, and minimum samples for a leaf node. For the RF model, the tuned parameters were the number of estimators, loss criterion, and minimum samples for a leaf node. The exact values of the parameters are shown in Appendix B (Table A2). A fivefold cross validation was conducted to ensure improved accuracy [37]. The model performance was computed by averaging the prediction errors induced on the five validation sets. Figure 4 illustrates an example of the fivefold cross validation method. White blocks denote the training sets, and gray blocks represent the validation set in each split.
The second stage, model training, was performed to fit all the training data into the models with the optimal parameters. The third stage, model generalization, was utilized to evaluate the performance of the models on the testing set.
These three steps were all achieved by the ‘GridSearchCV’ class in the Scikit-learn package of Python. It efficiently conducted a grid search method with cross validation over all the parameter permutations, automatically fitted the models with optimal parameters on the training set, and evaluated the models’ generalization abilities with the ‘score’ method. For each model, a random seed was generated for reproducibility.

3.6. Model Evaluation

Although accuracy is the most commonly used evaluation metric, other supplementary metrics, such as the sensitivity and generalization abilities of the models, should also be implemented to obtain a comprehensive evaluation. In this study, precision, recall, the F-score, and the area under the receiver operating characteristic curve (AUC) were also selected. To the best of our knowledge, the effect size is not compatible with machine learning models [31,38]; therefore, it was not included in this study. After binary classification, the prediction results generated a confusion matrix, as shown in Table 5.
The accuracy, precision, recall, F-score, and AUC metrics could all be computed based on the confusion matrix. Accuracy is the percentage of achievers that were correctly classified. Precision is the percentage of high achievers that were correctly classified among all the achievers who were predicted as high-level achievers. Recall is the percentage of achievers that were correctly classified among all the high achievers. Precision and recall are contradictory, as they cannot increase at the same time. To cater to both sides, the F-score takes the harmonic mean of precision and recall.
A receiver operating characteristic (ROC) curve is a 2-dimensional curve that represents the performance of a binary classifier as its discrimination threshold is varied. The AUC is the area under the ROC curve. It reflects the classification ability of the given model by illustrating the probability differences of a classifier to randomly rank a high achiever and a low achiever. If the model is perfectly constructed, all of the above metric scores would be 1, and the scores should be 0.5 for a randomly built model. A score that reaches 0.8 is generally considered satisfactory [39].

4. Results and Discussion

4.1. RQ 1 to What Extent Can the Student and School Factors Extracted from Global Competence Questionnaires Discriminate Students with High Levels of Global Competence from Those with Low Levels of Global Competence?

Previous research has intensively studied factors relevant to global competence at the student level or school level, but most of those studies failed to examine the synergistic effects across levels. In addition, no research has established any classification models that can discriminate students with high and low global competence levels. With the help of the PISA global competence datasets and machine learning techniques, this study built two classification models intended to fill these research gaps. The training and testing performances of the DT and RF models are summarized in Table 6 and Figure 5.
From the abovementioned statistics, the testing accuracies of both models exceeded 80% (80.05% for the DT model and 81.59% for the RF model), indicating that both models had convincing classification abilities. They showed that the selected factors were sufficiently effective to discriminate high achievers from low achievers, justifying the need to test these factors’ correlations with global competence and their individual impacts on the models’ accuracy. These findings could be perfectly integrated into the ecological system model. According to this model, the factors extracted from the PISA 2018 global competence questionnaires were assigned to microsystem, exosystem and macrosystem categories. The high accuracies of the DT and RF models testified to the collective effect of contextual student and school factors from these three systems on the good performance of high achievers.
Furthermore, the RF model had a comparably better performance than the DT model. In Table 6, all the evaluation metrics of the RF model were higher than those of the DT model. Figure 5 clearly shows that the RF model had a higher AUC. This result was in line with expectations. Because the mechanism of an RF is the bagging of DTs, the RF model should obtain a better prediction performance than the DT model.

4.2. RQ 2 What Is the Optimal Set of Factors with the Most Powerful Impact on the Discrimination of Global Competence Discrepancies?

Both models exhibited satisfactory classification performances and were therefore both chosen to rank the importance of variables in discriminating global competence disparities. In total, 21 variables were extracted from the questionnaires, and Table 7 lists all of them according to their importance levels in descending order, with the corresponding line chart shown in Figure 6.
Overall, the student variables were markedly more important than the school variables. It is obvious that most school variables ranked low, regardless of whether the RF model or DT model was used. Apart from the variable “intercultural attitudes of teachers” (ST223Q), the most significant school variable in the DT model was “school with visiting teachers from other countries” (SC159Q01HA) (ranked 10th), and in the RF model it was “multicultural/intercultural education practices at school” (SC165Q) (ranked 15th). In particular, in the rankings of the RF model, among the last seven variables, six were school-level variables. These results implied that student factors played a dominant role in classification, as the overall ranking of student factors was much higher than that of school factors. By comparison, school factors were not as powerful, but they had a complementary effect with student factors. In particular, the school factor “intercultural attitudes of teachers” (ST223Q) ranked in the top three. These results indicated that the good performance of the models was credited to the combined effort of the factors across levels, with student factors as the principal variables and school factors as the auxiliary variables; this result was in line with the ecological system model.
Additionally, the top three variables were the same for both models regardless of their sequences: the school variable “intercultural attitudes of teachers” (ST223Q) and the student variables “self-efficacy regarding global issues” (GCSELFEFF) and “awareness of intercultural communication” (AWACOM). The trends of the lines in Figure 6 also implied that the importance of the top three variables was much greater than that of the rest of the variables for both models, which confirmed their strong predictive abilities. Here, we take a closer look at the optimal variables at the student and school levels.
The good performance yielded by student factors justified the need for further examination. The two most powerful student factors were “awareness of intercultural communication” (AWACOM) and “self-efficacy regarding global issues” (GCSELFEFF), which assigned to the microsystem in the ecological system model. Much research has stated the importance of intercultural communication, but such studies emphasize the frequency and depth of communication [8,9]. The awareness of intercultural communication, however, stresses the attention given to expressions and interactions when speaking to foreign people in one’s native language. A stronger awareness of intercultural communication indicates a higher level of global competence. The cultivation and enhancement of students’ knowledge about cultural differences and communication skills helps ensure polite and effective communication with foreigners.
Self-efficacy regarding global issues is a student’s self-evaluation of his or her knowledge about global issues such as climate change, refugee problems, and economic crises and how well he/she can discuss or explain these matters. High achievers have higher self-efficacy scores regarding global issues, illustrating that they have deeper knowledge of related topics than low achievers. Self-efficacy is acquired either via school education or through life experiences. At schools, an alteration in teaching components and school policies to cover a broader range of intercultural topics deepens students’ knowledge about international events and consequently enhances students’ global competence [9,40]. Moreover, a study abroad program is also an effective approach as it provides students with direct cross-cultural experiences [2]. Current studies also propose that global contact does not have to be face-to-face, as it is expensive, time-consuming, and demanding [41]. Global virtual intervention programs leveraging the power of computers and the internet is an alternative direction of global competence education [42]. Life experiences such as mass media and mass migration are closely related to global competence, as they exert influence on individuals’ lifestyles, attitudes toward the global economy and consumption, and exposure and understanding of foreign cultures [8]. For instance, many global issues, such as refugee problems, have not yet reached a global consensus, so the related policies, publicity, and experiences of different nations may lead to different degrees of familiarity and understanding among students [5].
School factors were also correlated with global competence disparities, but to a lesser extent. The school factor with the strongest impact was “intercultural attitudes of teachers” (ST223Q), which belonged to the exosystem in the ecological system model. The intercultural attitudes of teachers reflect teachers’ attitudes and treatment toward certain cultural groups. It is worth noting that this factor actually evaluates teachers’ performances in the eyes of students, so it is more objective than teachers’ self-evaluation. The results have shown that teachers of high achievers generally do not discriminate against people from certain cultural groups. Teachers are a critical part of global competence education because teachers with higher global competence help build a more responsive learning environment and give lessons with cultural knowledge and communication skills [11]. The Globally Competent Teaching Continuum especially emphasizes teachers’ disposition of empathy and valuing multiple perspectives and their experiential understanding of multiple cultures, as teachers’ attitudes and values have a direct influence on students’ dispositions, self-perceptions, and relationships during interactions with other people [43]. If a teacher acts out a negative attitude, such as blaming people of some cultural groups for certain national problems or having lower academic expectations for students of some cultural groups, his or her students will also mimic the teacher and behave improperly toward these cultural groups.

5. Conclusions

Noting that little research has been conducted regarding the classification of global competence levels, this study is the first to establish models that successfully discriminate high achievers from low achievers. Moreover, considering that the PISA 2018 global competence datasets are large-scale datasets, data science techniques (DTs and RFs), which have never been used in previous global competence studies, were implemented. The results showed that both models offer satisfactory classification results, with accuracies surpassing 80%, and that the RF model is superior to the DT model, as the former achieves higher values for all the proposed evaluation metrics.
In addition, as most extant research focuses on several relevant factors at either student or school level, this study examined and proved the collective impact of 21 relevant factors across these two levels on global competence disparities for the first time, which corresponds with Bronfenbrenner’s ecological system model. The importance levels of the factors in terms of discrimination were also explored. While student factors played a leading role, school factors also had a nonnegligible complementary effect.
Although this research established convincing classification models and addressed the proposed research objectives, it still requires further improvement. For instance, the features could be better designed. Some variables were computed as the summation of their question responses, which might introduce bias when one question had no effect or a counter effect to the model and consequently affected the interpretation ability of its leading variable. If a more scientific combination of questions is selected in future studies, the resulting models will achieve better performance.

Author Contributions

Conceptualization, X.H. and J.H.; formal analysis, X.H. and J.H.; funding acquisition, J.H.; investigation, X.H. and J.H.; methodology, X.H. and J.H.; supervision, J.H.; writing—original draft preparation, X.H.; writing—review and editing, X.H. and J.H. Both authors have read and agreed to the published version of the manuscript.

Funding

This research was funded by National Social Science Fund of China, China, grant number 21BYY024.

Institutional Review Board Statement

The study procedures were in accordance with the ethical standards of the Helsinki Declaration and were approved by the Ethics Committee of the School of International Studies, Zhejiang University.

Informed Consent Statement

Informed consent was obtained from all subjects involved to authorize their participation in the study.

Data Availability Statement

Publicly available datasets were analyzed in this study. This data can be found here: http://www.oecd.org/pisa/data/2018database/ (accessed on 1 December 2020).

Conflicts of Interest

The authors declare no conflict of interest.

Appendix A

Table A1. Countries or regions that have participated in the global competence assessment.
Countries or Regions
KazakhstanSerbiaPhilippinesLithuaniaBrunei Darussalam
PanamaColombiaHong KongCroatiaMoscow Region (RUS)
SpainGreeceMoroccoKoreaTatarstan (RUS)
AlbaniaSlovak RepublicThailandMaltaRussian Federation
LatviaChileCosta RicaIndonesiaChinese Taipei

Appendix B

Table A2. Exact values of parameters in the DT and RF models.
ParameterDecision TreesRandom Forests
max depth20/
criterionentropyentropy
min samples leaf2005
n estimators/200

References

  1. Meng, Q.; Zhu, C.; Cao, C. Chinese international students’ social connectedness, social and academic adaptation: The mediating role of global competence. High Educ. 2017, 75, 131–147. [Google Scholar] [CrossRef]
  2. Hunter, B.; White, G.P.; Godbey, G. What does it mean to be globally competent? J. Stud. Int. Educ. 2006, 10, 267–285. [Google Scholar] [CrossRef]
  3. Murga-Menoyo, M.A. Educating for local development and global sustainability: An overview in Spain. Sustainability 2009, 1, 479–493. [Google Scholar] [CrossRef] [Green Version]
  4. OECD. PISA 2018 Global Competence Framework; OECD Publishing: Paris, France, 2019. [Google Scholar]
  5. Auld, E.; Morris, P. Science by streetlight and the OECD’s measure of global competence: A new yardstick for internationalisation? Policy Futures Educ. 2019, 17, 677–698. [Google Scholar] [CrossRef]
  6. Muñoz-La Rivera, F.; Hermosilla, P.; Delgadillo, J.; Echeverría, D. The Sustainable Development Goals (SDGs) as a basis for innovation skills for engineers in the Industry 4.0 context. Sustainability 2020, 12, 6622. [Google Scholar] [CrossRef]
  7. Zhao, H.Q.; Coombs, S. Intercultural teaching and learning strategies for global citizens: A Chinese EFL perspective. Teach. High. Educ. 2012, 17, 245–255. [Google Scholar] [CrossRef] [Green Version]
  8. Kang, J.H.; Kim, S.Y.; Jang, S.; Koh, A.R. Can college students’ global competence be enhanced in the classroom? The impact of cross- and intercultural online projects. Innov. Educ. Teach. Int. 2017, 55, 683–693. [Google Scholar]
  9. Meng, Q.; Zhu, C.; Cao, C. An exploratory study of Chinese university undergraduates’ global competence: Effects of internationalisation at home and motivation. High. Educ. Q. 2017, 71, 159–181. [Google Scholar] [CrossRef]
  10. Moody, C.T.; Rodas, N.V.; Norona, A.N.; Blacher, J.; Crnic, K.A.; Baker, B.L. Early childhood predictors of global competence in adolescence for youth with typical development or intellectual disability. Res. Dev. Disabil. 2019, 94, 103462. [Google Scholar] [CrossRef] [PubMed]
  11. He, Y.; Lundgren, K.; Pynes, P. Impact of short-term study abroad program: Inservice teachers’ development of intercultural competence and pedagogical beliefs. Teach. Teach. Educ. 2017, 66, 147–157. [Google Scholar] [CrossRef]
  12. Lee, C.P.; Curtis, J.H.; Curran, M.E. Stories of engagement: Preservice language teachers negotiate intercultural citizenship in a community-based English language program. Lang. Teach. Res. 2018, 22, 590–607. [Google Scholar]
  13. Zhang, M.X.; Zhu, F.J. Performance, Influence and Cultivating Strategies of Global Competence of 15-year-old Students from an International Perspective: Analysis based on PISA 2018 Results. Educ. Res. 2020, 26, 4–16. [Google Scholar]
  14. Alivernini, F. An exploration of the gap between highest and lowest ability readers across 20 countries. Educ. Stud. 2013, 39, 399–417. [Google Scholar] [CrossRef]
  15. Bronfenbrenner, U. The Ecology of Human Development: Experiments by Nature and Design; Harvard University Press: Cambridge, MA, USA, 1979. [Google Scholar]
  16. Redmond, M.L. Reaching global competence. Foreign Lang. Ann. 2014, 47, 1–2. [Google Scholar] [CrossRef]
  17. Semaan, G.; Yamazaki, K. The relationship between global competence and language learning motivation: An empirical study in critical language classrooms. Foreign Lang. Ann. 2015, 48, 511–520. [Google Scholar] [CrossRef]
  18. Tudge, J.; Mokrova, I.; Hatfield, B.E.; Karnik, R.B. Uses and misuses of bronfenbrenner’s bioecological theory of human development. J. Fam. Theory Rev. 2009, 1, 198–210. [Google Scholar] [CrossRef]
  19. Engel, L.C.; Rutkowski, D.; Thompson, G. Toward an international measure of global competence? A critical look at the PISA 2018 framework. Glob. Soc. Educ. 2019, 17, 117–131. [Google Scholar] [CrossRef]
  20. Salzer, C.; Roczen, N. Assessing global competence in PISA 2018: Challenges and approaches to capturing a complex construct. Int. J. Dev. Educ. Glob. Learn. 2018, 10, 5–20. [Google Scholar] [CrossRef]
  21. OECD. Lessons from PISA for Japan, Strong Performers and Successful Reformers in Education; OECD Publishing: Paris, France, 2012. [Google Scholar]
  22. Schleicher, A. PISA 2018: Insights and Interpretations; OECD Publishing: Paris, France, 2019. [Google Scholar]
  23. Fuller, W.A. Estimation for multiple phase samples. In Analysis of Survey Data; Wiley: Hoboken, NJ, USA, 2003; pp. 307–322. [Google Scholar]
  24. Cao, C.; Meng, Q. Exploring personality traits as predictors of English achievement and global competence among Chinese university students: English learning motivation as the moderator. Learn. Individ. Differ. 2020, 77, 101814. [Google Scholar] [CrossRef]
  25. Lee, E.; Jungdeok, K.; Sunyoung, S. An analysis on the relationship between multi-cultural experience and global competence of college students. J. Core Competency Educ. Res. 2019, 4, 47–69. [Google Scholar]
  26. Kim, K.; Kim, H.S.; Shim, J.; Park, J.S. A Study in the Early Prediction of ICT Literacy Ratings Using Sustainability in Data Mining Techniques. Sustainability 2021, 13, 2141. [Google Scholar] [CrossRef]
  27. Larose, D.; Larose, C. Discovering Knowledge in Data: An Introduction to Data Mining; Wiley: Hoboken, NJ, USA, 2014. [Google Scholar]
  28. Alivernini, F.; Manganelli, S. Country, school and students factors associated with extreme levels of science literacy across 25 countries. Int. J. Sci. Educ. 2015, 37, 1992–2012. [Google Scholar] [CrossRef]
  29. Rebai, S.; Yahia, F.B.; Essid, H. A graphically based machine learning approach to predict secondary schools performance in Tunisia. Socio-Econ. Plan. Sci. 2020, 70, 100724. [Google Scholar] [CrossRef]
  30. Chen, J.; Zhang, Y.; Wei, Y.; Hu, J. Discrimination of the contextual features of top performers in scientific literacy using a machine learning approach. Res. Sci. Educ. 2019, 1–30. [Google Scholar] [CrossRef]
  31. Gorostiaga, A.; Rojo-álvarez, J. On the use of conventional and statistical-learning techniques for the analysis of PISA results in Spain. Neurocomputing 2016, 171, 625–637. [Google Scholar] [CrossRef]
  32. Chen, J.; Zhang, Y.; Hu, J. Synergistic effects of instruction and affect factors on high- and low-ability disparities in elementary students’ reading literacy. Read. Writ. 2021, 34, 199–230. [Google Scholar] [CrossRef]
  33. Biau, G.; Scornet, E. A random forest guided tour. Off. J. Span. Soc. Stat. Oper. Res. 2016, 25, 197–227. [Google Scholar] [CrossRef] [Green Version]
  34. Güre, O.B.; Kayri, M.; Erdoğan, F. Analysis of factors effecting PISA 2015 mathematics literacy via educational data mining. Egitim Bilim. 2020, 45, 393–415. [Google Scholar]
  35. Qiao, X.; Jiao, H. Data mining techniques in analyzing process data: A didactic. Front. Psychol. 2018, 9, 2231. [Google Scholar] [CrossRef] [PubMed]
  36. Kang, H. The prevention and handling of the missing data. Korean J. Anesthesiol. 2013, 64, 402–406. [Google Scholar] [CrossRef] [PubMed]
  37. Mou, W.J.; Liu, Z.Q.; Luo, Y.; Zou, M.; Ren, C.; Zhang, C.Y.; Tian, Y.P. Development and cross–validation of prognostic models to assess the treatment effect of cisplatin/pemetrexed chemotherapy in lung adenocarcinoma patients. Med. Oncol. 2014, 31, 59. [Google Scholar] [CrossRef] [PubMed]
  38. Dosenbach, N.U.; Nardos, B.; Cohen, A.L.; Fair, D.A.; Power, J.D.; Church, J.A.; Nelson, S.M.; Wig, G.S.; Vogel, A.C.; Lessov-Schlaggar, C.N.; et al. Prediction of individual brain maturity using fMRI. Science 2010, 329, 1358–1361. [Google Scholar] [CrossRef] [PubMed] [Green Version]
  39. Cho, M.; Yoo, J. Exploring online students’ self-regulated learning with self-reported surveys and log files: A data mining approach. Interact. Learn. Environ. 2017, 25, 970–982. [Google Scholar] [CrossRef]
  40. Becket, N.; Brookes, M. Developing global competencies in graduates. J. Hosp. Leis. Sport Tour. Educ. 2012, 11, 79–82. [Google Scholar] [CrossRef]
  41. Blumenthal, P.; Grothus, U. Developing global competence in engineering students: U.S. and German approaches. Online J. Glob. Eng. Educ. 2008, 3, 1. [Google Scholar]
  42. Li, Y. Cultivating student global competence: A pilot experimental study. Decis. Sci. J. Innov. Educ. 2013, 11, 125–143. [Google Scholar] [CrossRef]
  43. Kerkhoff, S.N.; Cloud, M.E. Equipping teachers with globally competent practices: A mixed methods study on integrating global competence and teacher education. Int. J. Educ. Res. 2020, 103, 101629. [Google Scholar] [CrossRef] [PubMed]
Figure 1. Framework of global competence.
Sustainability 13 11053 g001
Figure 2. An illustrative example of a DT. This DT classifies data points into different regions. If the variable X1 is smaller than the division boundary t1, the point goes to the left node; otherwise, it goes to the right node. This step is repeated until the data point falls into one of the regions.
Sustainability 13 11053 g002
Figure 3. The construction of an RF. (1) Draw a number of samples from the data. (2) For each sample, develop a regression tree with a random predictor selection mechanism. (3) Conduct prediction by averaging the predictions of the trained regression trees.
Sustainability 13 11053 g003
Figure 4. An example of the fivefold cross validation method.
Sustainability 13 11053 g004
Figure 5. AUC values (the areas under the ROC curves) of the DT and RF models.
Sustainability 13 11053 g005
Figure 6. A line chart to plot the importance of all the variables in the DT and RF models.
Sustainability 13 11053 g006
Table 1. Relevant factors of global competence at the student and school levels.
LevelCategoryFactor
StudentEducational environment & experiencesStudying abroad [9]
Cross- and intercultural projects [8]
An EFL classroom [7]
Language proficiencyLanguage learning [16]
Language barriers [8]
Use of language [1,17]
Life experiencesMass media [8]
Mass migration [8]
Time zone differences [8]
Contact with foreigners [9]
Family influencesFamily background [13]
Parenting [10]
SchoolTeachersInstructional strategies [11]
Cultural awareness [12]
RankingsSchool rankings [13]
Table 2. Demographic information of students with high and low levels of global competence.
Demographic VariablesHigh AchieversLow Achievers
Student Number44,356164,200
Gender
  Girl57.49%48.21%
  Boy42.51%51.79%
Age14.75 (±0.58)14.47 (±0.73)
School Location
  City (above 100,000)53.57%39.96%
  Town (3000 to 100,000)42.45%47.51%
  Village or rural area (below 3000)3.97%12.53%
School Type
  Public school65.58%81.90%
  Private school34.42%18.10%
Table 3. Descriptions and descriptive statistics of the variables.
VariableQuestionValue ScaleValue RangeMeanSD
Student level
GCSELFEFF
-
Self-efficacy regarding global issues
ST196Q02HA
-
Explain how carbon dioxide emissions affect global climate change
1—I could not do this.
2—I would struggle to do this on my own.
3—I could do this with a bit of effort.
4—I could do this easily.
1–42.690.95
ST196Q03HA
-
Establish a connection between the prices of textiles and the working conditions in the countries of production
1–42.540.88
ST196Q04HA
-
Discuss the different reasons why people become refugees
1–42.890.88
ST196Q05HA
-
Explain why some countries suffer more from global climate change than others
1–42.860.89
ST196Q06HA
-
Explain how economic crises in single countries affect the global economy
1–42.700.90
ST196Q07HA
-
Discuss the consequences of economic development on the environment
1–42.760.90
School level
Attention to global competence in the curriculumSC167Q01HA
-
Communicating with people from different cultures or countries
1—Yes
2—No
1–21.450.50
SC167Q02HA
-
Knowledge of different cultures
1–21.170.38
SC167Q03HA
-
Openness to intercultural experiences
1–21.260.44
SC167Q04HA
-
Respect for cultural diversity
1–21.120.32
SC167Q05HA
-
Foreign languages
1–21.110.31
SC167Q06HA
-
Critical thinking skills
1–21.130.34
Table 4. An overview of all the variables in the models based on the student level and school level.
VariableDescriptionFormation
Student level
GCSELFEFFSelf-efficacy regarding global issuesGCSELFEFF
GCAWAREAwareness of global issuesGCAWARE
PERSPECTPerspective takingPERSPECT
COGFLEXAdaptabilityCOGFLEX
AWACOMAwareness of intercultural communicationAWACOM
INTCULTInterest in learning about other culturesINTCULT
ST220Q02HAContact with people from other countries at schoolST220Q02HA
ST220Q04HAContact with people from other countries in your circle of friendsST220Q04HA
RESPECTRespect for people from other cultural backgroundsRESPECT
GLOBMINDGlobal mindednessGLOBMIND
ATTIMMAttitudes toward immigrantsATTIMM
ST189Q01HANumber of foreign languages learned at schoolST189Q01HA
ST177QNumber of languages spokenST177Q01HA, ST177Q02HA, ST177Q03HA
ST221QGlobal competence activities at schoolST221Q01HA, ST221Q02HA… ST221Q11HA
School level
ST223QIntercultural attitudes of teachersST223Q02HA, ST223Q04HA… ST223Q08HA
SC159Q01HASchool with visiting teachers from other countriesSC159Q01HA
SC165QMulticultural/intercultural education practices at schoolSC165Q01HA, SC165Q02HA… SC165Q10HA
SC166QSchool principal’ s perception of teachers’ intercultural beliefsSC166Q02HA, SC166Q03HA… SC166Q06HA
SC167QAttention to global competence in the curriculumSC167Q01HA, SC167Q02HA… SC167Q06HA
SC158QAttention to global challenges and trends in the curriculumSC158Q01HA, SC158Q02HA… SC158Q12HA
SC150QLanguage policies for nonnative speakersSC150Q01IA, SC150Q02IA, SC150Q05IA
Table 5. A confusion matrix.
Confusion MatrixPredicted Value
PositiveNegative
Real ValuePositiveTrue Positive 1 (TP)False Negative (FN)
NegativeFalse Positive (FP)True Negative (TN)
1 TP (true positive) stands for high achievers that were correctly classified, FP (false positive) stands for low achievers classified as high achievers, TN (true negative) stands for low achievers that were correctly classified, and FN (false negative) stands for high achievers classified as low achievers.
Table 6. The training and testing performances of the DT and RF models.
ModelTrainingTesting
Accuracy (%)Accuracy (%)Precision (%)Recall (%)F-Score (%)
Decision Tree78.280.0577.1180.0577.13
Random Forest82.781.5979.4681.5978.53
Table 7. Variables sorted by their impact on each model’s prediction accuracy.
RankingDecision TreeRandom Forest
VariableCoefficientVariableCoefficient
1ST223Q0.2480GCSELFEFF0.0972
2GCSELFEFF0.1518ST223Q0.0855
3AWACOM0.1449AWACOM0.0830
4ATTIMM0.0841GCAWARE0.0795
5ST221Q0.0686ATTIMM0.0631
6GCAWARE0.0583RESPECT0.0608
7ST177Q0.0568GLOBMIND0.0573
8RESPECT0.0548COGFLEX0.0546
9ST220Q0.0312PERSPECT0.0512
10SC159Q01HA0.0250ST221Q0.0503
11ST222Q0.0151INTCULT0.0487
12GLOBMIND0.0101ST177Q0.0453
13COGFLEX0.0099ST222Q0.0360
14SC158Q0.0096ST220Q0.0338
15INTCULT0.0076SC165Q0.0287
16PERSPECT0.0074SC166Q0.0261
17SC150Q0.0072SC150Q0.0250
18SC166Q0.0034SC158Q0.0213
19ST189Q01HA0.0024SC167Q0.0197
20SC165Q0.0020ST189Q01HA0.0178
21SC167Q0.0016SC159Q01HA0.0160
Publisher’s Note: MDPI stays neutral with regard to jurisdictional claims in published maps and institutional affiliations.

