Article

Analysis of Fatal and Injury Traffic Accidents in Istanbul Sarıyer District with Spatial Statistics Methods

by
Mert Ersen
1,*,
Ali Hakan Büyüklü
2 and
Semra Taşabat Erpolat
3
1
Graduate School of Science and Engineering, Yıldız Technical University, Davutpaşa Campus, 34220 Istanbul, Turkey
2
Department of Statistics, Faculty of Arts & Science, Yıldız Technical University, Davutpaşa Campus, 34220 Istanbul, Turkey
3
Department of Statistics, Faculty of Arts & Science, Mimar Sinan Fine Arts University, Bomonti Campus, 34360 Istanbul, Turkey
*
Author to whom correspondence should be addressed.
Sustainability 2021, 13(19), 11039; https://doi.org/10.3390/su131911039
Submission received: 25 July 2021 / Revised: 27 September 2021 / Accepted: 28 September 2021 / Published: 6 October 2021

Abstract

:
Traffic accidents, which continue to increase from year to year in Turkey and in the world, have become a huge problem that can result in serious traumas, injuries, and deaths, as well as their material and moral consequences. Many studies have been carried out in the world and in Turkey to reduce the number of traffic accidents, but these studies have not been very effective in reducing accidents. In this study, 3105 fatal or injured traffic accidents between 2010–2017 in Sarıyer district of Istanbul, Turkey’s largest city in terms of population, were discussed. We analyzed the statistical information on the subject in detail within the framework of geographic information systems. It has been tried to determine the sections where traffic accidents are concentrated in this region with studies based on spatial methods. Thematic accident map was created according to the accident types. In this context, the advantages and disadvantages of these methods were compared using Point Density, Kernel Density, Getis Ord Gi*, and Anselin Local Moran’s I (LISA) Spatial Autocorrelation. In addition, in order to observe the change in accidents, thematic accident and Kernel Density maps were created separately according to accident occurrence types in the beginning and last year. From this point of view, the changes that occurred in the accidents were interpreted. The current study determined that the most accidents were on some streets and these streets divided into regions in a plan. The cases were examined with statistical analyses according to accident types and using the Kernel Density method. In addition, it has been observed that Kernel Density method gives better visual results than other spatial methods. In this study, spatial analysis and statistical analysis methods were used to evaluate traffic accidents more realistically. The day of the week effect and month of the year effect on traffic accidents was investigated for the first time. In addition, it is proposed to bring a new approach to the prevention of traffic accidents by using hotspot, accident type, and day of the week effect.

1. Introduction

One of the important problems of Turkey is traffic accidents. Thousands of people lose their lives and are seriously injured in traffic accidents that occur every year. However, hundreds of thousands of liras are lost in traffic accidents every year. According to the Highway Traffic Accident Statistics of the Turkish Statistical Institute, 1,202,716 accidents occurred even in 2017, 1,020,047 of them resulted in material damage, and 182,669 of them resulted in death or death and injury [1].
The main reasons for the increase in traffic accidents are the lack of an applicable transportation policy and the inability to determine the true causes of the accidents. It is clear that a formation whose true cause cannot be determined cannot be eliminated. For the real determination of the causes of traffic accidents, it is necessary to know all the information about the accident completely. Unless there are details describing the causes of the accidents, it is not possible to determine the solution proposals [2].
The transportation problem in living environments is increasing with the increasing population and unplanned urbanization, which causes the efforts to reduce traffic accidents to be insufficient.
Accident analysis studies are mostly based on statistical data. Since analyses based on big data are made in this study, we can call the accident analysis “Accident Analytics”. Another reason why accident analyses is named as accident analytics in the study is that traffic accidents cannot be determined in advance in terms of place and time and cannot be interpreted well enough [3,4].
Accident Analytics, which provides traffic accident analysis based on large numbers of traffic accident data and traffic information, will help you to understand the accidents in detail and to determine what can be done to prevent future traffic accidents [3,4].
The province of Istanbul, the largest city in Turkey, attracts attention not only with its heavy traffic, but also with the abundance of traffic accidents that occur at the same time. It is also seen that there are too many traffic accidents, especially in some parts of the city, where there is excessive traffic density in many parts of the day [5,6]. In this study, the causes of the accidents in Sarıyer district, which is one of the districts of Istanbul with the highest number of accidents, were investigated and a lot of statistical information about the accidents was interpreted. In addition, in the part of the visualization of big data, the methods in the spatial analysis studies in geographic information systems were used to determine the sections where traffic accidents are concentrated in these regions. First of all, the thematic accident map was created according to the accident types of all the accidents that occurred in the Sarıyer region, and then the Point Density, Kernel Density, Getis Ord Gi*, and Anselin Local Moran’s I (LISA) Spatial Autocorrelation methods were compared with each other, respectively. In addition, thematic accident maps and Kernel Density maps were created according to accident types for 2010, the beginning year of the accidents, and 2017, the last year, in the data set, so it was observed whether there was a change in the number of fatal and injury accidents and the intensity map for the 8 years discussed.
In the literature, no spatial and statistical studies related to fatal and injury accidents have been found in the Sarıyer district of Istanbul province before. With this study, fatal and injury traffic accidents that occurred in Sarıyer district of Istanbul province were analyzed in such detail for the first time by considering many statistical information. Another feature that makes this study different from other studies is the redesign of data on the basis of year, month, day, hour, and vehicle types according to accident types.

2. Materials and Methods

2.1. Study Field and Data Arrangement

The Sarıyer district of Istanbul province was chosen as the study area. In this study, significant problems were encountered in obtaining data. Since the data requested from the Insurance Information and Surveillance Center could not be obtained for various reasons, data were obtained from the data warehouse of the General Directorate of Security with special permission. The data obtained from the General Directorate of Security are given only as the records of fatal and injury accidents.
In addition, from the requested data; accidents with material damage, the extent of material damage of the accidents, severity of injury, whether the person is disabled, motor insurance status of the vehicles involved in the accident and engine information, residence of road users, income status, job information, gender, whether the vehicles involved in the accident have insurance and inspection, accident site brake. Since information such as the trace of the police is not available in the databases of the General Directorate of Security, it could not be given to us.
Since the obtained data are raw data, they have been made suitable for the use of spatial analysis and statistical techniques with great efforts. According to the accident report from the General Directorate of Security regarding fatal and injury traffic accidents, a total of 3105 accidents occurred in this district between 2010 and 2017. In the obtained data, missing, unnecessary, and incorrect data were arranged and missing data were removed, and categorical data were coded with the SAS software. In addition, necessary corrections and changes were made according to the names of the streets and streets whose names were changed in the streets and streets where the accidents occurred, and the necessary coding was carried out in alphabetical order. Since the vehicle type data in the data is obtained from the General Directorate of Security, only the number of drivers and vehicles are given on a yearly basis, and in this case, since there is no information about which vehicle type has an accident in which accident, the accident ID numbers in the vehicle driver files are scanned from the accident ID numbers, thus ensuring integrity in the data over the years. In addition to information such as year, month, day, weather, day conditions, information about the type of vehicle was obtained, as well as information about which accident occurred. In the current data given, the month of the accident, the day, month, and year of the accident were obtained from the information of the month in which the accident occurred separately for each accident. In this study, since the accident occurrence type and the number of accidents of the vehicle model were examined, the accident ID numbers of the accident types and the accident ID numbers of the vehicle type models were matched, and the data of which accident occurrence type of each vehicle type had more accidents were obtained. In the study, it was seen that the most accidents occurred on Büyükdere Street among the streets and streets where the accidents occurred, and Büyükdere Street and the places where other accidents were intense were examined separately in the areas where the accidents were determined according to the types of accidents and determined according to the Kernel Density estimation.
When the reasons why the accidents in this district have increased so much in recent years, it has been seen that the most important reason is that Maslak, Ayazağa, and Huzur Neighborhoods, which were previously connected to Şişli district, were connected to Sarıyer in October 2012 (according to Istanbul Metropolitan Municipality law). In addition, according to the latest population information for 2019, there has been a population increase of 10,185 in Maslak, 7220 in Huzur, and 35,931 in Ayazağa. In addition, the connection of Ayazağa, which is the neighborhood with the highest density of work with 4440 workplaces like Maslak, and the neighborhood with the highest number of residences in the region with 10 thousand 231 residences, to Sarıyer district has increased the traffic density in this district along with the population [7,8].

2.2. Spatial Analysis

Determining the accident locations and the relationship between the accidents is crucial in a study conducted with spatial analysis [9,10]. The temporal and spatial analysis of traffic accidents can be made with the results obtained from geographical information systems technologies [11,12,13,14,15]. In order to determine spatially-intensive accident points and evaluate spatial clusters at these blackspots, Kernel Density analysis, Point Density analysis, Getis Ord Gi* Statistics, and Moran’s I method—one of the spatial autocorrelation methods—are frequently applied in many Ssudies [16,17,18,19,20,21]. These methods were applied in this study using the ArcGIS 10.7 software.
In this study, Point Density, Kernel Density, Getis Ord Gi*, and Anselin Local Moran’s I (LISA) Spatial Autocorrelation Method were examined, respectively [22,23,24,25,26].

2.2.1. Point Density Method

In the Point Density method, cell values are calculated based on a circular scan area. Each cell value is calculated by dividing the number of objects entering the scan area by the area size [25].

2.2.2. Kernel Density Method

In order to develop effective road safety measures to reduce traffic accidents, it is necessary to identify the areas (hot spots) where traffic accidents are concentrated. Kernel Density Estimation is a widely used method because it successfully determines hot spots [27,28]. Determining the cause of similar location-based accidents is crucial for people’s safety in traffic and reducing accident numbers. The primary advantage of the Kernel Density method over the clustering method is expressing the uncertainty about exactly where the accident points are by using the Kernel bandwidth. The bandwidth of the Kernel indicates the spread of accident risk. Another advantage of this method is its quite understandable and beautiful visuality. The disadvantage is the inability to test the statistical significance of the clustering results; in other words, no significance tests exist. In addition, there is no clear border between the determined regions and others, and the number of black spots cannot be detected [29,30,31,32].
The difference between this method and the Point Density method is expressing the density of points falling into a circle with a defined radius (instead of cells) and point density changes as moving away from the source.

2.2.3. Getis Ord Gi* Method

Getis Ord Gi* statistics are also known as hot spot statistics. Getis-Ord Gi* is the regional version of the general G statistic [21]. In this method, the Getis Ord Gi* statistic is calculated for each feature in the data set. As a result, the Gi* statistic in ArcGIS software calculates the z (standard value) and p (confidence) values. The Gi* statistical tool performs calculations, considering the neighborhood relations between the data. The Getis-Ord Gi* method produces values by comparing the feature values of each data with the neighboring data features. Thus, the place where high and low values are clustered can be determined by analyzing the data in the study area [33,34].
Getis-Ord Gi* can detect where high or low values are. When the calculated Gi* value is positive and the z value is greater than the za value (1.96), high values are considered to be clustered (hot spots). On the other hand, when the Gi* value is negative and the z value is less than the za value (−1.96), the low values are considered to be clustered (cold spots) [35,36,37,38].
The calculation is done as in Equation (1):
G i * = j = 0 n w i , j x j X j = 0 n w i , j [ n j = 1 n w 2 i , j ( j = 1 n w i , j ) 2 ] n 1 S
where, x j is the attribute value for object j, w i , j is the spatial weight matrix between objects i and j, n is the number of features.
In Getis-Ord Gi* spatial statistics method, since the differences between the cell and its neighbors are calculated directly, the cell’s neighbors are more important than cell itself. Although the advantage of this method over the Kernel method is its statistical significance, it has disadvantages. For instance, this method is effective only when negative spatial autocorrelation is neglected and, besides, it is not as good-looking as the Kernel Density method [21].
Using the Fishnet method in ArcGIS 10.7 software, the current study produced a square mesh (a grid generation) and created equal polygon areas with specific side lengths. Then, the polygon (zone) data was obtained by finding the traffic accident points within the polygons by overlapping the produced polygon areas. The field data obtained by this process were also used in the Anselin Local Moran’s I (LISA) method.

2.2.4. Anselin Local Moran’s I (LISA) Spatial Autocorrelation Method

Another spatial statistical method used in this study is Moran’s I method. The results were also examined with this method to investigate whether traffic accidents interact with each other. Moran’s I index only measures the study field’s attachment level to space because of its global scale. This index does not indicate where the distribution is clustered [34,39]. For this reason, Anselin local Moran’s I index was developed to make a spatial analysis of the distribution at the regional scale. Whether a weighted set of features is statistically hot, cold, or spatially outlier can be determined using Anselin local Moran’s I spatial statistic. Spatial autocorrelation methods are utilized to determine the spatial dependence between the data and investigate the statistical significance of clusters according to data characteristics [21,40,41].
To do this, it calculates the local Moran’s I-value, z-number, p-value and displays the clustering value for each feature. The z number and p-value show the statistical significance of the calculated index value [34].
The local Moran’s I statistic is shown in Equation (2) with the following formula:
I i = x i X S İ 2 J = 1 , J i n w i , j ( x i X )
where, x i is the attribute of the i feature, X is the average of the attributes, and w i , j is the spatial weight matrix between the i and j locations [21,34].
At the end of the operation, clustering and outlier are statistically separated as follows: Clustering of High values (HH), Clustering of Low values (LL), Outliers in which high values are surrounded by low values (HL), Outliers in which low values are surrounded by high values (LH) [21].
A positive global Moran’s index indicates clustering in certain areas, while negative results indicate dispersed inter-object locations. Values for the Moran index can be either negative or positive and differently interpreted depending on the values. This situation changes whether spatial autocorrelation’s status can be positive or negative. Since Moran’s index is generally limited between −1 and +1, the results of Moran’s index other than −1 and +1 indicate an error in the parameters. Of these values, −1 expresses perfect dispersion, and +1 expresses perfect correlation. Therefore, negative values signify negative autocorrelation, and positive values signify positive autocorrelation. A value of zero shows the random distribution and confirms the null hypothesis [42,43,44,45].
This analysis aims to determine the areas traffic accidents concentrate and group traffic accidents according to the results.

3. Results

This study first made analyses with statistical information about traffic accident density and interpreted the results obtained in the significance analysis of the accidents according to the day of the week effects, the month of the year effect, and year effects.
The day of the week effect approach, which is applied in finance and tries to reveal the stocks called anomalies, has been tried to reveal whether traffic accidents are different on a day-by-day basis [46,47,48].
In this study, we attempted to investigate whether the traffic accidents that occurred between 2010–2017 have anomalies in terms of day of the week effect and the month of the year effect variables. It is very important for researchers and policy makers to see whether some days are statistically different from other days in terms of traffic accidents in order to take the necessary precautions on the relevant days. The same is true for months.
In order to examine the effect of the day of the week in a total of 3105 fatal and injured traffic accidents that occurred between 1 January 2010 and 31 December 2017, daily traffic accident numbers were used.
The day of the week anomaly on traffic accidents was examined with the linear regression equation using the dummy variables shown in Equation (3).
D T A N t = β 1 + 2 7 β i D i t + φ Z t + ε t
D T A N t = Daily traffic accidents by numbers
β 1 = Base day
Because of the multicollinearity problem we left one day dummy. This dummy shows up on the beta one.
β i = Average traffic accident for each day of the week
D i t = Dummy variable for days of the week
φ Z t = Independent variables
ε t = Error term with zero mean and constant variance
The dummy variables show the deviation of the average traffic accident of the day from the average traffic accident of the other days, expressed in constant terms. The dummy variable takes a value of 1 for observations corresponding to that day and 0 for other observations. The size, sign, and statistical significance of the coefficients of the dummy variables provide information about the anomalies.
The reason why no additional independent variables were added to the linear regression equation established for the day is to determine whether some days in traffic accidents are statistically different from other days in terms of traffic accidents by using only the t-test and ANOVA model analyses on the basis of OLS (Ordinary Least Squares).
“Dummy variables can be incorporated in regression models just as easily as quantitative variables. As a matter of fact, a regression model may contain regressors that are all exclusively dummy, or qualitative, in nature. Such models are called Analysis of Variance (ANOVA) models. On the other hand, regression models containing an admixture of quantitative and qualitative variables are called analysis of covariance (ANCOVA) models. ANCOVA models are an extension of the ANOVA models in that they provide a method of statistically controlling the effects of quantitative regressors, called covariates or control variables, in a model that includes both quantitative and qualitative, or dummy, regressors” [49].
We do not use any quantitative explanatory variables in our model, these models are named as equivalent to the ANOVA model. If the data we mentioned Data Arrangement section were available, the model would be expressed as ANCOVA model since an additional quantitative explanatory variable was added to the model.
In this context, while the null hypothesis of the model is that the average traffic accidents are equal, the alternative hypothesis is that the days differ in terms of average traffic accidents and the effect of the day of the week is effective on traffic accidents.
In the same way, monthly traffic accident numbers were used to examine the effect of the month of the year on a total of 3105 fatal and injured traffic accidents between 1 January 2010–31 December 2017.
The month-of-year anomaly on traffic accidents was examined with the linear regression equation in Equation (4) using dummy variables.
M T A N t = β 1 + 2 12 β i D i t + φ Z t + ε t
M T A N t = Monthly traffic accidents by numbers
β 1 = Base month
Because of the multicollinearity problem, we left one month dummy. This dummy shows up on the beta one.
β i = Average traffic accident for each month of the year
D i t = Dummy variable for months of the year
φ Z t = Independent variables
ε t = Error term with zero mean and constant variance
The dummy variables show the deviation of the average traffic accident of the month from the average traffic accident of the other months, expressed in constant terms. The dummy variable takes a value of 1 for observations corresponding to that month and 0 for other observations. The size, sign, and statistical significance of the coefficients of the dummy variables provide information about the anomalies.
As in the model for the day of the week effect, the reason why no additional independent variables were added to the linear regression equation established for the month is to determine whether some months in traffic accidents are statistically different from other months in terms of traffic accidents by using only the t-test and ANOVA model analyses on the basis of OLS (Ordinary Least Squares).
In this context, while the null hypothesis of the model is that the average traffic accidents are equal, the alternative hypothesis is that the months differ in terms of average traffic accidents and the effect of the month of the year is effective on traffic accidents.
Then, the spatial analysis results were presented, respectively. In the application and results section, fatal and injury traffic accident intensities on the designated streets in the Sarıyer district were examined with all spatial methods. Besides, the data were designed and analyzed based on the day, hour, and vehicle types.

3.1. Data and Statistical Analysis

The current study primarily analyzed the year, month, and day data of the accidents and investigated whether the traffic accidents had a statistically significant year, month, and day effect.
The year effect was investigated for death and injury accidents in Sarıyer district for 2010–2017, and no significant results were found.
In order to investigate whether there was a day effect in a total of 3105 fatal and injury accidents that occurred between 2010–2017 in Sarıyer district, the relevant data were entered in Table 1. Here, the daily accident number value in the first line shows two accidents on Friday, 1 January 2010. The daily accident number value in the last line shows that 0 accidents occurred on Sunday, 31 December 2017. The data of yearly, monthly, and daily accident number values were entered by considering the daily accident number. Since 1 January 2010 was Friday, the data entry started as from Friday.
Equation (5) shows the statistical model used
D T A N t = β 1 + β 2 T u e s d a y + β 3 W e d n e s d a y + β 4 T h u r s d a y + β 5 F r i d a y + β 6 S a t u r d a y + β 7 S u n d a y + ε t
To avoid multicollinearity, Monday was taken as the base day and excluded from the model. Table 2 shows the regression outputs of the model.
In Table 2, (***) indicates 1% significance level, (*) indicates 10% significance level. In the day-based significance study, Sunday was observed as different from other days regarding the number of accidents with a significance level of 10%. While Monday was taken as the base day, the other days, except Sunday, were not observed to a significant day effect. Constant was statistically significant at the 1% significance level. This indicates that Monday has a significant day effect. When the units for the prevention of traffic accidents evaluate the findings obtained as a result of this study, they will want to investigate the reason why the accidents show anomaly on Sunday and Monday from other days. In the study, as a result of combining the parsing maps made according to the days with these findings, it can be examined which accident type is more common on the streets where the accidents are intense on Sunday and Monday. In the Kernel Density map of the accidents made on Monday, it was seen that the accidents were concentrated in İstinye Bayırı, Büyükdere, Haydar Aliyev, Demokrasi Şehitleri, and Tarabya Bayırı Streets. While the number of accidents in the form of rear-end collisions and side-impacts was higher on Büyükdere, Haydar Aliyev, Demokrasi Şehitleri, and Tarabya Bayırı Streets on Monday, it was observed that accidents in the form of hitting pedestrians on İstinye Bayırı Street were higher. Again, when the Kernel Density map of the accidents that occurred on Sunday was examined, it was found that the density was concentrated in Büyükdere, İstinye Bayırı, Tarabya Bayırı, Köybaşı, Kilyos, Haydar Aliyev, Bahçeköy Forest Road, and Baltalimanı Streets. It has been observed that in the accidents that occurred on these streets on Sunday, accidents in the form of rear-end and side-to-side collisions were high, and there were also more accidents in the form of pedestrian collisions on Büyükdere Street. When the accidents on Sunday were also examined by frequency analysis, it was concluded that the accidents with automobile vehicles were high. Due to the fact that Sunday is a holiday, it has been observed that the accidents on the coastal and forest roads are more than the other days.
In Table 3, whether the model was significant as a whole was examined. The model was found at the 10% significance level.
In order to investigate whether there is a month effect in a total of 3105 fatal and injury accidents that occurred between 2010–2017 in Sarıyer district, the data were entered as shown in Table 4. In this table, the accident number in January 2010 is 23, and the accident number that occurred in December 2017 is 42.
Equation (6) shows the statistical model used:
M T A N t = β 1 + β 2 F e b r u a r y + β 3 M a r c h + β 4 A p r i l + β 5 M a y + β 6 J u n e + β 7 J u l y + β 8 A u g u s t + β 9 S e p t e m b e r + β 10 O c t o b e r + β 11 N o v e m b e r + β 12 D e c e m b e r + ε t
In order to prevent multicollinearity, January was taken as the base month and excluded from the model. The regression outputs of the model are given in Table 5.
In Table 5, (***) indicates a significance level at 1%, (**) indicates a significance level at 5%. In the month-based significance analysis of the accidents, April had a significant month-effect in accident numbers at the 1% significance level, while February and March had no statistically significant month-effect. The other months had a significant month-effect in terms of accident numbers at the 5% significance level. The accidents showed a considerable differentiation, especially in April compared to other months. When the units for the prevention of traffic accidents deal with this study, they should investigate the reason why these accidents show anomaly from other months, especially in April.
Table 6 examines whether the model is significant as a whole. The model was at the 5% significance level.
Figure 1 shows the accident number bar charts of a total of 3105 traffic fatal and injury accidents that occurred between 2010 and 2017 by years, months, days, and accident hours, respectively. Figure 1a shows the highest number of yearly accidents was 470 in 2015 and the lowest accidents were 281 in 2010. Remarkably, the number of fatal and injury accidents in Sarıyer district increased after Şişli’s some former quarters’ connection to Sarıyer in 2012. Figure 1b shows the highest number of monthly accidents was 285 in April and the lowest was 192 in February. Figure 1c shows the most accidents occurred on Sunday, with 491, by day. Figure 1d shows the highest number of accidents were between 12:00–16:00, with 740 accidents, and the fewest accident were between 04:00–08:00, with 199.
When examined according to the weather conditions, it was seen that of the 3105 fatal and injury accidents between 2010 and 2017 in Sarıyer district, 2372 occurred under good weather conditions. This situation can be attributed to the fact that the number of clear and sunny days was higher in Istanbul between 2010 and 2017, according to weather data. The number of accidents in rainy weather was found to be only 167. This is less so when the weather is snowy and stormy. According to the parts of the day, it was seen that 1869 fatal and injury accidents occurred during the day, 1127 accidents at night, and 109 accidents at twilight.
Table 7 elaborates 3105 fatal and injury accidents according to their types in Sarıyer district between 2010–2017. 780 of these were side crashes, 476 were rear crashes.
Table 8 shows the distribution of 3105 fatal and injury accidents by vehicle type between 2010–2017 in Sarıyer district. As shown in the table, the highest number of accidents were with automobile vehicles with 2227, followed by motorcycle accidents with 910.
In order to investigate the reasons for the high number of automobiles involved in fatal and injury accidents, the Turkish Statistical Institute’s Motor Vehicles statistics, published in December 2019, were examined. It was observed that out of 23,156,975 vehicles registered to the traffic, 54% were automobiles, 16.4% were pickup trucks, 14.4% were motorcycles, 8.2% were tractor, 3.7% were trucks, 2.1% were minibuses, 0.9% were buses, and 0.3% were special-purpose vehicles, respectively [50]. Therefore, it was seen logical the number of automobiles involving accidents would be higher than others. However, the examination of the ratios of vehicle types involving accidents showed that out of approximately 210.000 buses registered to Turkey traffic, in İstanbul, 3030 İETT buses, 2154 Private Public Bus, and 985 Purple buses of Otobüs A.Ş. were in service as of 2019. As a result, 6169 buses in Istanbul have played an active role in 198 fatal and injury accidents for eight years. Considering that the number of these buses serving in Sarıyer district was less, it could be thought that the accident rate of the buses was relatively high [51].
The daily accident data and the most accident-prone vehicle types analysis of the 3105 fatal and injury accidents between 2010–2017 in Sarıyer district revealed that the automobiles were involved in the accidents on weekends at most. As for the motorcycles, although the highest number was on Tuesday, not so many differences were observed on other days as well, and the least accident occurred on Wednesday with 118. Most accidents with pickup trucks were 92 on Friday, followed by Saturday with 91 and Sunday with 88 accidents. Pickup trucks’ minimum-accident-day was Wednesday, with 71. When examining the bus accidents, the highest accident number was 36 on Friday, and the minimum number of accidents was 22 on Sunday.
According to accident hours and the most accident-prone vehicle types, the examination of 3105 fatal and injury accidents between 2010–2017 in Sarıyer showed that 522 automobile accidents occurred between 12:00–16:00, then 479 accidents between 16:00–20:00. The accident hour with the lowest automobile accidents was between 04:00 and 08:00, with 130 automobile accidents. In motorcycle accidents, the highest number of accidents was 258 accidents between 16:00 and 20:00, followed by 236 accidents between 12:00 and 16:00. The fewest motorcycle accidents were 26 and between 04:00 and 08:00. The most pickup truck accidents were 156 accidents between 12:00–16:00, as in automobiles, followed by 131 accidents between 16:00–20:00. The pickup trucks had the minimum accidents between 00:00–04:00 with 44 and between 04:00–08:00 with 46 accidents. The bus accidents between 16:00–20:00 were 55, followed by 43 accidents between 08:00–12:00. The least bus accidents were between 00:00–04:00 with six accidents, unlike other vehicle types.
When investigated the most accident-prone vehicles according to the type of accident, it was seen that automobiles, motorcycles, and pickup trucks caused side-impact collisions mostly, followed by rear collisions.
Besides, in this study, the number of vehicles being in collision with each other was found by matching the vehicles involved in the same accident from the accident IDs.
When examining the 3105 fatal and injury accidents between 2010–2017 in Sarıyer district in terms of the most accident-prone vehicles accident numbers with each other, it was seen that the most accident-prone vehicle type was automobiles. The automobiles were involved in 473 motorcycle accidents mostly, then 224 pickup truck accidents, and finally 67 bus accidents. On the other hand, after automobiles, motorcycles crashed mostly with pickup trucks and buses, respectively. While motorcycles collided with pickup trucks in 97 accidents, they crashed into buses 19 times. In addition, the accident numbers between buses and pickup trucks were 16.
When examining the 3105 fatal and injury accidents between 2010–2017 in the Sarıyer district in terms of the most accident-prone vehicles collisions with each other according to the day data, it was seen that in the automobile and motorcycle collisions, the most accidents were 83 on Sundays, and the fewest accidents were 56 on Saturdays. In the accidents between automobiles and pickup trucks, the most accidents were 46 on Saturdays, and the least number of accidents were 21 on Wednesdays. In the accidents by automobiles and buses, the most accidents occurred on Wednesday and Friday with 14 accidents, and the fewest accident occurred on Monday, Thursday, and Sunday with six accidents. When observed the accidents between motorcycles and pickup trucks, the highest number of accidents was 17 on Fridays, and the least number of accidents was 10 on Mondays. In the accidents between motorcycles and buses in terms of daily data, it was found that the most accidents were 6 on Thursdays, and the fewest accidents were one on Wednesdays and Sundays. The accidents between the buses and pickup trucks mostly occurred on Thursdays, with 6 accidents. No accident occurred on Sundays.
When examining the 3105 fatal and injury accidents between 2010 and 2017 in the Sarıyer district in terms of the accident hours and the number of vehicles crashing into each other, in accidents between automobiles and motorcycles, the most accidents were 147 between 16:00–20:00, and the fewest accidents were 6 between 04:00–08:00. Considering the automobiles and pickup trucks, the most accidents were 62 between 12:00–16:00, and the least number of accidents were 20 between 00:00–04:00. In automobile and bus accidents, the most accidents were 18 between 12:00–16:00 and 16:00–20:00, and the least number of accidents were 2 between 00:00–04:00. In motorcycle and pickup truck accidents, the most accidents were 32 between 12:00–16:00 and 16:00–20:00, and the fewest accidents were 2 between 04:00–08:00. Considering the motorcycle and bus accidents, the most accidents were 9 between 16:00–20:00, and no accident occurred between 04:00–08:00. Finally, when examining the accidents made by buses with pickup trucks, the most accidents were 5 between 08:00–12:00 and 12:00–16:00, and the fewest accident was 1 accident between 00:00–04:00, 04:00–08:00, and 20:00–24:00.
In this study, the accident number values per avenue and street were interpreted in the thematic accident maps together with the accident types given in Table 7. Table 9 shows the accident numbers per street interpreted on the maps.
Figure 2 shows the thematic accident map of 3105 fatal and injury traffic accidents in Sarıyer district between 2010 and 2017 according to the accident types. It is seen that the highest number of accidents was 428 on Büyükdere Street, followed by İstinye Bayırı Street with 154, Tarabya Bayırı Street with 125, Hacı Osman Bayırı Street with 86, Katar Street with 60, and Demokrasi Şehitleri Street with 31 accidents. Accidents in the form of rear-end collisions and side-impact were high on these streets. In addition, hitting a fixed object on Hacı Osman Bayırı Street and hitting pedestrians on İstinye Bayırı Street were high. The label values between 1 and 13 in Table 7 show the meanings of the accident occurrence type labels in these accidents.
Accident number changes by street names were examined using separate maps of the Accident Year data for 2010 and 2017.
According to the map given in Figure 3, when examining the fatal and injury traffic accidents in Sarıyer district in 2010 according to street names, the most accidents were 49 on Büyükdere Street, followed by 26 on İstinye Bayırı Street, 11 on Tarabya Bayırı Street, and 10 on Hacı Osman Bayırı Street. No accidents were observed on Demokrasi Şehitleri and Katar Streets in 2010. When analyzed the 281 accidents that occurred in 2010 in terms of accident types, the most encountered accident type was side collisions, followed by the hits to stationary vehicles, rear collisions, chain accidents, head-on accidents, and hitting to pedestrians. There were 10 accident types here, and the tag values were assigned between 1 and 10 in Table 7.
As seen in the map in Figure 4 showing fatal and injury traffic accidents in Sarıyer district in 2017 in terms of street names, 75 accidents occurred in Büyükdere Street, and there was an increase in the accident numbers compared to 2010. There were 19 accidents on Tarabya Bayırı Street in 2017, thus showing an increase in accident numbers. 13 accidents occurred on Katar Street in 2017, even though no accidents existed in 2010. While there were 26 accidents on İstinye Bayırı Street in 2010, only 3 accidents occurred on this street in 2017. Remarkably, while the number of accidents on İstinye Bayırı Street was high but there were no accidents on Katar Street in 2010, in 2017, the number of accidents raised in Katar Street, and there were only 3 accidents on İstinye Bayırı. This situation, depending on the high accident density at the intersection point, has been attributed to the fact that some accidents might have been recorded on Katar Street minutes, and some on İstinye Bayırı. This region was examined separately on the Kernel Density map, and the accident density was observed as high at the common-use intersection of the two streets. When considered the accidents on Hacıosman Bayırı, while there were 10 accidents on this street in 2010, 7 accidents occurred in 2017, and there was a decrease in the number of accidents. Finally, while no accidents existed in Demokrasi Şehitleri Street in 2010, 3 accidents occurred on this street in 2017, and thus, the number of accidents increased.
When examining 469 fatal and injury accidents in 2017 in terms of accident occurrence types, most of them were side collisions, rear-end collisions, hitting pedestrians, and head-on collisions, respectively. Compared to 2010, the numbers of head-on, rear-end, side-impact, hitting fixed objects, and hitting pedestrian accidents increased in 2017. Notably, a significant increase in hitting pedestrians and hitting fixed objects was observed. There were 13 types of accidents on the 2017 map, and the label value meanings were given between 1 and 13 in Table 7.
The examination of the number of accidents in Sarıyer district by years revealed that 281 accidents occurred in 2010, 469 occurred in 2017, and there was an increase in the accident numbers.

3.2. Point Density Method Results

As seen in Figure 5, 3105 fatal and injury traffic accidents between 2010 and 2017 in Sarıyer district were mapped using the Point Density tool. In the input data of the accident density tool, point-type data were selected. No value was assigned to the vehicle weight field. The reason for this was to get the location-based density results of traffic accidents. Another tab in the tool was the cell size. The pixel size was determined as 10 m. Another point-density function tool was the calculation by the neighbor perimeter. In this field, a circle with a radius of 30 m was entered as the cell size. The most vital point in the process was the value of the pixel size and radius. To get the best result in terms of density, these values must be correctly entered. The frequency of accidents increased as one moved from light-colored places to dark-colored places on the map. The result of the analysis showed that the places where the accidents were intense were on Büyükdere, İstinye Bayırı, Tarabya Bayırı, Hacı Osman Bayırı, Katar, and Demokrasi Şehitleri Streets.

3.3. Kernel Density Method Results

Figure 6 shows the map of 3105 fatal and injury traffic accidents between 2010–2017 in Sarıyer district according to the Kernel Density method. The same operations were performed in the Kernel Density method as did in the Point Density method, and the cell size and pixel size were selected in the same way. It was observed that there was traffic accident intensity on Büyükdere, İstinye Bayırı, Tarabya Bayırı, Hacı Osman Bayırı, Katar, and Demokrasi Şehitleri Streets. In this method, similar to the Point Density method, the number of accidents increased from the light-colored places on the map towards dark-colored ones.

3.4. Getis Ord Gi* Method Results

In Figure 7, a total of 3105 fatal and injury traffic accidents between 2010 and 2017 in Sarıyer district were mapped according to the Getis Ord Gi* method. With the map, it is desired to have the opportunity to determine where the high or low values are, and also to visually compare the methods with each other.
The obtained map hotspots include Büyükdere, İstinye Bayırı, Tarabya Bayırı, Hacı Osman Bayırı, Katar, Demokrasi Şehitleri, Köybaşı, Kilyos, Haydar Aliyev, Çayırbaşı, Sakıp Sabancı, Baltalimanı, and Bahçeköy Forest Road Streets. It has been seen that the road is on Bahçeköy and Adnan Kahveci Streets. The obtained map coldspots include Rumeli Feneri, Kemerburgaz, Uskumru, and Demirciköy Streets.
Köybaşı, Kilyos, Haydar Aliyev, Çayırbaşı, Sakıp Sabancı, Baltalimanı, Bahçeköy Forest Road, Bahçeköy, and Adnan Kahveci Streets are also shown densely in the Kernel Density method, but not in the dark blue tone where the accidents are most intense.
However, since the Getis Ord Gi* method is heavily influenced by neighborhood relations in the determination of hot spots, it has been observed that these streets are considered as hot spots. In addition, the fact that this method is statistically important makes it preferred among spatial statistical methods. However, as can be seen, this method does not look as visually beautiful as the Kernel Density method.
Figure 8 shows the significance graph of the z-number and p-number of 3105 fatal and injury traffic accidents between 2010–2017 in Sarıyer district according to the Getis Ord Gi* method. In the Gi* statistic, the z value is calculated for each object in the data set. As seen in Figure 8, the z-value for all accidents (2010–2017) was 22.372327 (GIZ), and the p-value (GIP) was 0.000000. This situation showed that the necessary condition for the +z numbers to be statistically significant, namely that the z numbers with + valence were densely clustered. As a result, as seen from the table, high GIZ value and small GIP value indicated that high values clustered spatially.
Table 10 shows high GIZ values and low GIP values obtained for all years. Thus, it was concluded that high values clustered spatially in all years.

3.5. Anselin Local Moran’s I (LISA) Spatial Autocorrelation Method Results

With Figure 9, it is desired to see where the streets and avenues with high clustering of a total of 3105 fatal and injury traffic accidents between 2010 and 2017 in Sarıyer district are clustered. As a result of the analysis, it has been seen that the streets with high clustering are Büyükdere, İstinye Bayırı, Tarabya Bayırı, Hacı Osman Bayırı, Katar, Demokrasi Şehitleri, Köybaşı, Kilyos, Haydar Aliyev, Çayırbaşı, and Baltalimanı Streets. As a result of the analysis, it has been seen that the streets with low clustering are Rumeli Feneri, Kemerburgaz, Uskumru and Demirciköy Streets. With this method, it has also been observed that there is a high clustering in Köybaşı, Kilyos, Haydar Aliyev, Çayırbaşı, and Baltalimanı Streets.
Although these streets are shown densely on the maps obtained by the Kernel Density method, since the Kernel method shows the streets with the highest number of accidents in darker colors, it is possible to better analyze the places where the accidents on these streets are dense with statistical methods.
Figure 10 shows that the z value of 3105 fatal and injury traffic accidents between 2010 and 2017 in Sarıyer was 22.12386, and the p probability value was lower than 0.05 within a 95% confidence level. This situation showed a significant change in the available data. The value of the Moran index was 0.583412, and the spatial autocorrelation was concluded to be positive.
Table 11 shows that as a result of the analysis according to the Anselin Local Moran’s I (LISA) Spatial Autocorrelation method, there was a significant change in all years, and the spatial autocorrelation was positive.

3.6. Implementation and Results

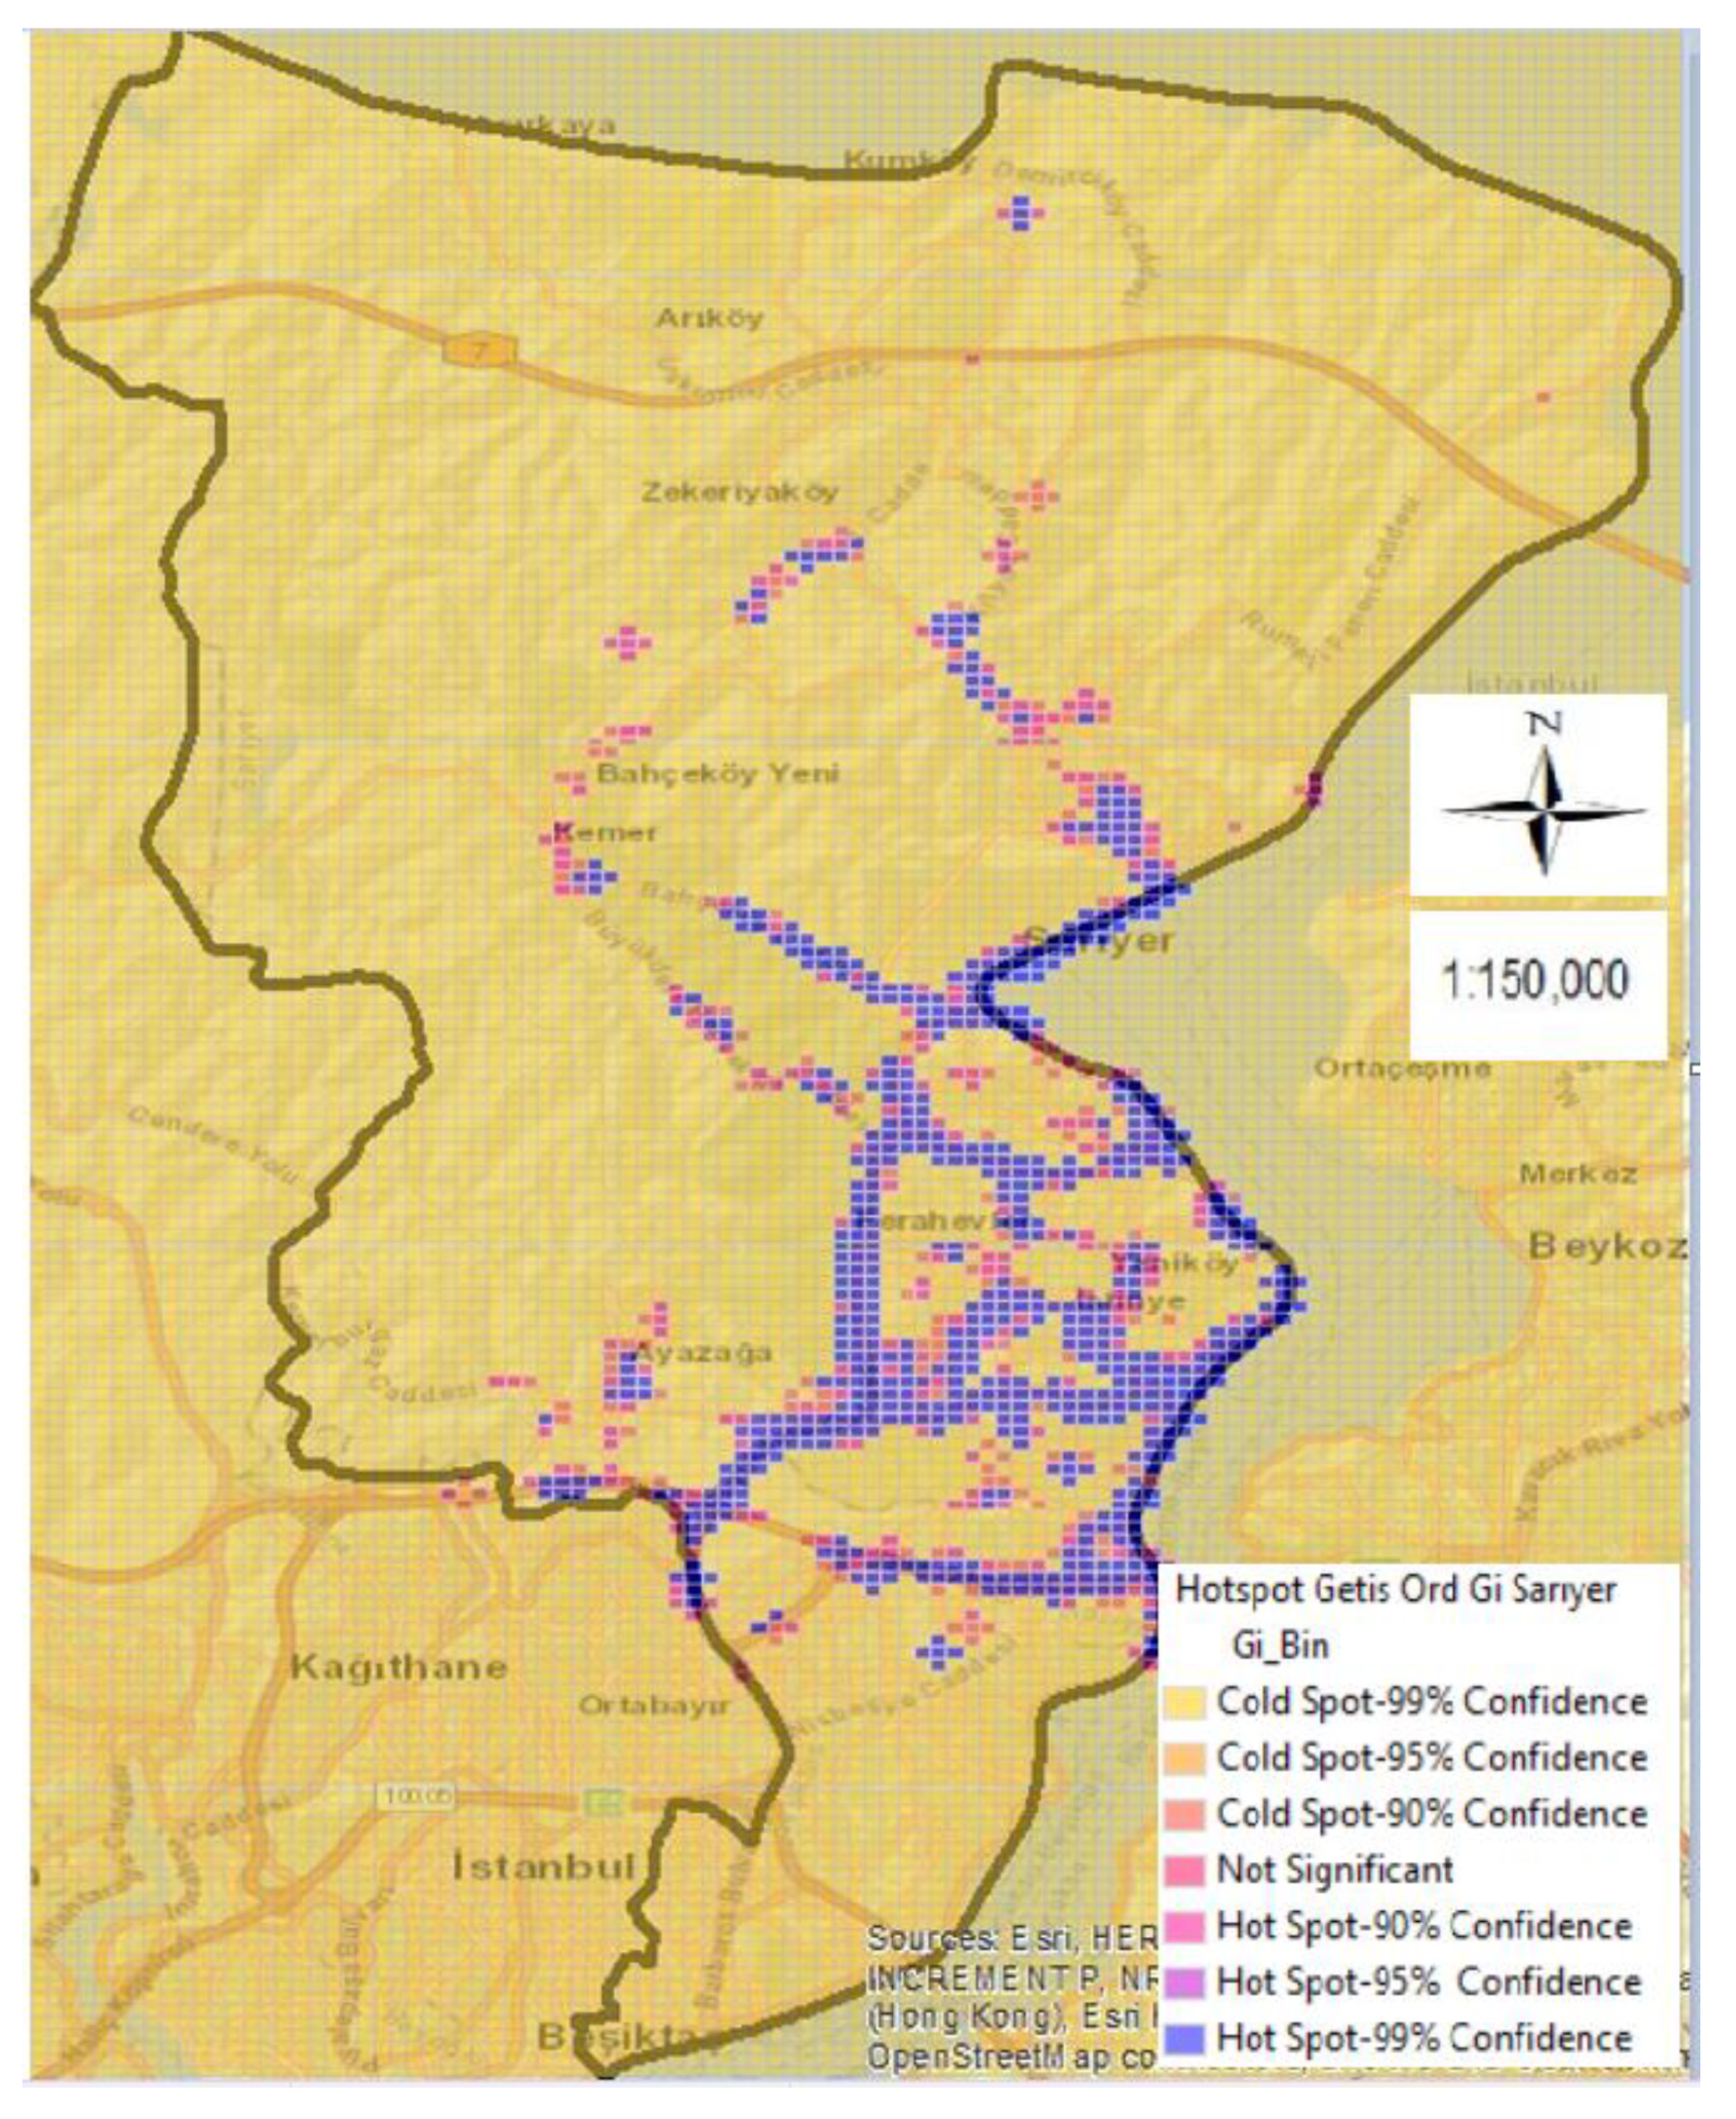
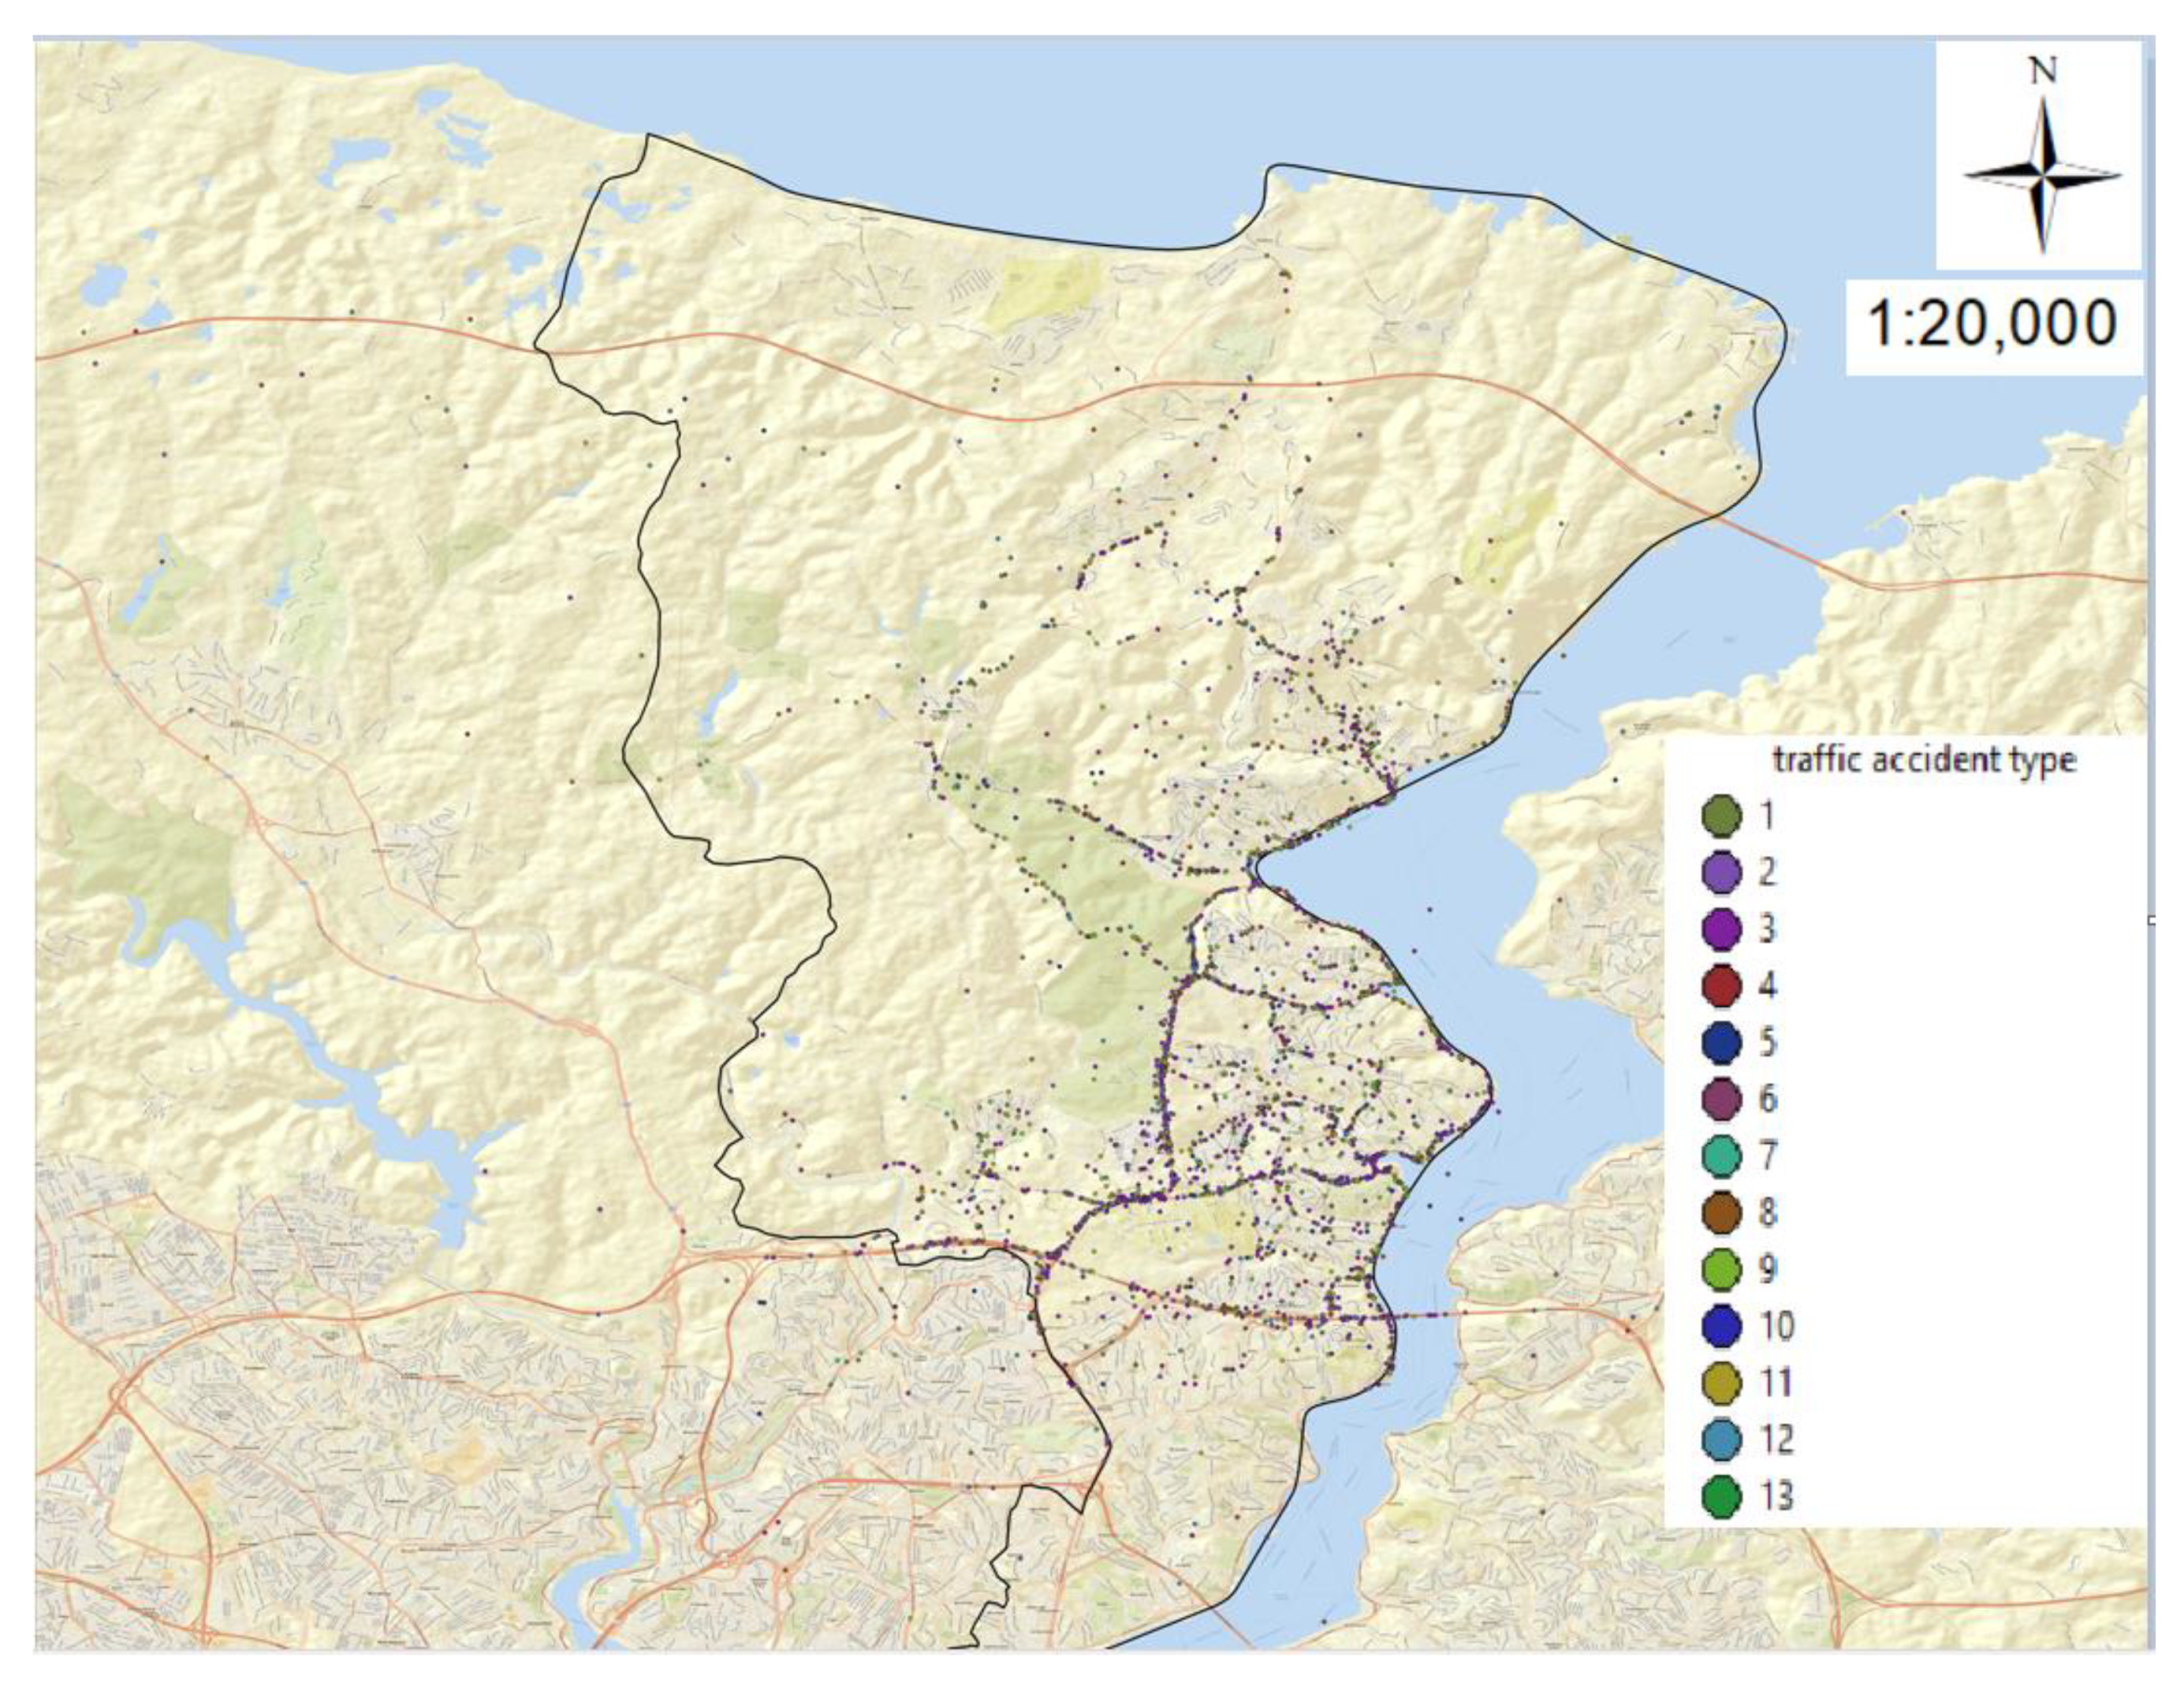
In the implementation and results section, first, the streets that accident density was detected in all spatial methods were analyzed by statistical methods. Later, thematic accident maps, Kernel Density maps, and street images were prepared according to the accident occurrence types in the relevant streets. The Kernel Density method, one of the spatial analysis methods, was preferred in the streets’ detailed analysis since its visuality was better than other spatial analysis methods. Besides, using the Kernel Density method, the current study prepared separate Kernel Density maps of the accidents according to the days of the week, accident hours, and the most accident-prone vehicle types, and observed the changes in the accidents according to these variables.
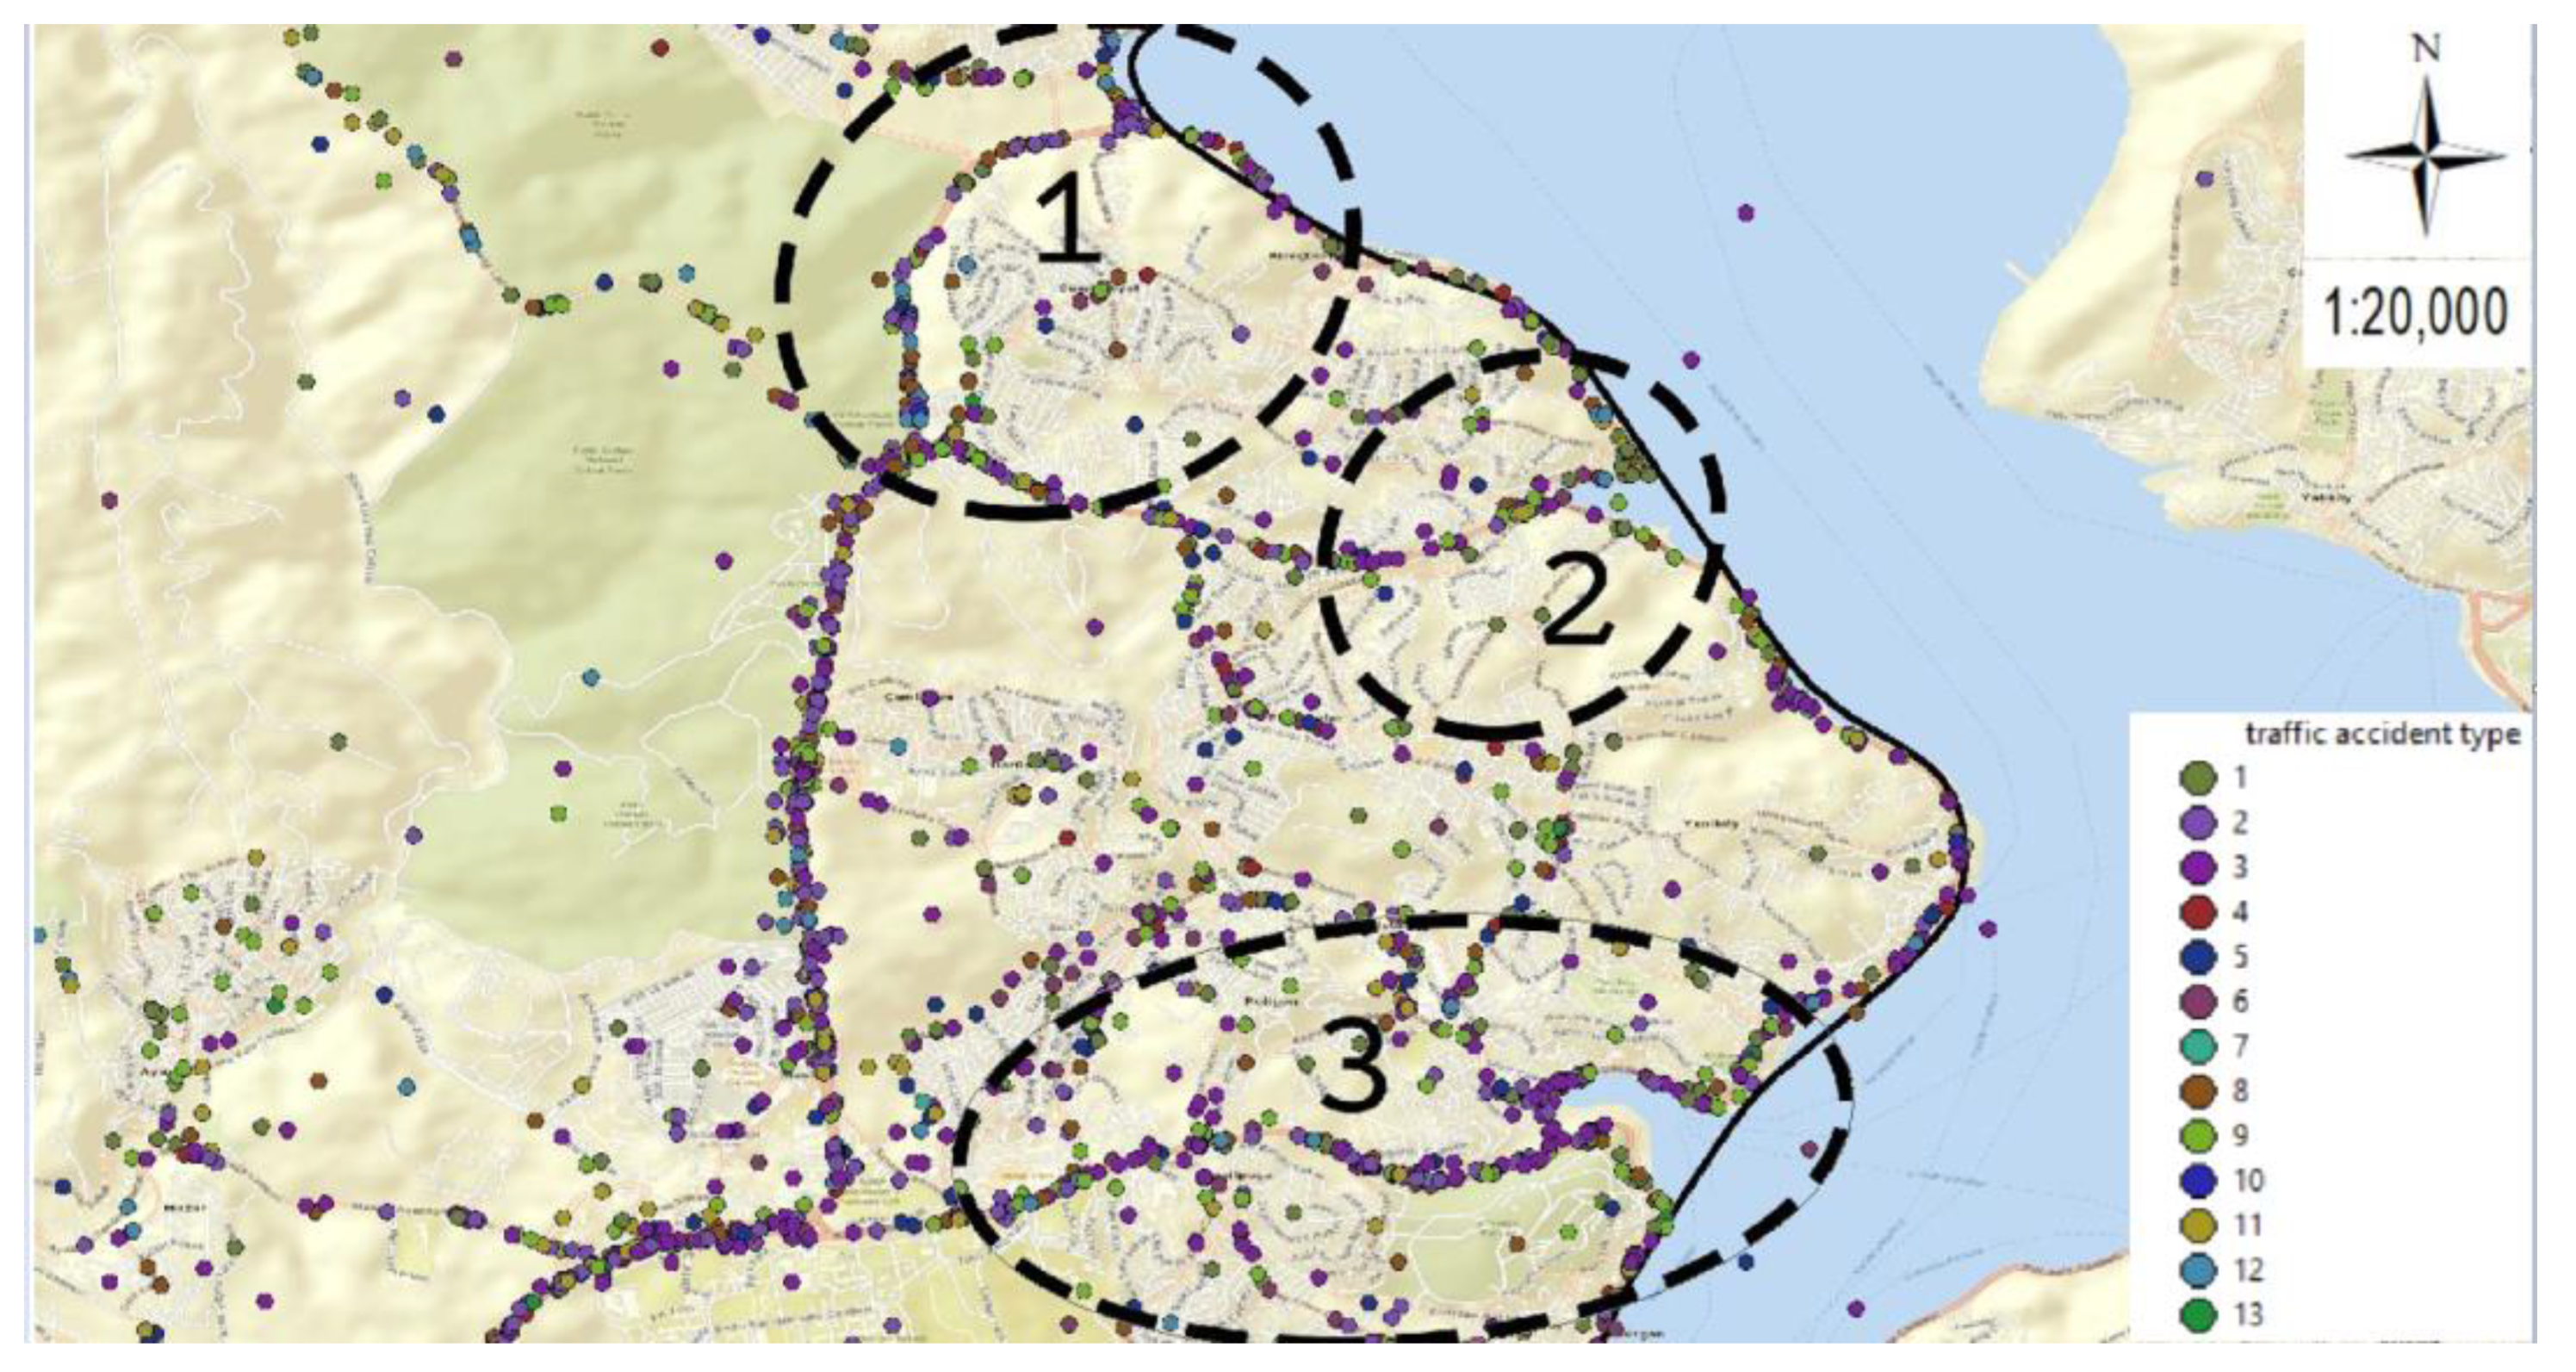
Traffic accidents in Sarıyer district were examined in four zones, including three regions and Büyükdere Street. This separation was made to analyze the Kernel Density map in more detail and for high accident densities in some parts of these four zones.
Figure 11 shows the three separated zones of Sarıyer district, excluding Büyükdere Street. Büyükdere Street was also appointed as the fourth zone. The separation is as follows:

3.6.1. Zone 1: Demokrasi Şehitleri and Hacı Osman Bayırı Streets

As seen in Figure 11, the Sarıyer district was divided into three zones to examine the legends and other elements in the big map in more detail. In Figure 12 below, the 1st Zone was separated into two sub-zones using a thematic accident map again according to the accident occurrence type for a clearer understanding.

Separation 1.A: Demokrasi Şehitleri Street

Figure 13 shows the maps of Demokrasi Şehitleri Street. Figure 13a shows the thematic accident map according to the accident types, and 13b shows the Kernel Density map. Thus, Demokrasi Şehitleri Street, for which the accident density was quite incomprehensible on all maps, became understandable with the separated maps.
When examining according to accident types, in the 31 fatal and injury accidents between 2010–2017 in Demokrasi Şehitleri Street, it was observed that there were 9 rear-end collisions and 7 pedestrian accidents. Since pedestrian accidents were in the second rank in fatal and injury accidents on this street, overpasses on the vital accident-dense points can decrease these accidents. Besides, speed signs can be placed to reduce accidents, and if any signaling errors exist, repairs should be made.
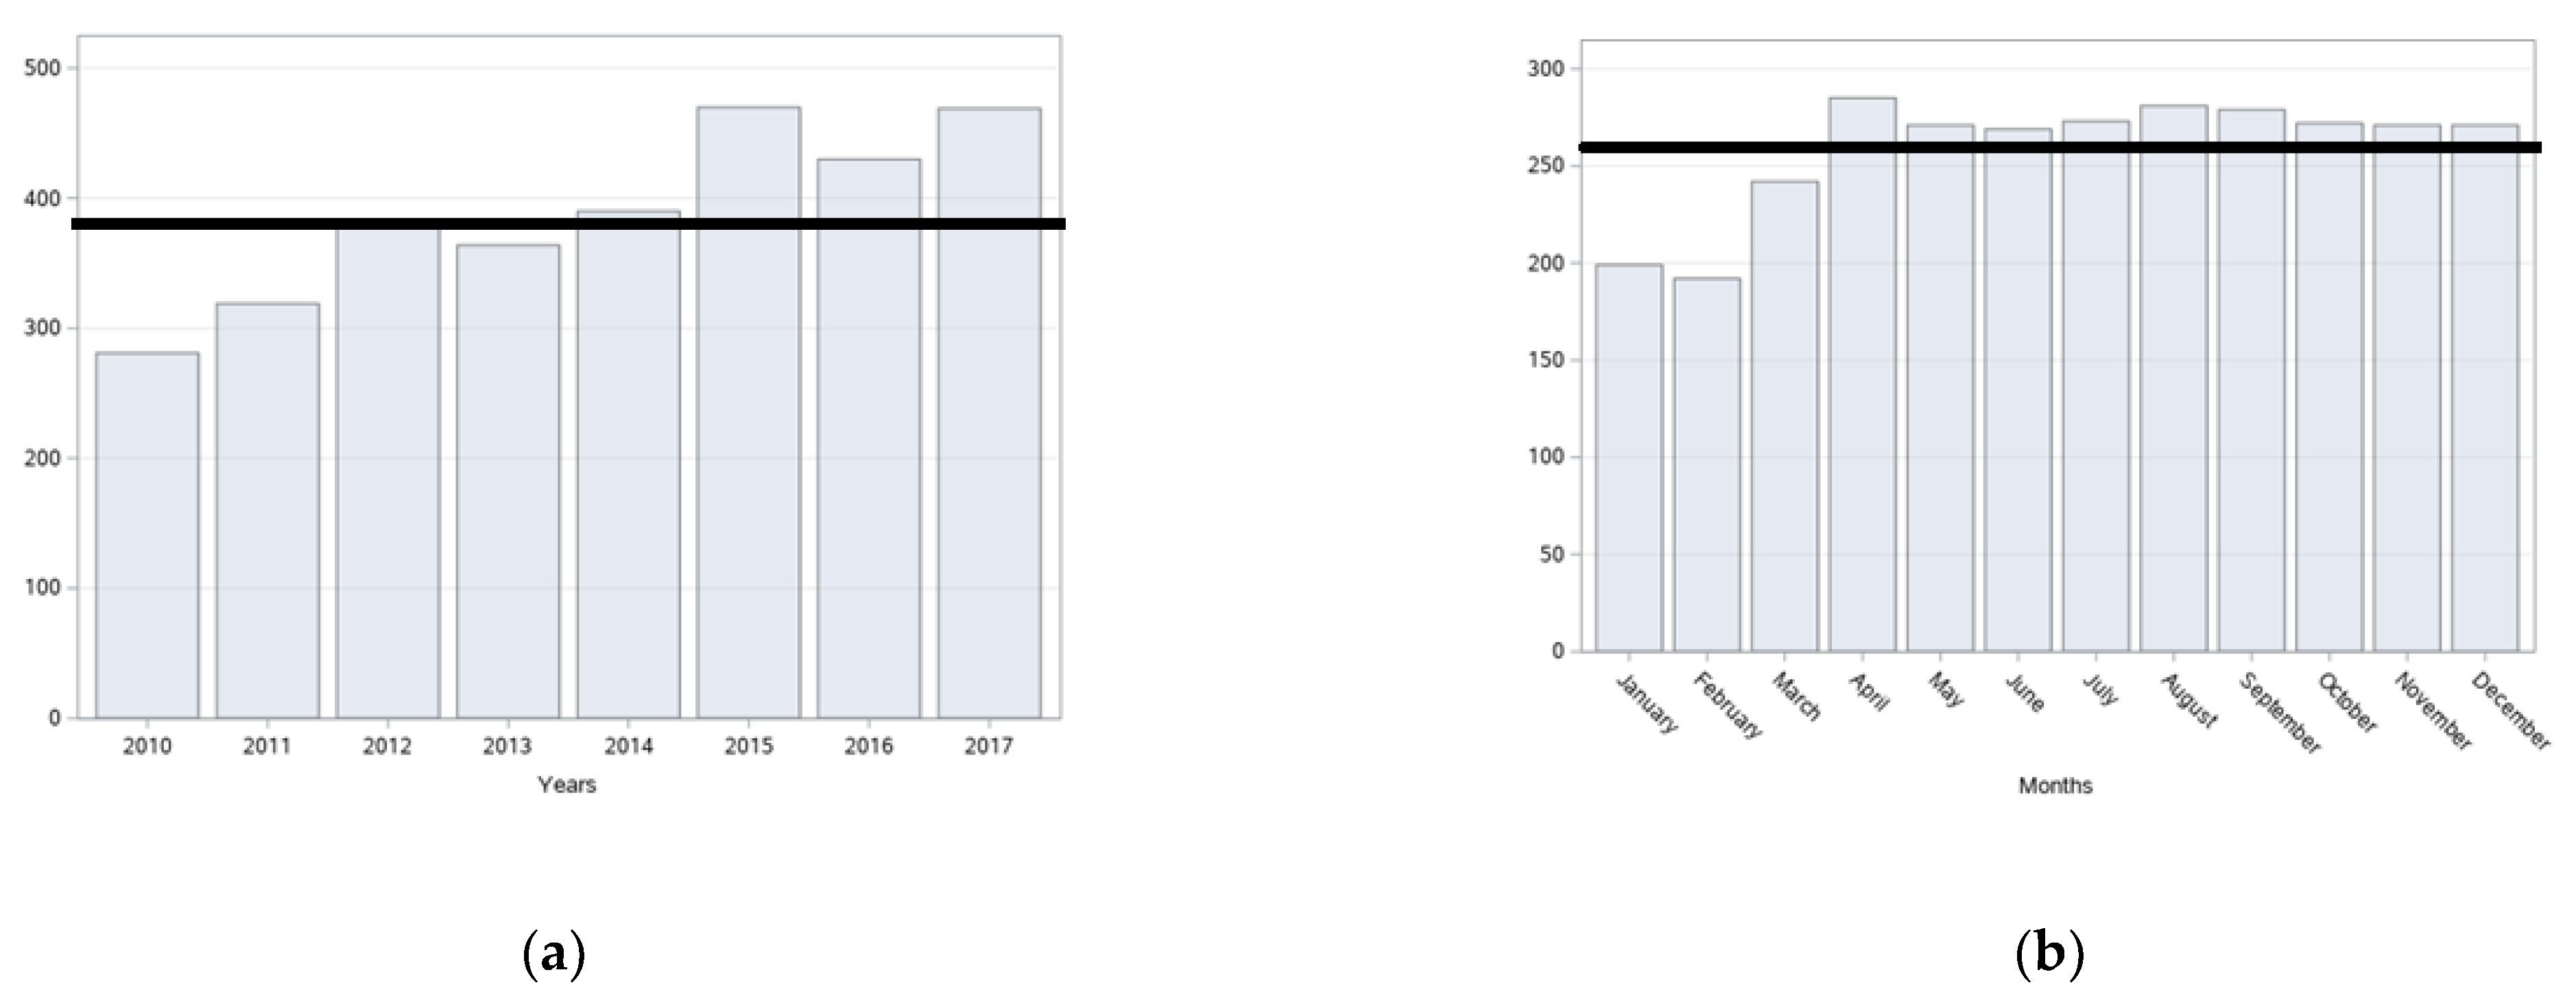
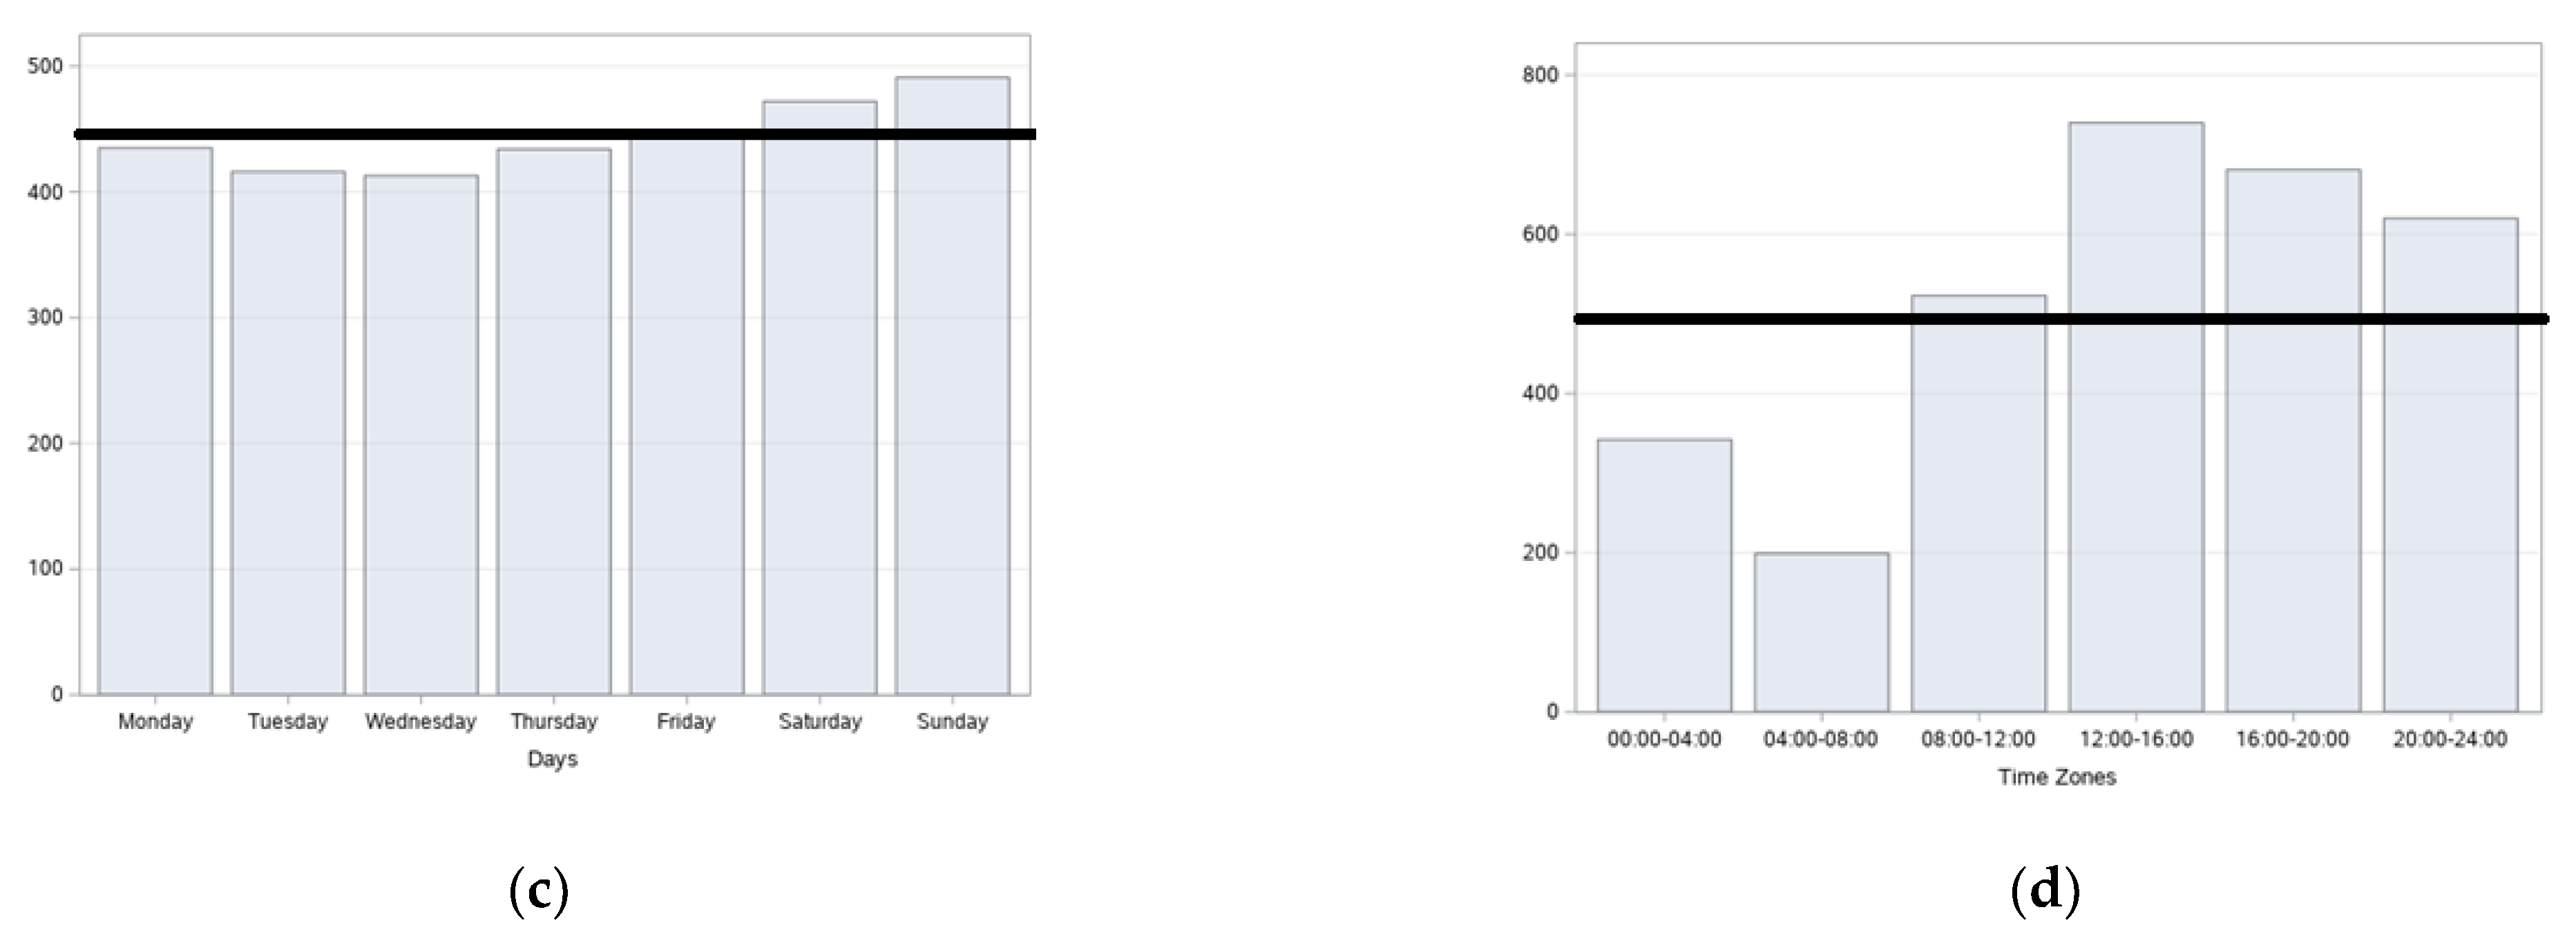
When examining the accidents on this street according to accident hours, the highest number of accidents was between 00:00–04:00 with 9 accidents, and the fewest accidents were between 04:00–08:00 with 1 accident. The examination of these accidents according to the geometric horizontal position of the road showed that 31 accidents occurred on the straight road. The investigation, according to the geometric vertical condition of the road, showed that 30 accidents occurred on the non-sloping roadway, and one accident occurred on the sloping road. When examining the way according to the geometric intersection situation, there were no intersections in 27 accidents. According to the road geometric crossing status, there were no overpasses in 17 accidents, but overpasses existed in 14 accidents. Traffic lines were intact in 29 accidents, while the traffic lines were in a damaged situation in 2 accidents.
As for the road lightning, there was lighting in 27 accidents, while no lighting was present in four accidents. There were traffic lights in 18 accidents, and no traffic lights existed in 13 accidents. Finally, examining road types showed 23 accidents on the divided road and 6 on a one-way street, and 2 on two-way roadways.
In terms of the number of accidents of the vehicles with the highest number of accidents, it was seen that automobiles played a role in 25 accidents, motorcycles in 6, pickup trucks in 6, and buses in 2 accidents.
When examining the 25 automobile accidents according to days of the week, the most accidents were on Wednesday with 7, and there were no accidents on Tuesdays and Fridays. While the most accidents on this street were between 00:00–04:00 and 12:00–16:00 with 7 accidents, it was found that they had no accident between 04:00–08:00. When examining the 6 motorcycle accidents according to days of the week, the most accidents were on Wednesday with 3, and they had no accidents on Tuesday, Friday, Saturday, and Sunday. While the motorcycles had the most accidents on this street between 00:00–04:00 with 2, no accidents existed between 04:00–08:00. As for pickup truck accidents according to days of the week, the most accidents were on Monday with 3, and no accident occurred on Tuesday, Wednesday, and Sunday. In terms of accident hours, pickup trucks had the most accidents between 08:00–12:00 with 3 and had no accidents between 12:00–16:00, 16:00–20:00, and 20:00–24:00. Finally, the buses were involved in a total of 2 accidents on Friday. In addition, the buses made accidents equal between 08:00–12:00 and 16:00–20:00.

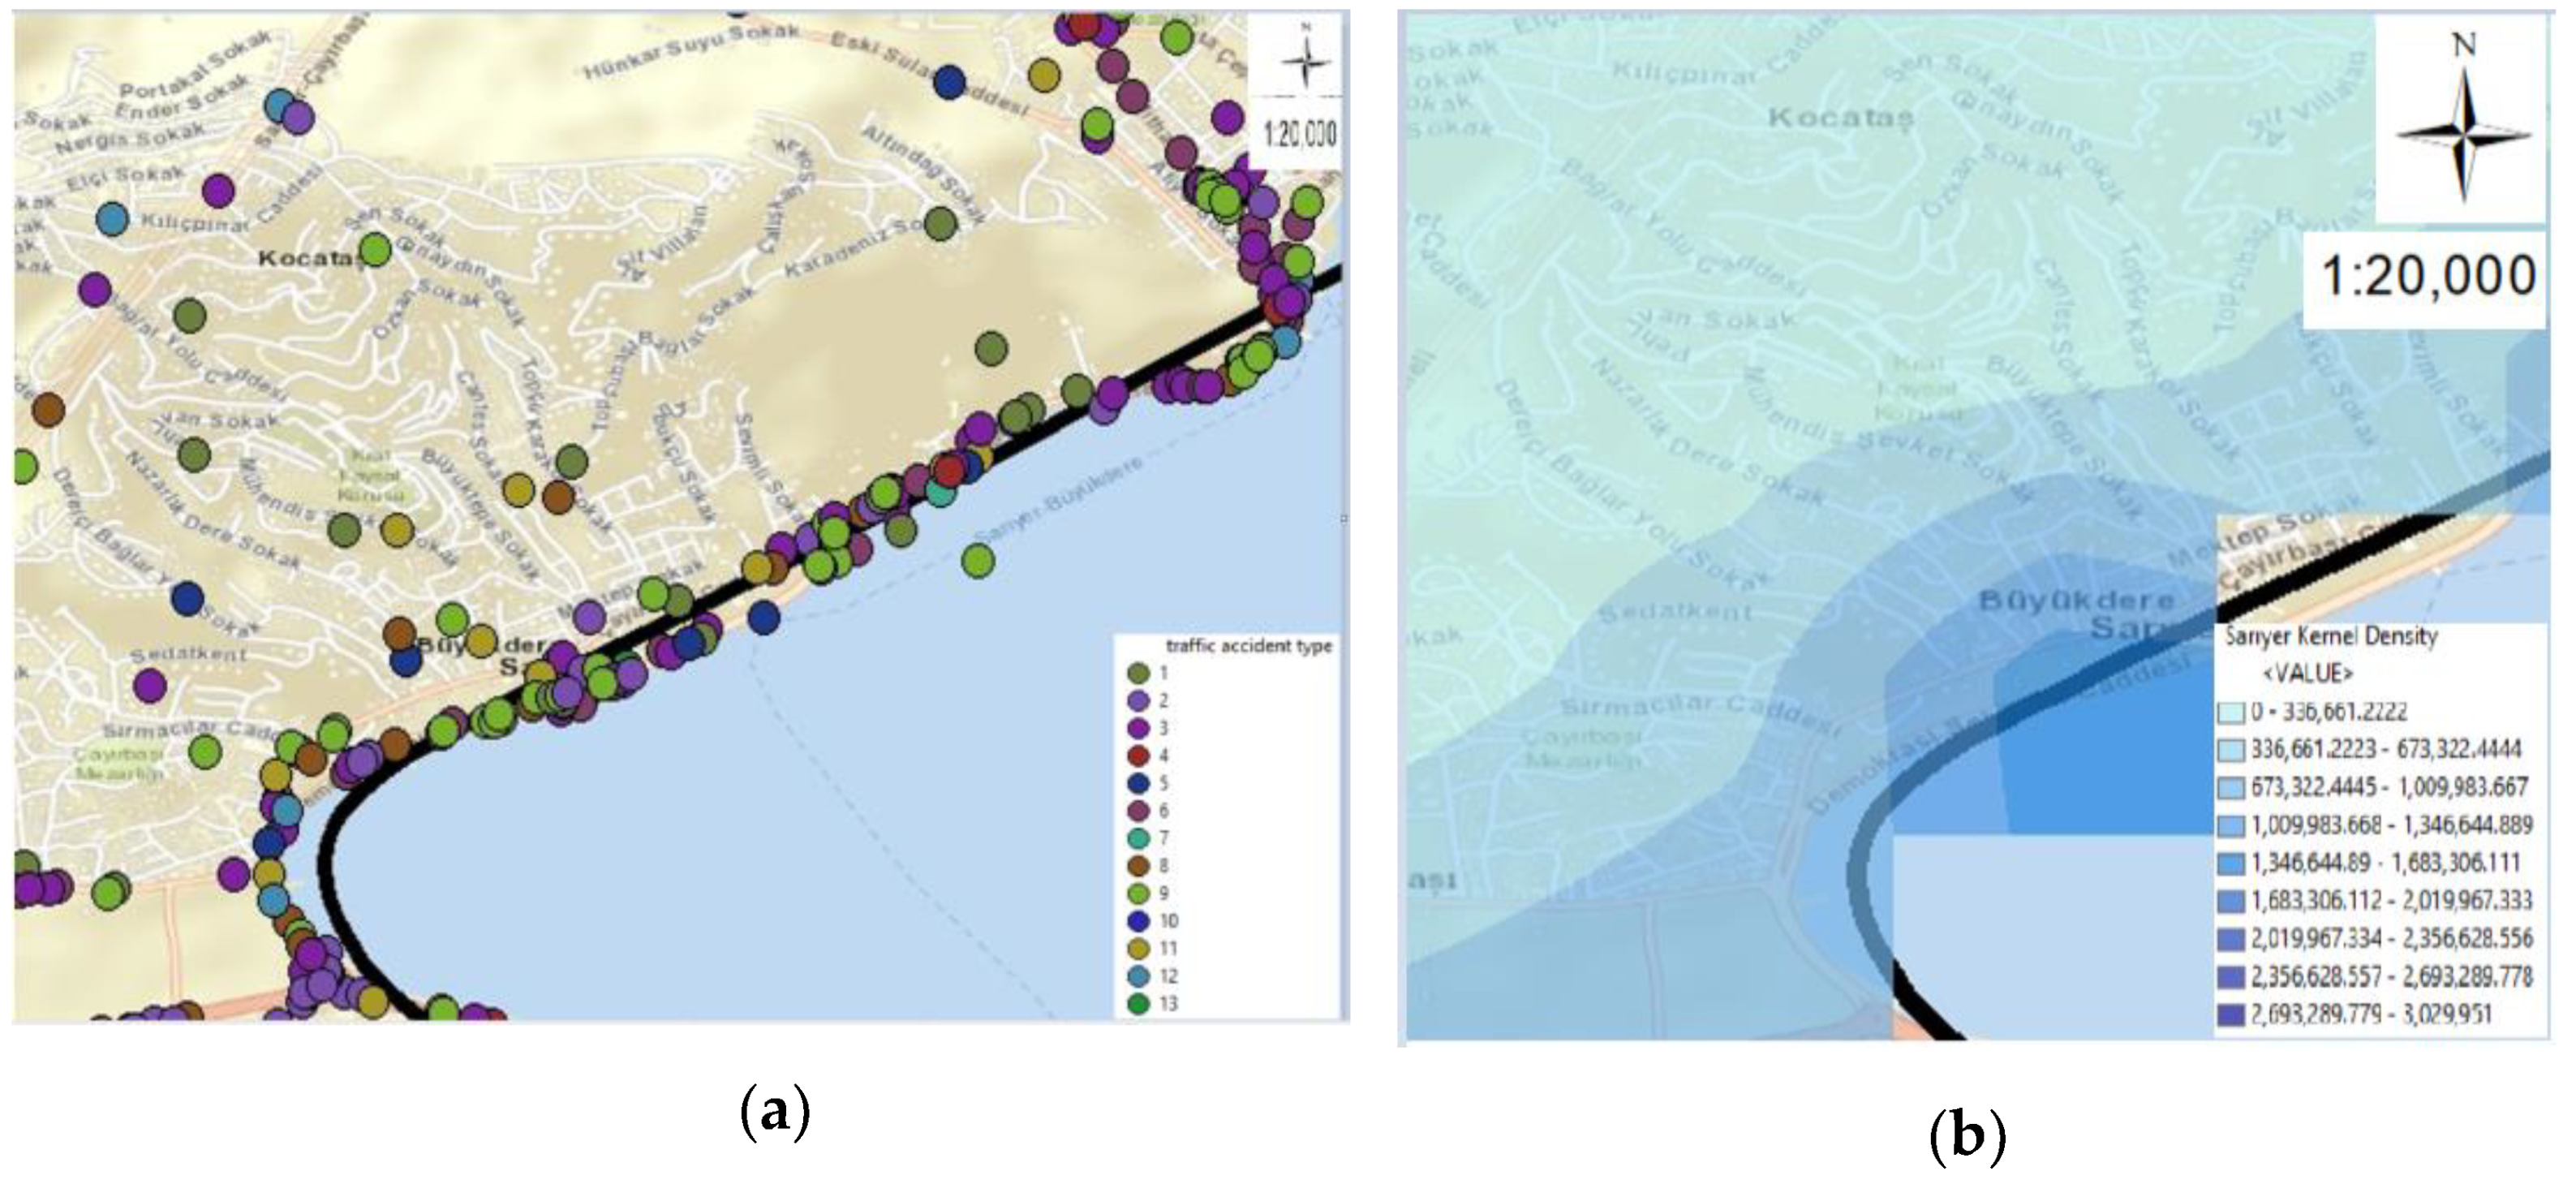
Separation 1.B Hacı Osman Bayırı Street

Figure 14 shows the maps of Hacı Osman Bayırı Street. Figure 14a shows the thematic accident map according to the type of accident, and Figure 14b shows the Kernel Density map. Thus, Hacı Osman Bayırı Street, where the accident intensities were not comprehensible on all maps, was better understood through the separated maps.
When examining the 86 accidents on Hacı Osman Bayırı Street between 2010–2017 according to the accident types, rear-end collisions were the most occurred accidents with 26 accidents. The next most frequent ones were the accidents as hitting a fixed object with 20 accidents. The majority of the accidents were determined to be near the Hacıosman Türkmenbaşı Nature Park, which is at the end of this street. Here, drivers can be warned against the winding and sloping road, with striking warning signs that will enable them to focus their attention to reduce the accidents occurring here.
When examining the accidents on this street according to accident hours, the most accidents were between 20:00–24:00 with 27, and the fewest accidents were between 00:00–04:00 with 7 accidents. In examining these accidents according to the geometric horizontal situation of the road, it was observed that 43 accidents occurred on the winding road, and 40 accidents occurred on the straight road. When analyzing the roadway according to the geometric vertical state, while 55 accidents occurred on the sloping way, 23 accidents occurred on the non-sloping way. In terms of the geometric intersection situation, it was seen that there were no intersections in 84 accidents and, according to the road geometric overpass status, there was no overpass in 83 accidents. However, there were pedestrian crossings in 2 accidents and a controlled railway in 1 accident. The examination of whether there were traffic lines showed that there were traffic lines in 80 accidents. In 6 accidents, traffic lines were in damaged situations.
However, when examining the accidents on this road according to whether there was road lighting, there was lighting in 74 accidents, there was no lighting in 10 accidents, and the lighting was out of order in 2 accidents. Depending on whether there was a traffic light, there was no traffic light in 68 accidents, the traffic light was out of order in 10 accidents, and the traffic light was available in 8 accidents. Finally, according to the road type, 51 accidents were on the divided road, 28 accidents were on the one-way road, and 7 accidents occurred on the two-way road.
By looking at the accident numbers of the most accident-prone vehicles, automobiles had 63 accidents, motorcycles had 11, pickup trucks had 15, and buses had 5 accidents on this street.
When we analyzed 63 automobile accidents according to days, the greatest number of accidents were on Wednesday with 11 accidents, and the fewest accidents were on Thursday with 6. When the automobiles had the most accidents on this street was between 20:00 and 24:00 with 23 accidents, and the fewest accidents were between 16:00 and 20:00 with 4. According to the days of the week, of the 11 motorcycle accidents, the most accidents were on Wednesday, with 4 accidents, and no accidents were on Saturday. In terms of the accident hours, motorcycles made the most accidents on this street between 08:00–12:00 with 4 accidents, and they had no accidents between 04:00–08:00. When examining the pickup truck accidents with the days of the week data, the most accidents were on Tuesdays and Sundays with 4 accidents, and they had no accidents on Mondays. Pickup trucks had the most accidents between 12:00–16:00 and 16:00–20:00, with 4 accidents, considering the accident hours, and they made no accidents between 00:00–04:00. Finally, the buses made 2 out of 5 accidents on Friday by making the most accidents, and no accidents on Monday, Wednesday, and Saturday. According to the accident hours, the buses made most accidents between 20:00–24:00 with 2 accidents, and they had no accidents between 12:00–16:00 and 16:00–20:00.

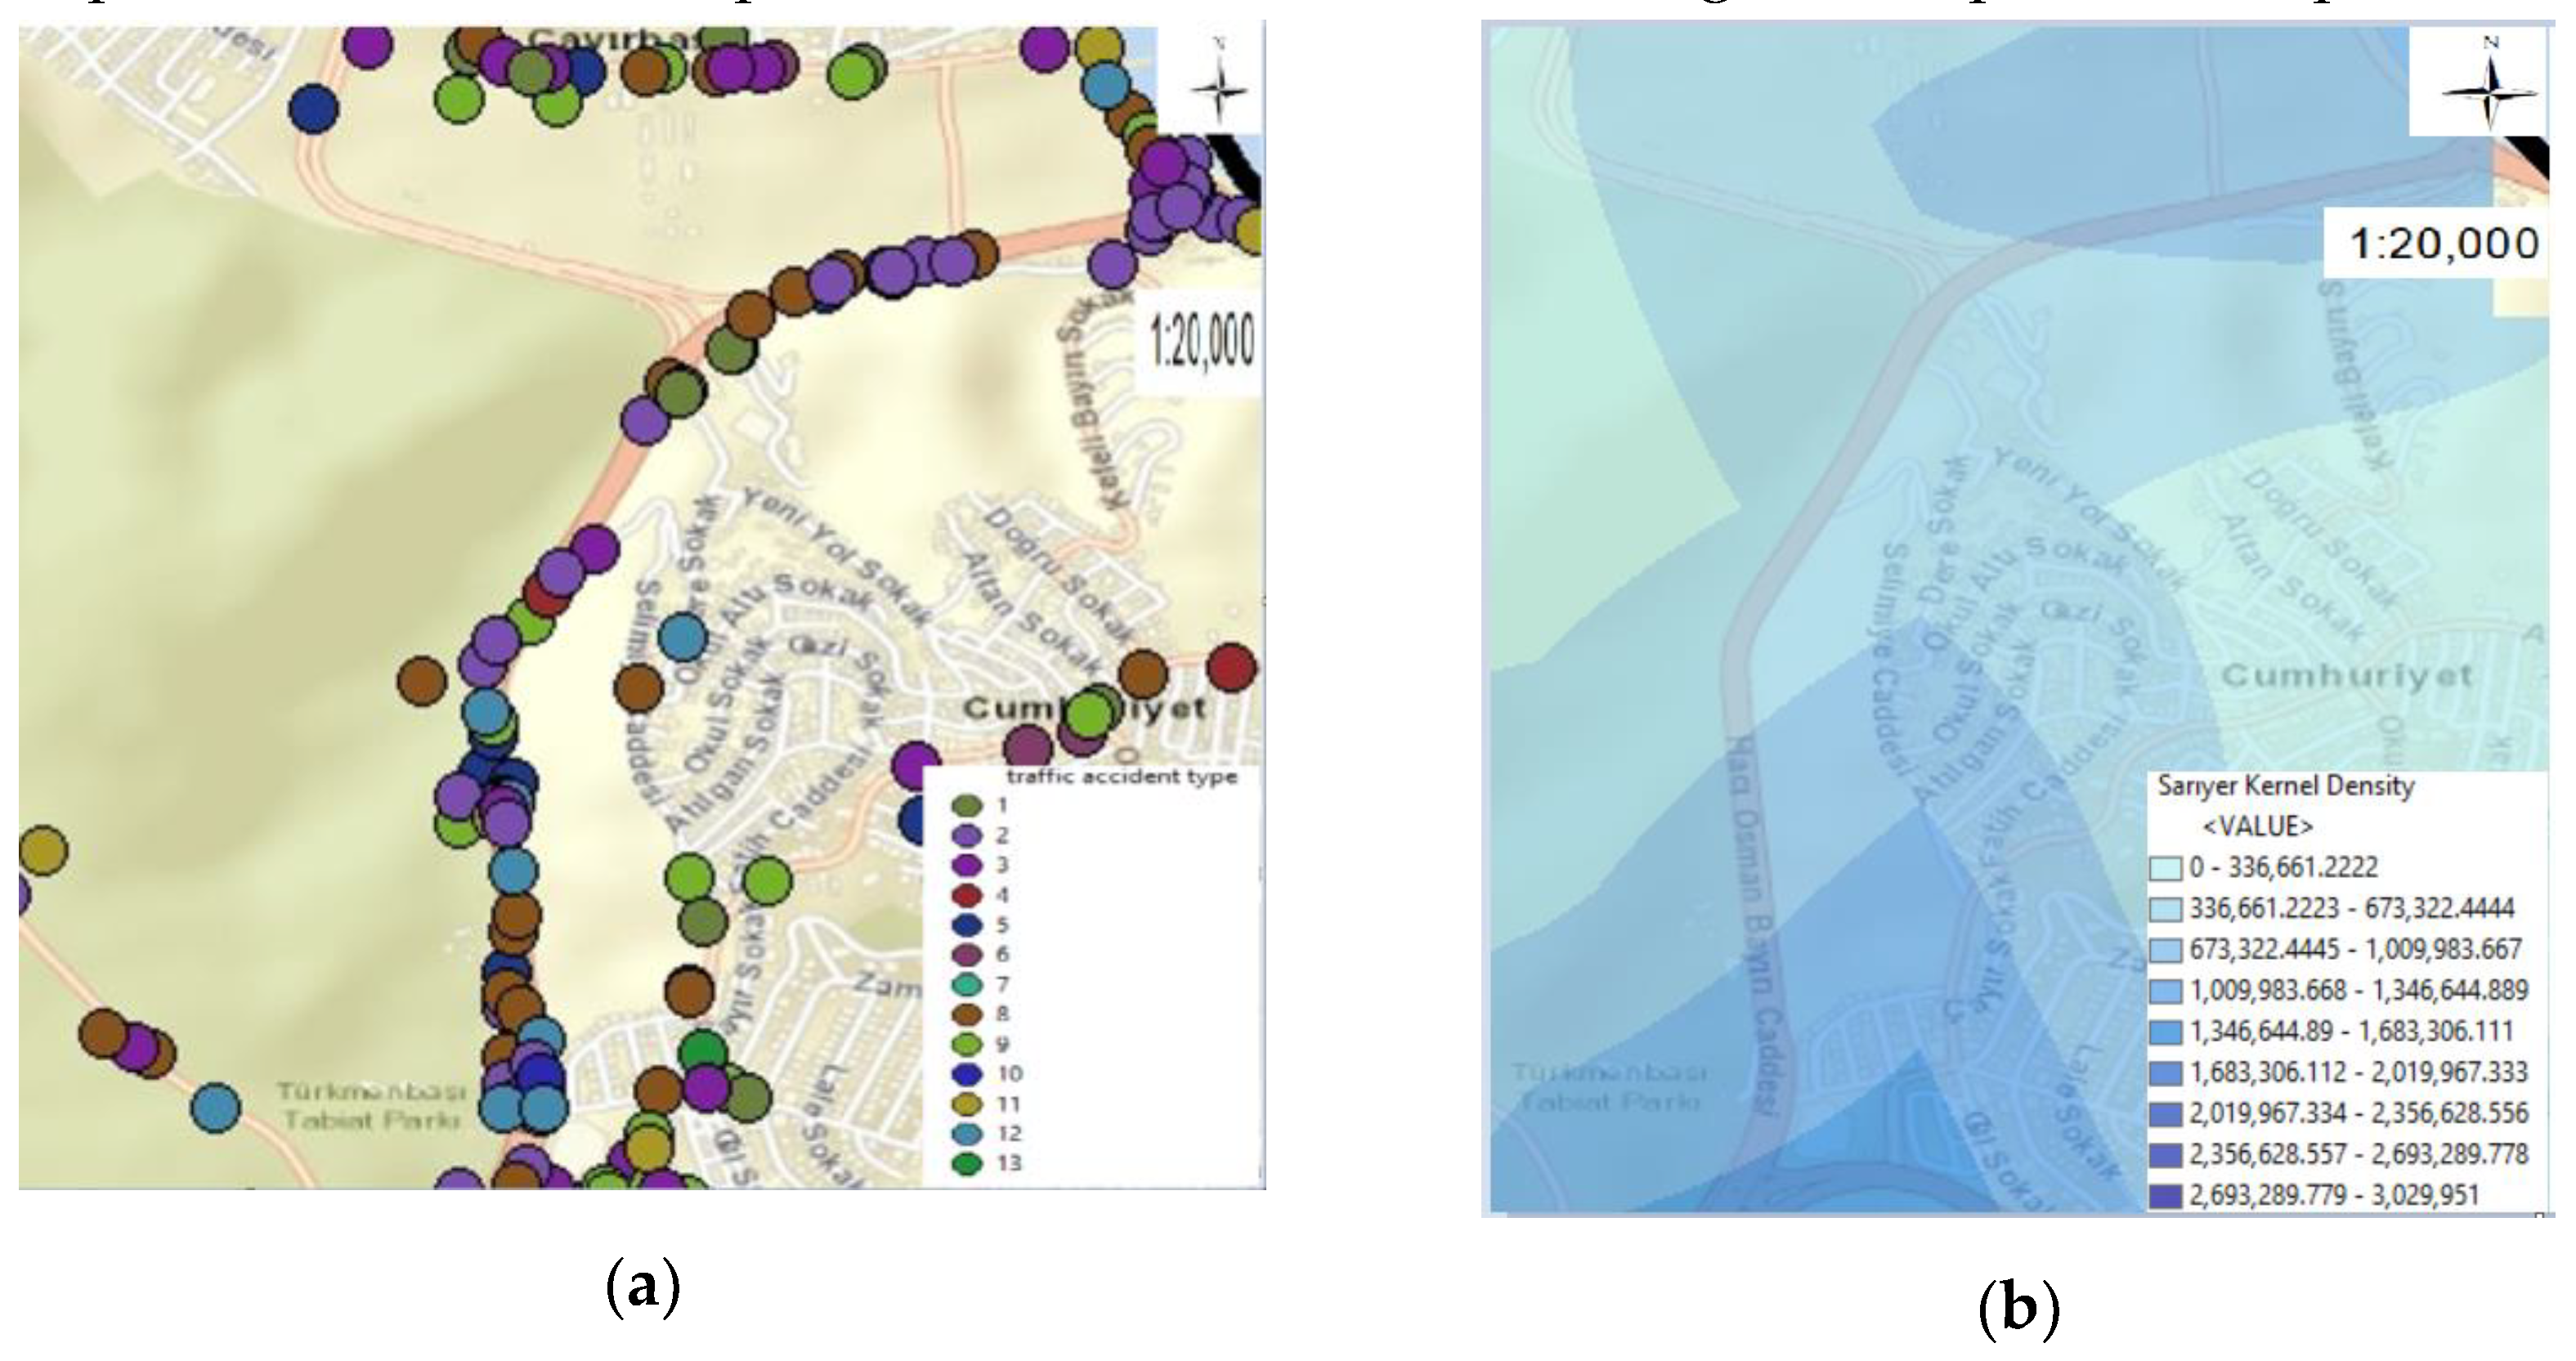
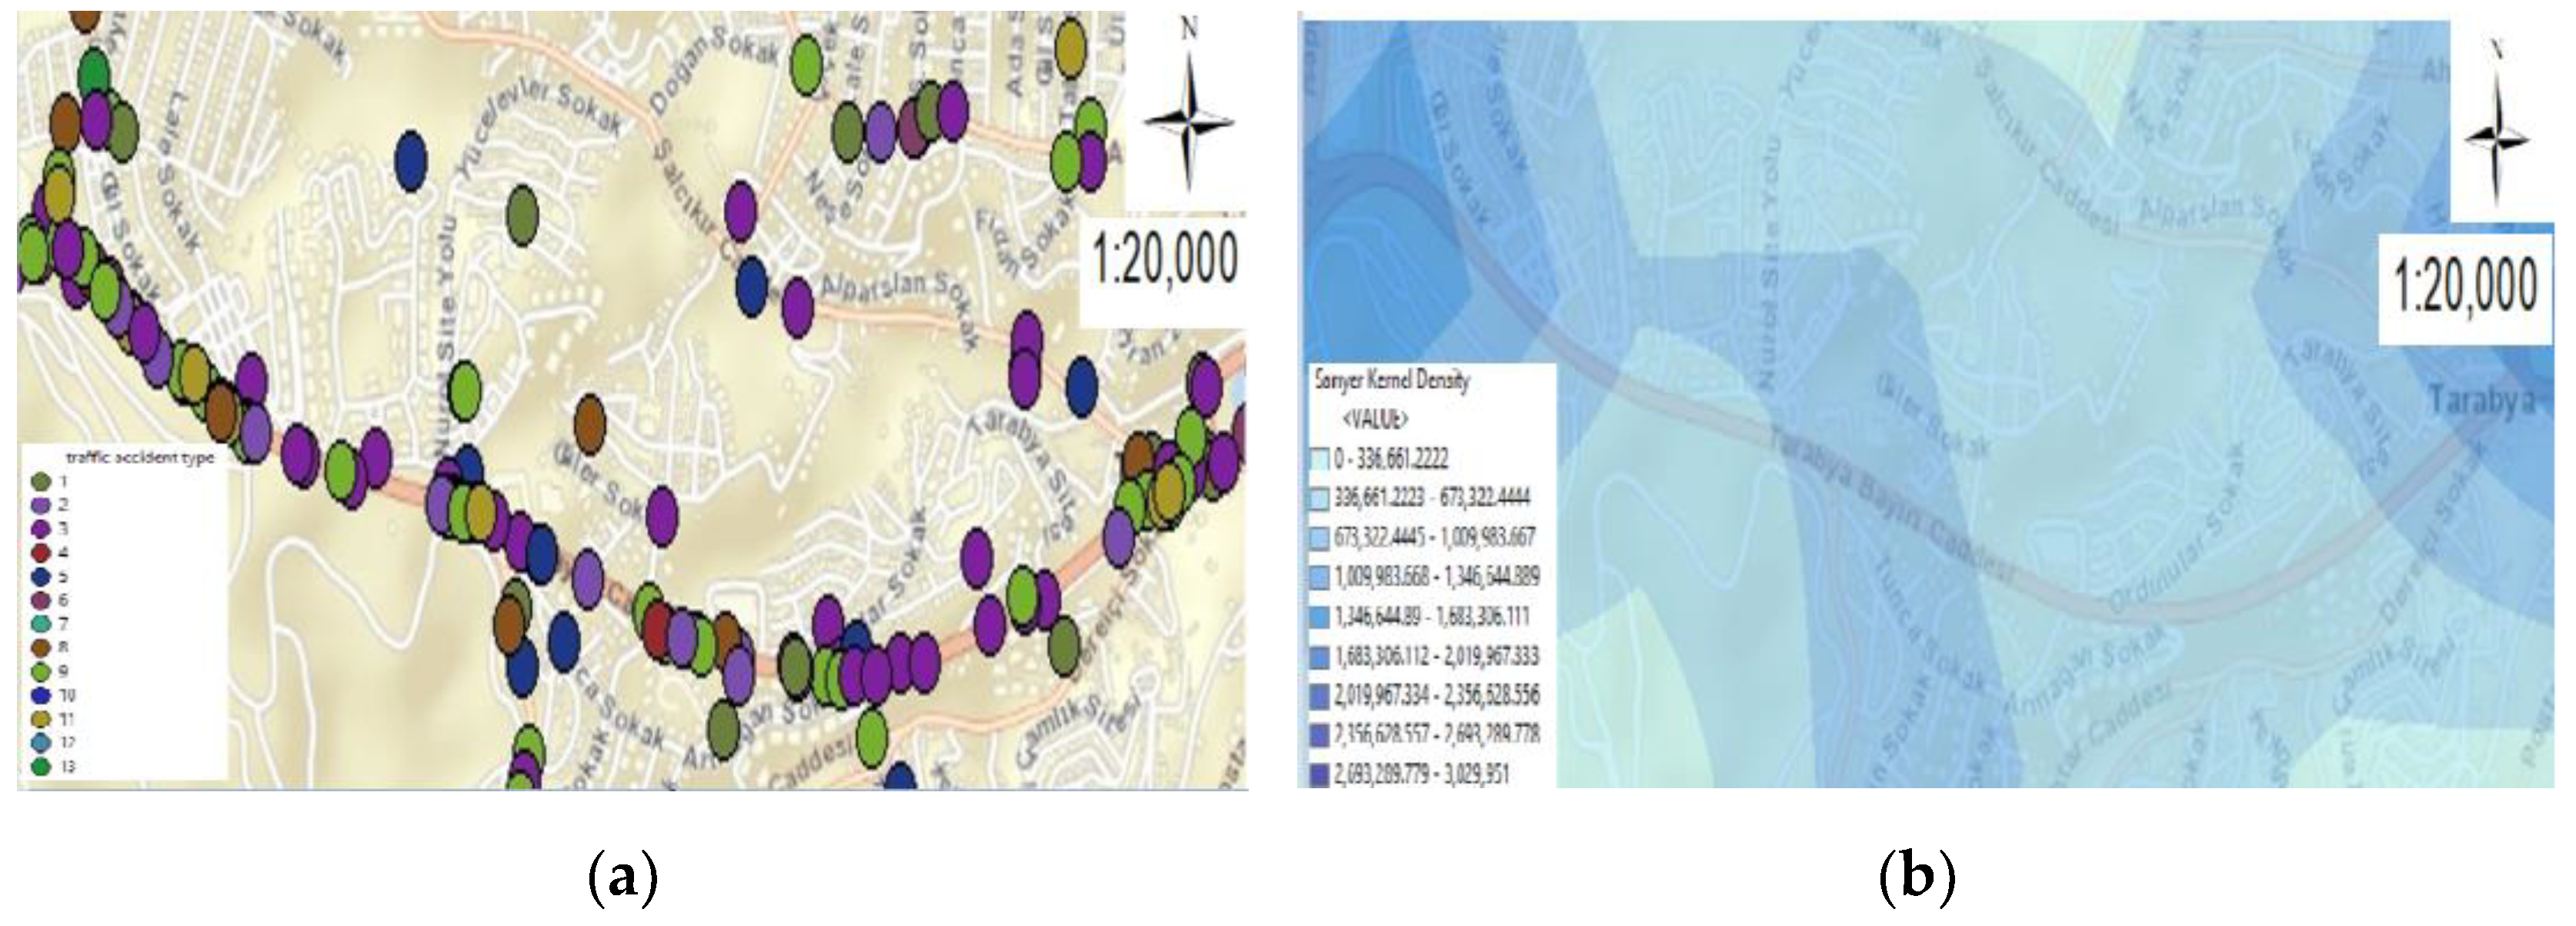
3.6.2. Zone 2: Tarabya Bayırı Street

Figure 15 shows the maps of Tarabya Bayırı Street. Figure 15a shows the thematic accident map by type of accident, and Figure 15b shows the Kernel Density map. Thus, Tarabya Bayırı Street, where the intensity of the accidents was not very understandable on all maps, became clearer through separating maps.
When analyzed the 125 fatal and injury accidents on Tarabya Bayırı Street between 2010–2017 according to the type of accident, the highest number of accidents was the rear-end collision with 46 accident, and side-impact collision with 26. It was determined that the most intense accident point occurring on this street was the common intersection at the end of this street and the end of Yeniköy Tarabya Street. Accidents can be prevented by adding a roundabout and traffic lights on this street.
Examining the accidents on this street according to the accident hours showed that the most accidents were between 20:00 and 24:00 with 32 accidents, and the fewest accidents were between 04:00 and 08:00 with 7.
Examining these accidents by the road geometric horizontal condition showed that 108 accidents were on straight roads and 17 were on winding ones. In analyzing the roadway’s geometric vertical situation, 75 accidents were seen to occur on the sloping ways, and 43 were on the non-sloping ones. According to the road geometric intersection situation, there were no intersections in 101 accidents. As for the road geometric crossing status, while there was no pedestrian crossing in 98 accidents, pedestrian crossings were present in 25 accidents. While 114 accidents had proper traffic road lines, in 11 traffic accidents, lines were insufficient.
According to the lighting situation of the accident scene, there was lighting in 112 accidents, there was no lighting in 11, and the lighting was out of order in 2 accidents. As for traffic lights, there were no traffic lights in 71 accidents, traffic lights were present in 45 accidents, and traffic lights were broken-down in 9 accidents. According to the road type, 58 accidents occurred on the divided road and 47 on the two-way roads.
The accident numbers of most accident-prone vehicles on this street were 91 for automobiles, 39 for motorcycles, 19 for pickup trucks, and 8 for buses.
In the distribution of 91 automobile accidents by the days of the week, the highest number of accidents was on Wednesday with 17, and the fewest accidents were on Tuesdays and Fridays with 10 accidents. When the automobiles had the most accidents on this street was 20:00–24:00 with 26, and the accident hour with the fewest accidents was 04:00–08:00 with 2 accidents. Examination of 39 accidents of motorcycles, which were the second vehicle type with the highest accident numbers, showed that the highest number of accidents occurred on Sunday with 8 accidents, and the fewest accident number was on Saturday with 3 accidents. According to accident hours, the distribution of the motorcycle accidents on this street showed that the most accidents were between 20:00–24:00 with 13 accidents, and the fewest accidents were between 00:00–04:00 and 04:00–08:00 with 2 accidents. Pickup trucks had the most accidents on Wednesday, Thursday, and Saturday, with 4 accidents. No accident was on Monday. According to the accident hours, pickup trucks had the most accidents between 16:00–20:00 and 20:00–24:00 with 5 accidents, and the fewest accident between 04:00–08:00, with 1 accident. Out of the 8 accidents, buses made 2 accidents on Wednesday, Thursday, and Saturday, one on Tuesday and Sunday, and no accidents on Monday and Friday. Buses had the accidents between 08:00–12:00 mostly, with 3 accidents. No accident occurred between 04:00–08:00 and 20:00–24:00.

3.6.3. Zone 3: Katar Street and İstinye Bayırı Street

Figure 16 shows the maps of Katar and İstinye Bayırı Streets. Figure 16a shows the thematic accident map according to the type of accident, and Figure 16b shows The Kernel Density map. Thus, Katar Street and İstinye Bayırı Street, where the accident intensities were not understandable on all maps, were better understood through the separated maps.
When analyzed the 60 fatal and injury accidents on Katar Street between 2010 and 2017, according to the type of accident, the most accidents were side collisions with 18 accidents and rear-end impacts with 16 accidents. The intersection between Katar and İstinye Streets was determined as the most accident-intense place. Roundabouts and traffic lights can reduce accidents at this intersection and make the road safer.
When examining the 60 accidents on Katar Street according to accident hours, the most accidents were between 20:00–24:00, with 13 accidents, and the fewest accidents were between 04:00–08:00, with 6 accidents. According to the road geometric horizontal condition, 47 accidents were on the straight roads, 12 were on the winding roads, and 1 accident occurred on the road with a dangerous bend. As for the road geometric vertical condition, 36 accidents were on the sloping roadways, 24 were on leveled roads. In terms of the geometric intersection situation, no intersections were in 47 accidents, and according to the road geometric crossing status, no pedestrian crossings were in 50 accidents. There were pedestrian crossings in 9 accidents, and a controlled railway was present in 1 accident. When examining the status of traffic lines, it was seen that there were proper road lines in 56 accidents, while the road lines were a broken-down situation in 4 accidents.
When examining the street lighting status, it was observed that there was lighting in 50 accidents, no lighting was in 8 accidents, and there was a broken-down lighting situation in 2 accidents. In terms of the traffic lights, it was observed that there was a traffic light in 27 accidents, no traffic light in 26 accidents, and the traffic lights were out of order in 7 accidents. The analysis by the road type showed that 53 accidents were on divided roadways, 5 were on one-way roads, and 2 were on two-way roads.
When examining the most accident-prone vehicles in terms of the fatal and injury accident numbers on this street, it was seen that automobiles had 46, motorcycles had 15, pickup trucks had 9, and buses had 6 accidents. Analyzing the 46 automobile accidents by the days of the weeks showed that the most accidents were on Friday, with 10 accidents, and the fewest accidents were on Monday and Tuesday, with 4 accidents. When the automobiles had the most accidents on this street was between 20:00–24:00, with 12 accidents, and the fewest accidents were between 04:00–08:00 with 5 accidents. As for the 15 motorcycle accidents, which were the second most accident-prone vehicle type, according to the days, it was observed that the most accidents were on Thursday, with 4 accidents, and they had no accidents on Sundays. Regarding the accident hours, the most accidents were between 16:00 and 20:00, with 6 accidents, and no accidents were between 04:00 and 08:00. Examining the accidents of the pickup trucks by the days of the weeks, it was found that their most accidents were on Thursday, with 3 accidents, and they had no accidents on Tuesday and Sunday. Considering the accident hours, while the pickup trucks mostly had accidents between 04:00–08:00 and 12:00–16:00, with 3 accidents, they had no accident between 20:00–24:00 and 00:00–04:00. Finally, the buses shared their six accidents equally on all days except Friday. According to the accident hours, it was seen that while they had the most accidents between 04:00–08:00 with 3, they had no accidents between 20:00–24:00 and 00:00–04:00.
Analyzing 61 accidents between 2010–2017 on İstinye Bayırı street according to the accident types showed that the most accidents occurred as side collisions, with 29 accidents, followed by pedestrian accidents with 12.
When examining the accidents on İstinye Bayırı Street according to accident hours, the highest number was seen between 12:00–16:00, with 25 accidents, and the fewest accidents were between 04:00–08:00, with 2 accidents. Analyzing these accidents by the roads geometrical horizontal condition showed that while 54 accidents were on the straight road, 7 accidents were on the winding road. According to the road geometric vertical condition, 52 accidents were on the level road, 8 accidents occurred on the sloping road way, and 1 accident occurred on the dangerous sloping one. Regarding the road geometric intersection status, there were no intersections in 60 accidents. The analysis according to the roads geometric crossing status showed no pedestrian crossing in 56 accidents, while pedestrian crossings existed in 5 accidents. As for the traffic lines, there were proper road lines in 51 accidents, and the traffic road lines were in a disrupted situation in 10 accidents.
Analyzing the accidents on this street in terms of street lightings showed that there was lighting in 53 accidents, no lighting in 7 accidents, and there was broken lighting in 1 accident. Finally, according to road type, it was seen that 25 accidents occurred on two-way roads, and 21 accidents occurred on divided roadways.
When respecting the most accident-prone vehicles in terms of the number of accidents on this street, it was seen that automobiles had 50 accidents, motorcycles had 29, pickup trucks had 8, and buses had 1 accident. Examination of the 50 automobile accidents showed that the most accidents were on Monday with 14 accidents, and the fewest were on Wednesday, Thursday, and Friday, with five accidents. The automobiles mostly had the accidents on this street between 12:00–16:00, with 19 accidents, and the fewest accidents were between 04:00–08:00 with 1 accident. When considering the 29 accidents of motorcycles, which were the second most accident-prone vehicle type, according to the days, the most accidents were on Monday and Wednesday, with five accidents, and the fewest accidents were on Sunday, with 3 accidents. Investigation of the motorcycle accidents on this street according to accident hours showed the most accidents were between 12:00–16:00, with 12 accidents, and the fewest accidents were between 20:00–24:00 and 04:00–08:00, with 1 accident. Pickup trucks had the most accidents on Monday with 3 accidents, and they had no accidents on Tuesdays and Saturdays. Pickup trucks had the most accidents between 12:00 and 16:00 with 4 accidents and there were no accidents between 00:00–04:00 and 16:00–20:00. Finally, the buses had a total of 1 accident between 12:00 and 16:00 on Saturday.

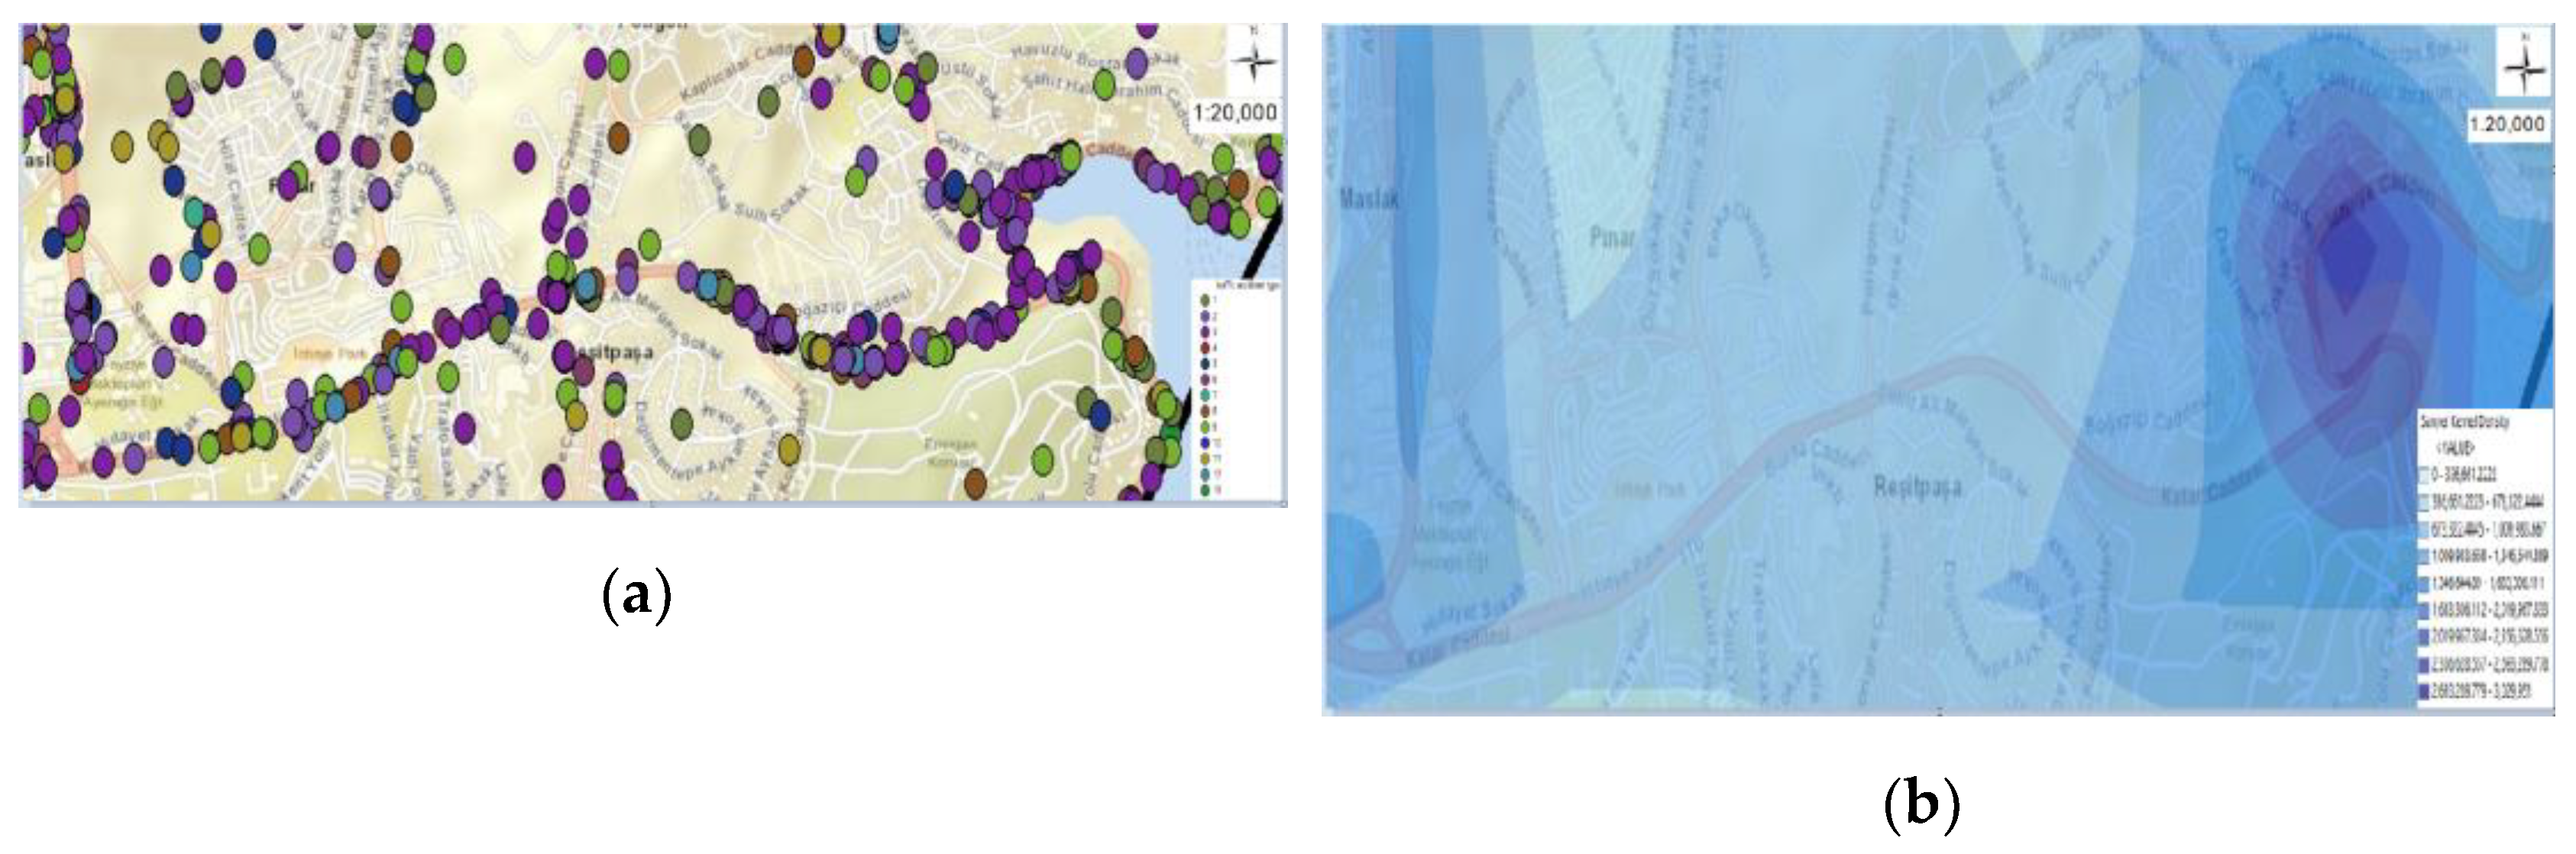
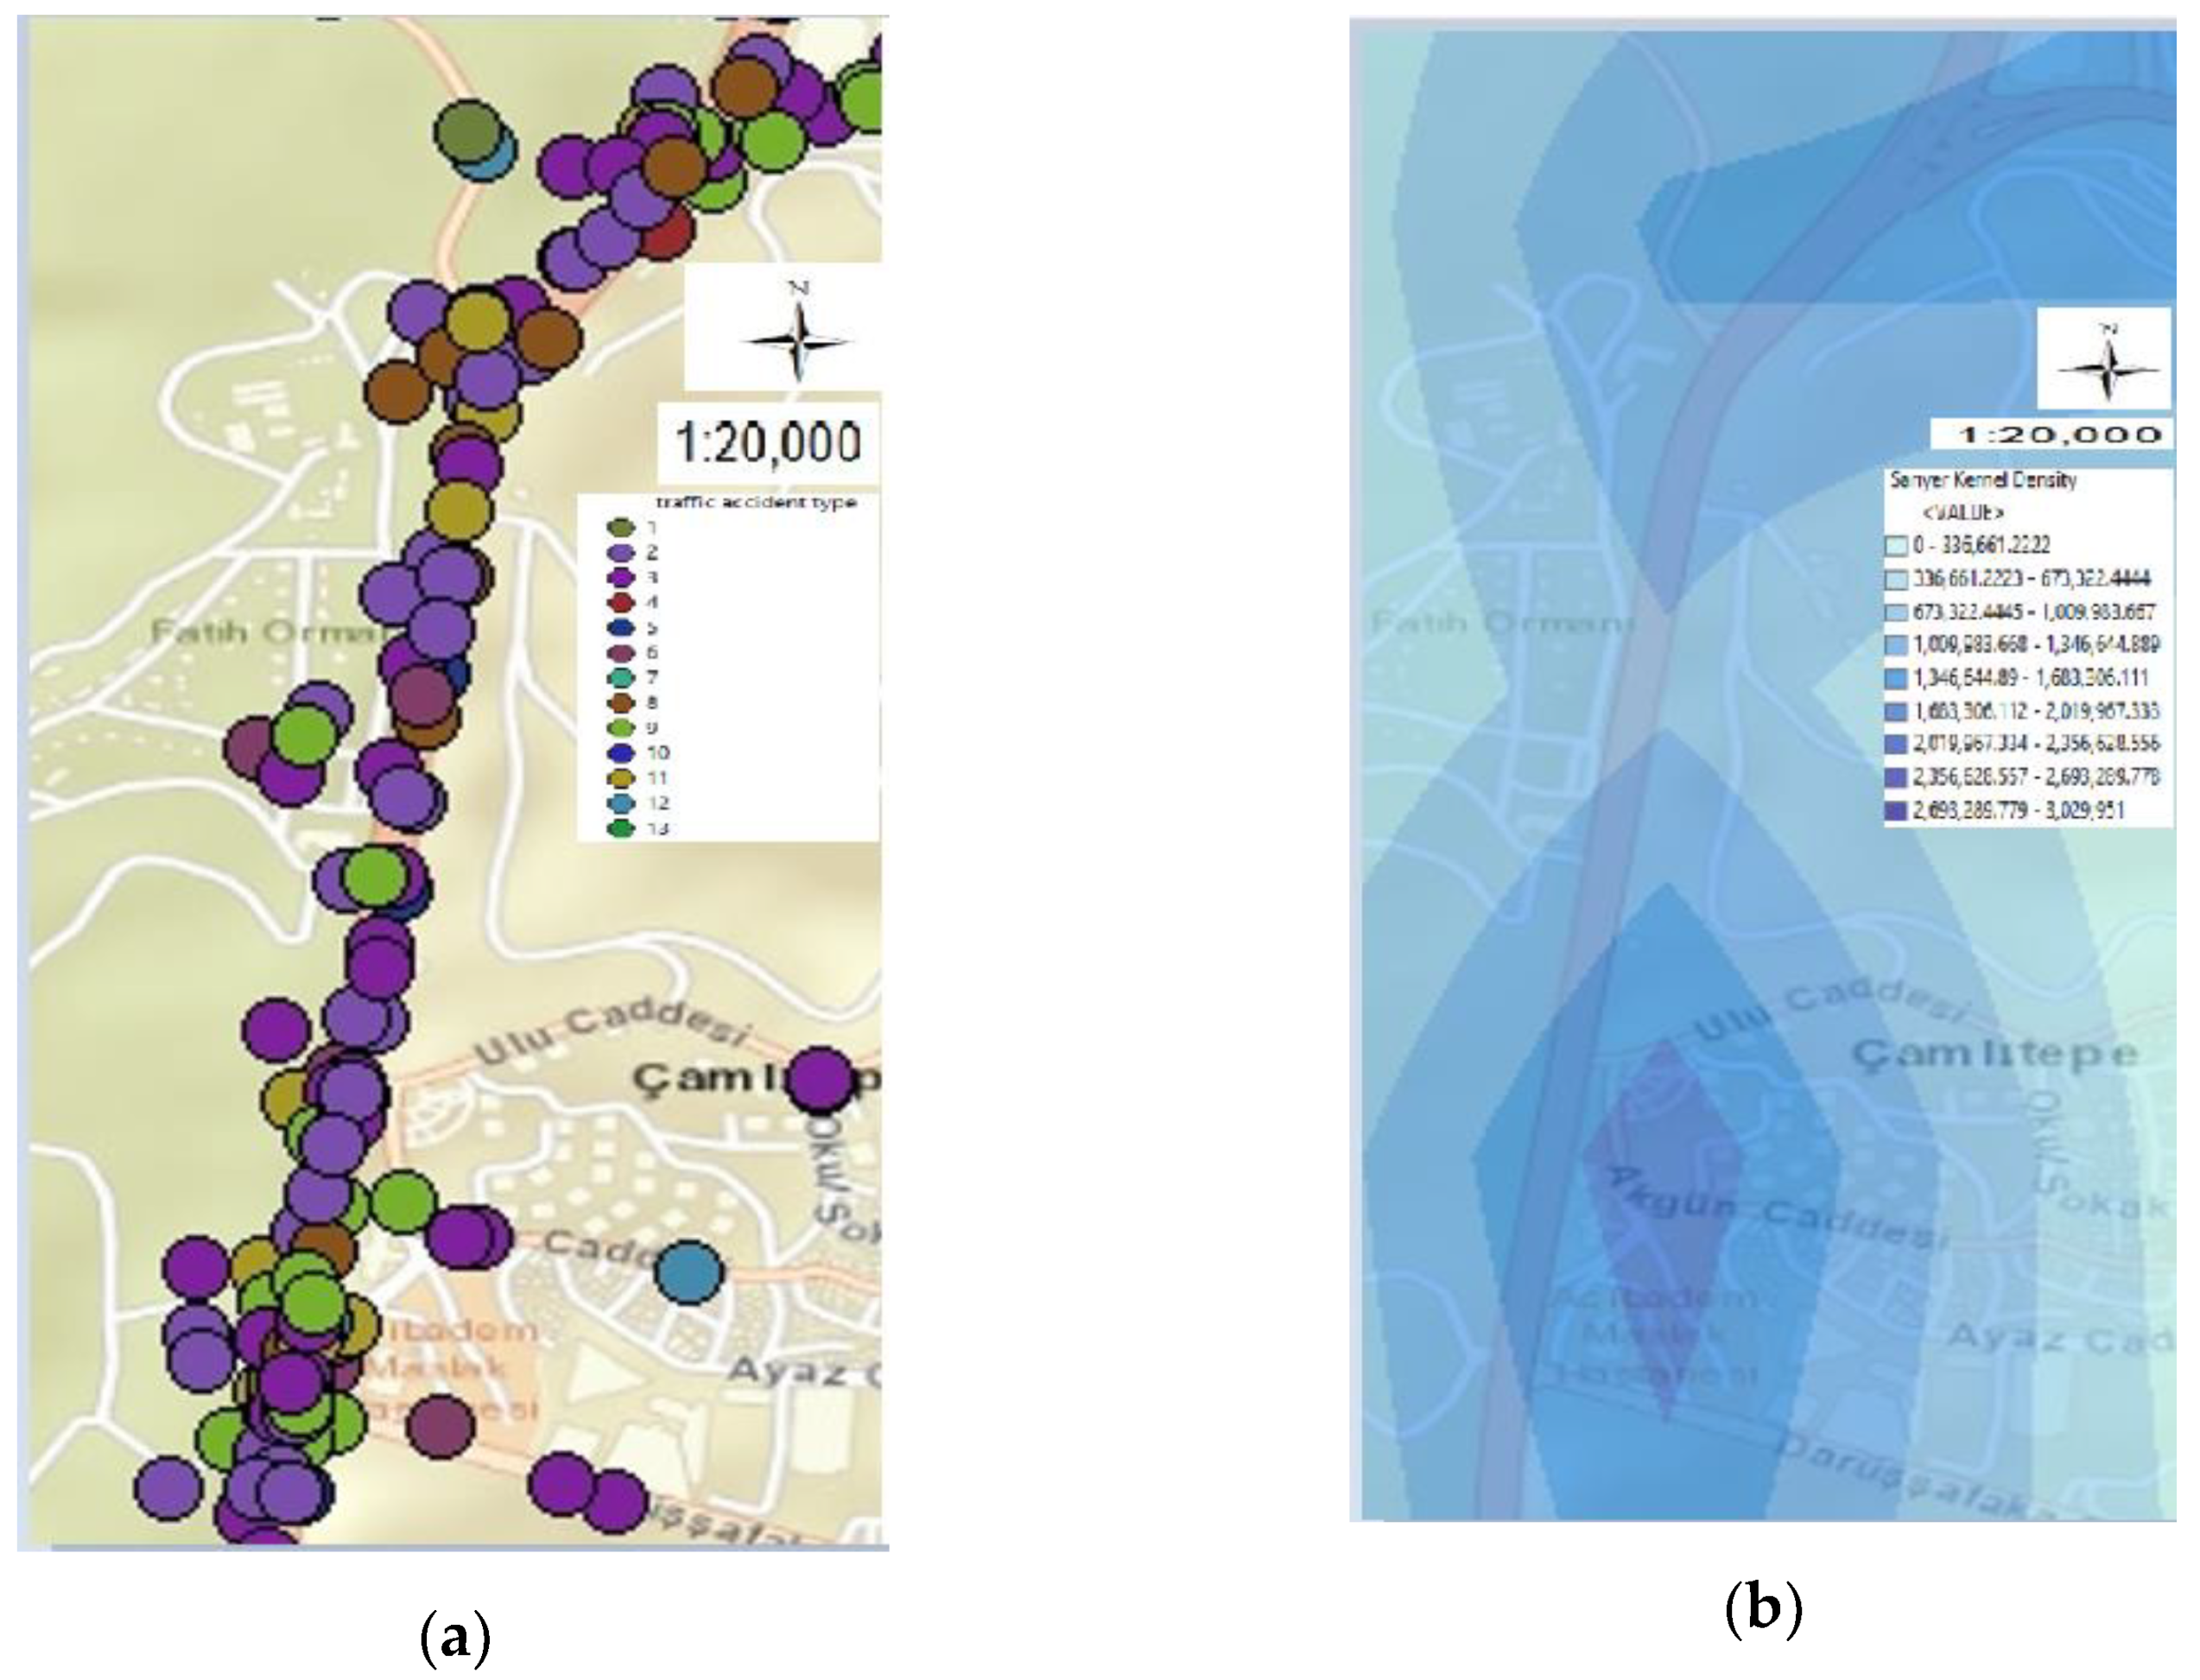
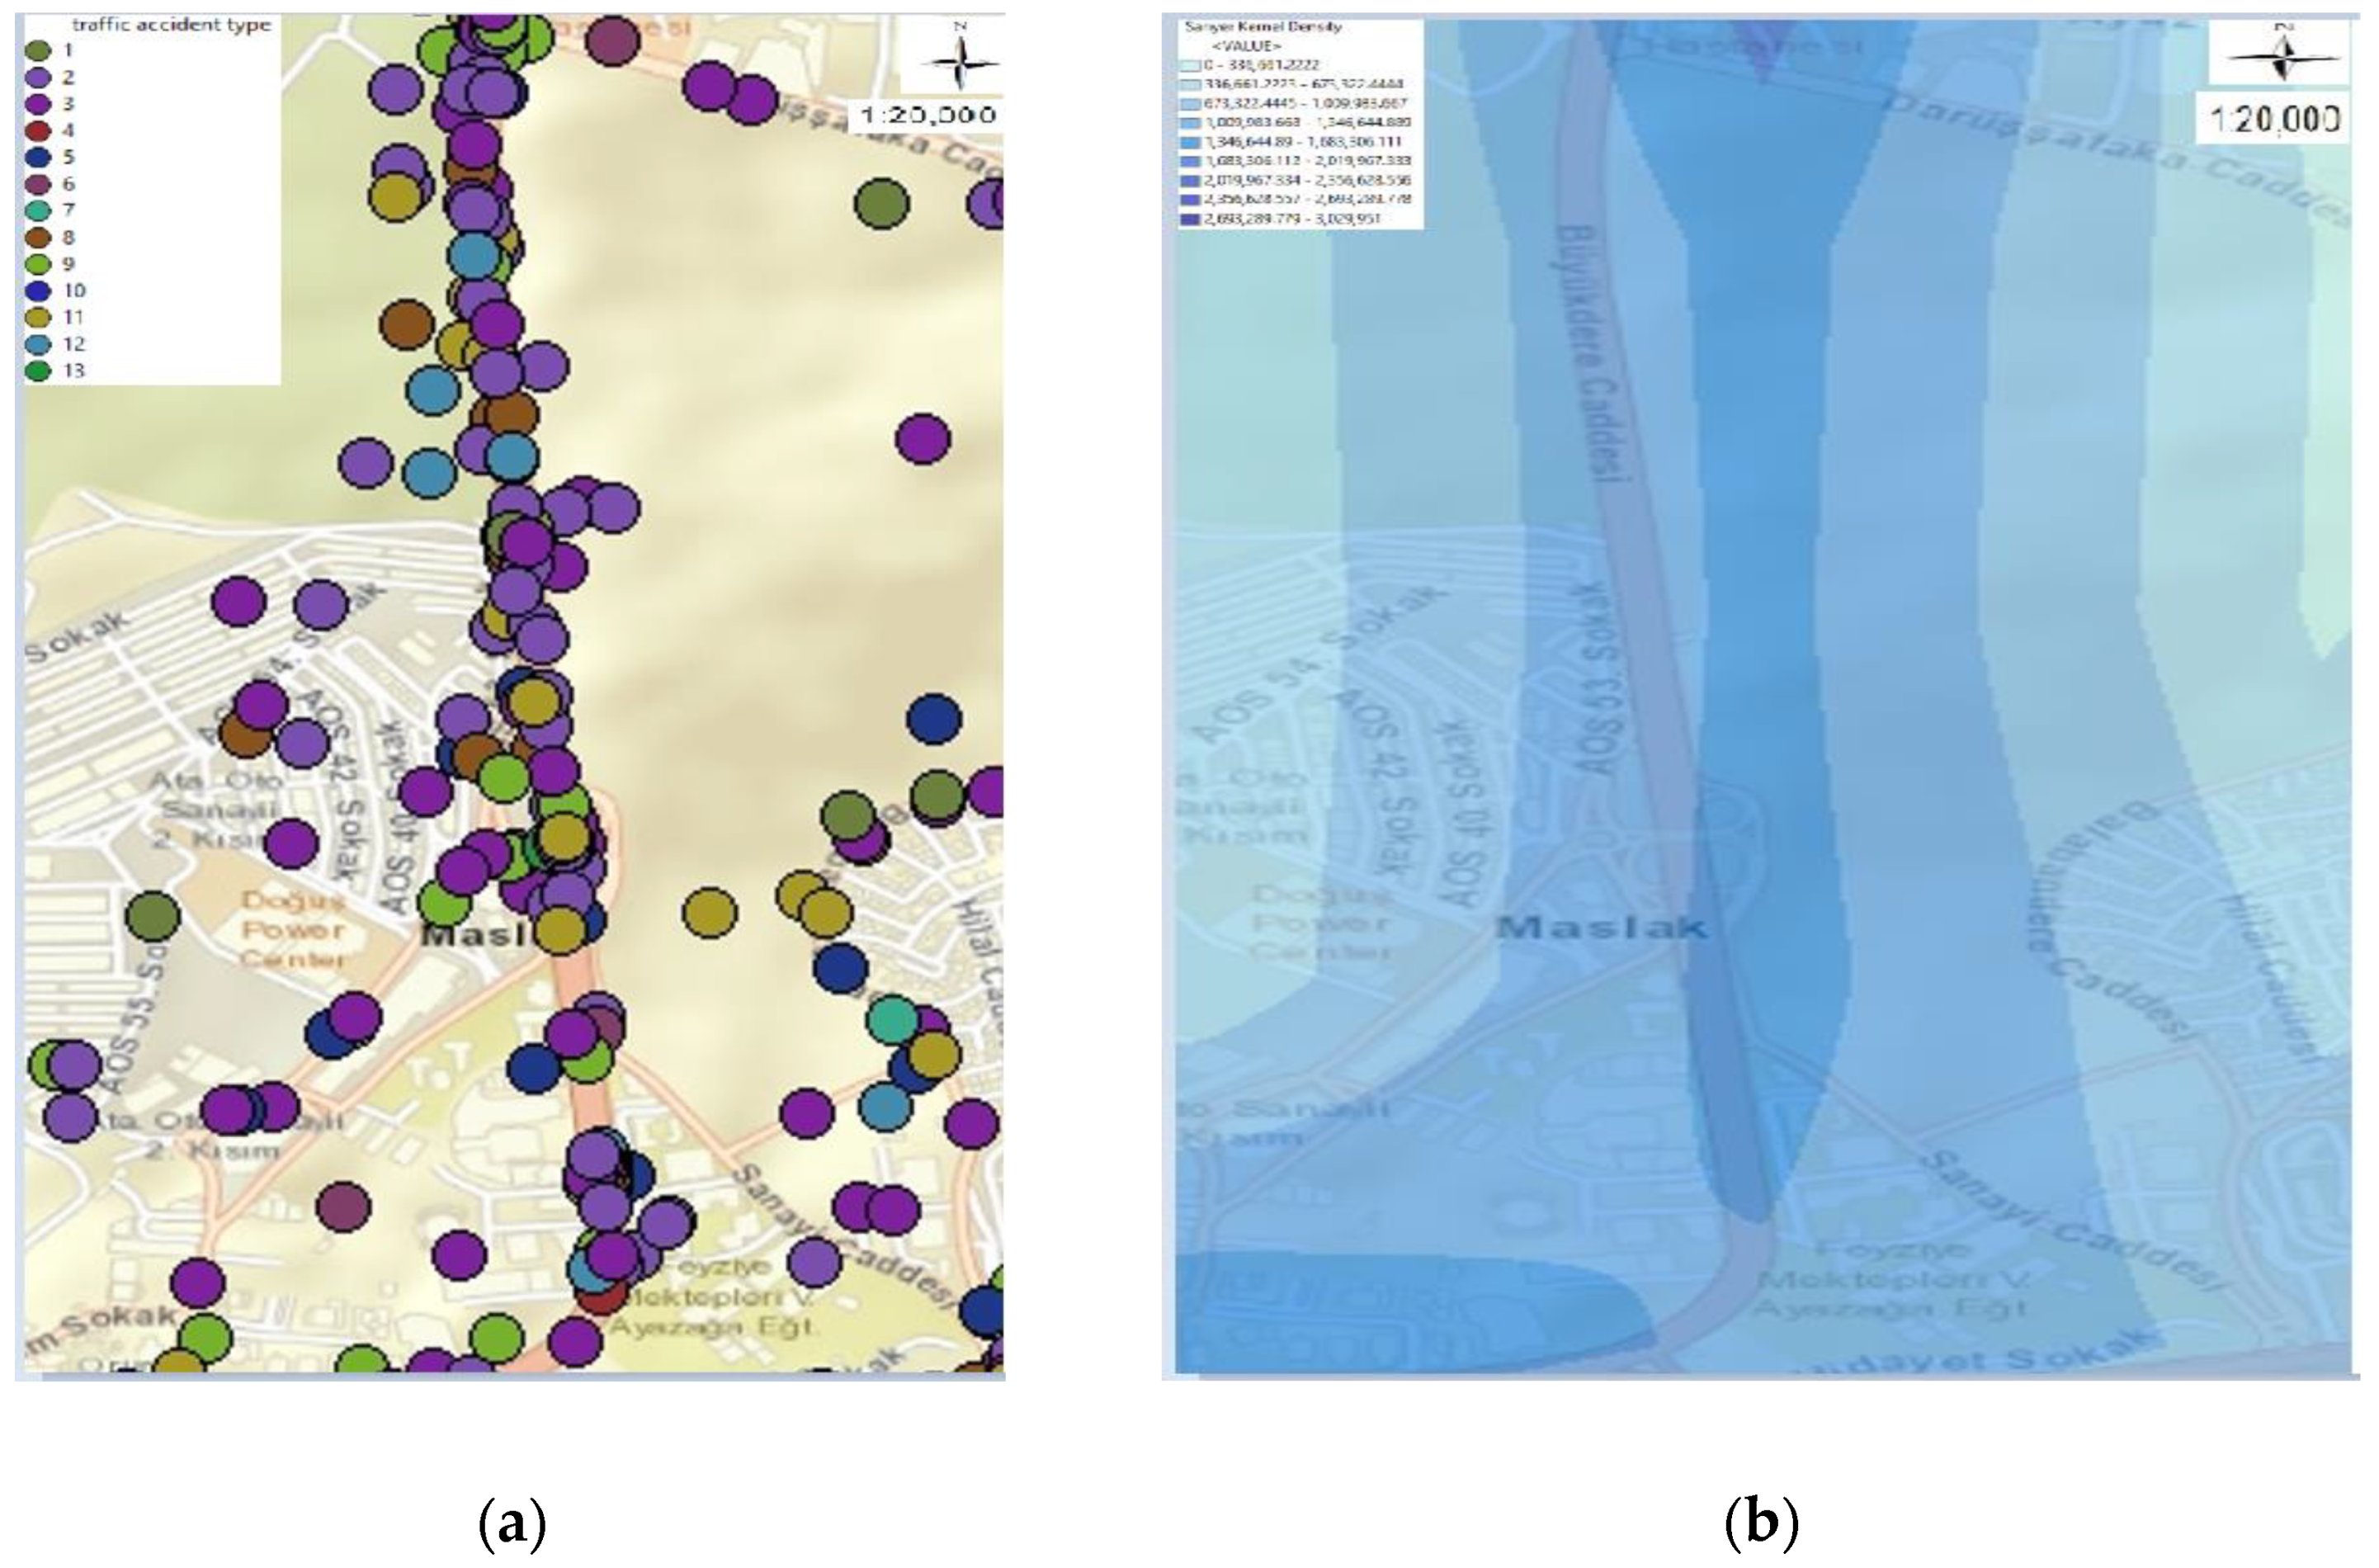
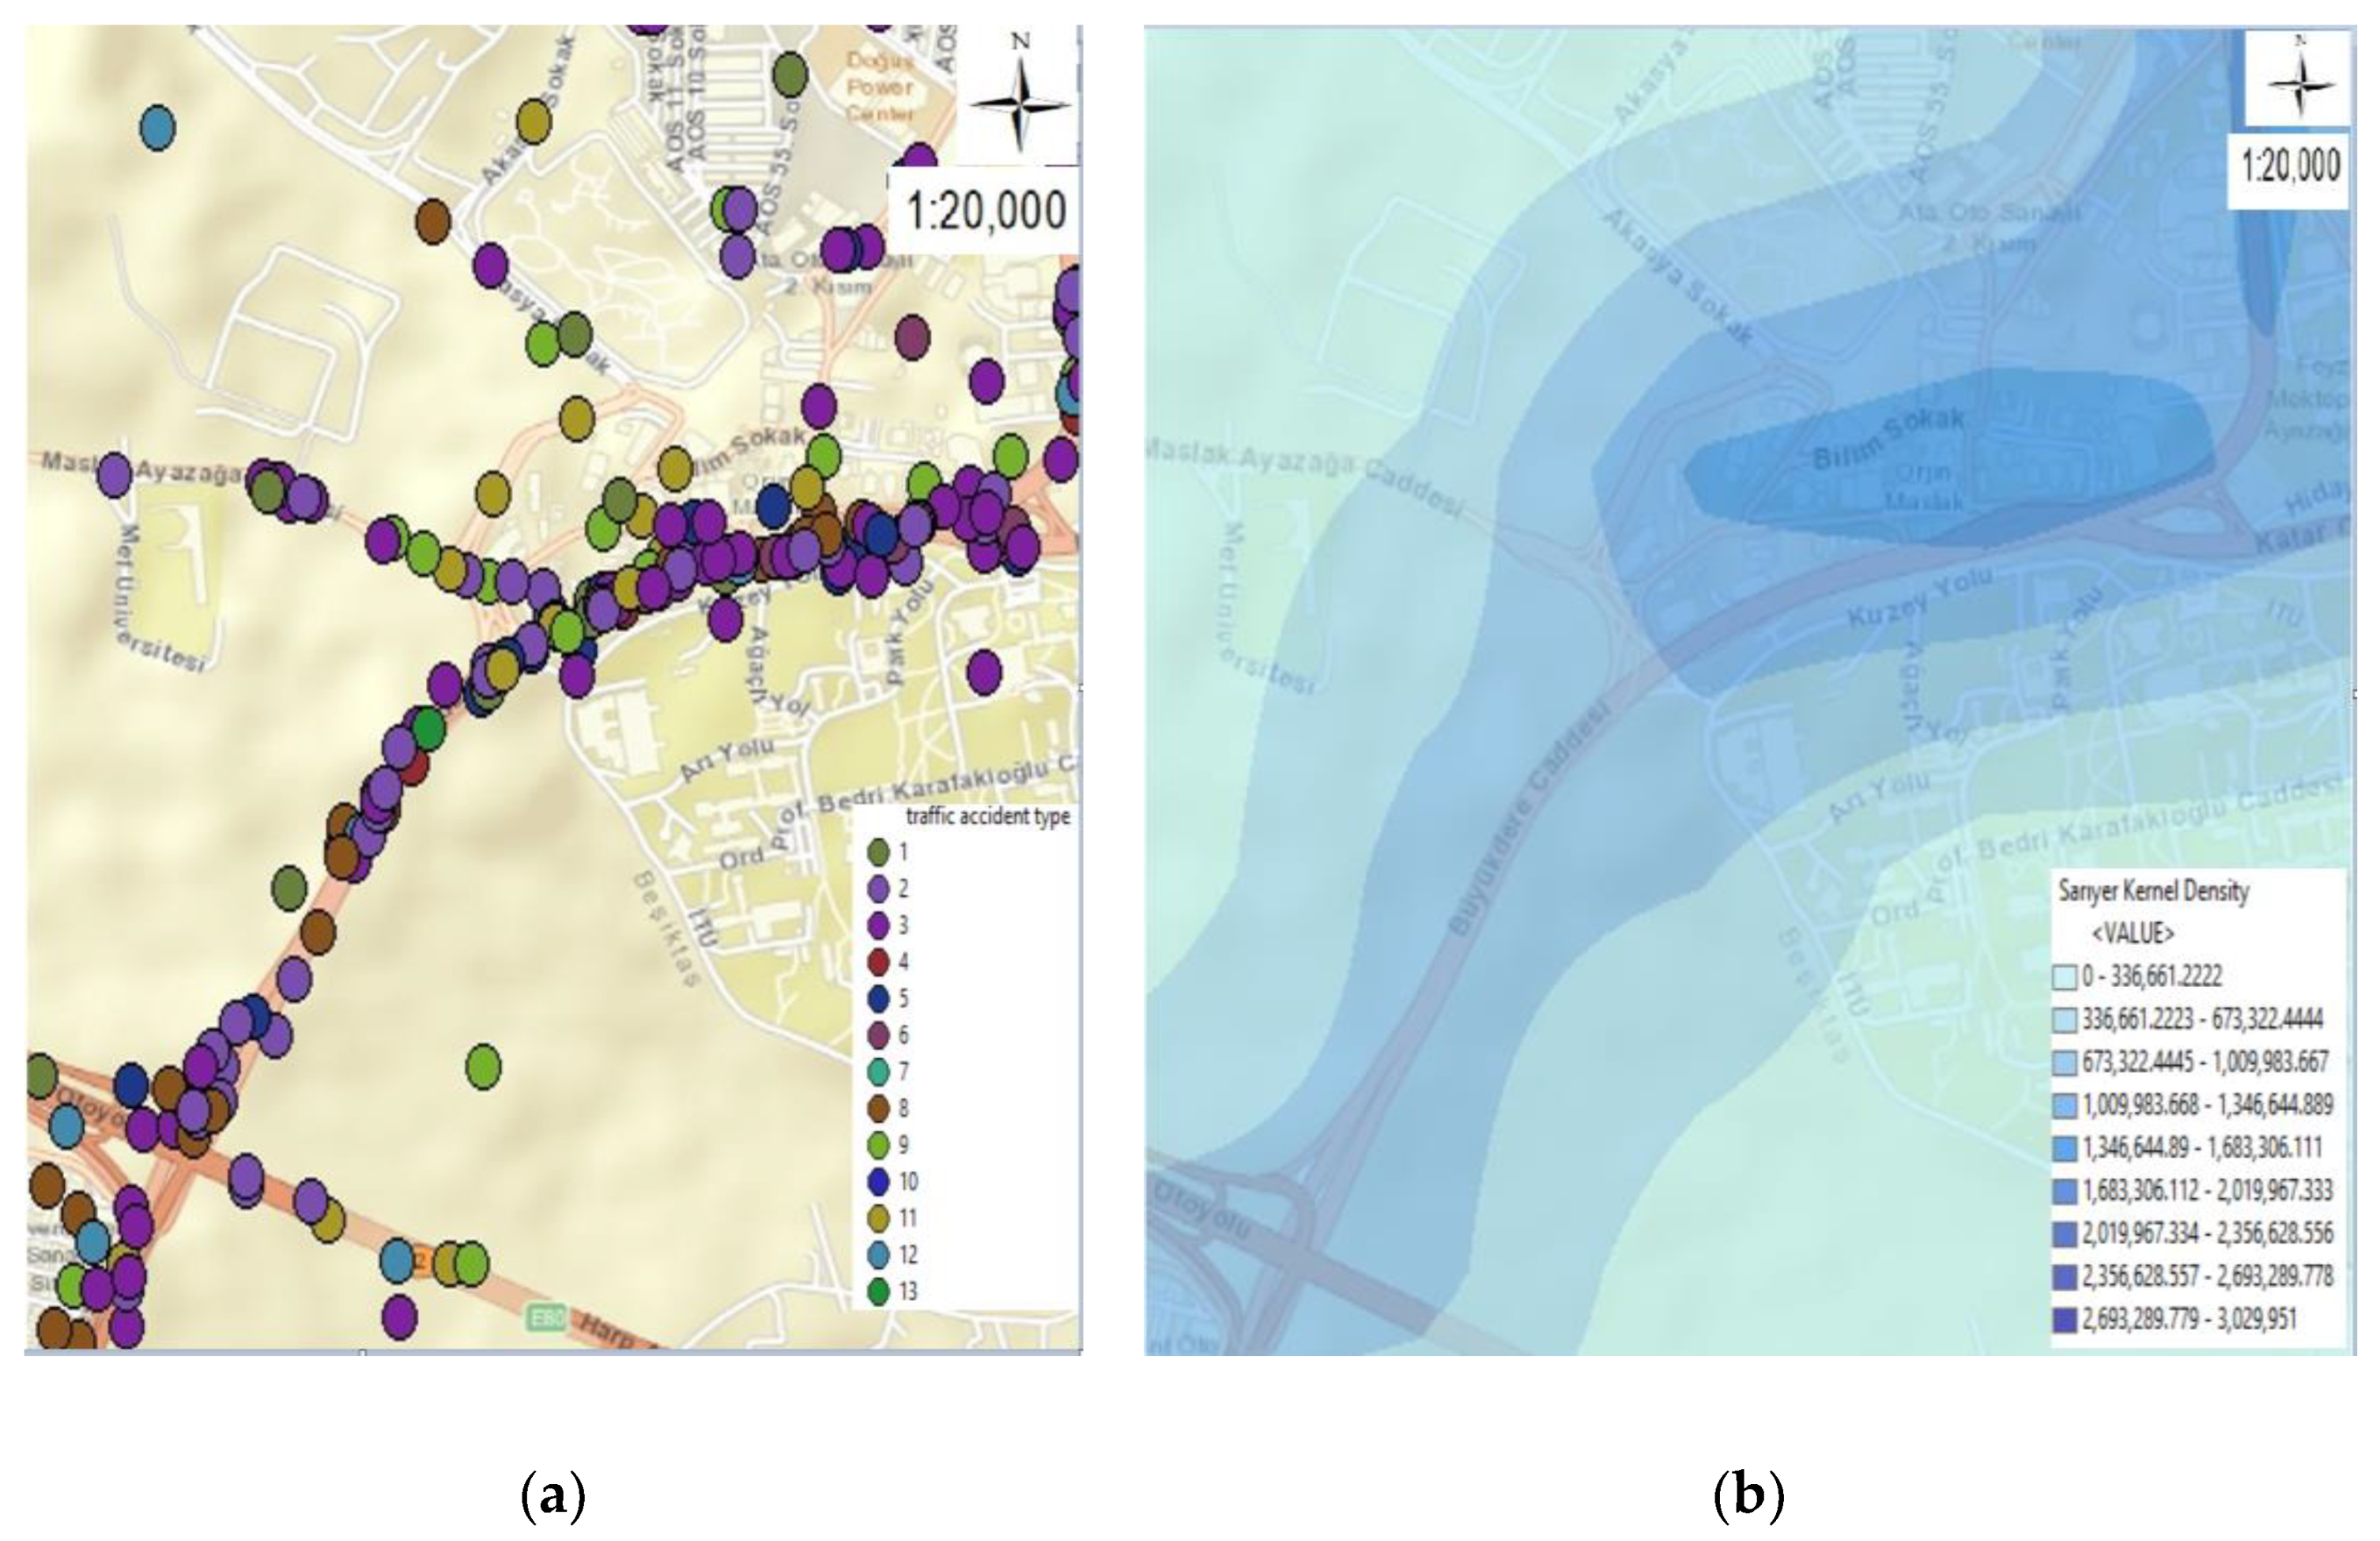
3.6.4. Zone 4: Büyükdere Street

Figure 17 shows the accidents on Büyükdere Street divided into three zones.
Figure 18 shows the maps of Büyükdere Street 1st region. Figure 18a shows the thematic accident map according to the type of accident, and Figure 18b shows the Kernel Density map. Thus, the accident density of the 1st district of Büyükdere Street, which is not clearly understandable on all maps, becomes better comprehensible with the separated maps.
The accident density was high at the Acıbadem Maslak Hospital point in the 1st region of Büyükdere Street. Speed-reducing bumps and warning signs indicating the hospital nearby can be placed here to prevent accidents.
Figure 19 shows the maps of Büyükdere Street 2nd region. Figure 19a shows the thematic accident map according to the type of accident, and Figure 19b shows the Kernel Density map. Thus, the accident density of the 2nd region of Büyükdere Street, which was not clearly understandable on all maps, became better comprehensible with the separated maps.
The accidents were observed to be intense on the road turning to Maslak in the 2nd region of Büyükdere Street. Since this point is the connection to Büyükdere Street, where the traffic is quite active, placing warnings that make drivers more careful will play a crucial role in reducing accidents.
Figure 20 shows the maps of Büyükdere Street 3rd region. Figure 20a shows the thematic accident map according to the type of accident, and Figure 20b shows the Kernel Density map. Thus, a better comprehension of the 3rd region of Büyükdere Street, where the intensity of the accidents was not clearly understandable on all maps, was provided with the separated maps.
The accidents were seen to be intense at the Ayazağa intersection in the 3rd region of Büyükdere Street. The high number of accidents at this intersection can stem from incorrect and late routing, lack of electronic signage, and lack of middle barriers.
When analyzing the 428 accidents between 2010–2017 in the part of Büyükdere Street in Sarıyer district according to the accident types, the most accidents were rear-end collisions with 132 accidents, followed by side-impact accidents with 102 accidents. The fewest accident were multiple accidents. The highest number of accidents occurred between 16:00–20:00, with 90, and the minimum number of accidents was between 04:00–08:00 with 45 accidents. Examination of the geometric horizontal state of the road showed that 370 accidents occurred on straight roads and 54 accidents occurred on winding roads. When examining the road geometric vertical condition, 365 accidents were on non-sloping roadways, and 61 accidents were on sloping ones. The analysis of these accidents by the road geometric intersection situation showed that there were no intersections in 365 accidents. According to the road geometric pedestrian crossings, there were no pedestrian crossings in 356 accidents. On the other hand, in 71 accidents, there were pedestrian crossings. When we examine the traffic line situation, there were traffic lines in 396 accidents, while traffic lines were broken-down in 32 accidents.
When examined, lighting existed in 376 accidents, while there was no lighting in 43 accidents. In the check of traffic lamps, no traffic lamp was seen in 247 accidents, while traffic lights were present in 155 accidents. Finally, in terms of the type of road, it was observed that while 252 accidents occurred on divided roadways, 129 accidents on two-way roads, and 47 accidents on one-way roads.
When respected the most accident-prone vehicles in terms of the number of accidents on this street, it was seen that automobiles had 336 accidents, motorcycles had 97, pickup trucks had 76, and buses 34 had accidents.
When investigating the 336 automobile accidents by the days of the week, the most accidents were on Sunday with 64 accidents, and the fewest accidents were on Thursday with 40 accidents. The most accident-prone times of the automobiles in this street was between 12:00–16:00 and 16:00–20:00, with 67 accidents, and the minimum accidents were between 04:00–08:00 with 31. Motorcycles, the second most accident-prone vehicle, had 97 accidents. The most accidents were on Friday, with 17 accidents, and the fewest accidents were on Saturday, with 8 accidents. When investigated, the motorcycle accidents on this street were most between 16:00–20:00, with 28 accidents, and had the fewest accidents between 04:00–08:00, with 3 accidents. Pickup trucks were mostly involved in the accidents on Tuesdays, with 16 accidents, and crashed on Thursdays minimum, with 7 accidents. The analysis according to accident hours showed that the pickup trucks mostly crashed between 08:00–12:00, with 16 accidents, and collided fewest between 04:00–08:00, with nine accidents. Finally, the buses had 34 accidents; Wednesdays had the most, with 9; Saturdays and Sundays had the fewest, with 2 accidents. The most bus accidents were 12 between 16:00–20:00, and the fewest were two accidents between 00:00–04:00.
This study first examined the streets with the highest number of accidents and next whether the days of the week, accident hours, and vehicle types affected the accident intensities.
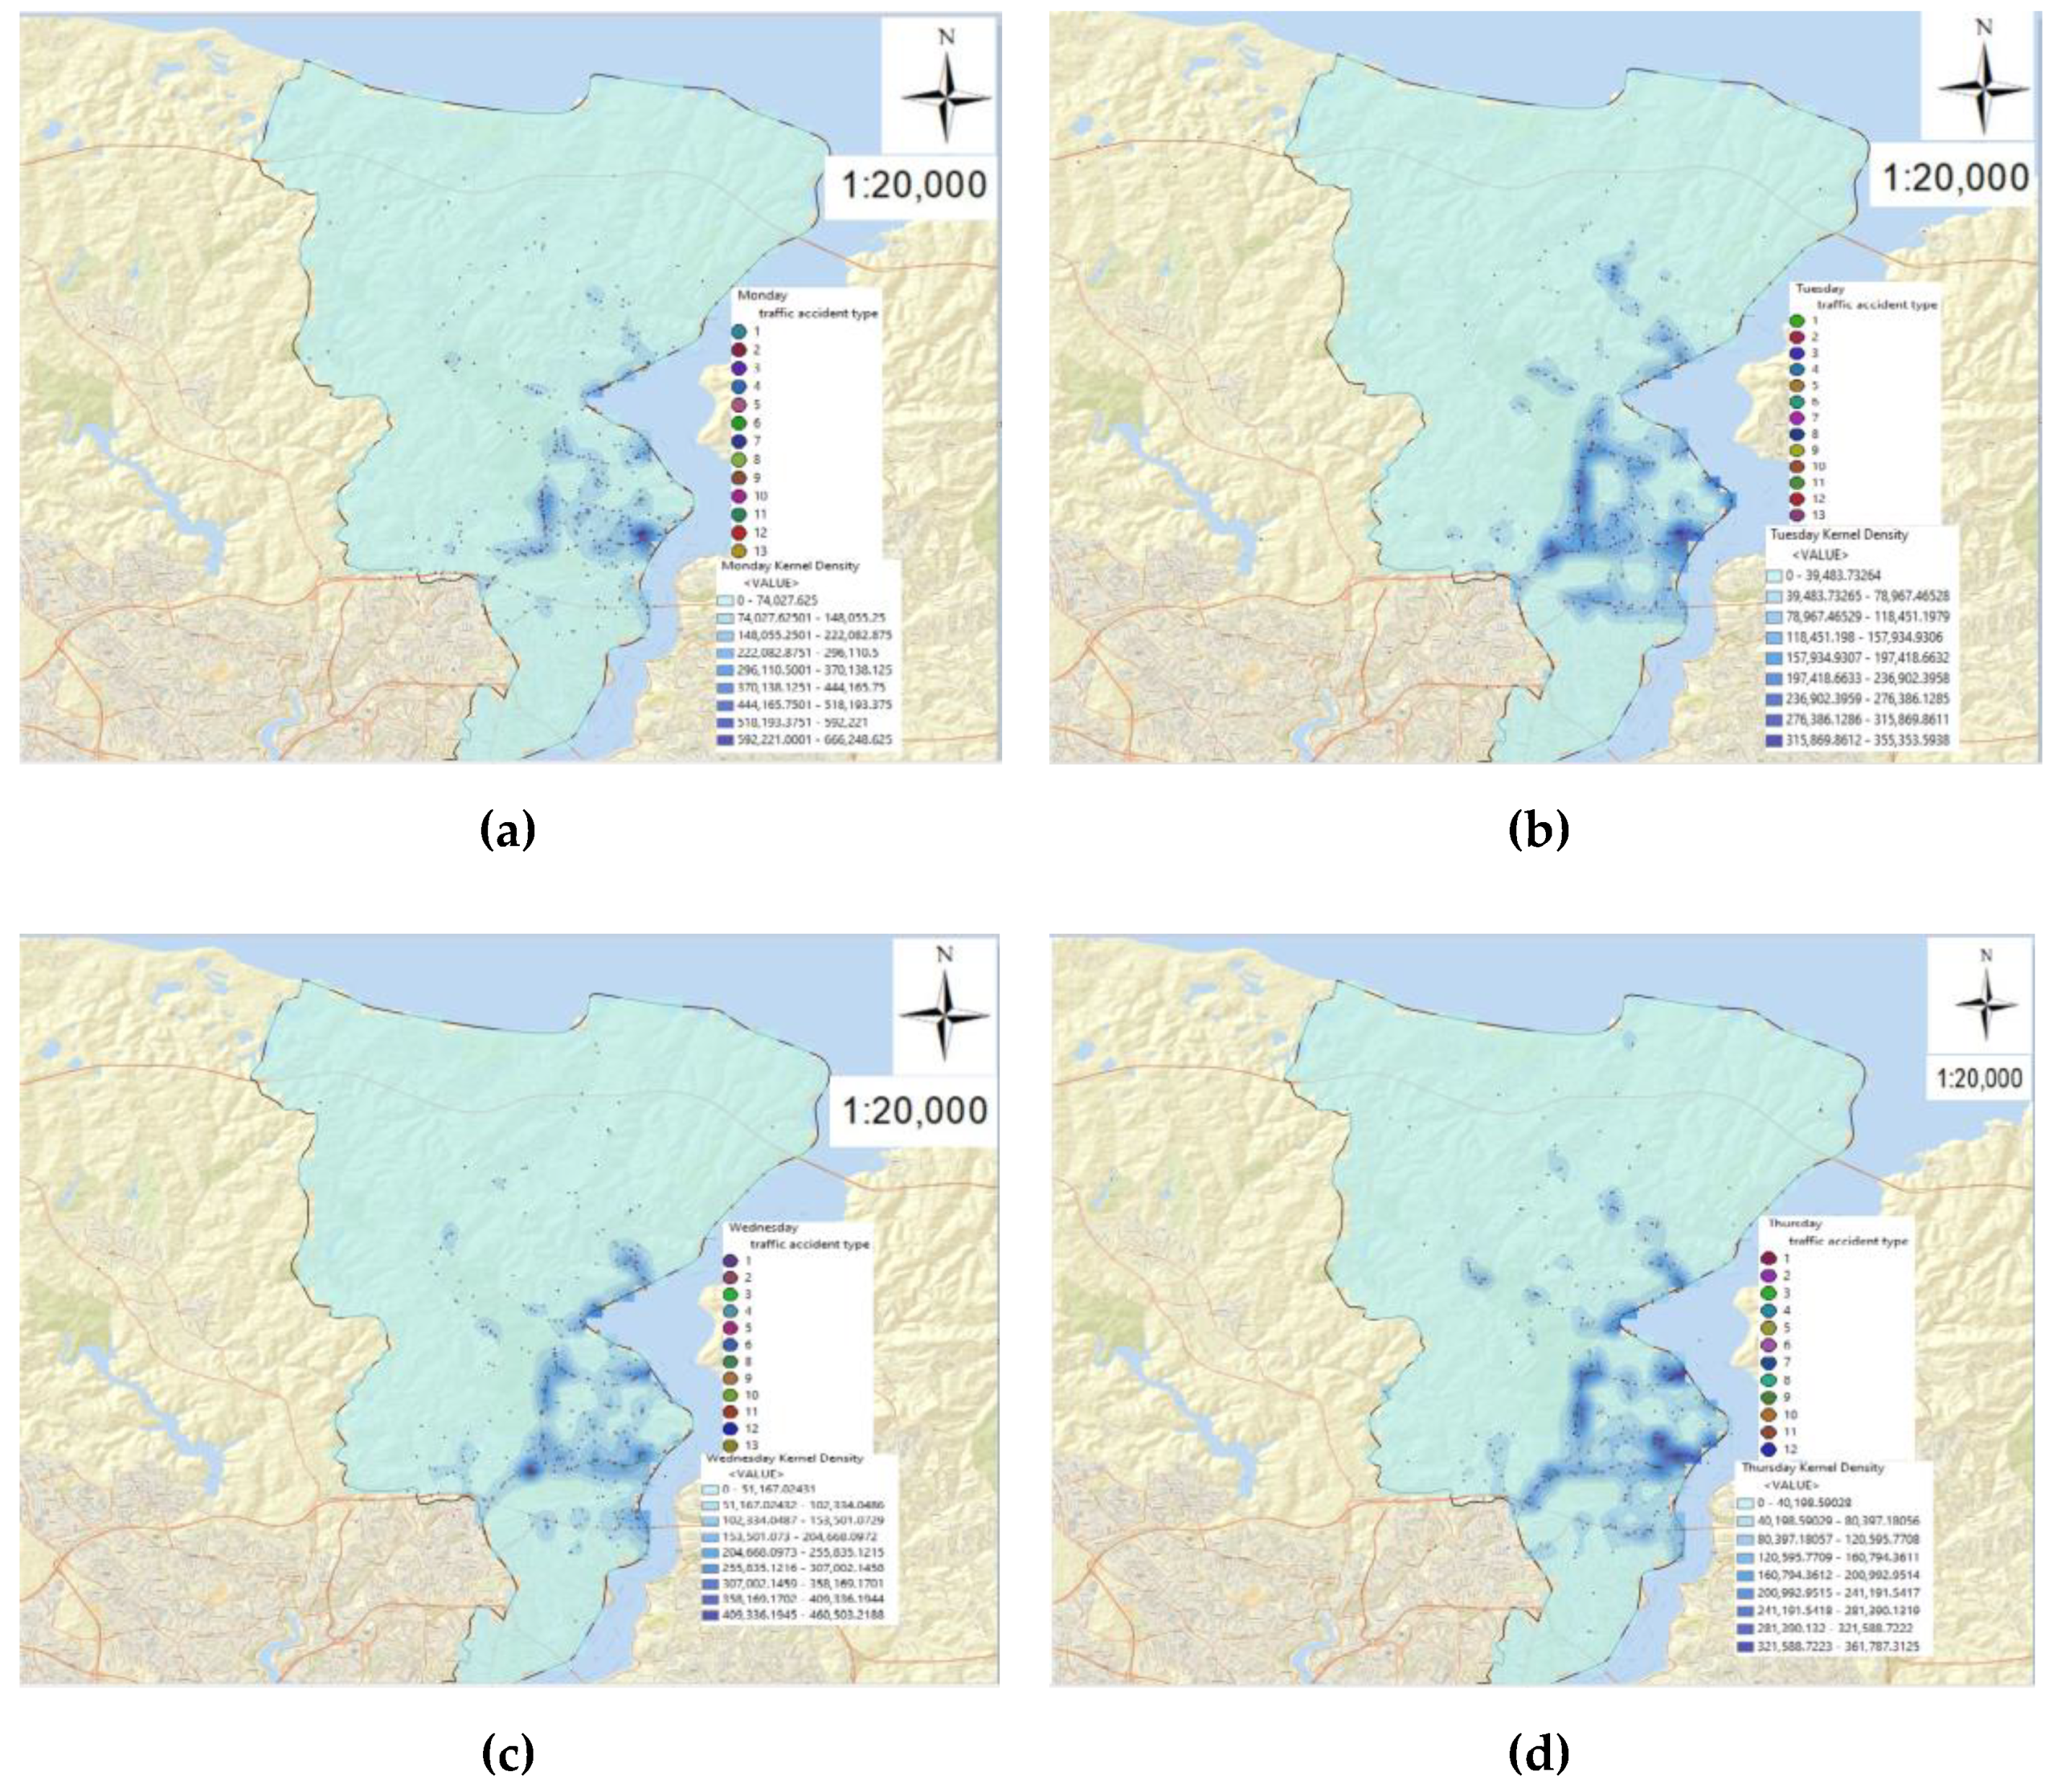
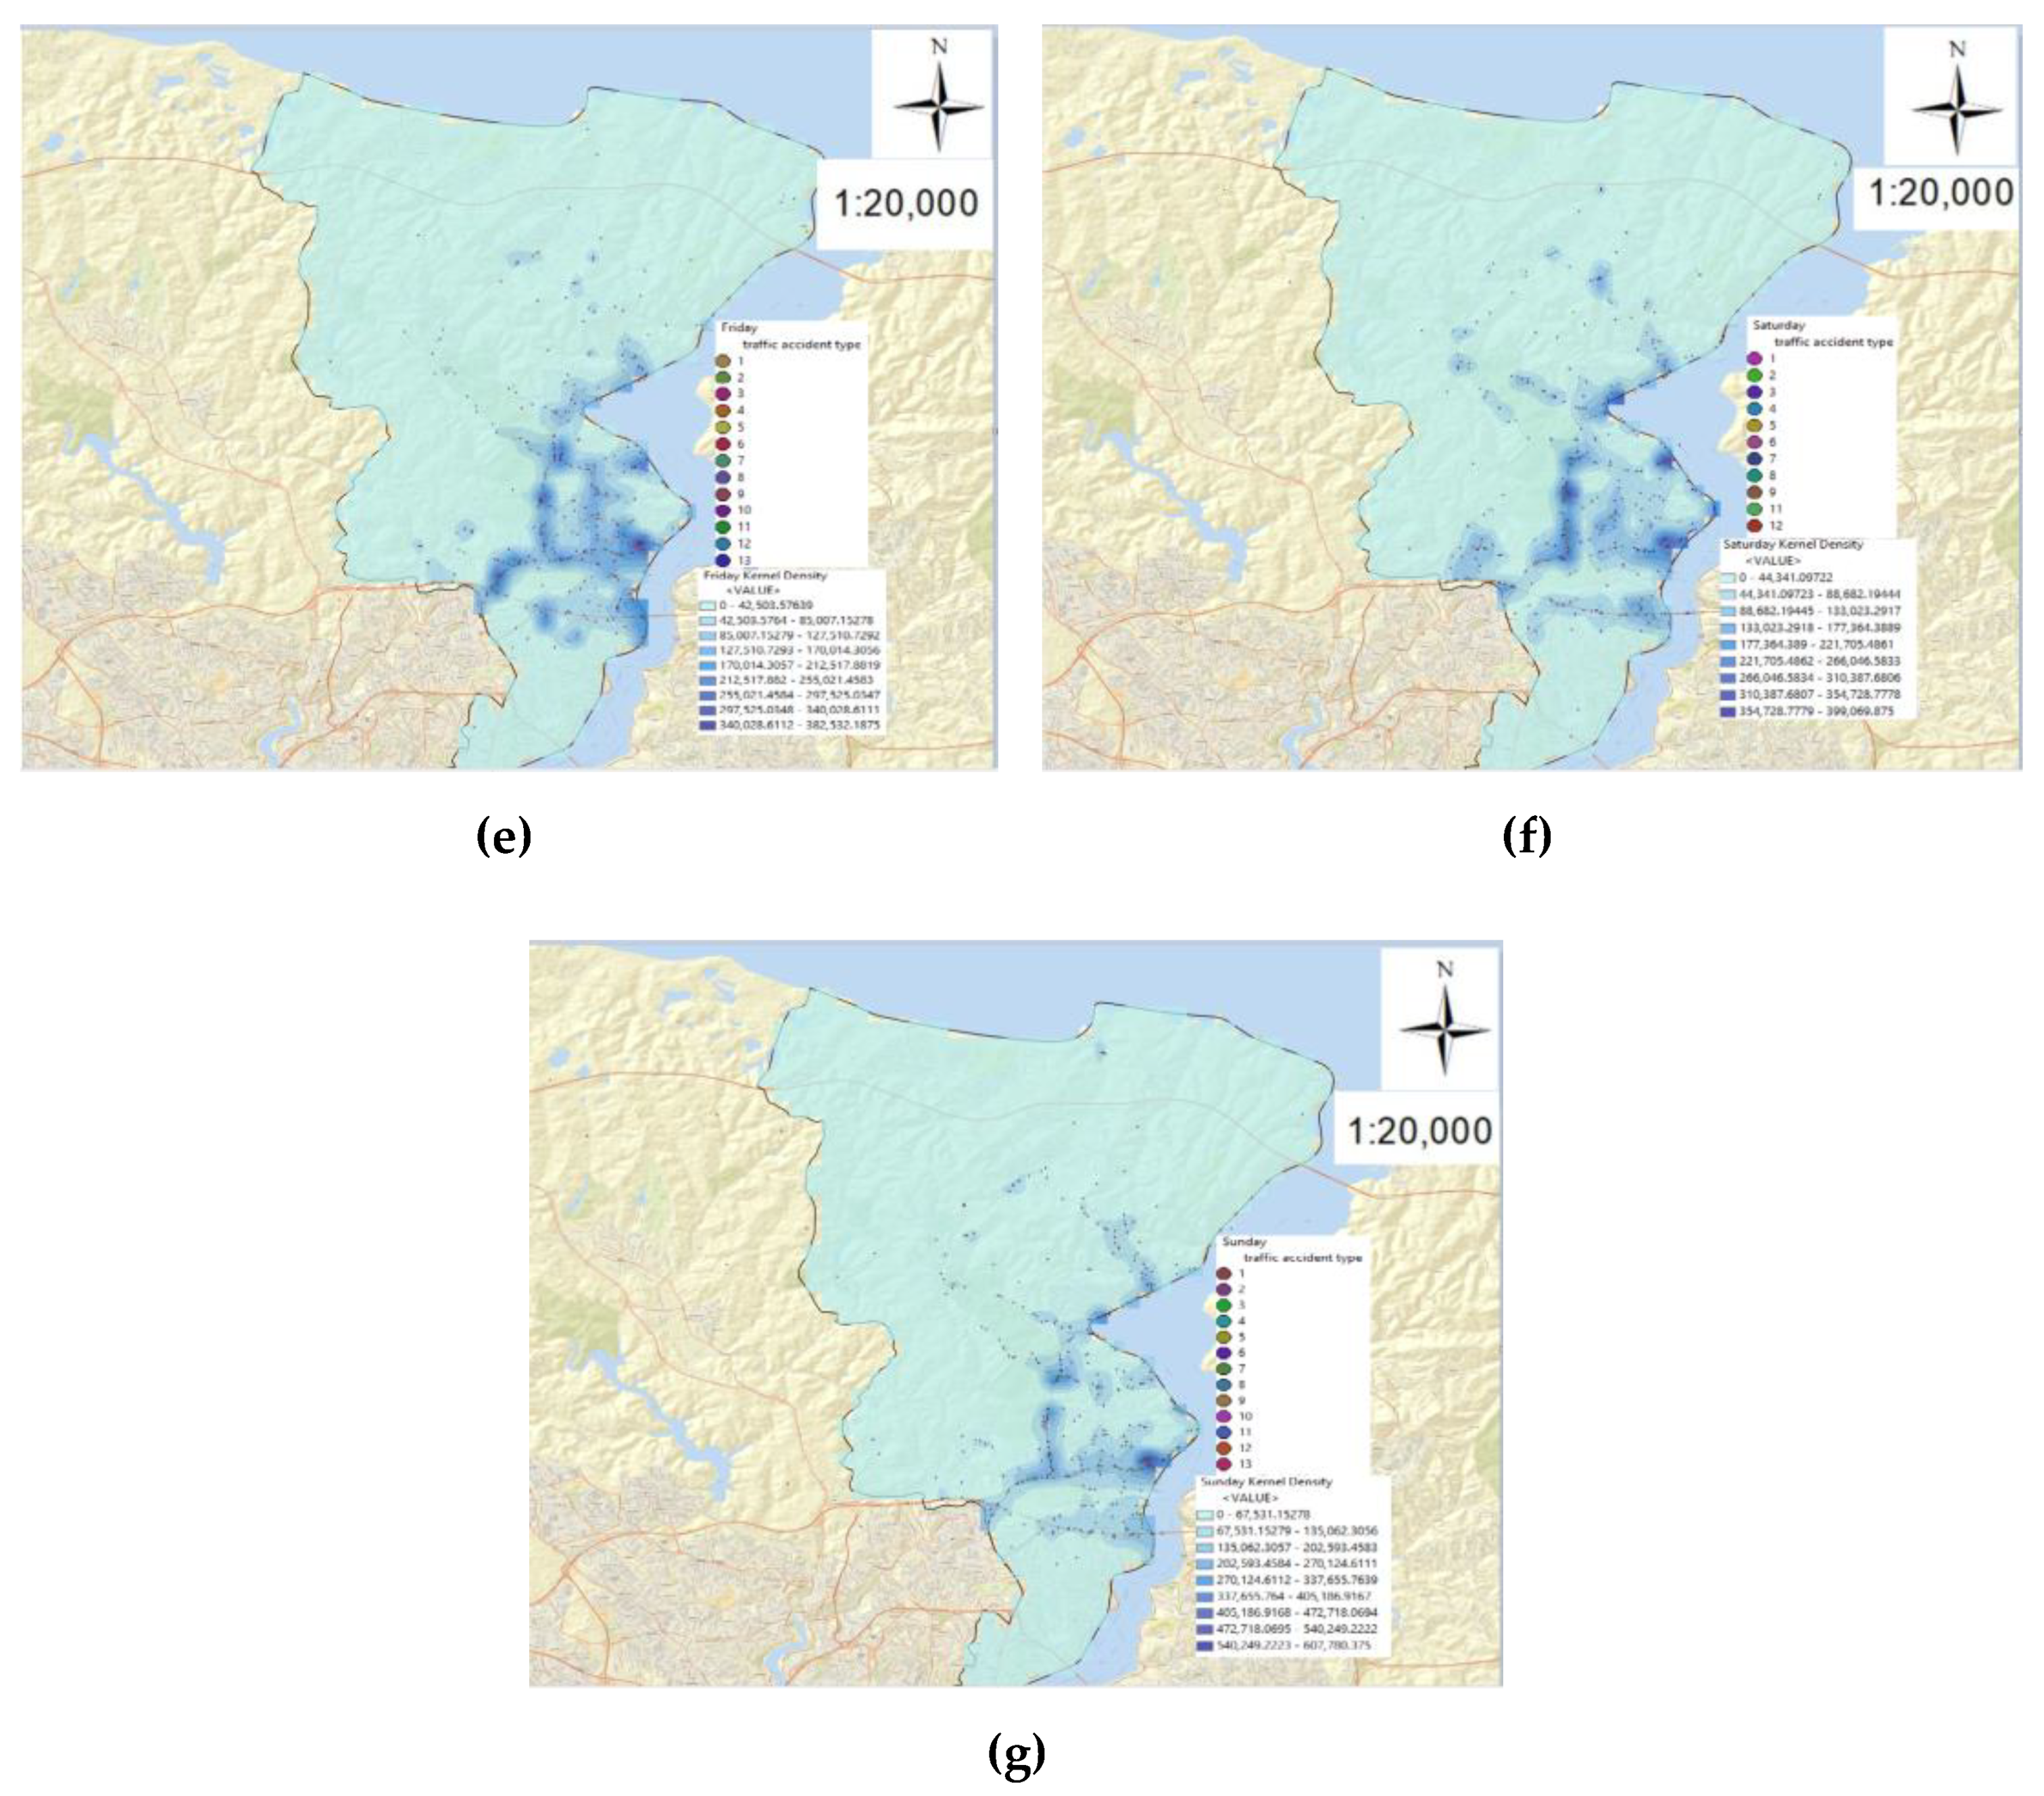
Figure 21 gives the Kernel Density maps obtained according to the days of the week, respectively.
The accident types in the accident hotspots were analyzed by integrating the accident types in Table 7 and Kernel Density maps. Traffic accident type label color representations have been changed on some days due to the fact that the colors cannot be seen clearly due to the differences in the locations of the accidents. In addition, since only 12 traffic accident types occurred on Thursday and Saturday, the first 12 traffic accident types in Table 7 were given by the ArcGIS software. It was observed that there was no 7th accident type in the accidents on Wednesday. Thus, it was also examined which accident type was more common in places where accidents were intense according to the days of the week. The Kernel Density map in Figure 21a shows that the Monday accidents were concentrated on İstinye Bayırı, Büyükdere, Haydar Aliyev, Demokrasi Şehitleri, and Tarabya Bayırı Streets. While the accident numbers of rear-end collisions and side-impacts were higher on Büyükdere, Haydar Aliyev, Demokrasi Şehitleri, and Tarabya Bayırı Streets, hitting pedestrians was higher on İstinye Bayırı Street. The Kernel Density map in Figure 21b shows that Tuesday accidents were concentrated on Büyükdere, İstinye Bayırı, Tarabya Bayırı, Hacı Osman Bayırı, Sakıp Sabancı, and Köybaşı Streets. While rear-end and side-impact accidents were high on these streets on Tuesday, colliding with a fixed object on Büyükdere and Hacı Osman Bayırı Streets were also significantly frequent on Tuesday. The Kernel Density map in Figure 21c shows that Wednesday accidents were concentrated on Tarabya Bayırı, İstinye Bayırı, Katar, Büyükdere, Hacı Osman Bayırı, and Demokrasi Şehitleri Streets. Rear-end and side-impact collisions were high on these streets on Wednesday. Besides, hitting the pedestrian on Tarabya Bayırı Street was also quite frequent on Wednesday. The Kernel Density map in Figure 21d shows that the Thursday accidents were concentrated on Büyükdere, İstinye Bayırı, Tarabya Bayırı, Katar, and Sakıp Sabancı Streets. Rear-end impact, hitting pedestrian, side-impact, and fixed object collisions were high on Büyükdere Street. Hitting pedestrian accidents were higher on Tarabya Bayırı Street on Thursday. Rear-end and side-impact accidents were rather frequent on İstinye Bayırı, Katar, and Sakıp Sabancı Streets on Thursday. The Kernel Density map in Figure 21e shows that the Friday accidents were concentrated on Büyükdere, İstinye Bayırı, Tarabya Bayırı, Katar and Hacı Osman Bayırı Streets. Rear-end and side-impact accidents were more common on these streets on Friday. The Kernel Density map in Figure 21f shows that Saturday accidents were concentrated on Büyükdere, İstinye Bayırı, Tarabya Bayırı, Hacı Osman Bayırı, Haydar Aliyev, Kilyos, Baltalimanı, Sakıp Sabancı, and Hacı Osman Bayırı Streets. Rear-end and side-impact accidents on these streets were frequent on Saturday. Finally, the Kernel Density map in Figure 21g shows that the Sunday accidents were concentrated on Büyükdere, İstinye Bayırı, Tarabya Bayırı, Köybaşı, Kilyos, Haydar Aliyev, Bahçeköy Forest Road, and Baltalimanı Streets. Rear-end and side-to-side collisions were high on these streets on Sunday, while pedestrian collisions were also frequent on Büyükdere Street.
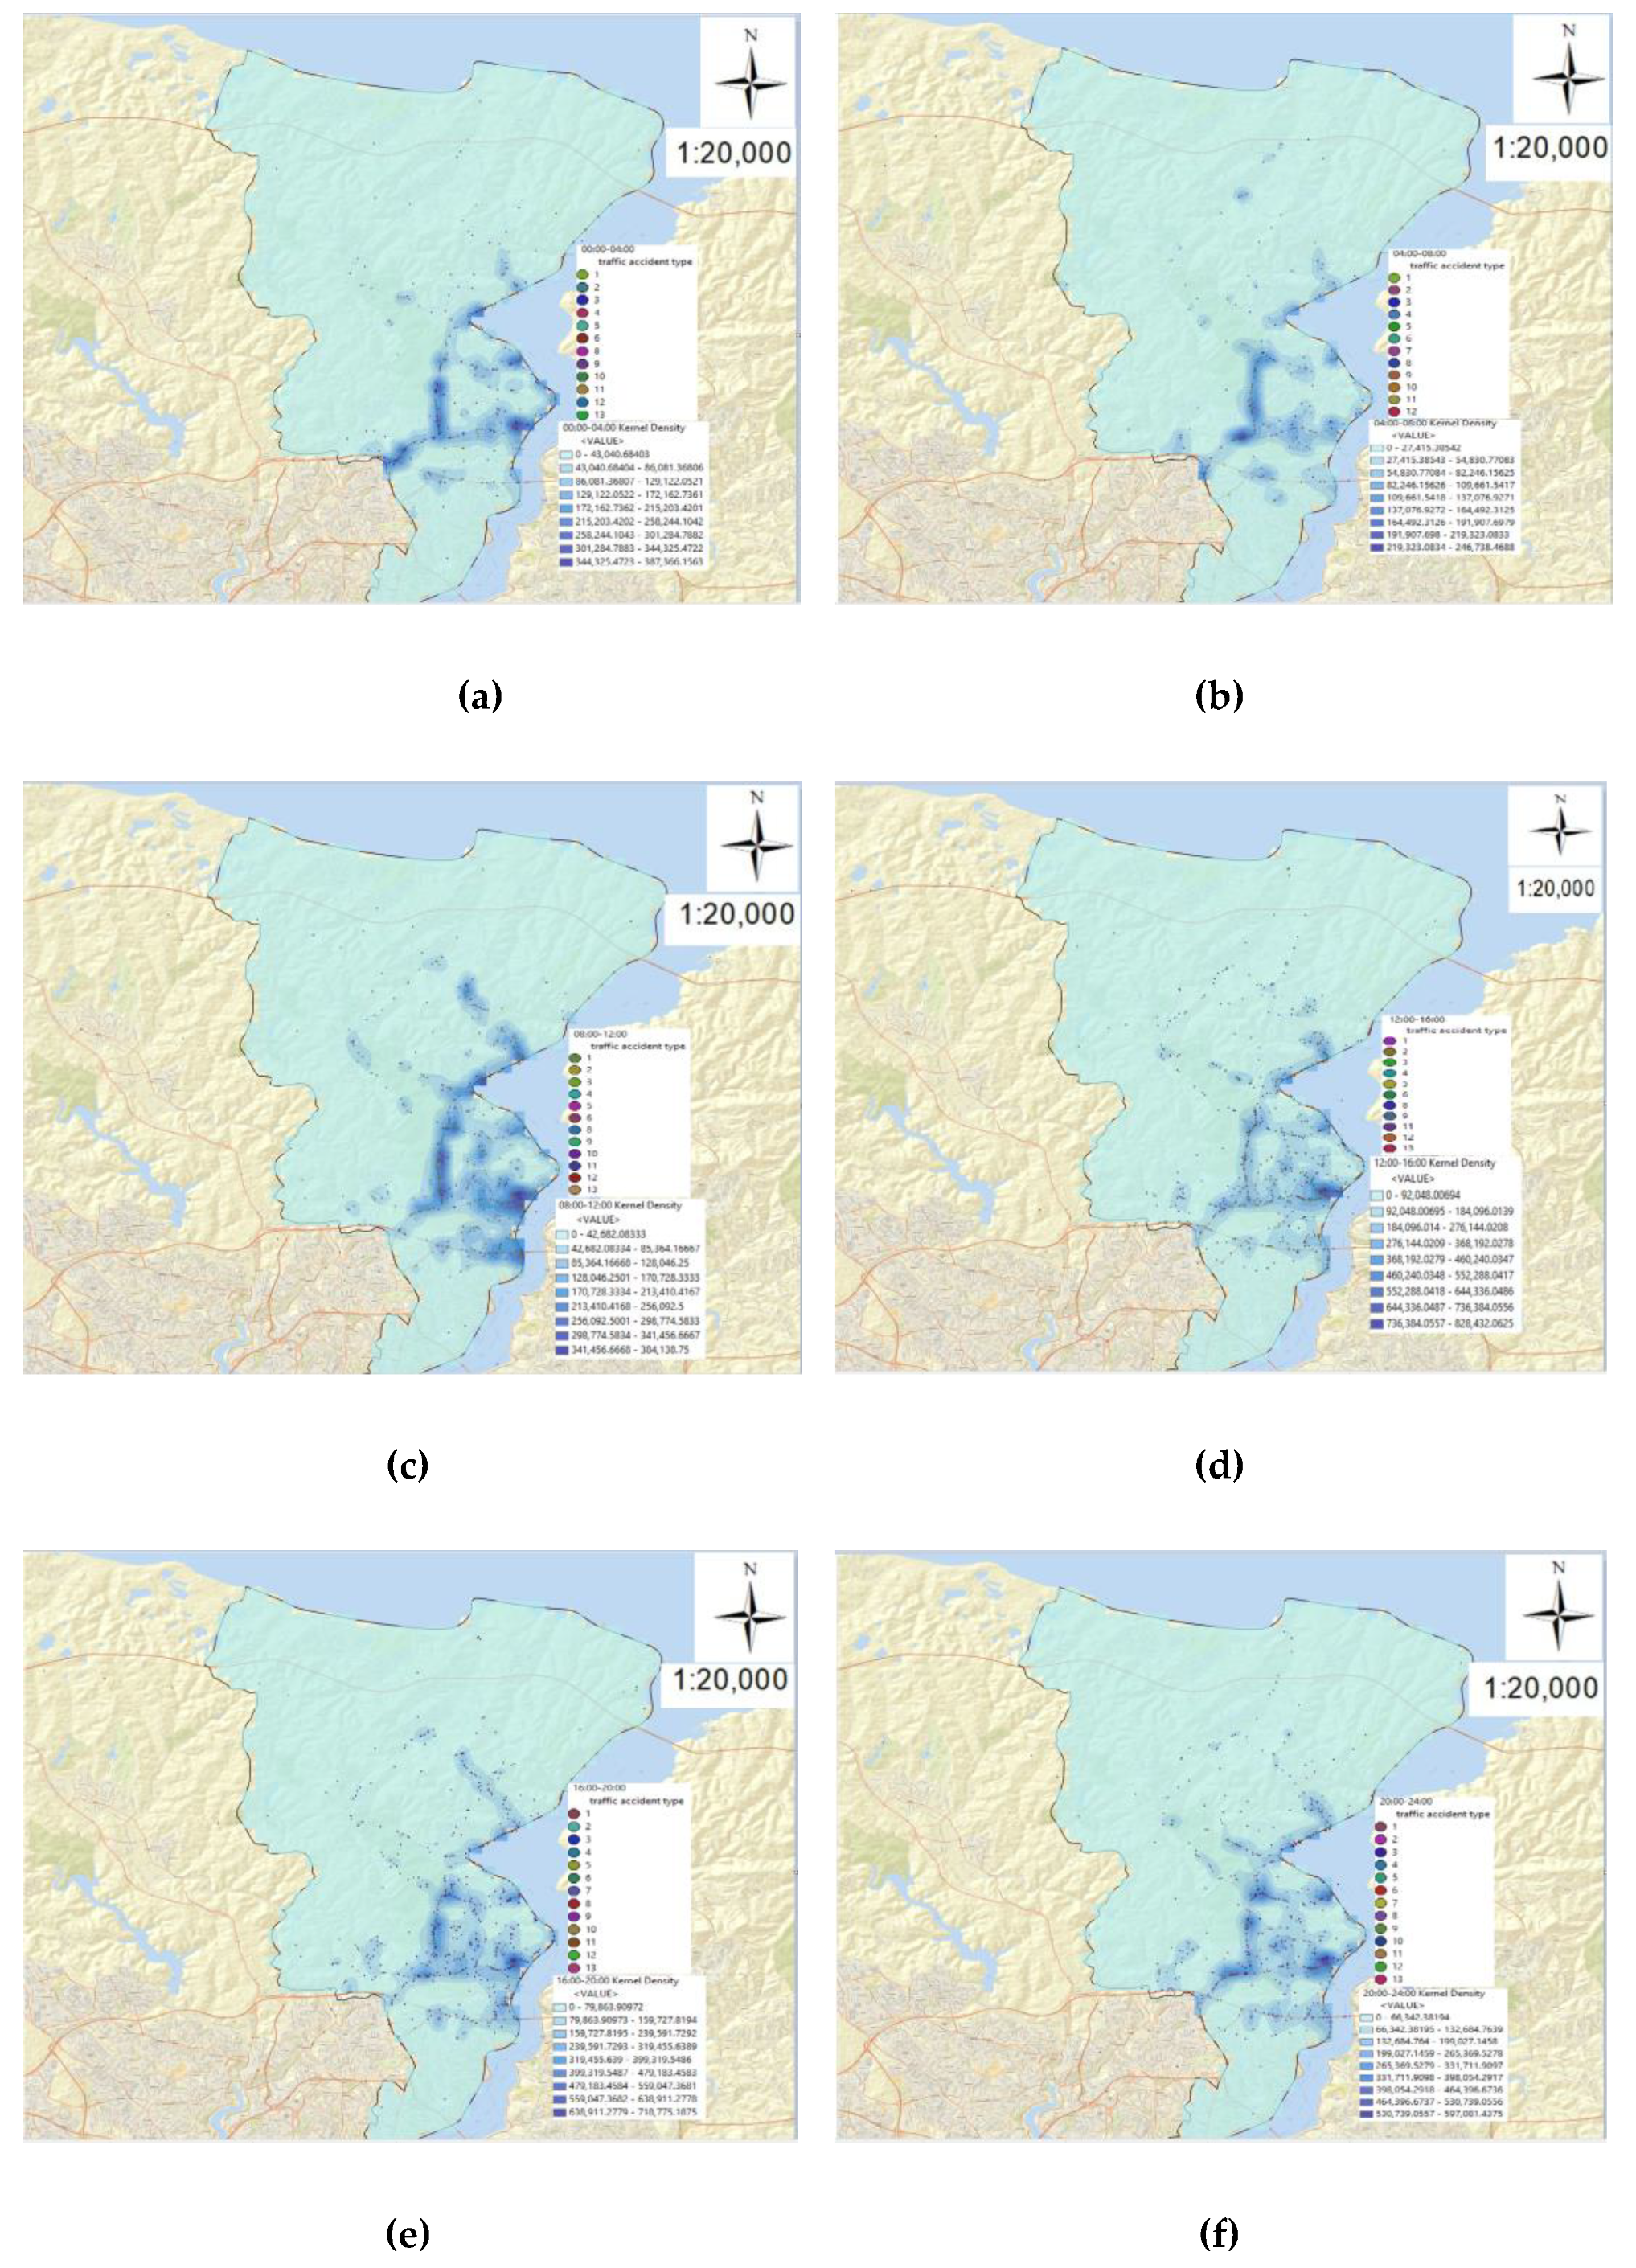
Figure 22 shows the Kernel Density maps according to accident hours, respectively. The accident types in the accident hotspots were analyzed by integrating the accident types in Table 7 to the Kernel Density maps. Traffic accident type label color representations have been changed in some time zones because the colors cannot be seen clearly due to the differences in the locations of the accidents. In addition, since only 12 traffic accident types occur in the time zones between 04:00 and 08:00, the first 12 traffic accident types in Table 7 are given by the ArcGIS software. It has been observed that there is no 7th accident type in the accidents between 00:00–04:00 and 08:00–12:00 time zones. In addition, it has been observed that the 7th and 10th accident types do not exist in the accidents in the time zones between 12:00–16:00. Thus, more common accident types in accident hotspots were examined according to accident hours. The Kernel Density map in Figure 22a shows that the accidents that occurred between 00:00–04:00 were concentrated on Büyükdere, İstinye Bayırı, Tarabya Bayırı, Sakıp Sabancı, and Demokrasi Şehitleri Streets. The accidents that occurred on these streets between 00:00–04:00 were mostly rear-end and side-impact accidents. The Kernel Density map in Figure 22b shows that the accidents between 04:00–08:00 were concentrated on Büyükdere, İstinye Bayırı, Tarabya Bayırı, and Hacı Osman Bayırı Streets. Rear-end collision and hitting a fixed object were the most frequent accidents on Büyükdere and Hacı Osman Bayırı Streets between 04:00 and 08:00. While side-impact and rear-end collisions were the most encountered accidents on Tarabya Bayırı Street, side-impact and pedestrian collisions on İstinye Bayırı Street were most prevalent. The Kernel Density map in Figure 22c shows that the accidents were concentrated on İstinye Bayırı, Büyükdere, Sakıp Sabancı, Tarabya Bayırı, Katar, and Hacı Osman Bayırı Streets between 08:00–12:00. Rear-end and side-impact accidents were most frequent on Büyükdere Street between 08:00–12:00. Hitting pedestrians, rear-end collision, and side-impact collision were most prevalent on İstinye Bayırı, Katar, Sakıp Sabancı, and Tarabya Bayırı Streets. On the other hand, fixed object impact, rear-end, and side-impact collisions were most common on Hacı Osman Bayırı Street between these hours. The Kernel Density map in Figure 22d shows that the accidents were concentrated on Büyükdere, İstinye Bayırı, Tarabya Bayırı, Baltalimanı, Hacı Osman Bayırı, and Demokrasi Şehitleri Streets between 12:00–16:00. Rear-end collisions, side-to-side collisions, and pedestrian collisions were high in these streets between 12:00–16:00. In addition, hitting fixed object accidents were high in Hacı Osman Bayırı Street between these accident hours. The Kernel Density map in Figure 22e shows that the accidents were concentrated on Büyükdere, İstinye Bayırı, Tarabya Bayırı, Kilyos, and Baltalimanı Streets between 16:00–20:00. Rear-end collisions and side-impacts were high on Büyükdere, İstinye Bayırı, Kilyos, and Baltalimanı Streets between 16:00–20:00. Between these accident hours, Tarabya Bayırı Street experienced hitting the pedestrian mostly, followed by the side-impact and rear-end collisions. Finally, the Kernel Density map in Figure 22f shows that the accidents were concentrated on Büyükdere, İstinye Bayırı, Tarabya Bayırı, Kilyos, Hacı Osman Bayırı, and Sakıp Sabancı Streets between 20:00–24:00. Rear-end and side-impact accidents were most common on these streets between 20:00–24:00.
Automobiles, motorcycles, pickup trucks, and buses had more accidents than other vehicle types in the Sarıyer district. Therefore, the accident prone-streets where these vehicles had more accidents were examined with the Kernel Density maps in Figure 23. As in the days of the week and accident hours, the accident occurrence types in the accident hotspots were analyzed by integrating the accident types in Table 7 to the Kernel Density maps. Traffic accident type label color displays have been changed in some vehicle types because the colors cannot be seen clearly due to the differences in the locations of the accidents. In addition, since only 12 traffic accident types occur in the accidents made by Pickup trucks, the first 12 traffic accident types in Table 7 are given by the ArcGIS software. In addition, it has been observed that there is no 10th accident type in the accidents made by pickup trucks and the 7th accident type in the accidents made by buses.
Figure 23a shows the Kernel Density map of the motorcycle accidents. Motorcycle accidents were concentrated on İstinye Bayırı, Tarabya Bayırı, Büyükdere, Baltalimanı, and Sakıp Sabancı Streets. Motorcycles mostly had accidents on these streets as rear-end, side-impact, and pedestrian collisions. Figure 23b shows the Kernel Density map of automobile accidents. The automobile accidents were concentrated on İstinye Bayırı, Tarabya Bayırı, Büyükdere, Hacı Osman Bayırı, Katar, Sakıp Sabancı, Bahçeköy Forest Road, Demokrasi Şehitleri and Darüşafaka Streets. In these streets, automobiles mostly were involved in accidents side-impact, rear-end, hitting pedestrians, chain collisions, and hitting a stationary vehicle. Figure 23c shows the Kernel Density map of the pickup truck accidents. The pickup truck accidents were concentrated on Büyükdere, İstinye Bayırı, Tarabya Bayırı, and Hacı Osman Bayırı Streets. On these streets, pickup trucks were usually involved in rear-end and side-impact collisions. Finally, Figure 23d shows the Kernel Density map of the bus accidents. The bus accidents were concentrated on İstinye Bayırı, Katar, Tarabya Bayırı, and Hacı Osman Bayırı Streets. Buses mostly had accidents on these streets as rear-end, side-impact, and hitting pedestrian collisions.
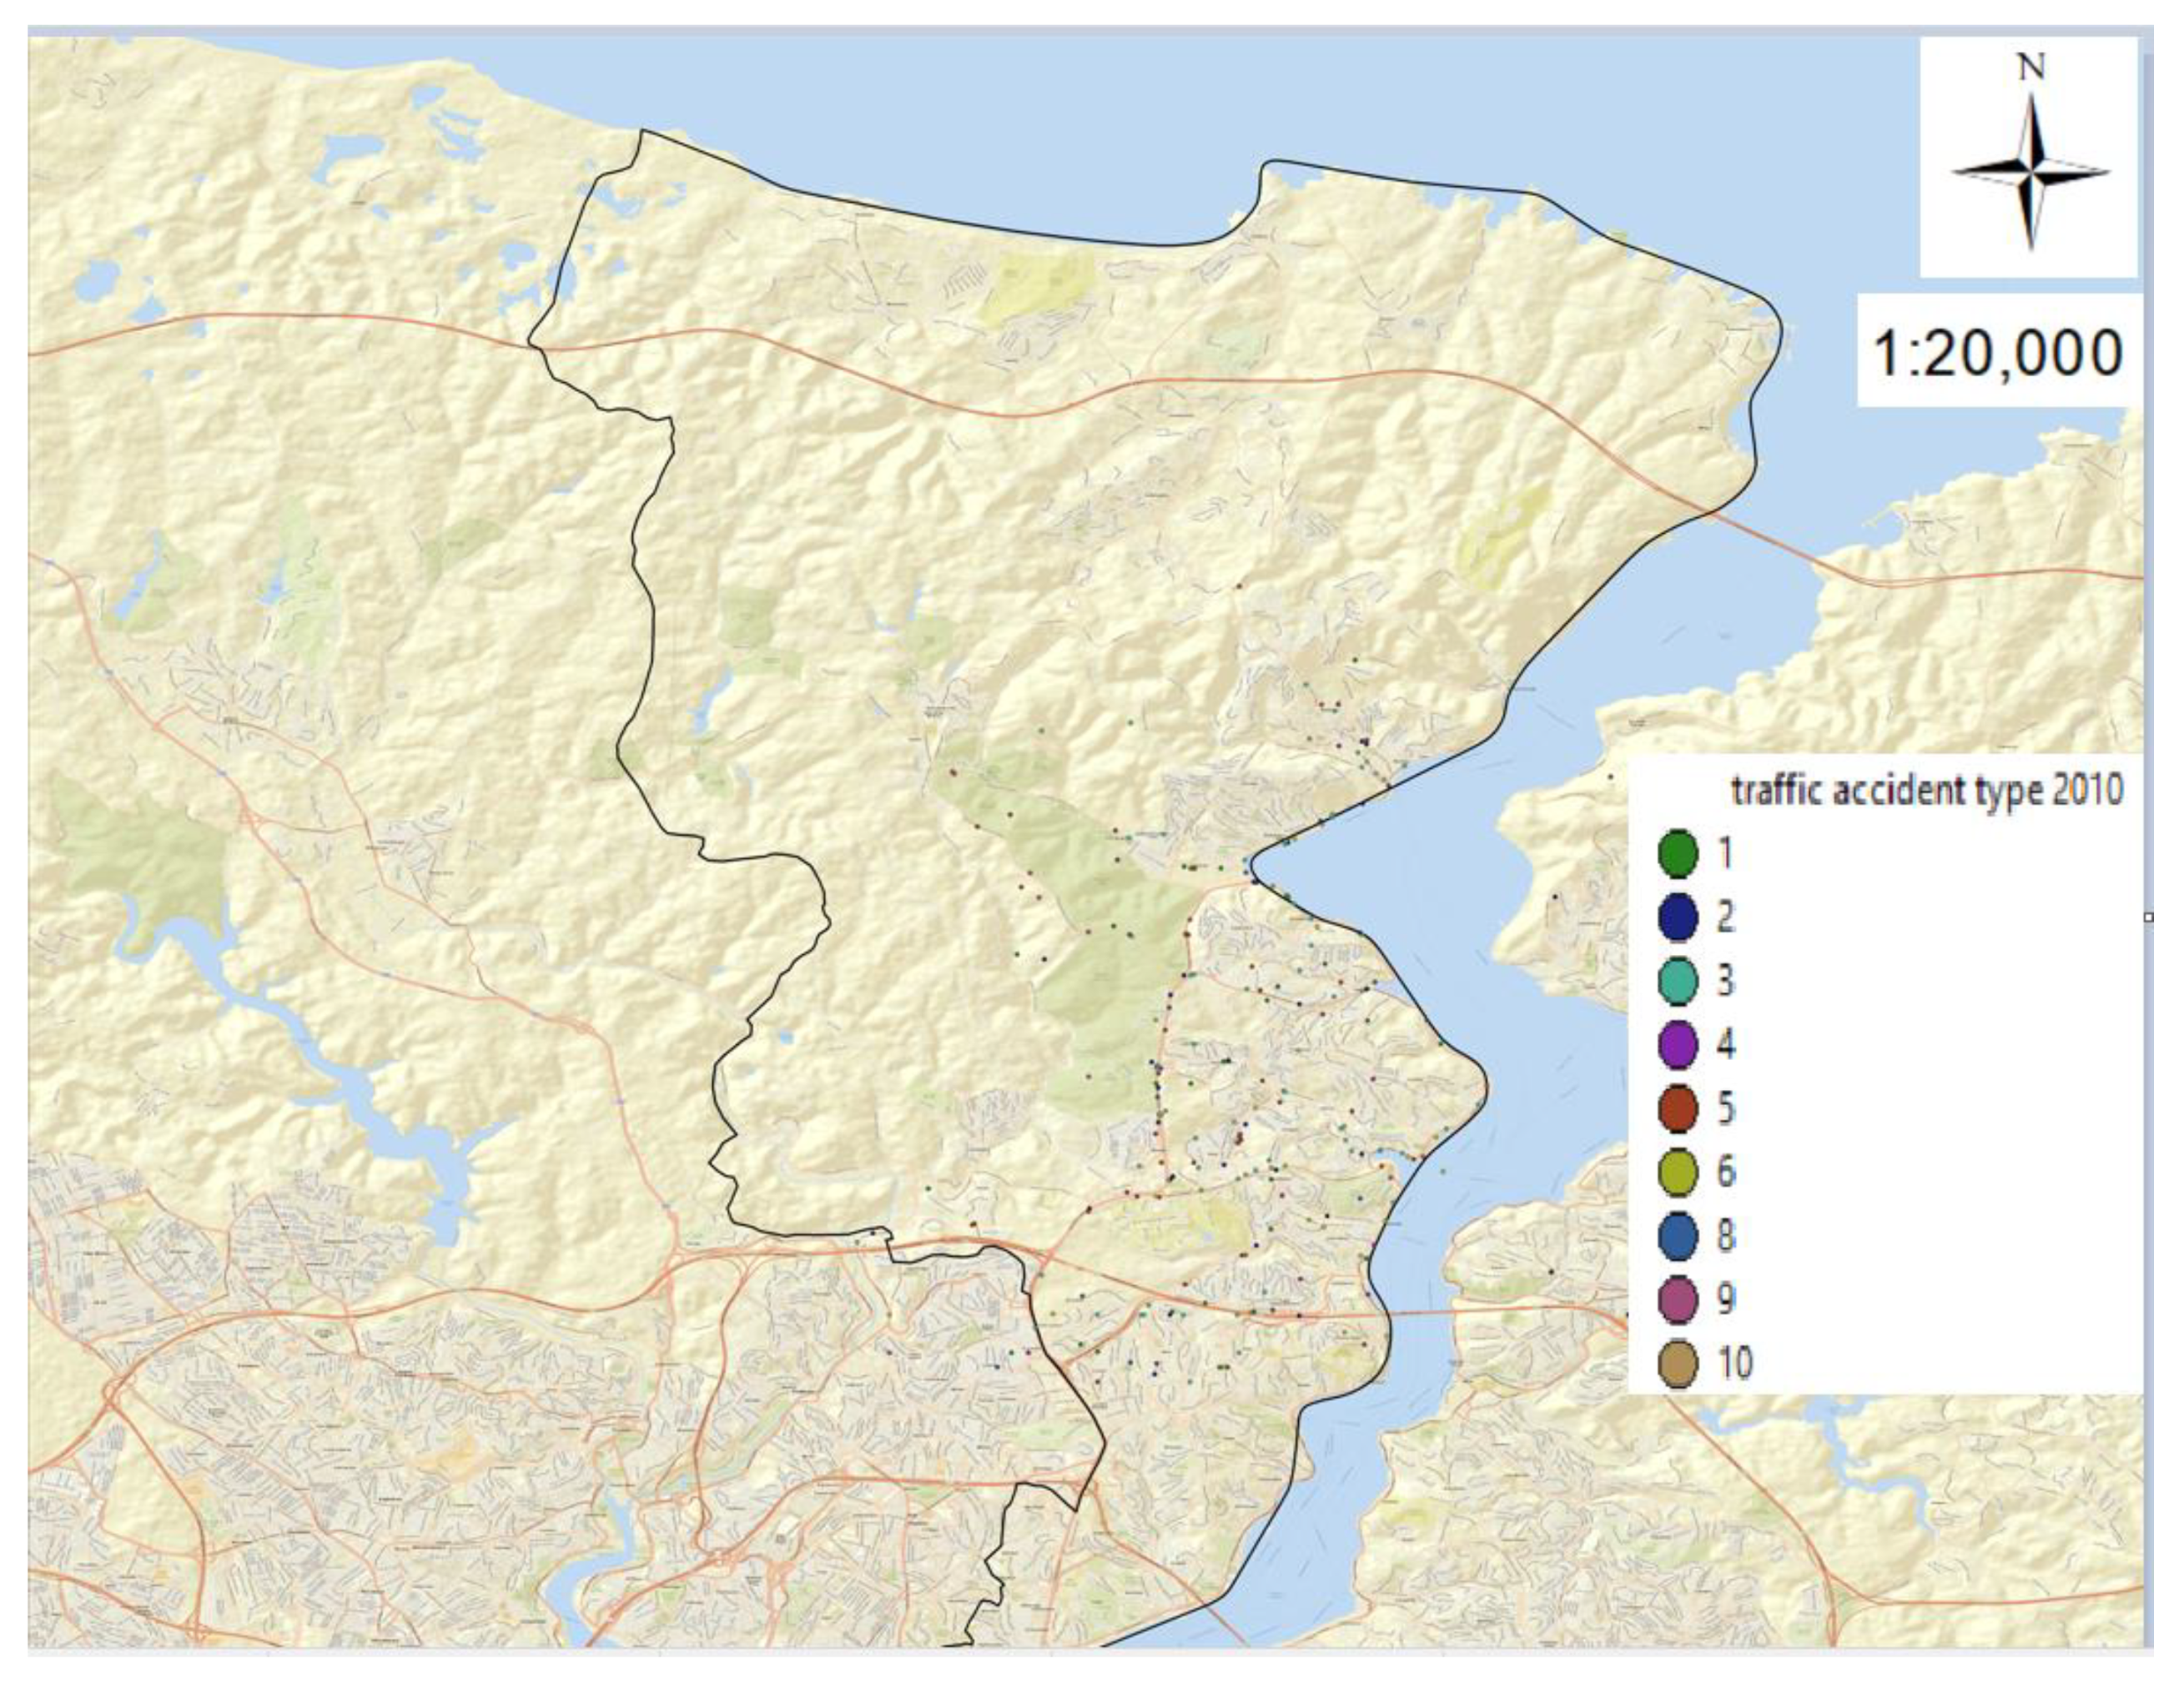
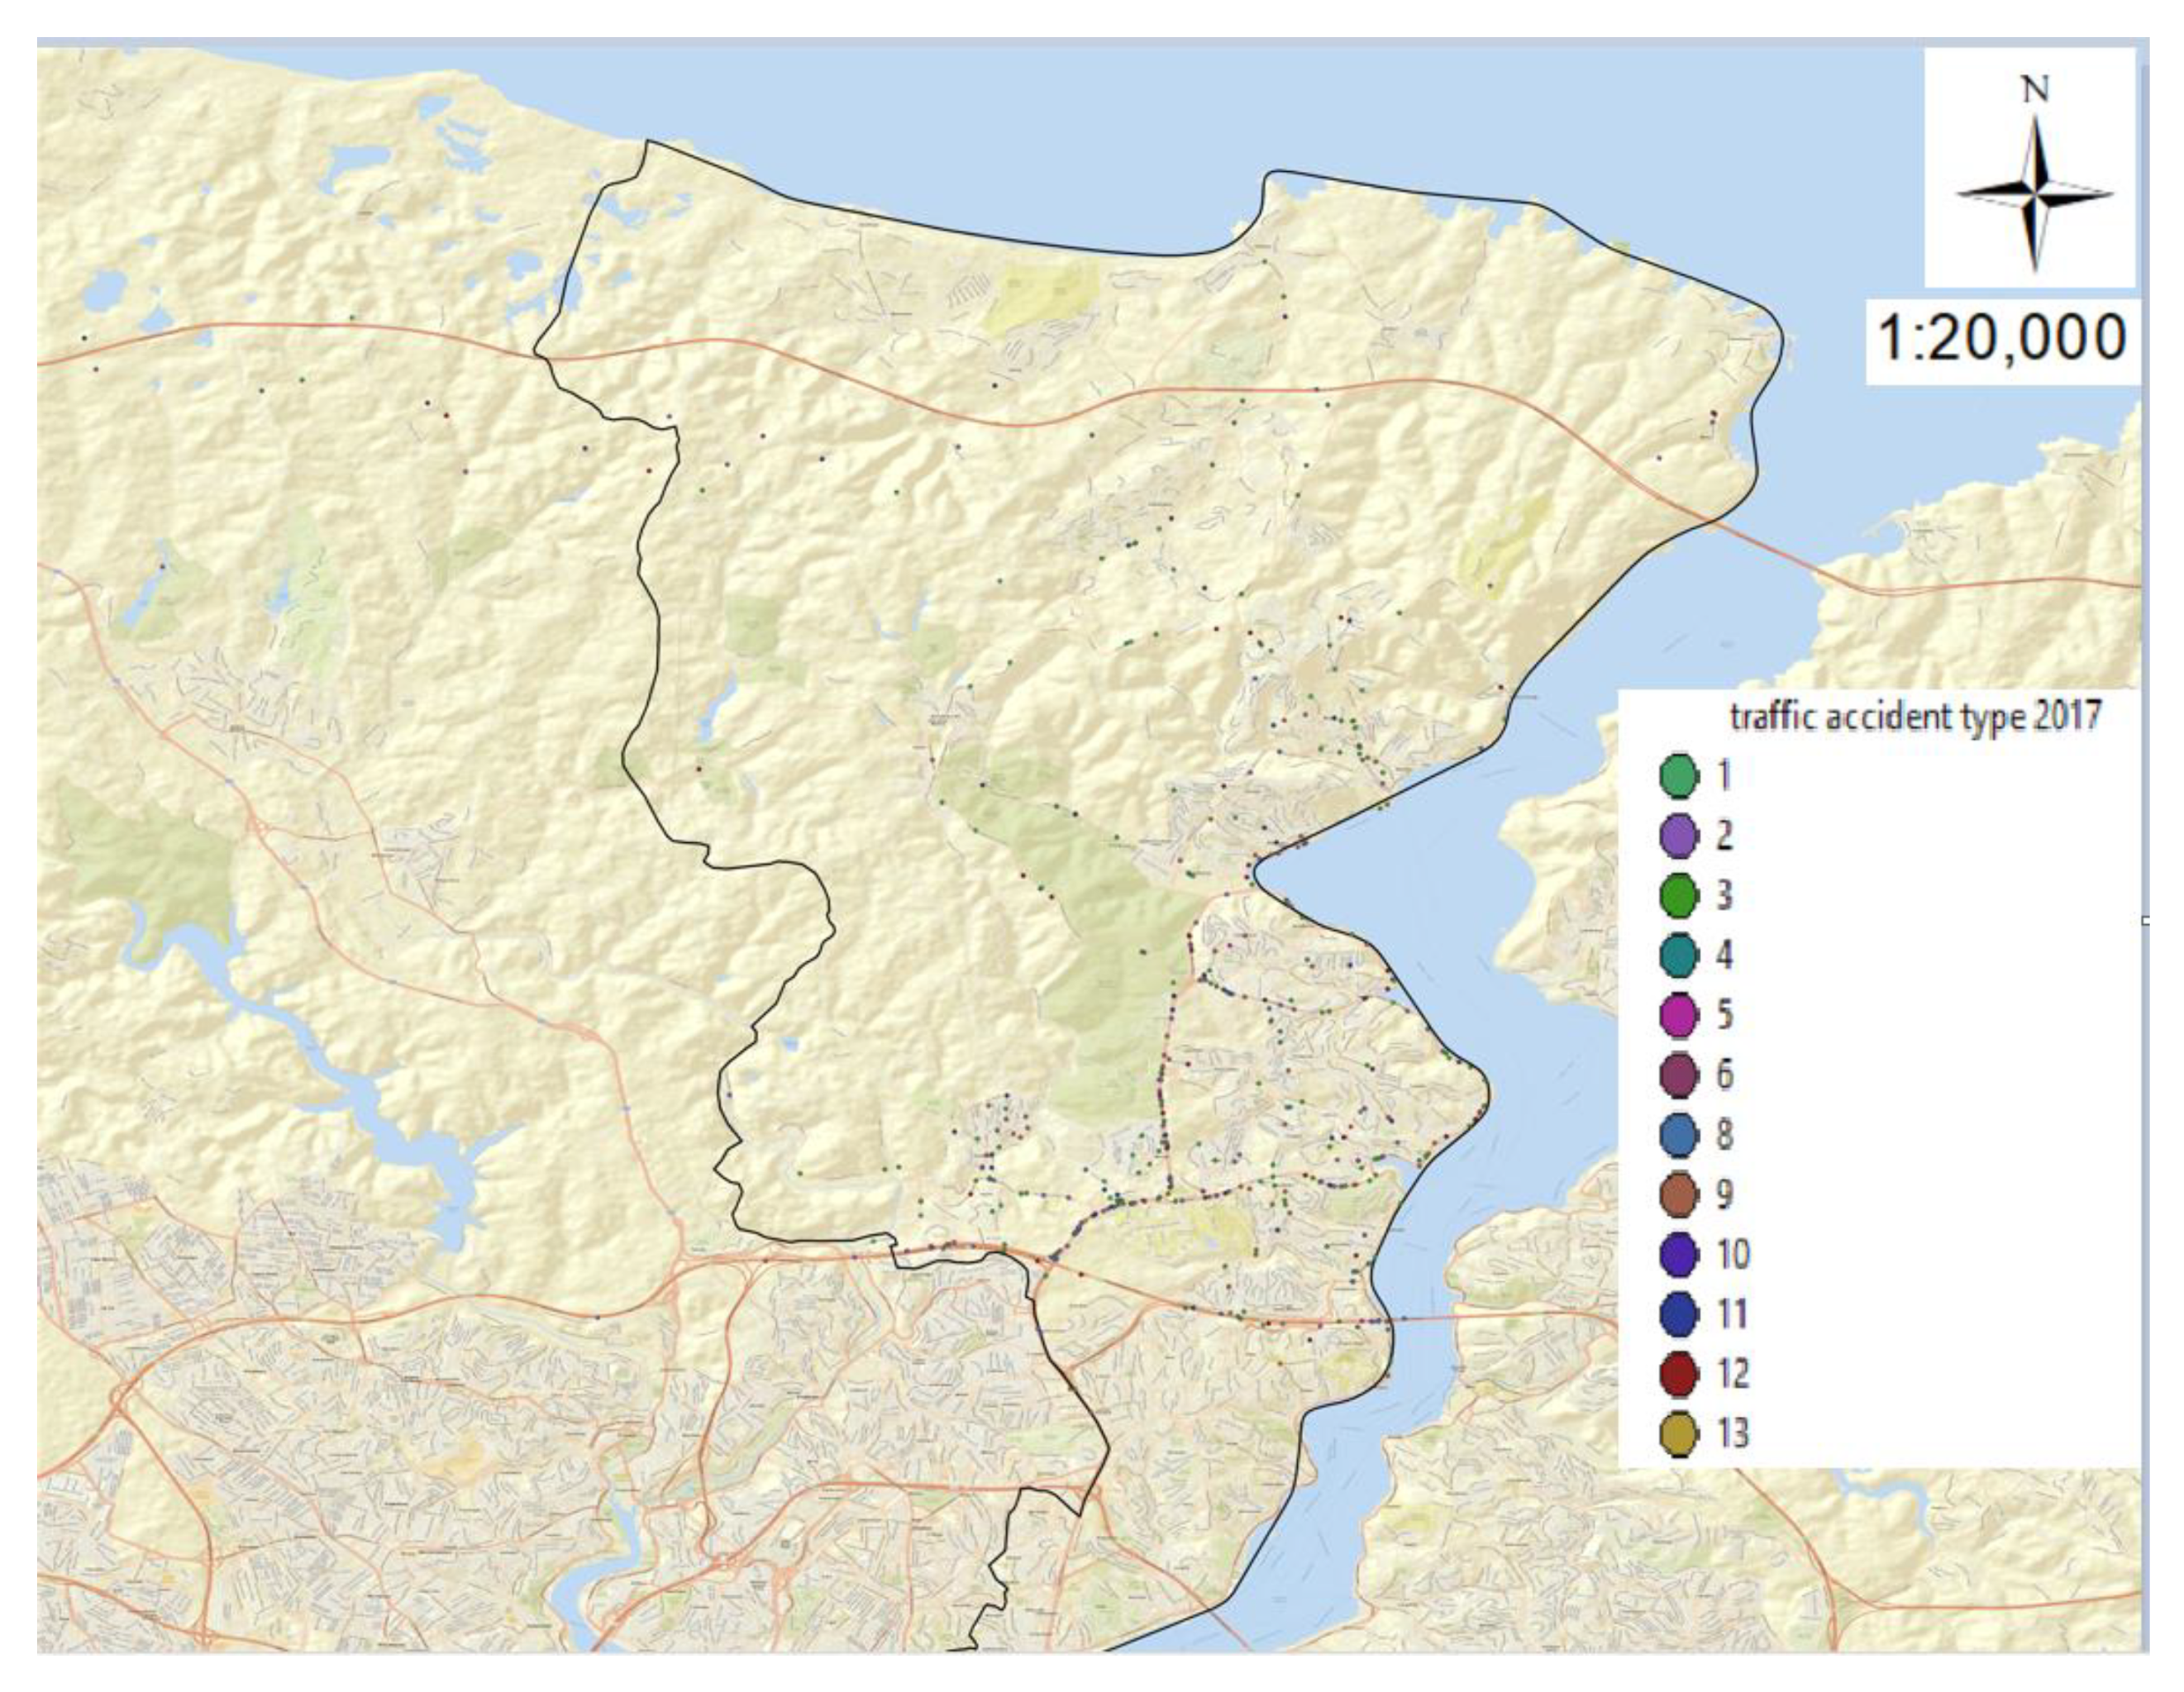
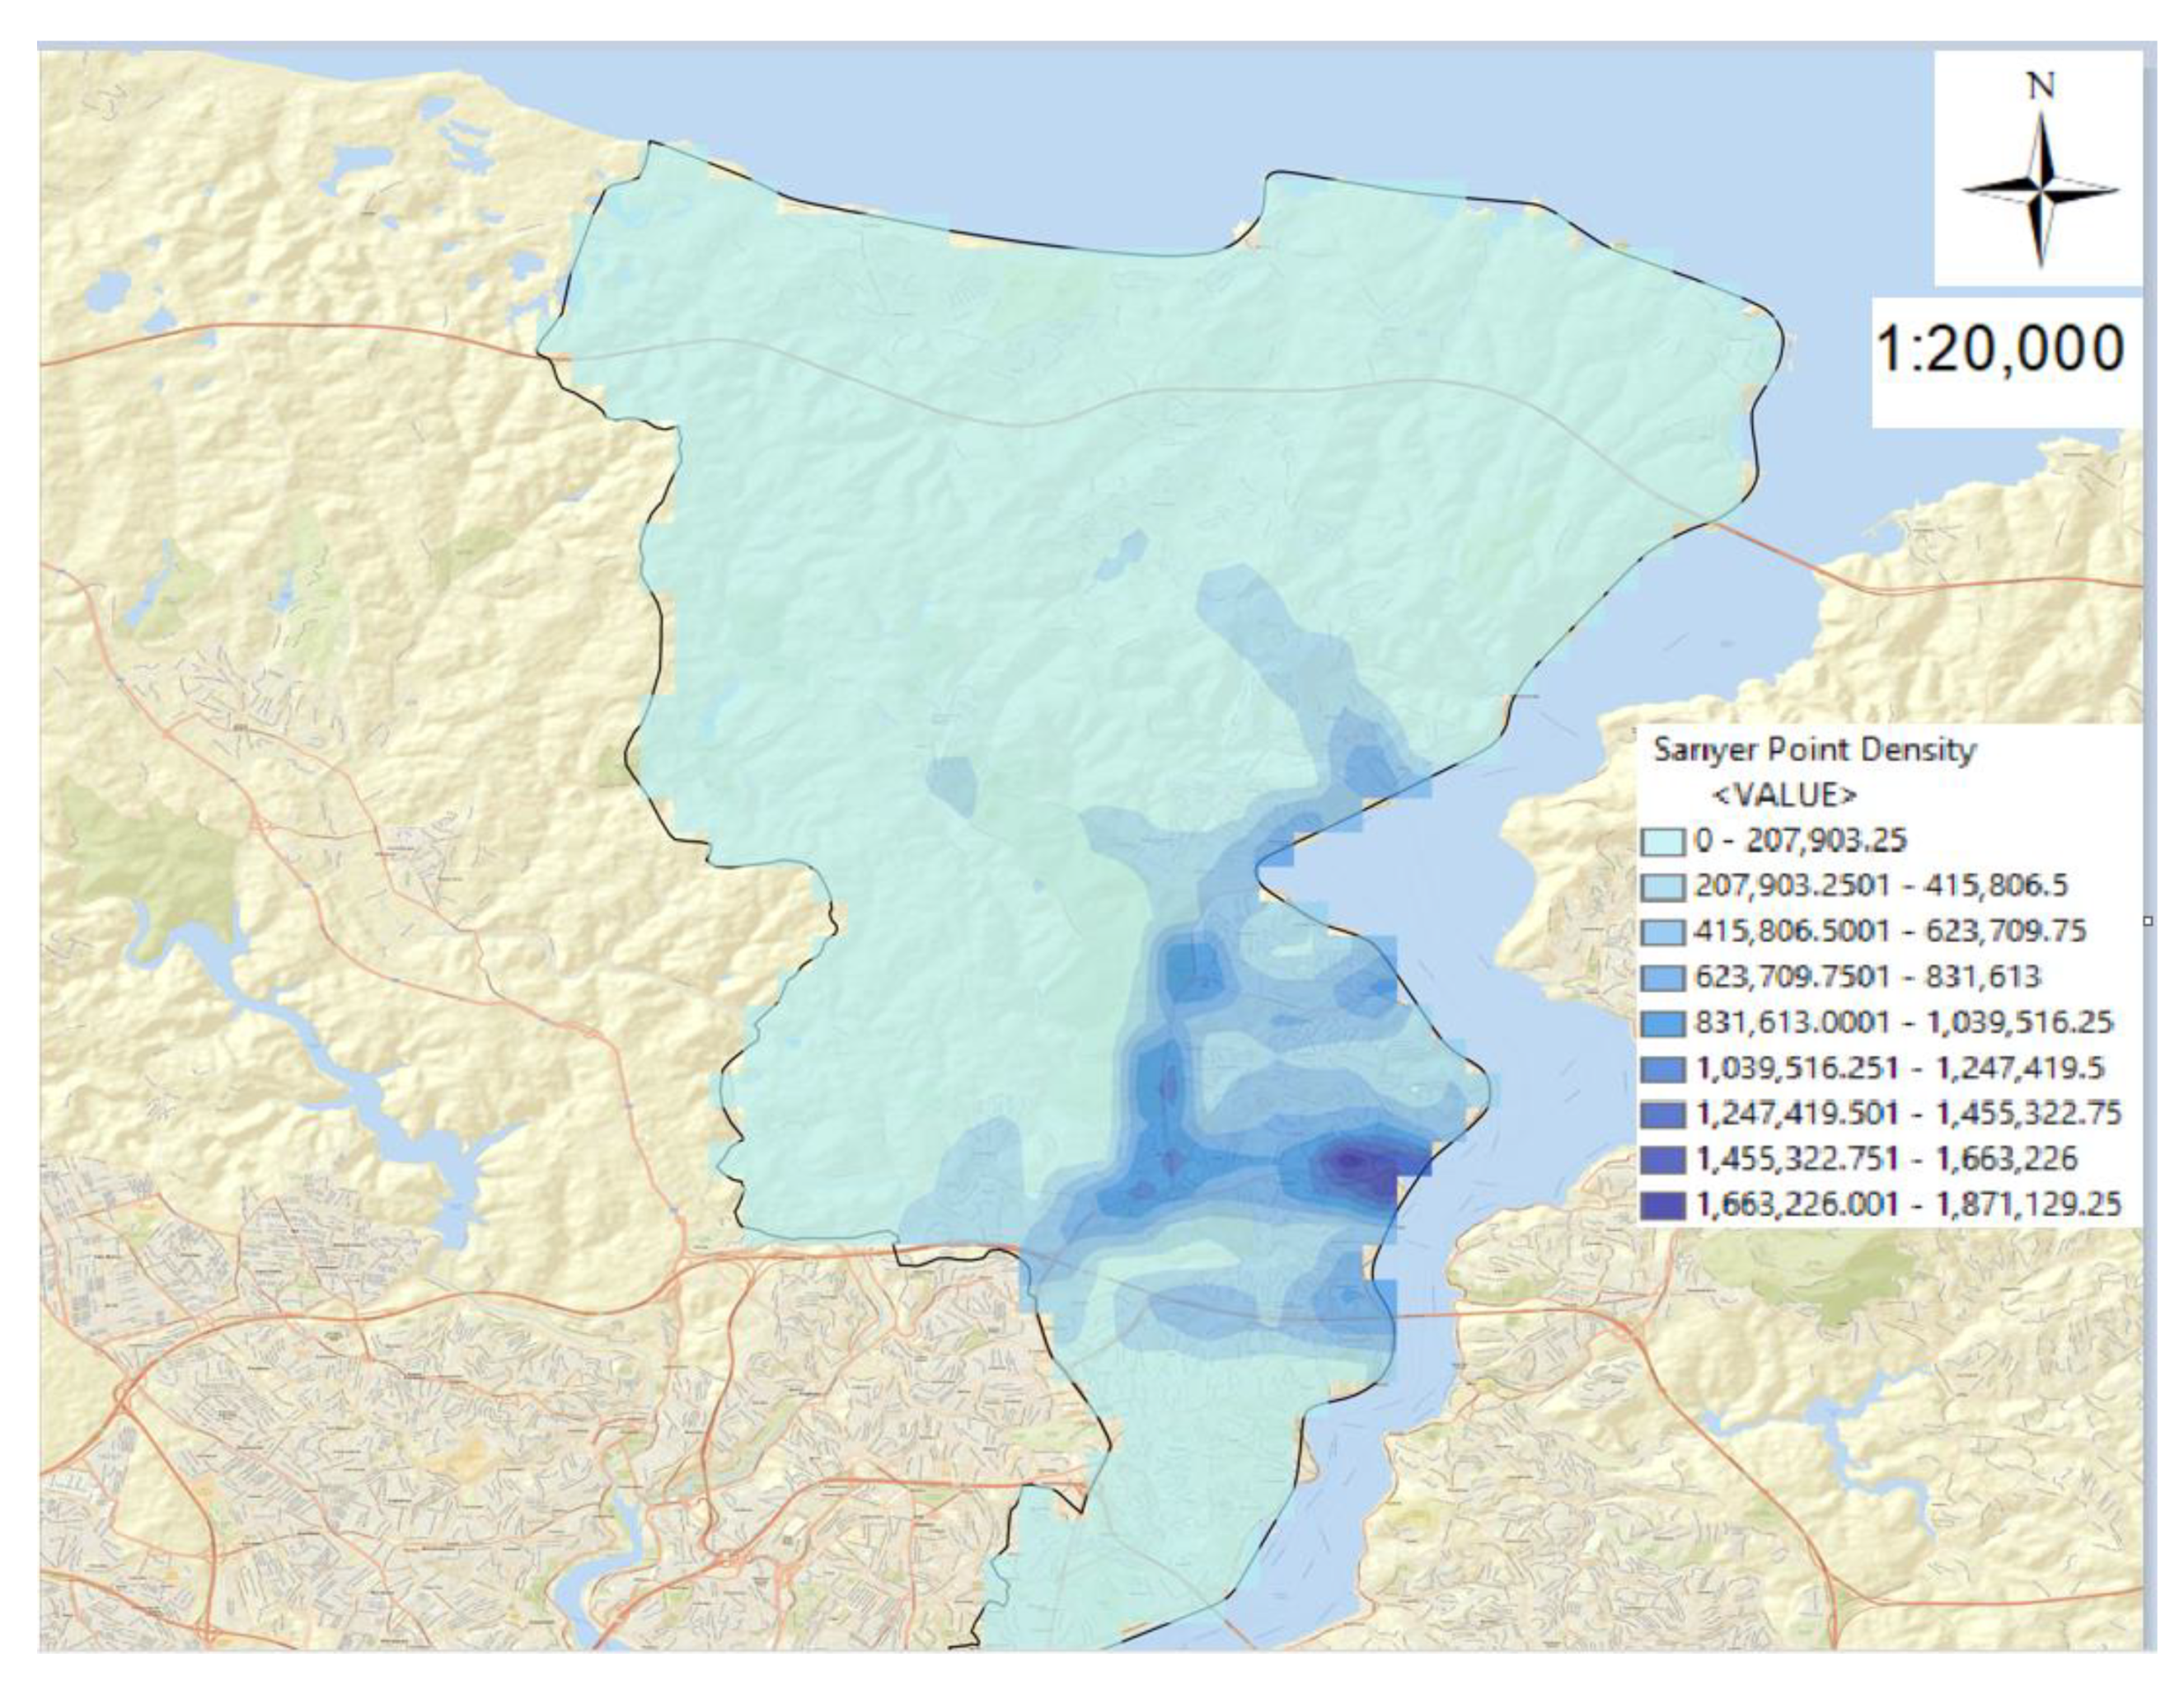
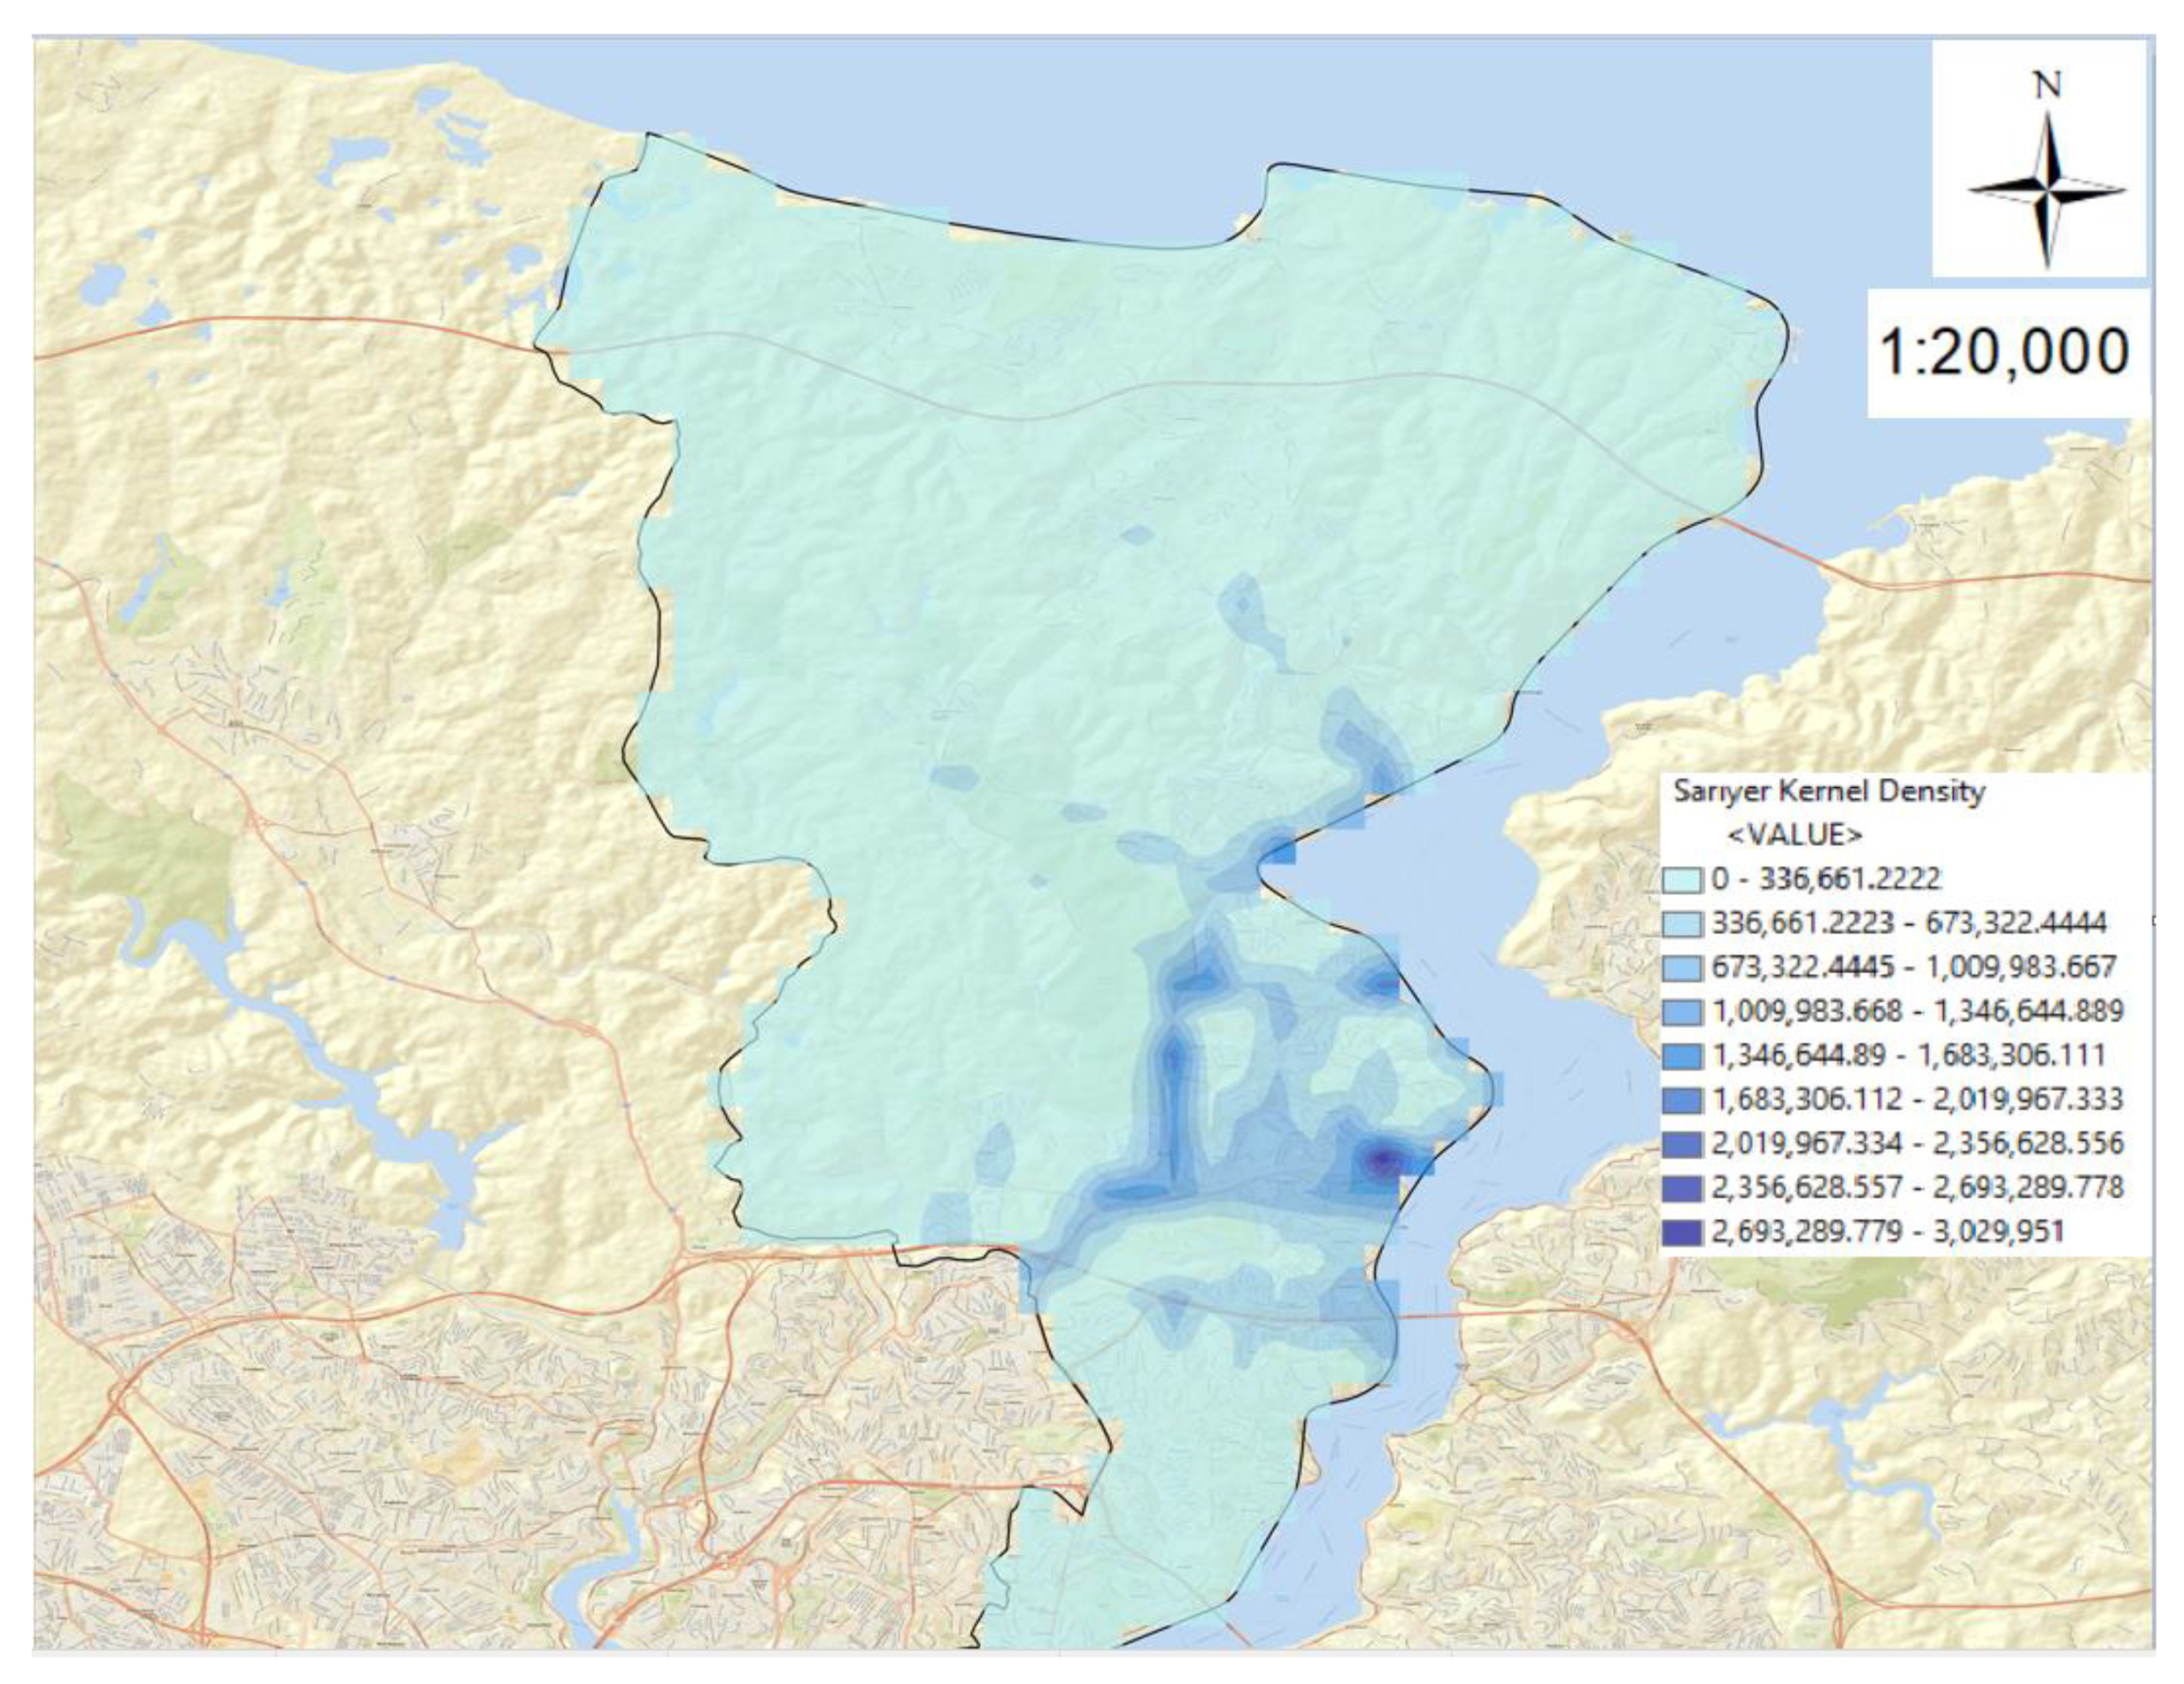
Finally, Figure 24 shows Kernel Density maps of 2010 and 2017 to observe the change in the streets where the accidents were intense.
The Kernel Density map of the accidents in Figure 24a shows that the accident-prone hotspots were Büyükdere, İstinye Bayırı, Tarabya Bayırı, and Hacı Osman Bayırı Streets in 2010.
The Kernel Density map of the accidents in Figure 24b shows that the accidents were concentrated on Büyükdere, Tarabya Bayırı, Katar, Hacı Osman Bayırı, İstinye Bayırı, Kilyos, Köybaşı, and Demokrasi Şehitleri Streets in 2017. The comparison with 2010 shows that the accident density on Büyükdere, Tarabya Bayırı, Katar, Kilyos, Köybaşı, and Demokrasi Şehitleri Streets increased, while a decrease was present in the accident density in Hacı Osman Bayırı and İstinye Bayırı Streets.

4. Discussion

Anomaly detection with the day of the week effect and the month of the year effect related to accidents is a well-known method in the field of finance. This method, which was applied in another area, was tried in this study, considering that testing with spatial analysis techniques would contribute to the study statistically.
The data obtained from the General Directorate of Security could only be obtained as the records of fatal and injury accidents. The fact that the data we requested from the Insurance Information and Monitoring Center could not be obtained partially prevented the study from being more comprehensive. In particular, the inability to obtain data on accidents with material damage, excluding fatal and injury accidents that occurred in this district, made us prefer ANOVA model and t-test method on the basis of OLS (Ordinary Least Squares), however, it also limited the study based on OLS (Ordinary Least Squares). However, the model has provided us with information-enhancing contributions in the prevention of traffic accidents. For example, the day of the week effect is available for Sunday and Monday. At the same time, for the month of the year effect, the months other than February and March were statistically significant. When the day of the week effect and month of the year effect are analyzed together with frequency analysis, it is seen that the weather conditions are not very effective. In addition, since we do not have material damage accidents, no comment could be made on whether the weather conditions were effective for such accidents.
In this study, it was seen that the Kernel Density method gave better visual results in spatial analysis. In addition, it has been seen that analyzing the data by separating the data with the Kernel Density method leads to more detailed discussions. The fact that statistical analyses was carried out in addition to visuality in the study further strengthened the scientificity of the study.
With this study, it was seen that the accidents were in different locations according to the changing conditions by making maps according to the days, time zones, and the types of vehicles that had the most accidents. It has been observed that the accidents are concentrated on other streets, especially according to the changing time zones and days. Thus, in order to prevent accidents, necessary measures can be taken according to the accident intensities determined in different places.
It is thought that this study can be further developed in the future by obtaining the different variables that we mentioned in the data of property damage accidents and Data Arrangement section from the Insurance Information and Surveillance Center.

5. Conclusions

Determining the cause of similar location-based accidents is very important in terms of ensuring the safety of people in traffic and reducing the number of accidents. In order to develop effective road safety measures that can be used to reduce traffic accidents, it is necessary to identify the regions (hot spots) where the accidents are concentrated. With this study, where the integrated density maps of Sarıyer district were examined, it was decided to examine the district separately as 4 different regions.
Kernel Density method has been a preferred method among other spatial methods. With this method and statistical analysis, the streets in Sarıyer district, where fatal and injury traffic accidents are intense, were examined. In our studies on spatial analysis, it has become necessary to analyze the space by dividing it into regions rather than considering the space as a whole.
At the same time, it has been determined that the design and analysis of the data on the basis of day, hour and vehicle types gives better results in the analysis of traffic accidents. In the spatial analyses made by separating the data, it was concluded that accident locations and accident occurrence types differ. For example, the accidents that occurred on Monday were concentrated on İstinye Bayırı, Büyükdere, Haydar Aliyev, Demokrasi Şehitleri, and Tarabya Bayırı Streets, while the accidents that occurred on Sunday were on Büyükdere, İstinye Bayırı, Tarabya Bayırı, Köybaşı, Kilyos, and Haydar Aliyev Streets. It has been found that it is concentrated in Bahçeköy Forest Road and Baltalimanı Street. In the accidents that occurred on Sunday, it was seen that the accidents were intense on Köybaşı, Kilyos, Bahçeköy Forest Road and Baltalimanı Streets. On Monday, on the other hand, the density of accidents on Demokrasi Şehitleri Street was higher than on Sunday. At the same time, while accidents involving pedestrians were higher in İstinye Bayırı Street in the accidents that took place on Monday, it was observed that there were more accidents in the form of rear-end collisions and side-impacts on this street on Sunday. In addition, while the number of accidents in the form of rear-end and side-impact collisions on Büyükdere Street was high on Monday, it was observed that there were more accidents in the form of pedestrians on Sunday. In the hour-based analysis, for example, it was seen that the accidents that occurred between 12:00 and 16:00 were concentrated on Büyükdere, İstinye Bayırı, Tarabya Bayırı, Baltalimanı, Hacı Osman Bayırı, and Demokrat Şehitleri Streets. While it is seen that the accidents that occur in the form of rear collision, side collision, and pedestrian collision in these streets between 12:00 and 16:00 are high, it is seen that the accidents that occur in the form of hitting a fixed object between these time zones on Hacı Osman Bayırı Street are high. In the accidents that occurred between 20:00–24:00, it was seen that the accidents were intense on Büyükdere, İstinye Bayırı, Tarabya Bayırı, Kilyos, Hacı Osman Bayırı, and Sakıp Sabancı Streets. It has been observed that there are more accidents in the form of rear-end and side-impact accidents in these streets between the hours of 20:00–24:00. In the examination made according to vehicle types, it is seen that the accidents caused by cars are concentrated in İstinye Bayırı, Tarabya Bayırı, Büyükdere, Hacı Osman Bayırı, Katar, Sakıp Sabancı, Bahçeköy Forest Road, Demokrasi Şehitleri, and Darüşafaka Streets, and that these streets are mostly on the side, crashes, rear crashes, pedestrian crashes, chain crashes, and hitting a stationary vehicle. Again, as an example, it has been found that the accidents caused by buses are concentrated in İstinye Bayırı, Katar, Tarabya Bayırı, and Hacı Osman Bayırı Streets. Buses mostly crashed on these streets in the form of rear collision, side collision and pedestrian collision. As can be seen in the examples above, the analysis made by separating them according to the days of the week, time zones, and vehicle types gave different results.
In this study, it was concluded that in the month-based significance analysis of the accidents, which was carried out with January as the base month to prevent multicollinearity, April had a significant month effect at the 1% significance level in terms of accident numbers, while February and March did not have a statistically significant month effect. It was concluded that the other months had a significant month effect in terms of accident numbers at the 5% significance level. It was observed that the accidents showed a serious differentiation compared to other months, especially in April. In the day-based significance study, it was observed that Sunday was different from other days in terms of the number of accidents at the 10% significance level. It has been observed that the other days, except Sunday, do not have a significant day effect, provided that Monday is taken as the base day.
This study showed that measures should be taken by separating them in a narrower area depending on spatial analysis in the prevention of injuries and fatal accidents. Statistical analyses have shown that preventive measures are not very effective, as all the data of the studied space is probably included in the integrated analysis. As a result, it is thought that making analyses with parsing data, if possible, instead of aggregated data in spatial analyses, will better guide decision makers in terms of producing solutions.
Research Limitations: As we explained in the Data Arrangement section, since the data we have is limited and belongs to a single district, the density values could not be calculated equally on the maps made according to the days, time zones, and vehicle types that had the most accidents. When the density values are made equally on these maps, the streets where the accidents are intense cannot be understood. Therefore, all maps were selected and calculated as 9 classes with the equal interval method of ArcGIS software. In addition, point data could not be studied because our data were not suitable for Getis Ord Gi* and Anselin Local Moran’s I (LISA) Spatial Autocorrelation methods. In these methods, fishnet and polygon data are used. However, since the polygon data handled with the fishnet approach in Getis Ord Gi* and Anselin Local Moran’s I (LISA) Spatial Autocorrelation methods could not get successful results at 1/20.000 scale, 1/150.000 scale was preferred in these methods.
The importance of the research is the application of a known method in the field of finance in terms of traffic accidents. In addition, the analysis of accidents on the basis of day, month, and vehicle type after the determination of hotspots with this study provides more effective evaluation to the units aimed at preventing traffic accidents.

Author Contributions

M.E. conceived the presented idea. M.E. and A.H.B. developed the theory and performed the computations. M.E., A.H.B. and S.T.E. verified the analytical methods. M.E. wrote the manuscript with support from A.H.B. and S.T.E.; M.E., A.H.B. and S.T.E. provided critical feedback and helped shape the research, analysis, and manuscript. M.E., A.H.B. and S.T.E. designed the model and computational framework and analyzed the data. A.H.B. and S.T.E. conceived the study and were in charge of the overall direction and planning. M.E., A.H.B. and S.T.E. discussed the results and commented on the manuscript. M.E., A.H.B. and S.T.E. contributed to the design and implementation of the research, to the analysis of the results, and to the writing of the manuscript. All authors have read and agreed to the published version of the manuscript.

Funding

This research received no external funding.

Institutional Review Board Statement

Not applicable.

Informed Consent Statement

Not applicable.

Data Availability Statement

The study did not report any data.

Acknowledgments

We would like to thank the General Directorate of Security and the reviewers for their valuable contributions.

Conflicts of Interest

The authors declare no conflict of interest.

References

  1. TURKSTAT. Highway Traffic Accident Statistics. 2017. Available online: https://data.tuik.gov.tr/Bulten/Index?p=Karayolu -Trafik-Kaza-Istatistikleri-2017-27668 (accessed on 5 June 2021).
  2. Camkesen, N.; Bayrakdar, Z. Alan Analizi Yöntemi ile Kazaların Gerçek Nedenlerinin Saptanması, II. Transportation and Traffic Congress Book of Proceedings, Ankara, 1999. Available online: https://docplayer.biz.tr/25379493-Ii-ulasim-ve-trafik-kongresi-sergisi-bildiriler-kitabi.html (accessed on 5 June 2021).
  3. Ajah, I.A.; Nweke, H.F. Big Data and Business Analytics: Trends, Platforms, Success Factors and Applications. Big Data Cogn. Comput. 2019, 3, 32. [Google Scholar] [CrossRef] [Green Version]
  4. Mikalef, P.; Pappas, I.O.; Krogstie, J.; Pavlou, P.A. Big data and business analytics: A research agenda for realizing business value. Inf. Manag. 2020, 57, 103237. [Google Scholar] [CrossRef]
  5. Points with the Highest Number of Traffic Accidents in Turkey. 2019. Available online: https://www.cnnturk.com/otomobil/ trafik-kazalarinin-en-cok-oldugu-noktalar (accessed on 30 August 2021).
  6. Districts with the Most Accidents in İstanbul. 2016. Available online: https://www.trthaber.com/haber/turkiye/istanbulda-en-cok-kaza-bu-ilcede-yasaniyor-291156.html (accessed on 30 August 2021).
  7. The Population of Sarıyer Quarters. 2019. Available online: https://www.nufusu.com/sariyer-istanbul-mahalleleri-nufusu (accessed on 5 June 2021).
  8. Number of Residences and Workplaces in Sarıyer District. 2012. Available online: https://www.hurriyet.com.tr/ ekonomi/ maslak-ve-ayazaga-sariyere-baglaniyor-21723371 (accessed on 5 June 2021).
  9. Xie, Z.; Yan, J. Kernel Density Estimation of Traffic Accidents in a Network Space. Comput. Environ. Urban Syst. 2008, 32, 396–406. [Google Scholar] [CrossRef] [Green Version]
  10. Tuncuk, M. Coğrafi Bilgi Sistemi yardımıyla trafik kaza analizi: Isparta örneği. Master’s Thesis, Isparta Süleyman Demirel University, Graduate School of Science and Engineering, Department of Civil Engineering, Isparta, Turkey, 2004. [Google Scholar]
  11. Saplıoğlu, M.; Karaşahin, M. Coğrafi Bilgi Sistemi yardımı ile Isparta İli kent içi trafik kaza analizi. Pamukkale Univ. J. Eng. Sci. 2006, 12, 321–332. [Google Scholar]
  12. Söylemezoğlu, T. Coğrafi Bilgi Sistemleri ile trafik kaza analizi: Ankara örneği. Master’s Thesis, Gazi University, Graduate School of Science and Engineering, Department of Traffic Planning and Implementation, Ankara, Turkey, 2006. [Google Scholar]
  13. Özmal, M. Kahramanmaraş Şehir Merkezinde Meydana Gelen Trafik Kazalarının Coğrafi Bilgi Sistemleri Kullanılarak İncelenmesi. Master’s Thesis, Kahramanmaraş Sütçü İmam Üniversitesi, Graduate School of Social Sciences, Geography department, Kahramanmaraş, Turkey, 2016. [Google Scholar]
  14. Dereli, M.A. Trafik Kaza Kara Noktalarının Belirlenmesi İçin Coğrafi Bilgi Sistemleri (CBS) Destekli Mekânsal İstatistiksel Metotlar İle Bir Model Geliştirilmesi. Ph.D. Thesis, Afyon Kocatepe University, Graduate School of Science and Engineering, Afyonkarahisar, Turkey, 2016. [Google Scholar]
  15. Karaman, E. İstanbul’da Meydana Gelen Trafik Kazalarının Mekansal Analizi. Master’s Thesis, Fatih University, Graduate School of Social Sciences, İstanbul, Turkey, 2013. [Google Scholar]
  16. Xie, Z.; Yan, J. Detecting Traffic Accident Clusters with Network Kernel Density Estimation and Local Spatial Statistics: An Integrated Approach. J. Transp. Geogr. 2013, 31, 64–71. [Google Scholar] [CrossRef]
  17. Cheng, W.; Washington, S. Experimental evaluation of hotspot identification methods. Accid. Anal. Prev. 2005, 37, 870–881. [Google Scholar] [CrossRef] [PubMed]
  18. Cheng, W.; Washington, S. New Criteria for Evaluating Methods of Identifying Hot Spots. Transp. Res. Rec. 2008, 2083, 76–85. [Google Scholar] [CrossRef]
  19. Chen, C.; Li, T.; Sun, J.; Chen, F. Hotspot Identification for Shanghai Expressways Using the Quantitative Risk Assessment Method. Int. J. Environ. Res. Public Health 2016, 14, 20. [Google Scholar] [CrossRef]
  20. Le, K.G.; Liu, P.; Lin, L.-T. Determining the road traffic accident hotspots using GIS-based temporal-spatial statistical analytic techniques in Hanoi, Vietnam. Geo-Spat. Inf. Sci. 2019, 32, 153–164. [Google Scholar] [CrossRef] [Green Version]
  21. İlçi, V. Trafik Kaza Kara Noktalarının Mekânsal İstatistiksel Yöntemlerle Belirlenmesi: Afyonkarahisar—Konya Örneği. Master’s Thesis, Afyon Kocatepe University, Graduate School of Science and Engineering, Department of Geodesy and Photogrammetry Engineering, Afyonkarahisar, Turkey, 2013. [Google Scholar]
  22. Montella, A. A Comparative analysis of hotspot identification methods. Accid. Anal. Prev. 2010, 42, 571–581. [Google Scholar] [CrossRef]
  23. Flahaut, B.; Mouchart, M.; Martin, E.S.; Thomas, I. The Local Spatial Autocorrelation and the Kernel Method for Identifying Black Zones: A Comparative Approach. Accid. Anal. Prev. 2003, 35, 991–1004. [Google Scholar] [CrossRef]
  24. Dereli, M.A.; Erdogan, S. A new model for determining the traffic accident black spots using GIS-aided spatial statistical methods. Transp. Res. Part A Policy Pract. 2017, 103, 106–117. [Google Scholar] [CrossRef]
  25. Haybat, H.; Karakaş, E. An analysis of traffic accidents with spatial statistical methods in Izmir Province. Soc. Sci. Dev. J. 2018, 3, 599–617. [Google Scholar] [CrossRef]
  26. Manepalli, U.R.; Bham, G.H.; Kandada, S. Evaluation of Hotspots Identification using Kernel Density Estimation (K) and Getis-Ord (Gi*) on I-630. In Proceedings of the 3rd International Conference on Road Safety and Simulation, Transportation Research Board of the National Academies, Indianapolis, IN, USA, 14–16 September 2011. [Google Scholar]
  27. Anderson, T.K. Kernel density estimation and K-means clustering to profile road accident hotspots. Accid. Anal. Prev. 2009, 41, 359–364. [Google Scholar] [CrossRef] [PubMed]
  28. Mohaymany, A.S.; Shahri, M.; Mirbagheri, B. GIS-based method for detecting high-crash-risk road segments using network kernel density estimation. Geo-Spat. Inf. Sci. 2013, 16, 113–119. [Google Scholar] [CrossRef]
  29. Bil, M.; Andrasik, R.; Janoska, Z. Identification of hazardous road locations of traffic accidents by means of kernel density estimation and cluster significance evaluation. Accid. Anal. Prev. 2013, 55, 265–273. [Google Scholar] [CrossRef]
  30. Thakali, L.; Kwon, T.J.; Fu, L. Identification of crash hotspots using kernel density estimation and kriging methods: A comparison. J. Mod. Transp. 2015, 23, 93–106. [Google Scholar] [CrossRef] [Green Version]
  31. Shafabakhsh, G.A.; Famili, A.; Bahadori, M.S. GIS-based spatial analysis of urban traffic accidents: Case study in Mashhad, Iran. J. Traffic Transp. Eng. 2017, 4, 290–299. [Google Scholar] [CrossRef]
  32. Bíl, M.; Andrášik, R.; Sedoník, J. A detailed spatiotemporal analysis of traffic crash hotspots. Appl. Geogr. 2019, 107, 82–90. [Google Scholar] [CrossRef]
  33. Ulak, M.B.; Ozguven, E.E.; Vanli, O.A.; Horner, M.W. Exploring alternative spatial weights to detect crash hotspots. Comput. Environ. Urban Syst. 2019, 78, 101398. [Google Scholar] [CrossRef]
  34. Dereli, M.A.; Polat, N. Boşanma Verilerinin Coğrafi Bilgi Sistemleri Destekli Mekânsal İstatistiksel Yöntemler ile İrdelenmesi. Harran Univ. J. Eng. 2018, 3, 112–118. [Google Scholar]
  35. Soltani, A.; Askari, S. Exploring spatial autocorrelation of traffic crashes based on severity. Injury 2017, 48, 637–647. [Google Scholar] [CrossRef] [PubMed]
  36. Getis, A.; Ord, J.K. The analysis of spatial association by use of distance statistics. Geogr. Anal. 1992, 24, 189–206. [Google Scholar] [CrossRef]
  37. Anselin, L. Local indicators of spatial association-LISA. Geogr. Anal. 1995, 27, 93–115. [Google Scholar] [CrossRef]
  38. Gundogdu, I.B. Applying linear analysis methods to GIS-supported procedures for preventing traffic accidents: Case study of Konya. Saf. Sci. 2010, 48, 763–769. [Google Scholar] [CrossRef]
  39. Haining, R.P. Spatial autocorrelation. In International Encyclopedia of the Social and Behavioral Sciences; Pergamon Press: Oxford, UK, 2001; pp. 14763–14768. [Google Scholar]
  40. Ouni, F.; Belloumi, M. Pattern of road traffic crash hot zones versus probable hot zones in Tunisia: A geospatial analysis. Accid. Anal. Prev. 2019, 128, 185–196. [Google Scholar] [CrossRef]
  41. Mathur, M. Spatial autocorrelation analysis in plant population: An overview. J. Appl. Nat. Sci. 2015, 7, 501–513. [Google Scholar] [CrossRef] [Green Version]
  42. Erdogan, S.; Ilçi, V.; Soysal, O.M.; Kormaz, A. A model suggestion for the determination of the traffic accident hotspots on the Turkish highway road network: A pilot study. Bol. Ciênc. Geod. 2015, 21, 169–188. [Google Scholar] [CrossRef]
  43. Boots, B.N.; Getis, A. Point Pattern Analysis Newbury Park; Sage Publications: Newbury Park, CA, USA, 1998. [Google Scholar]
  44. Rogerson, P.; Yamada, I. Statistical Detection and Surveillance of Geographic Clusters; Chapman and Hall/CRC: New York, NY, USA, 2009. [Google Scholar]
  45. Li, Y.; Liang, C. The analysis of spatial pattern and hotspots of aviation accident and ranking the potential risk airports based on GIS platform. J. Adv. Transp. 2018, 4027498. [Google Scholar] [CrossRef]
  46. Aharon, D.Y.; Mahmoud, Q. Bitcoin and the day-of-the-week effect. Financ. Res. Lett. 2019, 31. [Google Scholar] [CrossRef]
  47. Baur, D.G.; Cahill, D.; Godfrey, K.; Frank, L.Z. Bitcoin time-of-day, day-of-week and month-of-year effects in returns and trading volume. Financ. Res. Lett. 2019, 31, 78–92. [Google Scholar] [CrossRef]
  48. Cengiz, H.; Bilen, Ö.; Büyüklü, A.H.; Damgacı, G. Stock market anomalies: The day of the week effects, evidence from Borsa Istanbul. J. Glob. Entrep. Res. 2017, 7, 4. [Google Scholar] [CrossRef] [Green Version]
  49. Gujarati, D.N.; Porter, D.C. Basic Econometrics, 5th ed.; McGraw-Hill: New York, NY, USA, 2009. [Google Scholar]
  50. TURKSTAT. Motor Vehicle Statistics. 2019. Available online: https://data.tuik.gov.tr/Bulten/Index?p=Motorlu- Kara-Tasitlari-Aralik-2019-33648 (accessed on 5 June 2021).
  51. Istanbul Public Transport Vehicles Data. 2019. Available online: https://www.tasimacilar.com/yerel/ istanbul-toplu- tasima-araclari-verileri-20725h (accessed on 5 June 2021).
Figure 1. Number of Accidents bar charts: (a) By years; (b) By months; (c) By days; (d) By accident hours.
Sustainability 13 11039 g001aSustainability 13 11039 g001b
Figure 2. Thematic accident map according to the traffic accident types in Sarıyer district.
Sustainability 13 11039 g002
Figure 3. Thematic accident map in Sarıyer district by accident type for the year 2010.
Sustainability 13 11039 g003
Figure 4. Thematic accident map in Sarıyer district by accident type for the year 2017.
Sustainability 13 11039 g004
Figure 5. Traffic accident map in Sarıyer district according to Point Density method.
Sustainability 13 11039 g005
Figure 6. Traffic accidents map in Sarıyer district according to Kernel Density method.
Sustainability 13 11039 g006
Figure 7. Traffic accidents map in Sarıyer district according to Getis Ord Gi* method.
Sustainability 13 11039 g007
Figure 8. According to Getis Ord Gi* method, the significance graph of z-number and p-number of traffic accidents in Sarıyer district.
Sustainability 13 11039 g008
Figure 9. Traffic accidents map in Sarıyer district according to Anselin Local Moran’s I (LISA) Spatial Autocorrelation method.
Sustainability 13 11039 g009
Figure 10. Significance graph of z-number and p-number of traffic accidents in Sarıyer district, according to Anselin Local Moran’s I (LISA) Spatial Autocorrelation method.
Sustainability 13 11039 g010
Figure 11. Representation of the three separated zones of traffic accidents in Sarıyer District.
Sustainability 13 11039 g011
Figure 12. Separation of traffic accidents occurring in the 1st region of Sarıyer district.
Sustainability 13 11039 g012
Figure 13. Maps of the Demokrasi Şehitleri Street: (a) Thematic accident map by accident type; (b) Kernel Density map.
Sustainability 13 11039 g013
Figure 14. Maps of Hacı Osman Bayırı Street: (a) Thematic accident map according to the type of accident; (b) Kernel Density map.
Sustainability 13 11039 g014
Figure 15. Maps of Tarabya Bayırı Street: (a) Thematic accident map by type of accident; (b) Kernel Density map.
Sustainability 13 11039 g015
Figure 16. Common maps and street views of Katar Street and İstinye Bayırı Street: (a) Thematic accident map by type of accident; (b) Kernel Density map.
Sustainability 13 11039 g016
Figure 17. The zone division of the accidents on Sarıyer Büyükdere Street.
Sustainability 13 11039 g017
Figure 18. Maps and street images of Büyükdere Street 1st region: (a) Thematic accident map by accident type; (b) Kernel Density map.
Sustainability 13 11039 g018
Figure 19. Maps and street view of Büyükdere Street 2nd region: (a) Thematic accident map by accident type; (b) Kernel Density map.
Sustainability 13 11039 g019
Figure 20. Maps and street view of Büyükdere Street 3rd region: (a) Thematic accident map by accident type; (b) Kernel Density map.
Sustainability 13 11039 g020
Figure 21. Kernel Density maps of traffic accidents in Sarıyer district by the days of the week: (a) Monday; (b) Tuesday; (c) Wednesday; (d) Thursday; (e) Friday; (f) Saturday; (g) Sunday.
Sustainability 13 11039 g021aSustainability 13 11039 g021b
Figure 22. Kernel Density maps according to accident hours of traffic accidents in Sarıyer district: (a) 00:00–04:00; (b) 04:00–08:00; (c) 08:00–12:00; (d) 12:00–16:00; (e) 16:00–20:00; (f) 20:00–24:00.
Sustainability 13 11039 g022
Figure 23. Kernel Density maps of the vehicles with the highest number of accidents in Sarıyer district: (a) Motorcycle; (b) Automobile; (c) Pickup truck; (d) Bus.
Sustainability 13 11039 g023
Figure 24. Kernel Density maps of traffic accidents in Sarıyer district in 2010 and 2017: (a) 2010; (b) 2017.
Sustainability 13 11039 g024
Table 1. Data entry in the model established to determine whether a day effect existed on the accidents.
YearMonthDaily
Accident Numbers
FridaySaturdaySundayMondayThursday
2010January210000
2010January201000
2010January000100
2010January100010
2017December401000
2017December0001
Table 2. Table of coefficients in the model established to determine whether there was a day effect on accidents.
Model.UnstandardizedCoefficientsStandardized
Coefficients
Beta
tSignificance
BStandard Error
Constant1.0530.053 19.8850.000 ***
Tuesday−0.0550.075−0.018−0.7370.461
Wednesday−0.0790.075−0.026−1.0570.291
Thursday−0.0050.075−0.002−0.0640.949
Friday0.0070.0750.0020.0940.925
Saturday0.0760.0750.0251.0210.307
Sunday0.1240.0750.0401.6610.097 *
*** 1% significance level. * 10% significance level.
Table 3. ANOVA table in the model established to determine whether there was a day effect on accidents.
ModelSum of SquaresDfMean SquareFSignificance
Regression12.52362.0871.7860.098 *
Residual3407.01629151.169
Total3419.5392921
* 10% significance level.
Table 4. Demonstration of the data entry to the model created to determine whether a monthly effect existed on the accidents.
YearMonthly Accident NumbersJanuaryFebruaryDecember
201023100
201019010
201125100
201122010
201742001
Table 5. Table of coefficients in the model established to determine whether a monthly effect existed on accidents.
ModelUnstandardizedCoefficientsStandardized
Coefficients
Beta
tSignificance
BStandard Error
Constant24.8752.821 8.8160.000 ***
February−0.8753.990−0.029−0.2190.827
March5.3753.9900.1781.3470.182
April3.99010.7500.3562.6940.009 ***
May9.0003.9900.2982.2560.027 **
June8.7503.9900.2892.1930.031 **
July9.2503.9900.3062.3180.023 **
August10.2503.9900.3392.5690.012 **
September10.0003.9900.3312.5060.014 **
October9.1253.9900.3022.2870.025 **
November9.0003.9900.2982.2560.027 **
December9.0003.9900.2982.2560.027 **
*** 1% significance level. ** 5% significance level.
Table 6. ANOVA table in the model established to determine whether a monthly effect existed on accidents.
ModelSum of SquaresDfMean SquareFSignificance
Regression1354.28111123.1161.9330.046 **
Residual5349.3758463.683
Total6703.65695
** 5% significance level.
Table 7. The accident numbers by type.
TagNameAccident Numbers
1Head-On Collision386
2Rear Impact476
3Side-Impact Collision780
4Side-to-Side Collision63
5Hitting a Stationary Vehicle192
6Multiple Vehicle Collision155
7Multiple Hitting6
8Hitting Fixed Objects278
9Hitting Pedestrian412
10Animal Impact13
11Vehicle’s Rolling Over209
12Run-Off Road125
13Falls from Vehicles10
Table 8. The number of accidents by vehicle type.
Vehicle TypeAccident Numbers
Bicycle27
Moped101
Motorcycle910
Automobile2227
Minibus181
Van592
Truck135
Towing vehicle60
Bus198
Tractor1
Land vehicle67
Special purpose vehicles16
Heavy-duty vehicles8
Ambulance5
Tanker1
Tram0
Other4
Table 9. Accidents number information of streets with a high number of accidents.
Street NameYear 2010Year 2017Total Accidents
(2010–2017)
Büyükdere Street4975428
İstinye Bayırı Street263154
Tarabya Bayırı Street1119125
Hacı Osman Bayırı Street10786
Katar Street01360
Demokrasi Şehitleri Street0331
Table 10. Analysis of traffic accidents in Sarıyer district by years using Getis Ord Gi* method.
YearsZ Value (GİZ)p Value (GİP)
201014.4138870.000000
201119.8702660.000000
201222.1649950.000000
201312.8292410.000000
201414.8749690.000000
201518.0443140.000000
201619.4348220.000000
201719.8973180.000000
All Accidents (2010–2017)22.3723270.000000
Table 11. Analysis of traffic accidents in Sarıyer district by year, according to Anselin Local Moran’s I (LISA) Spatial Autocorrelation method.
YearsZ Value (GIZ)p Value (GIP)I Value
201014.2483230.0000000.355753
201119.6731760.0000000.519560
201221.9350200.0000000.582134
201312.6885040.0000000.323909
201414.6807760.0000000.373939
201517.8353260.0000000.467030
201619.2346220.0000000.504213
201719.6744420.0000000.517736
All Accidents (2010–2017)22.1238360.0000000.583412
Publisher’s Note: MDPI stays neutral with regard to jurisdictional claims in published maps and institutional affiliations.

