Article

A Study on the Application of the Safety Practice Index to Reduce Safety Accidents in the Manufacturing Industry

1
Graduate School of Safety Engineering, Incheon National University, Incheon 22012, Korea
2
Department of Central Safety Technology, Korea Industrial Safety Association, Incheon 21315, Korea
3
Fire Disaster Prevention Research Center of Safety Engineering, Incheon National University, Incheon 22012, Korea
*
Author to whom correspondence should be addressed.
Sustainability 2021, 13(19), 10990; https://doi.org/10.3390/su131910990
Submission received: 25 August 2021 / Revised: 23 September 2021 / Accepted: 27 September 2021 / Published: 3 October 2021
(This article belongs to the Special Issue Sustainable Safety Development)

Abstract

:
Human casualties caused by industrial accidents pose a serious threat to corporate management due to the continual strengthening of safety laws as well as changes in the public’s awareness of corporate social responsibility. Accordingly, companies are raising safety awareness among employees by regularly conducting on-site safety activities and training to prevent industrial accidents. However, the safety activities, education, and training of many companies are not carried out voluntarily or in practice by their employees, but mostly through formal implementation. To break away from these customary and passive behaviors and establish a mature safety culture, it is crucial to strengthen the execution capacity of safety management in the field; to this end, we plan to utilize the safety practice index (SPI). The safety practice index (SPI), which quantitatively represents the degree of safety practice, is necessary to increase the effectiveness of safety management for the purpose of preventing accidents. In this study, the correlation was verified by comparing the SPI calculated based on the 2018 and 2019 risk management and the safety activity results of manufacturer A with the reported safety accidents. It was also effective in improving the SPI and reducing safety accidents in 2020 by supplementing the weaknesses of the SPI in 2018 and 2019. According to the results of this study, SPI can be used as an effective indicator for safety accident prevention activities by supplementing weaknesses with strengths through strengthening leadership and safety policies, such as classifying and managing the safety management level of a specific period or department.

1. Introduction

According to a CNBC (Consumer News and Business Channel) analysis of the economic outlook report released by the World Monetary Fund (IMF), South Korea, which ranked 12th in 2019, ranked 10th in the world in terms of nominal gross domestic product (GDP) after the outbreak of COVID-19 [1]. Meanwhile, the number of industrial accidents in Korea has been steadily increasing in proportion to its economic growth, from 89,848 in 2017 to 102,305 in 2018, and again to 109,242 in 2019.
In addition, the number of deaths from work accidents was 964 in 2017, 971 in 2018, and 855 in 2019, representing the highest level among OECD countries each of the years [2]. Accidents in these industrial sites are not only associated with economic losses but are also problems in which human dignity is not being respected, and safety in the workplace is a basic right that must be protected. Table 1 lists the safety and health laws that different countries (G5) have passed in an attempt to prevent occupational accidents. In this regard, South Korea has strengthened the level of punishment given to companies that have experienced serious industrial accidents by enacting the ‘Serious Accident Corporate Punishment Act (effective on 27 January 2022)’ to prevent serious industrial accidents.
In addition, the UK has enacted the ‘Corporate Manslaughter and Corporate Murder Act (effective on 6 April 2008)’, which imposes unlimited fines on companies that have caused fatal accidents. Table 2 shows the legal punishment criteria for serious accidents in South Korea and the UK [3].
Despite such strengthened safety and health regulations, there is a limit to how many occupational accidents can be reduced solely through state supervision and regulation, and there is an urgent need for companies to make voluntary efforts to prevent occupational accidents [4]. The main cause of continuous safety accidents in companies has been determined to be the continuous repetition of unsafe acts, such as (1) neglecting unsafe conditions, (2) work methods, or (3) poor wearing of protective equipment [5]. This is proof that safety activities are either not being properly carried out in the field or are not being carried out effectively. As such, according to the DuPont Bradley Curve, the current level of domestic manufacturers appears to be at the level of ‘supervision dependent’, where employees’ voluntary safety practices are insufficient [6,7,8,9,10]. Safety practices in the field increase the effectiveness of safety management, and the results are shown in the form of safety performance, which is reported to be a key factor in the evaluation of a workplace’s safety culture [11].
In a related study, in 1999, Jones reported that accidents resulting from ‘unsafe behavior and unsafe conditions’, as opposed to safe practices, disrupt or impede the flow of production activities, regardless of the actual losses [12]. In 2004, Chen and Yang proposed the development of a predictive risk index based on unsafe acts and unsafe conditions in process industries, and they used this index as a safety performance indicator. It was reported to be effective in predicting the occurrence of accidents in advance by predicting the risk according to the geometric mean of the risk probability, the frequency of occupational exposure, the number of risk persons, and the estimate of the maximum possible loss [13]. In 2016, Fruggiero reported that workplace safety practice increased productivity by reducing the cost of preventing accidents and managing performance reductions in production activities [14]. In 2016, In-gie Hong, in a study examining safety culture evaluation methods, showed that an electronic company neglected safety management in favor of production management, quality control, and cost reduction. In particular, the results showed that safety awareness did not lead to actual field participation due to negative or passive attitudes regarding most safety and health activities, such as discovering potential risks and reporting near-miss accidents [15]. In 2018, Ebrahim analyzed various risk factors such as ‘probability at risk’, ‘frequency of work exposure’, ‘number of persons at risk’, and ‘severity of consequence’ according to unsafe act and condition observations through work observation in the steel industry. Based on this, a customized predictive risk index was calculated, and the occurrence of safety accidents was predicted in advance [16]. In 2018, the CCPS (Center for Chemical Process Society) stated that safety management indicators can be classified into three types of indicators: lagging metrics, near-miss metrics, and leading metrics. It has been reported that leading metrics can be a forward-looking indicator of safety management performance and help prevent potential accidents [17]. In 2020, Pam Walaski recommended discontinuing the use of lagging indicators based on the outcome of accidents, such as the number of incidents, incident rate, and lost time rate, because of their insufficient preventive effect [18,19,20,21]. It was also recommended that companies introduce leading indicators such as participation rate in various safety activities such as safety education, risk assessment, unsafe act inspection, and high-risk improvement to prevent accidents [22,23,24]. The previous studies described above are expected to be useful in predicting safety accidents through unsafe act and condition observations and allowing for advance warning of possible risks in the workplace. However, either these studies merely warn of the risk of accidents, or their applications are limited to specific industries such as chemical and process industries. Therefore, quantitative and systematic safety management based on the Safety Practice Index (SPI) is required to reduce safety accidents in the manufacturing industry.
In this study, repetitive factors for unsafe acts, which represent a major cause of safety accidents, were classified into: (1) lack of safety awareness among members and (2) insufficient safety management system establishment for risk factors. To calculate the safety practice index (SPI), the safety activity index (SAI) was derived from safety activity participation, and the risk management index (RMI) was derived from the risk management level. SAI and RMI can be derived as a geometric mean of each detailed item, and SPI is expressed as the product of SAI and RMI. After classifying the calculated SPI into four grades and grading the safety practice level (SPL), the correlation was verified by comparing the SPI measurement results in ‘18 and ‘19 with safety accidents. After that, SPI was improved in ‘20 by supplementing the weaknesses of the SPI measurement results in ‘18 and ‘19 and proved effective in reducing safety accidents. As a result, it was confirmed that the SPI rating can be used as a quantitative indicator for accident prevention, and it was found to be effective.

2. Methods of Research

The selection of the target industry for this study was based on the 2019 industrial accident status analysis data, which is data provided by the Ministry of Employment and Labor [5]. Figure 1 illustrates the sequence of this study. The selection of safety activity and risk management items, which are evaluation items, was conducted through an interview with a workplace safety manager.
The field survey was conducted in a ‘metal and mechanical products manufacturing workplace’ where the author could directly conduct a field survey. Safety practice items were considered to be universally applicable to manufacturers. The selected safety activity items were safety education (SEd), emergency drills (EDr), and safety events (SEv), while the selected risk management items were risk assessment (RAs), high-risk improvement (HRi), and unsafe act (UAc). The applied index was calculated as safety activity index and risk management index from field survey items, and the safety practice index (SPI) was expressed by multiplying these two indices. In this study, the safety practice level (SPL) was assigned after introducing the quantified safety practice index (SPI) according to Figure 1.

2.1. Selection of the Research Target Industry

The selection of industries was conducted by pre-investigating 13 manufacturing industries according to the Ministry of Employment and Labor industry classification criteria based on the Korea Standard Industry Classification Table of the National Statistical Office. Table 3 lists the top four industries with more than 300,000 workers among the top five manufacturing industries with frequent accidents in 2019.

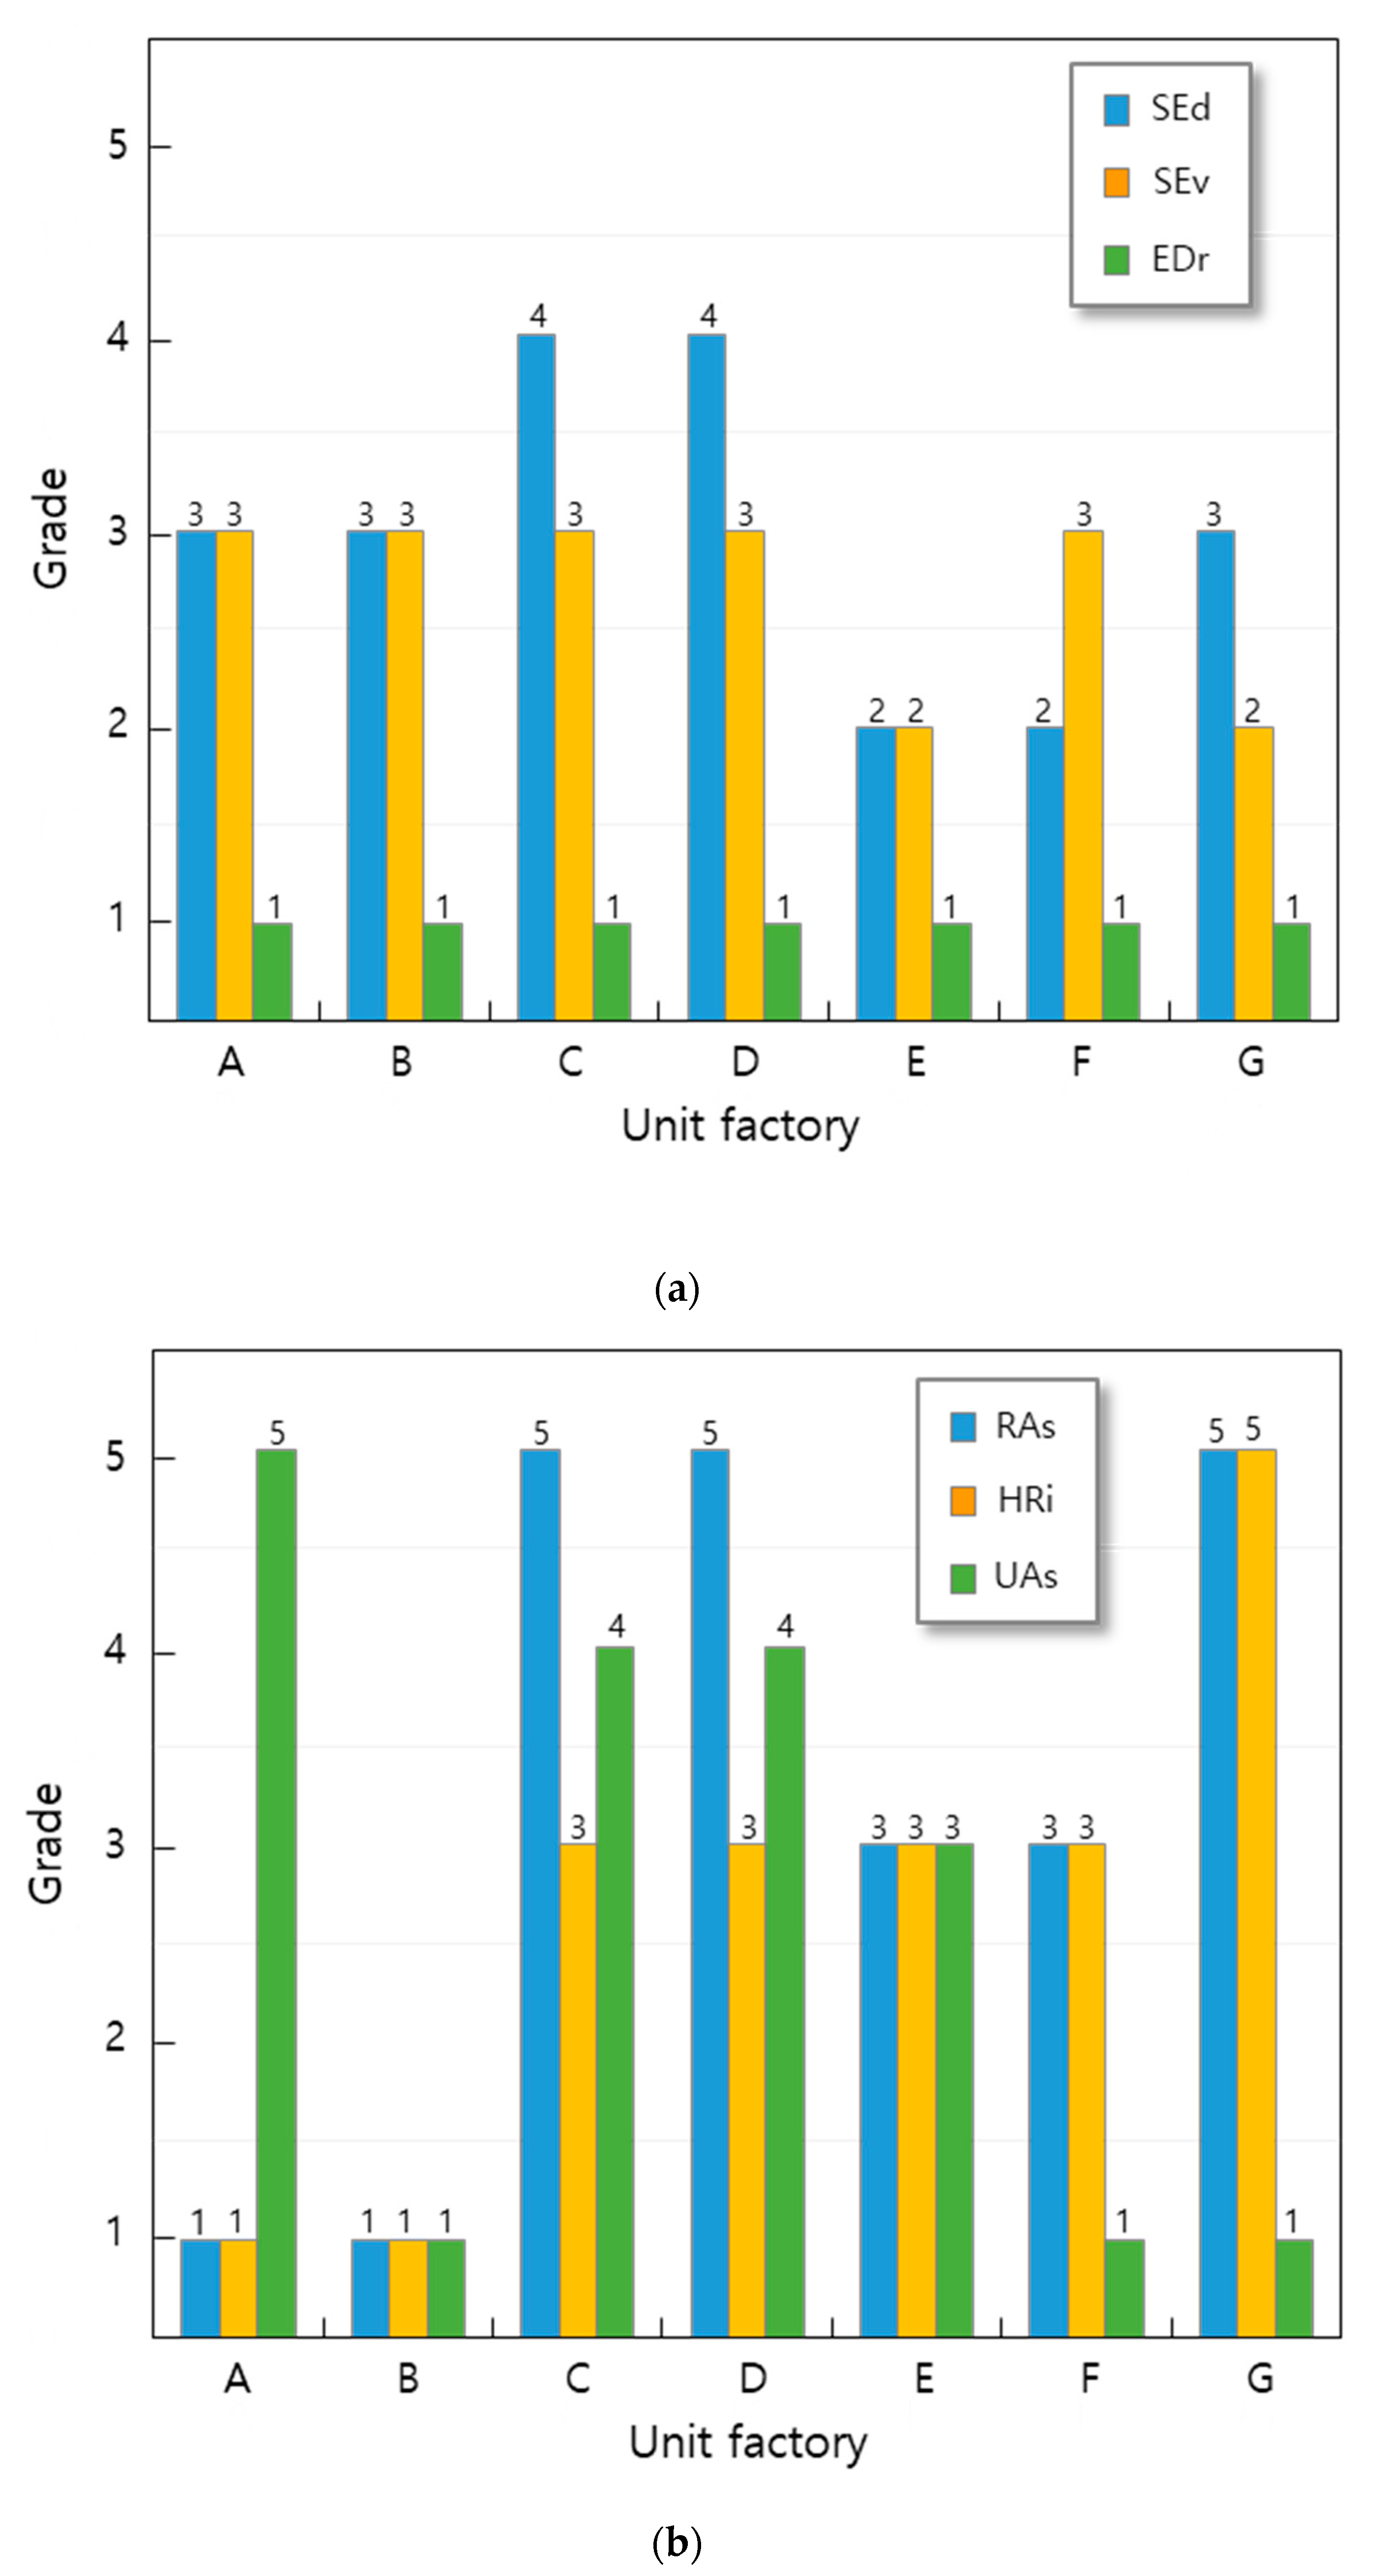
2.2. Safety Activity Group Selection and Safety Activity Index (SAI) Calculation

The safety activity group selected this as an item that is being implemented in each of the four workplaces and can be investigated for universal usage in the manufacturing industry. Table 4 presents the safety activities implemented by each workplace, and safety education (SEd), safety event (SEv), and emergency drill (EDr) were identified as common items and therefore selected as safety activity groups. Traffic enforcement, safety proposal, and mentoring among the surveyed items were implemented in a limited manner at the workplace, so they would be inappropriate as part of a general safety activity group. The detailed items for calculating the safety activity index were set as shown in Table 5, and a quantified scale of safety activity participation was calculated.
The safety activity index (SAI) calculation was graded according to Table 6. ‘Criteria of grade for safety activity items’ after the calculation of the ratio for each item above. The applied grades were divided into five grades by setting the equal interval scale based on the highest and lowest levels that the workplace aims to achieve. This grading is essential for index calculation because indexing is not possible if the interval between management items is different or if the reference value is different [13]. The safety activity index (SAI) of the workplace was defined as the geometric average value by calculating the safety education (SEd), safety event (SEv), and emergency drill (EDr) ratio (%) for the grade average for each item, and the safety activity index (SAI) applied to this study is expressed as shown in Equation (1).
Safety   activity   index   ( SAI ) = (   SEd   ×   SEv   ×   EDr   ) 3
where SEd: Safety education, SEv: Safety event, EDr: Emergency drill.

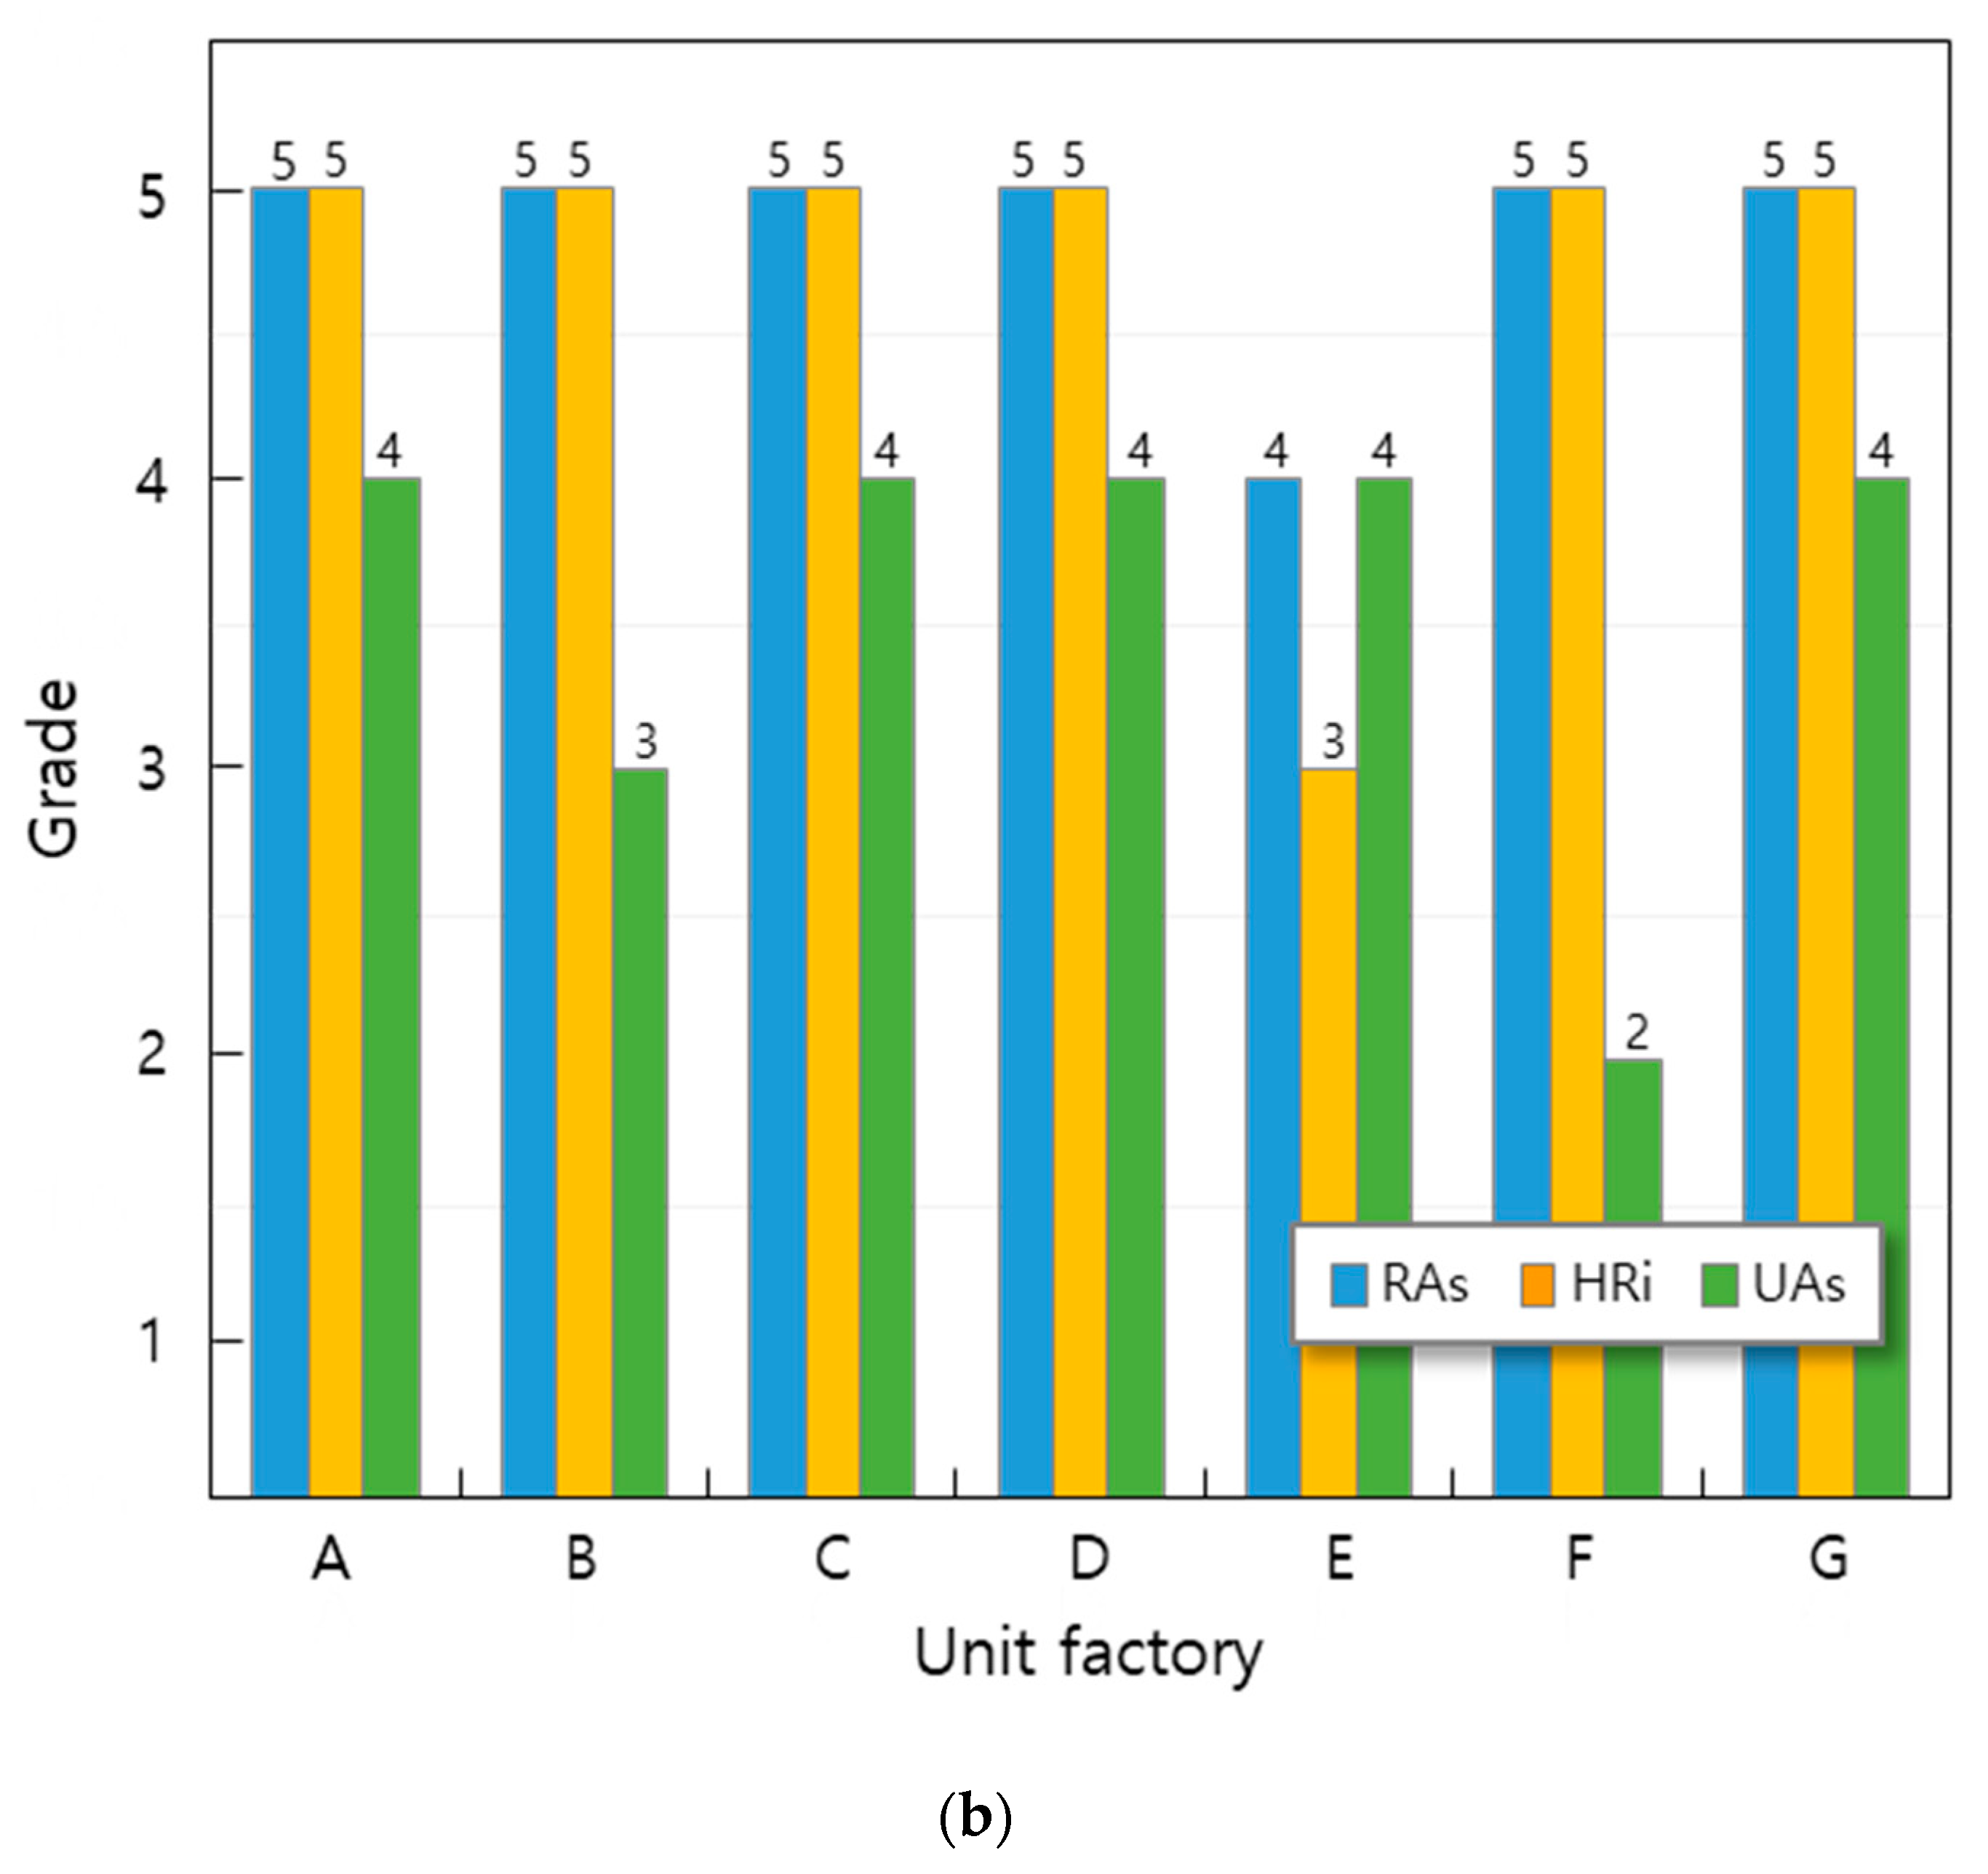
2.3. Risk Management Group Selection and Risk Management Index (RMI) Calculation

The risk management group selected this as an item that is being implemented in each of the four worksites and can be investigated for universal usage in the manufacturing industry. Table 7 details the risk management strategies implemented by each investigated workplace. Risk assessment (RAs), high-risk improvement (HRi), and unsafe act (UAc) were identified as common items, and thus the risk management group was selected. Among the items under investigation, labor joint inspection, subcontractor joint inspection, and My safety check were implemented in a limited manner at the workplace, so they were inappropriate for selection as part of a general risk management group. The detailed items of the group for calculating the risk management index were set as presented in Table 8, and a quantified scale of risk management level was then calculated.
The risk management index (RMI) was calculated according to the rating criteria table in Table 9 after calculating the ratio for each item above. The applied grades were classified in the same way as the safety activity index, and the average of the grades for each item was calculated by calculating the risk assessment (RAs), high-risk improvement (HRi), and unsafe act (UAc) ratio (%), after which the ‘Risk management index (RMI)’ was expressed as a geometric average value. Among unsafe acts and unsafe conditions, only unsafe acts were considered in this study in an attempt to focus on human factors in accordance with this study’s purpose of improving the level of safety practice. This consideration made it possible to make a qualitative comparison for each factory and each workplace without reflecting unsafe conditions because each factory or workplace has different machine and facility conditions. Equation (2) represents the risk management index (RMI) used in this study.
Risk   management   index   ( RMI ) = (   RAs   ×   HRi   ×   UAc   ) 3  
where RAs: Risk assessment, HRi: High-risk improvement, UAc: Unsafe act.

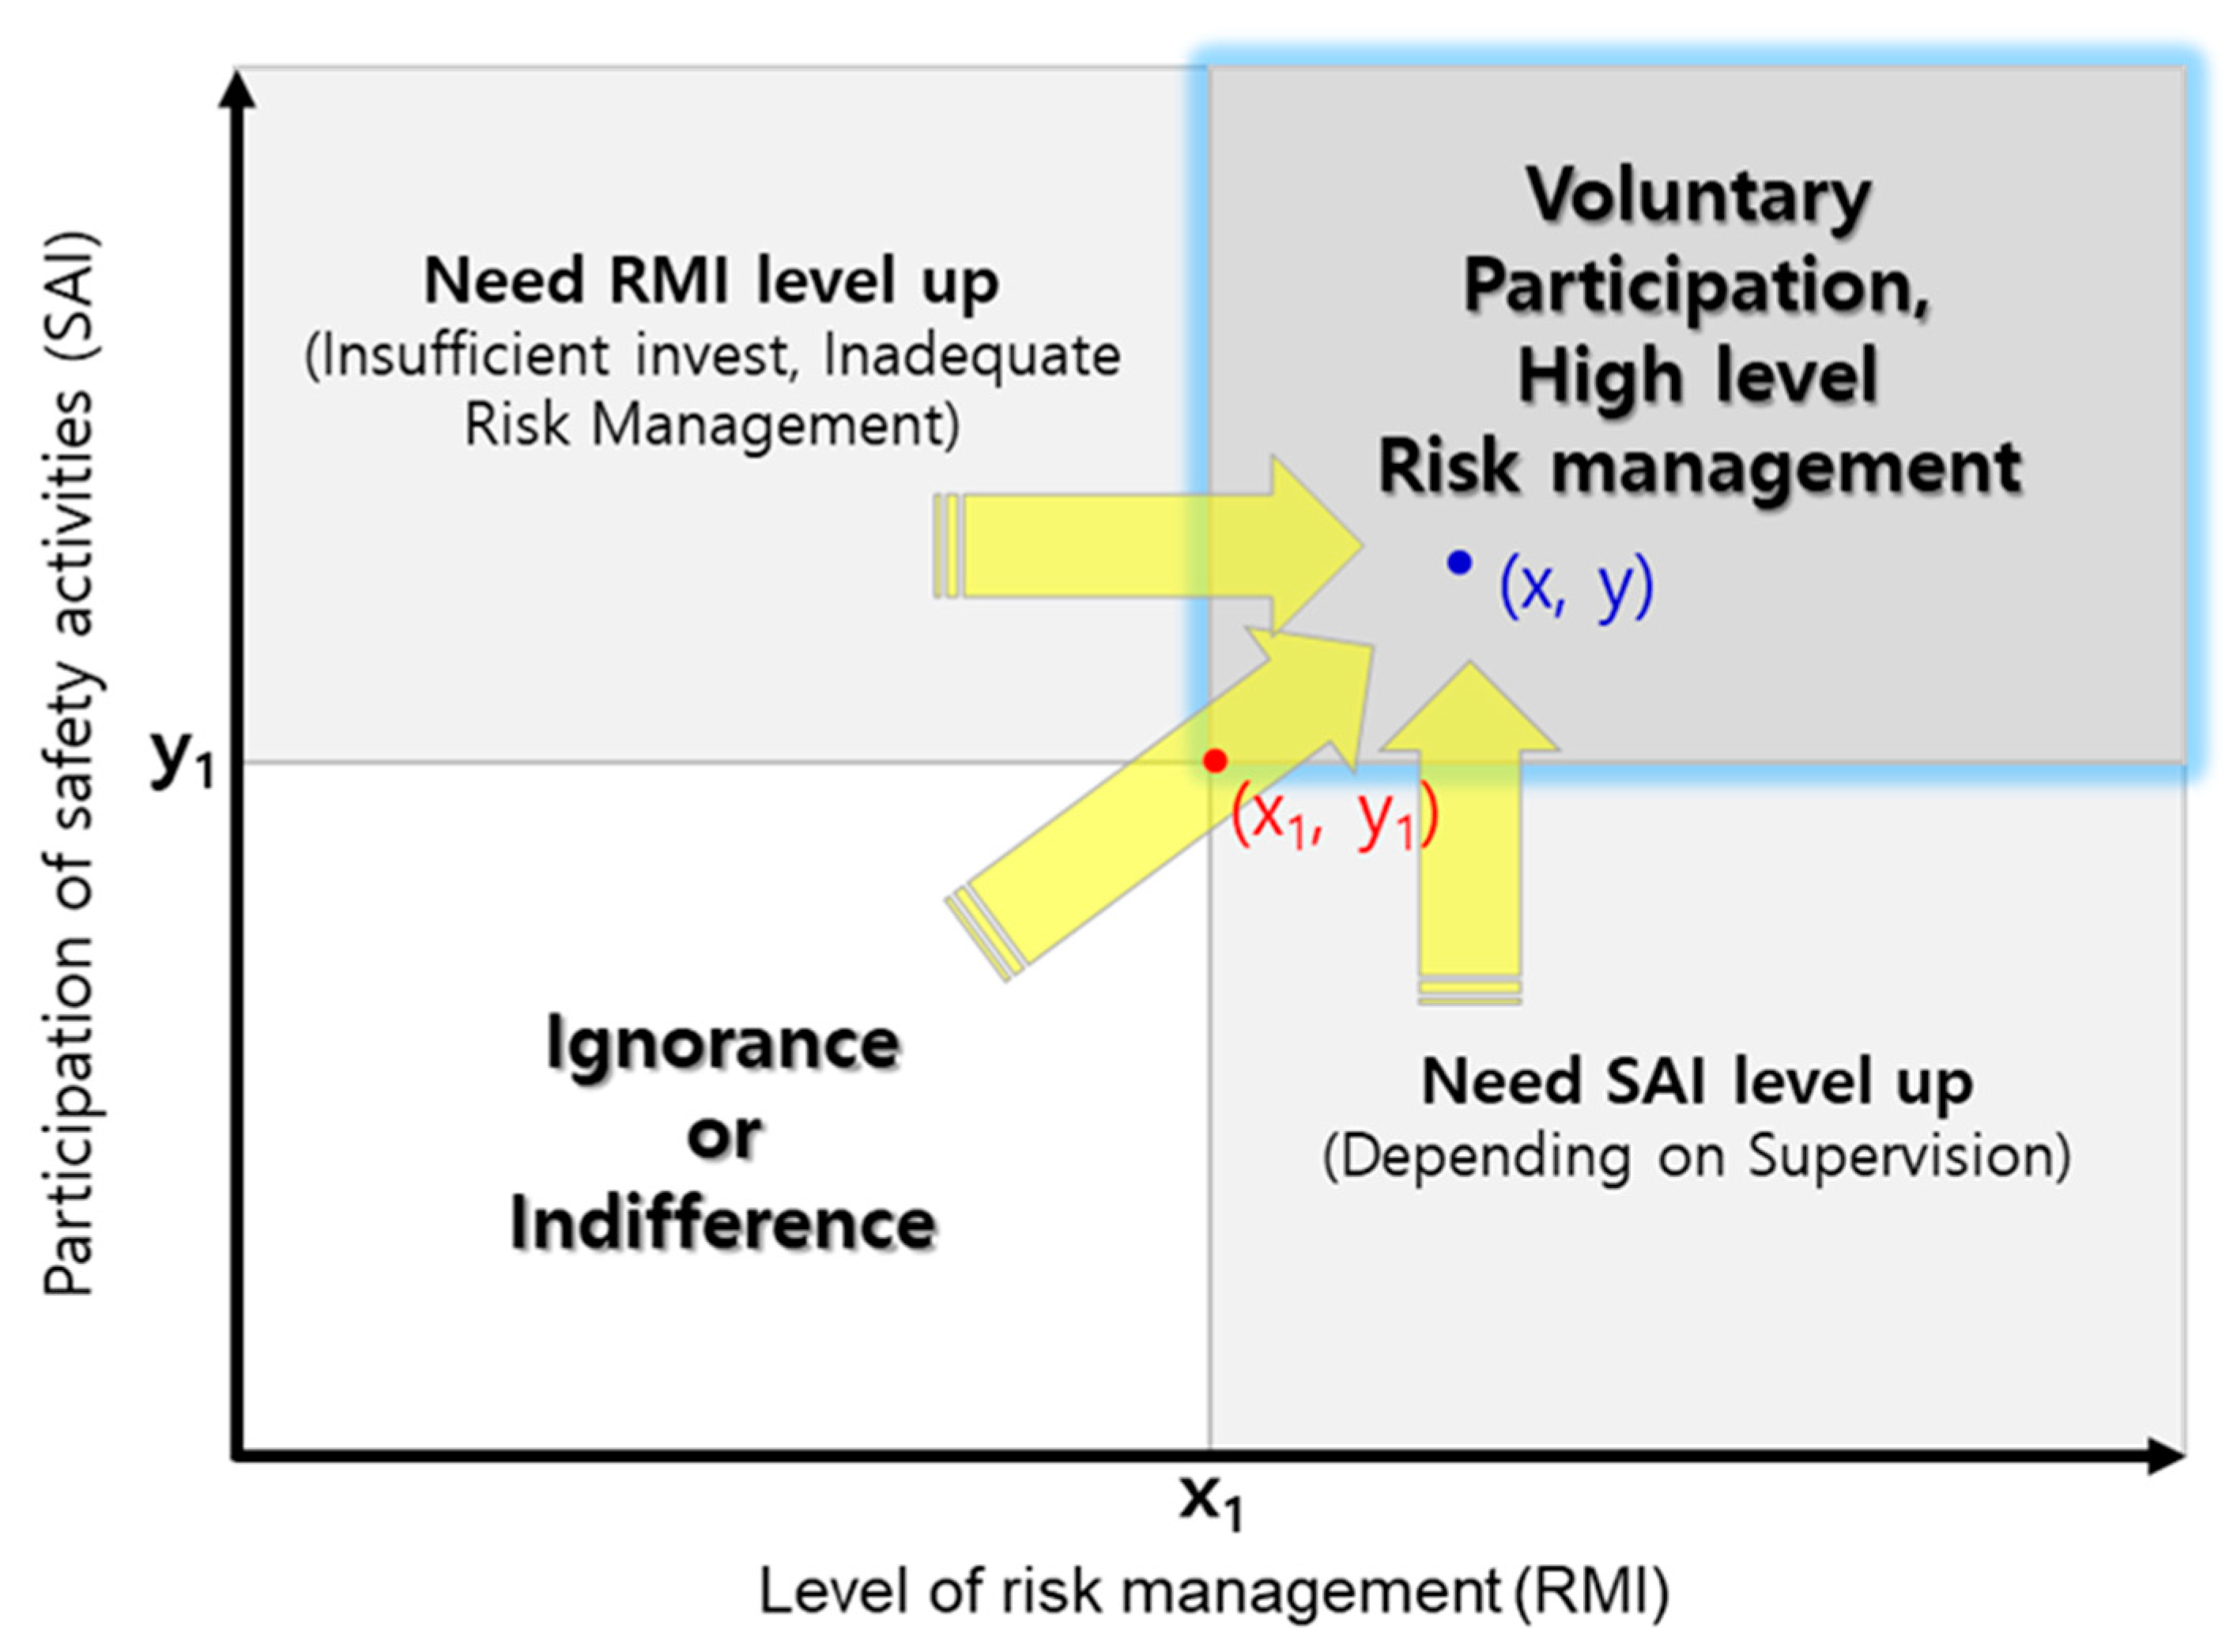
2.4. Safety Practice Index (SPI) Calculation

The safety activity and risk management item-specific measurements are calculated by each arithmetic formula, and the grades corresponding to the measurements are then determined. In Equations (1) and (2), each index was applied as a geometric average rather than an arithmetic average because the items of each index are related to each other rather than being completely independent. The application of geometric average is used as a typical method to estimate the overall size of each item and to more appropriately reflect the average of various factors [25,26,27]. The safety activity and risk management items used in this study are common items that can be universally used in the accident-prone manufacturing industry. Therefore, the type of item and the grading criteria for each item can be adjusted according to the type of business, the characteristics of the workplace, and the management purpose. A more detailed analysis can be conducted by considering the geometric average of all items applied to the safety practice index (SPI) by adding more items. The safety activity index (SAI) and risk management index (RMI) represent the practice measures of the relevant items by themselves. In this study, the safety practice index (SPI) was defined as the product of SAI and RMI, and it is expressed as shown in Equation (3).
SPI = SAI × RMI
Figure 2 shows a conceptual diagram of SPI. Equation (3) calculated from the (x, y) point in Figure 2 becomes the size of the SPI, and after reflecting SAI and RMI as optional indices, it is possible to determine the current scale by quantifying it as SPI.
For the coordinates (x, y) to enter the ‘voluntary participation, high-level risk management’ area of Figure 2, they must be managed above the (x1, y1) points, the RMI and SAI targets of the workplace. Moreover, items that are less than (x1, y1) points should be improved intensively and more than (x1, y1) points. In other words, when the RMI or SAI is low, there is an advantage in that it is possible to suggest an improvement direction so that the SPI can be increased by intensively improving the insufficient items.

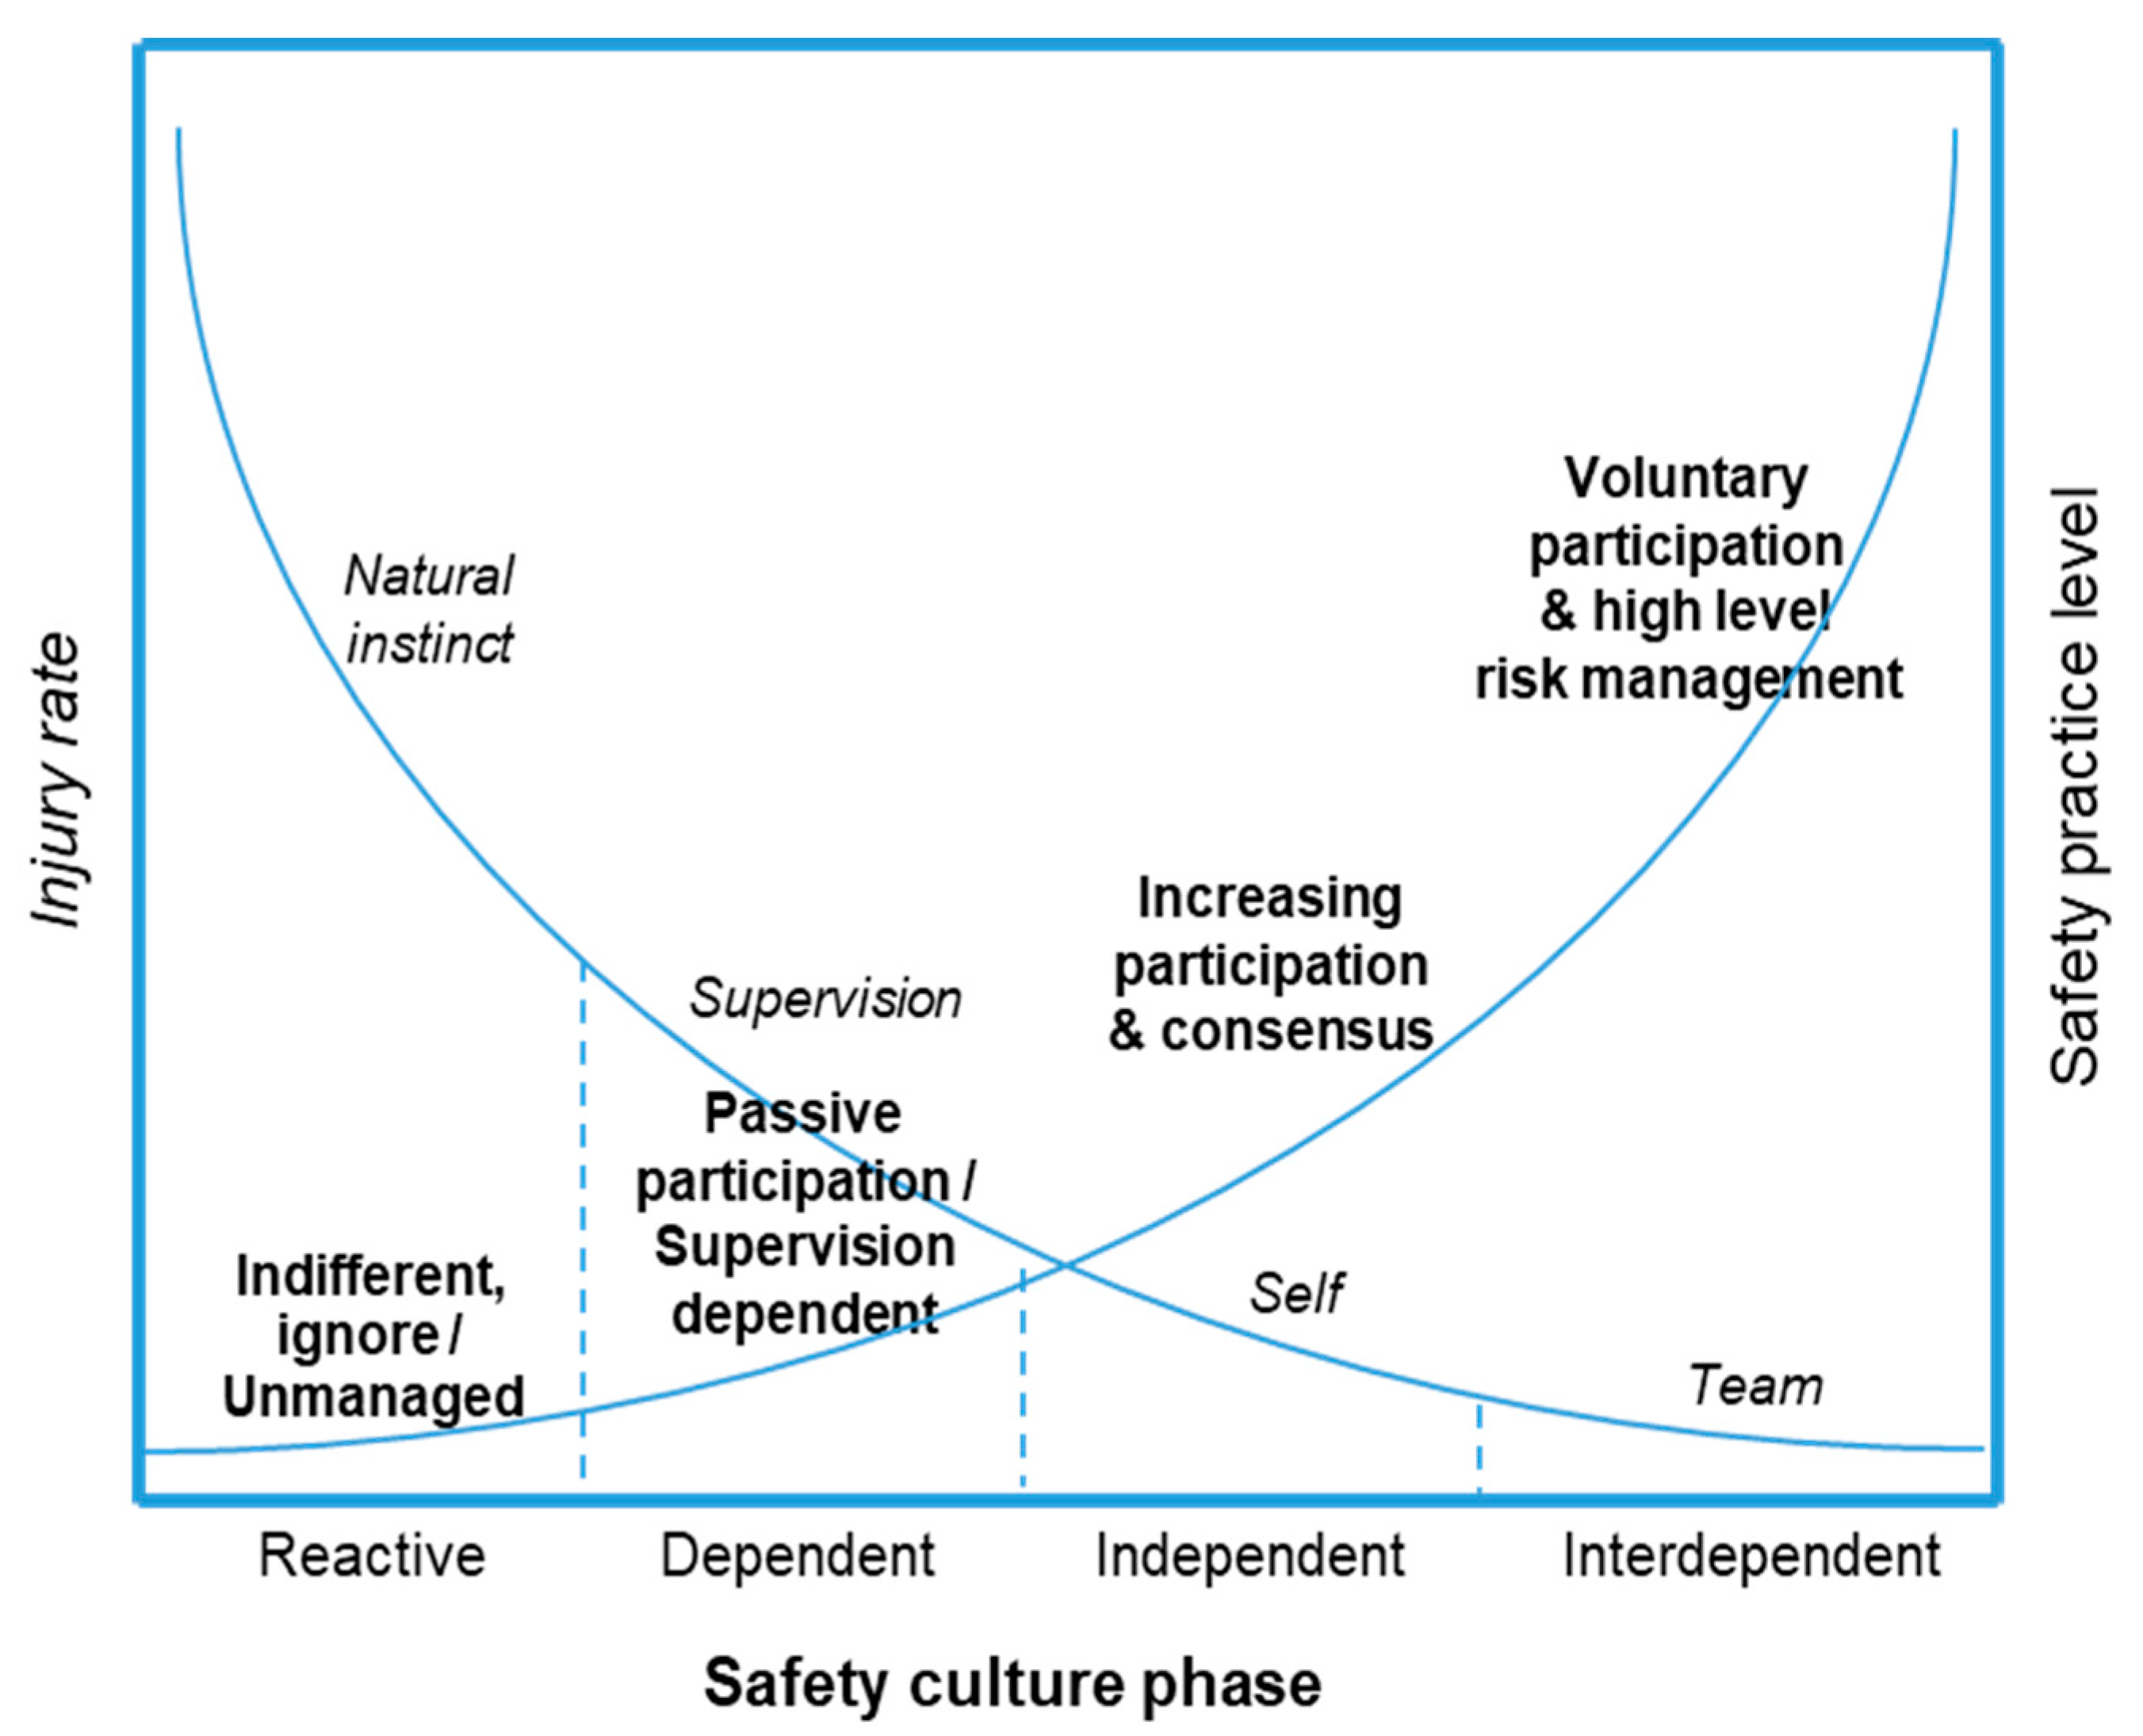
2.5. Safety Practice Level (SPL) Grading

Figure 3 shows the Bradley curve (Dupont, 1995), and the safety culture was divided into 1 stage reactive, 2 stage dependent, 3 stage independent, and 4 stage interdependent [6]. In this study, the safety culture stage of the Bradley curve was introduced and the safety practice level was classified into four grades. To gain more insight into the safety practice index, grouping and averaging by index are necessary. Therefore, in this study, the safety practice index (SPI) for each unit plant measured in Equation (3) was graded according to ‘Table 10. Safety practice level grade criteria’. Grade I is ‘less than 4’, which is set to ‘indifferent to or ignoring safety activity and risk is not managed’, grade II is ‘4 to 8’, which is set to ‘passive participation and supervision-dependent’, grade III is ‘8 to 12’, which is set to ‘increasing participation and consensus’ and grade IV is ‘12 to 16’, which is set to ‘voluntary participation and high-level risk management’. The equal interval scale was applied to classify the SPI index by grade, and the SPL determination was defined in consideration of the safety activity participation and the risk management level.

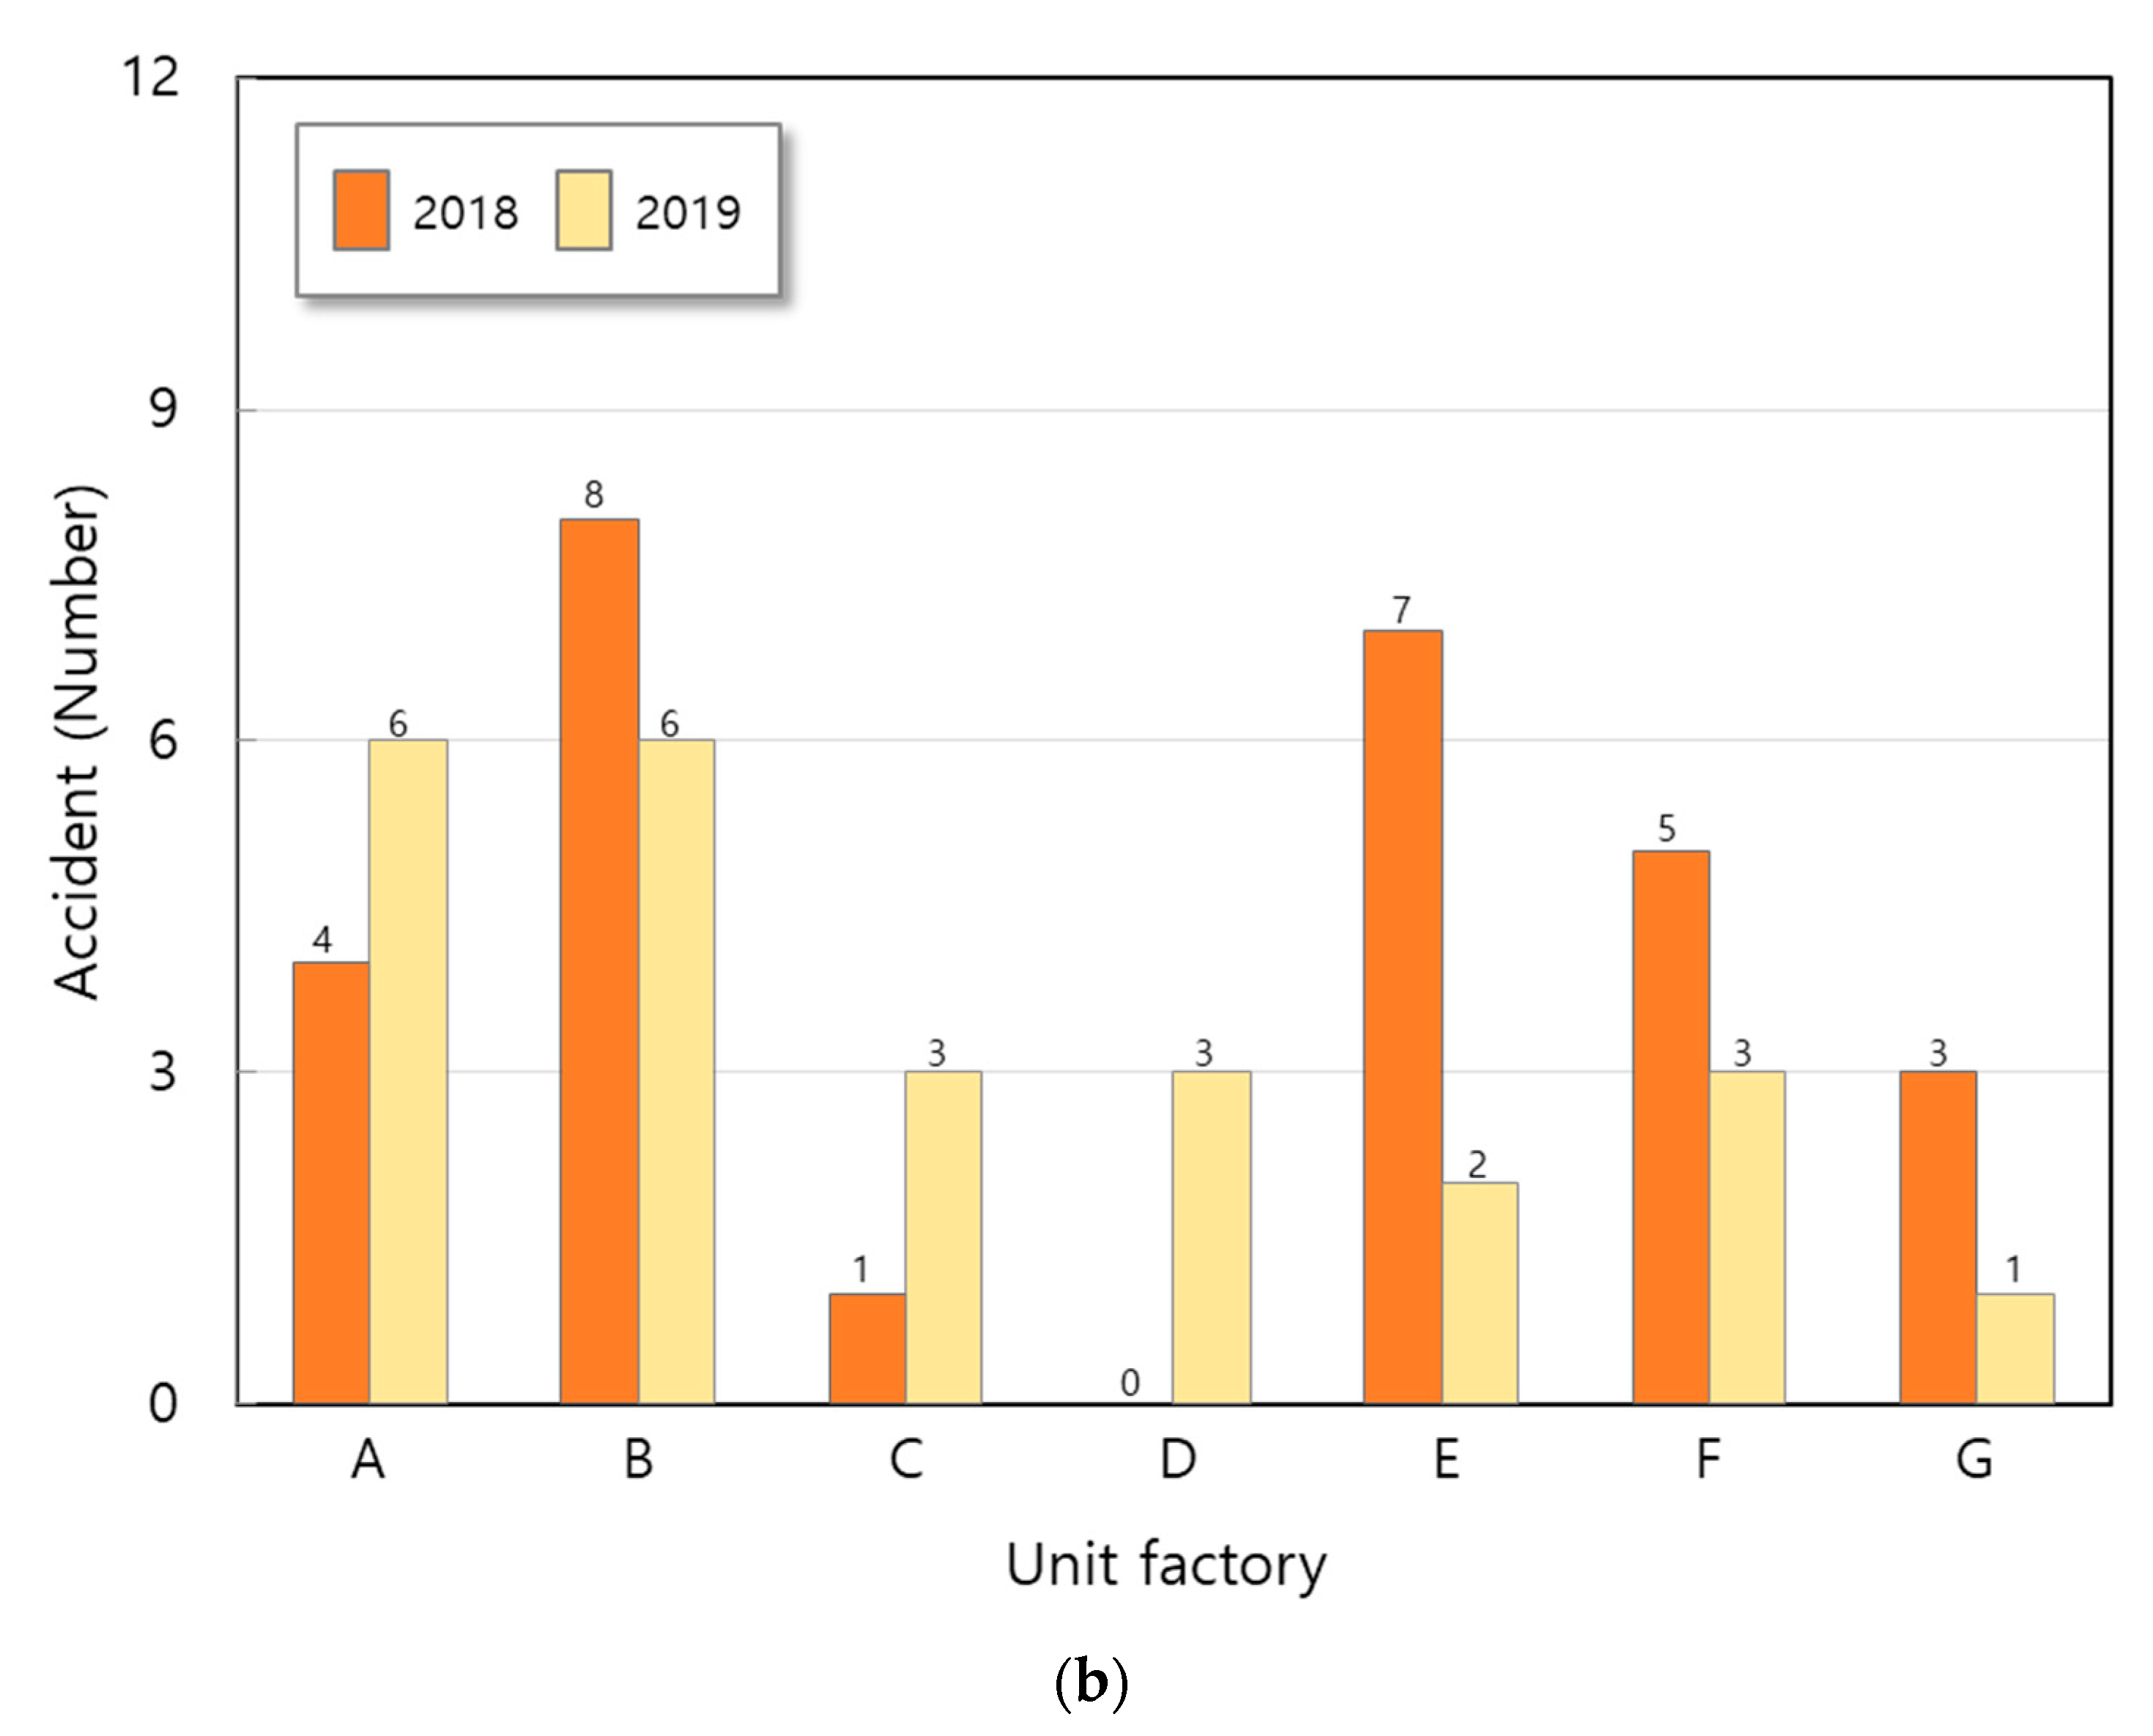
3. Consideration of Application Cases

The feasibility was verified by applying the quantitative evaluation of safety culture scale and safety improvement in this study to the field for company A. Table 11 presents the status of the unit factory in Company A. Company A is considered to be suitable for the evaluation of this study as it involves seven unit factories that are independently operated and which apply different safety management techniques.
To verify the correlation between the SPI calculation result and safety accidents, the statuses of safety accidents in ‘18 and ‘19 were analyzed using the evaluation suggested in this study for unit factories A to G in the workplace applied to the case study. The ‘20 evaluation proved the effectiveness of the SPI application by analyzing changes in the occurrence of safety accidents after intensively strengthening the items that were insufficient in the ‘18 and ‘19 SPIs.

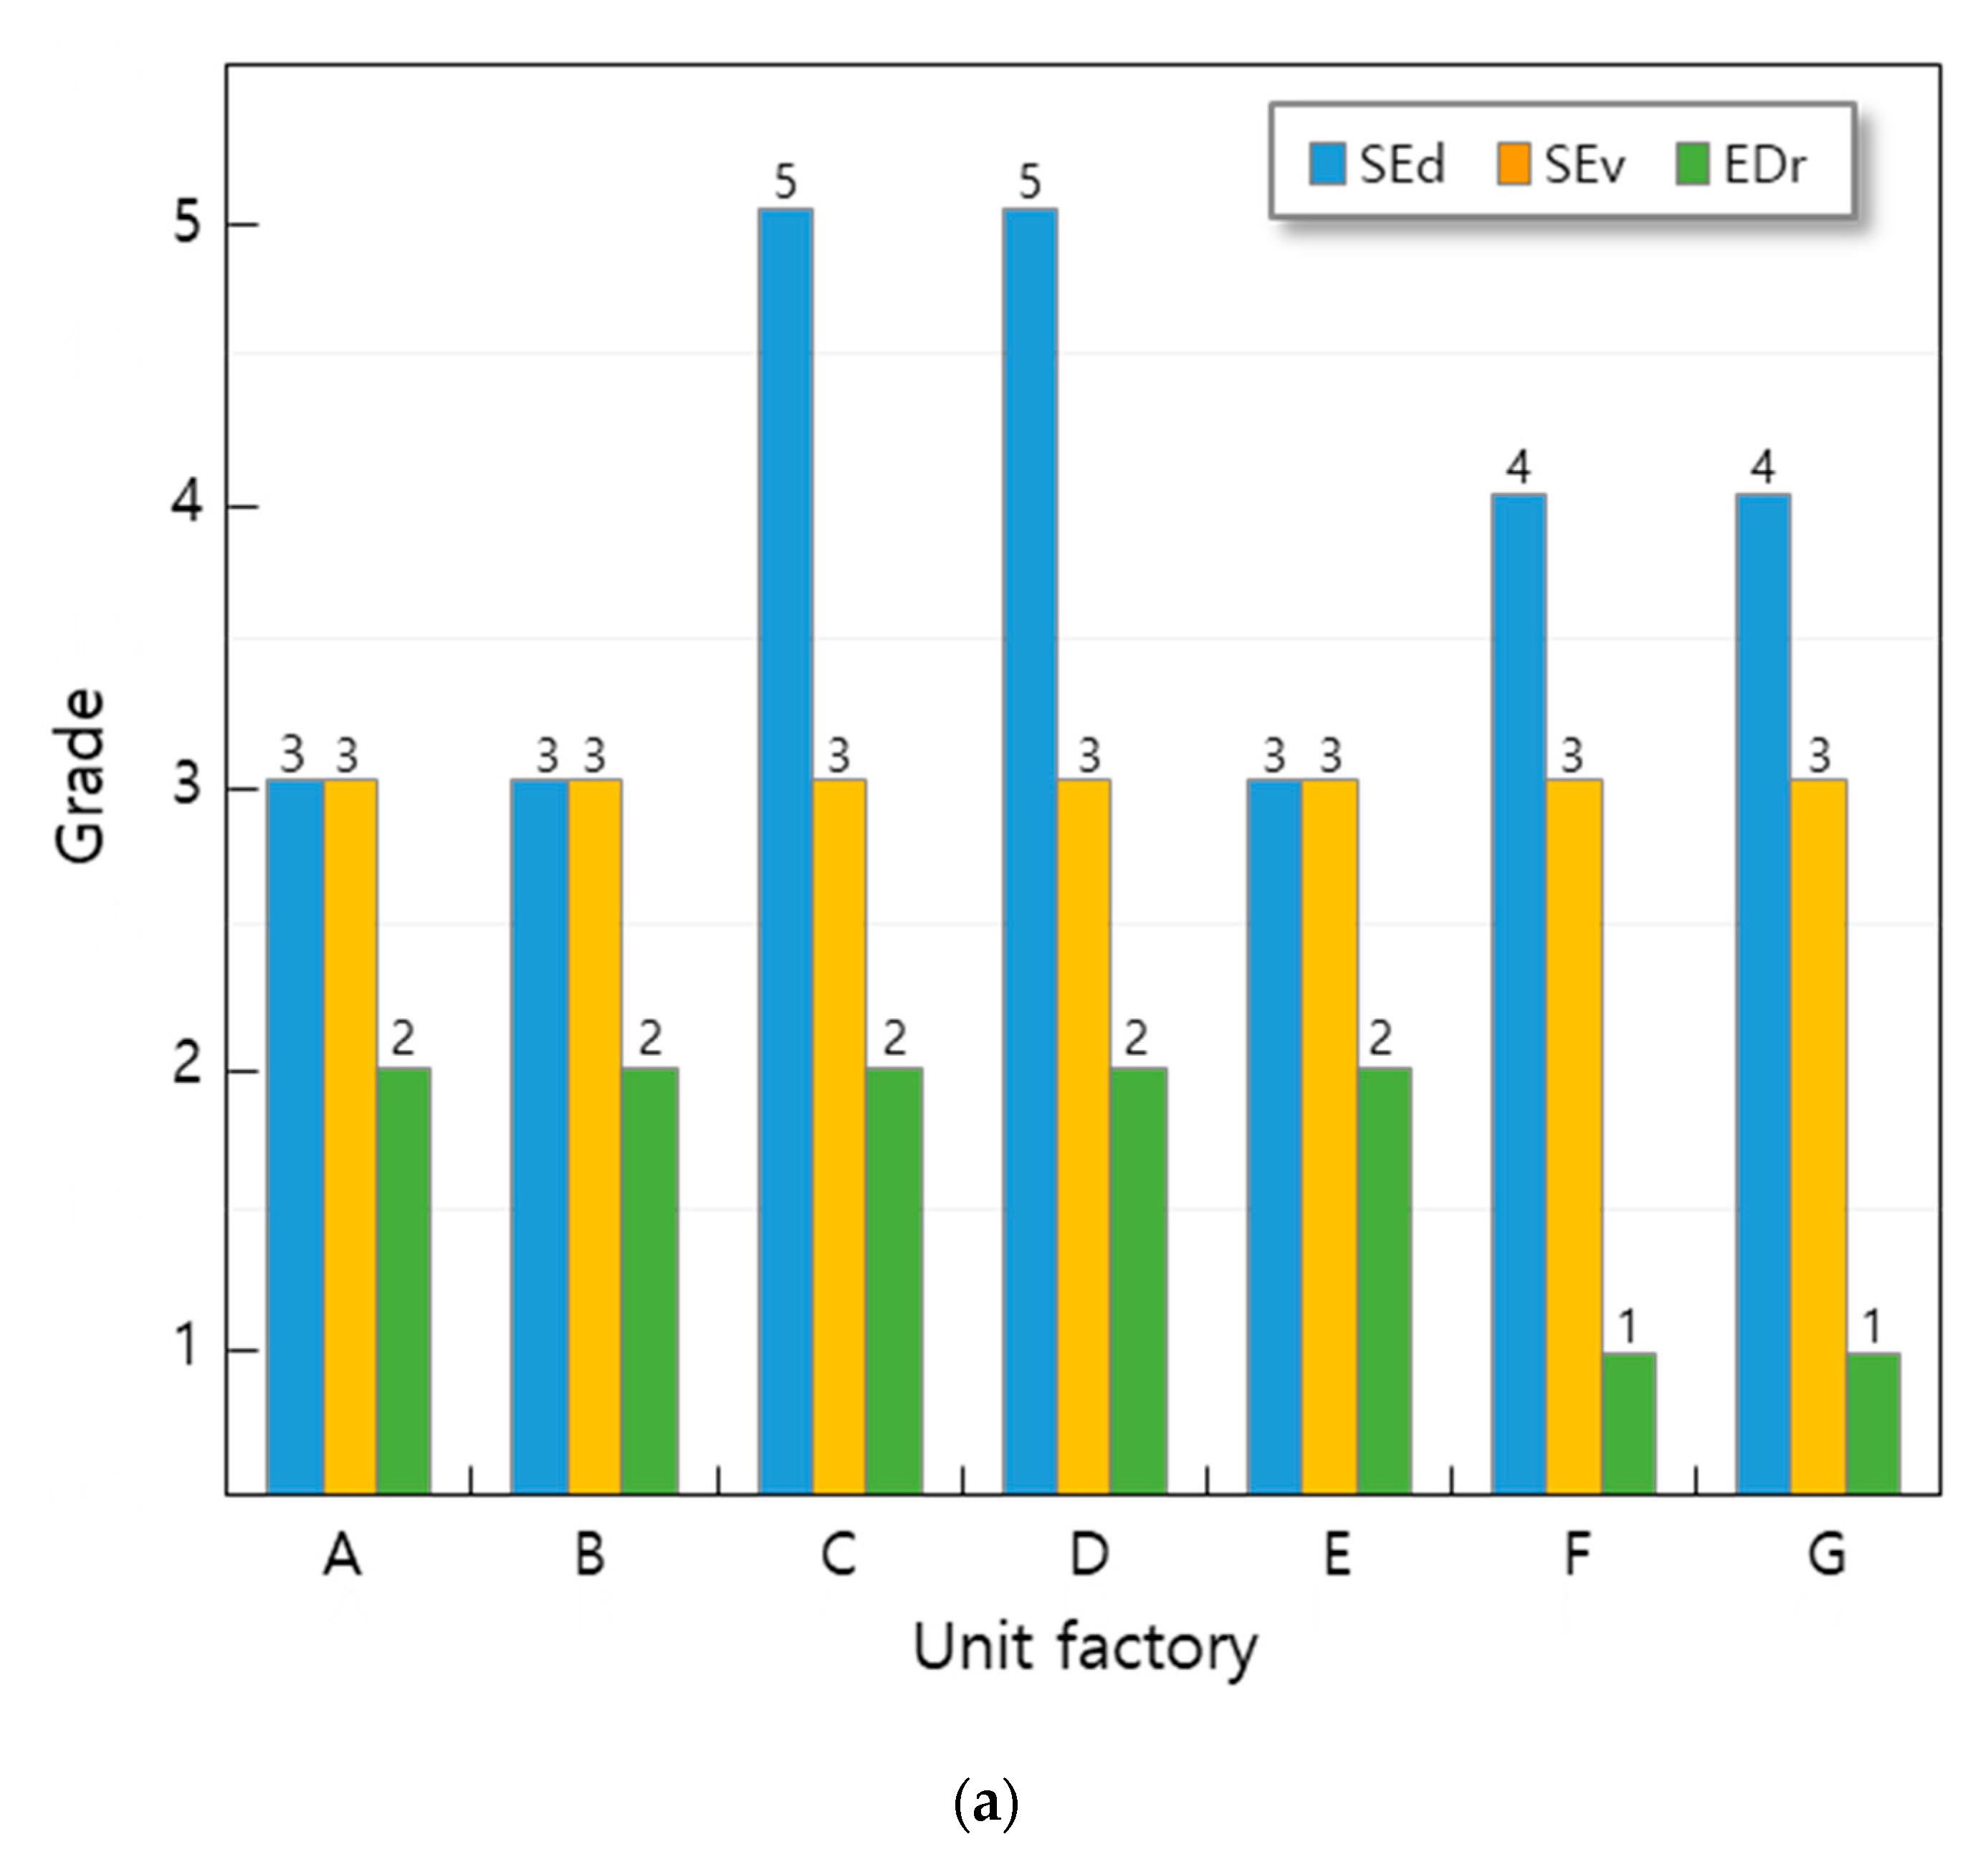
3.1. ’18 Safety Practice Index (SPI)

The safety activity and risk management detail items for each unit plant in 2018 were measured as presented in Table 12 and the results are shown in Figure 4.
The average grade for each item was measured as safety education (SEd) 3, safety event (SEv) 2.71, emergency drill (EDr) 1, risk assessment (RAs) 3.29, and both high-risk improvement (HRi) and unsafe act (UAc) 2.71. Therefore, the results of calculating the safety activity index (SAI) and risk management index (RMI) are as follows:
  • SAI = ( SEd × SEv × EDr ) 3 = ( 3 × 2.71 × 1 ) 3 = 2.01
  • RMI = ( RAs × HRi × UAc ) 3 = ( 3.29 × 2.71 × 2.71 ) 3 = 2.89
The result of calculating the safety practice index (SPI) by the product of the two indices (SAI, RMI) measured according to Equation (3) is as follows:
SPI = SAI × RMI = 2.01 × 2.89 = 5.81
The SPI calculation results for each unit factory were measured as presented in Table 12 and the results are shown in Figure 5a; the results are also compared with Figure 5b, the number of accidents per unit factory, to confirm the correlation with safety accidents. When SPI was grouped into safety practice level (SPL), the A, B, and F unit factories were grade I, and an average of 5.67 safety accidents occurred in this group. The E and G unit factories were grade II, and an average of five safety accidents occurred in this group. The C and D unit factories were grade III, and an average of 0.5 safety accidents occurred in this group. There was no unit factory corresponding to grade IV.

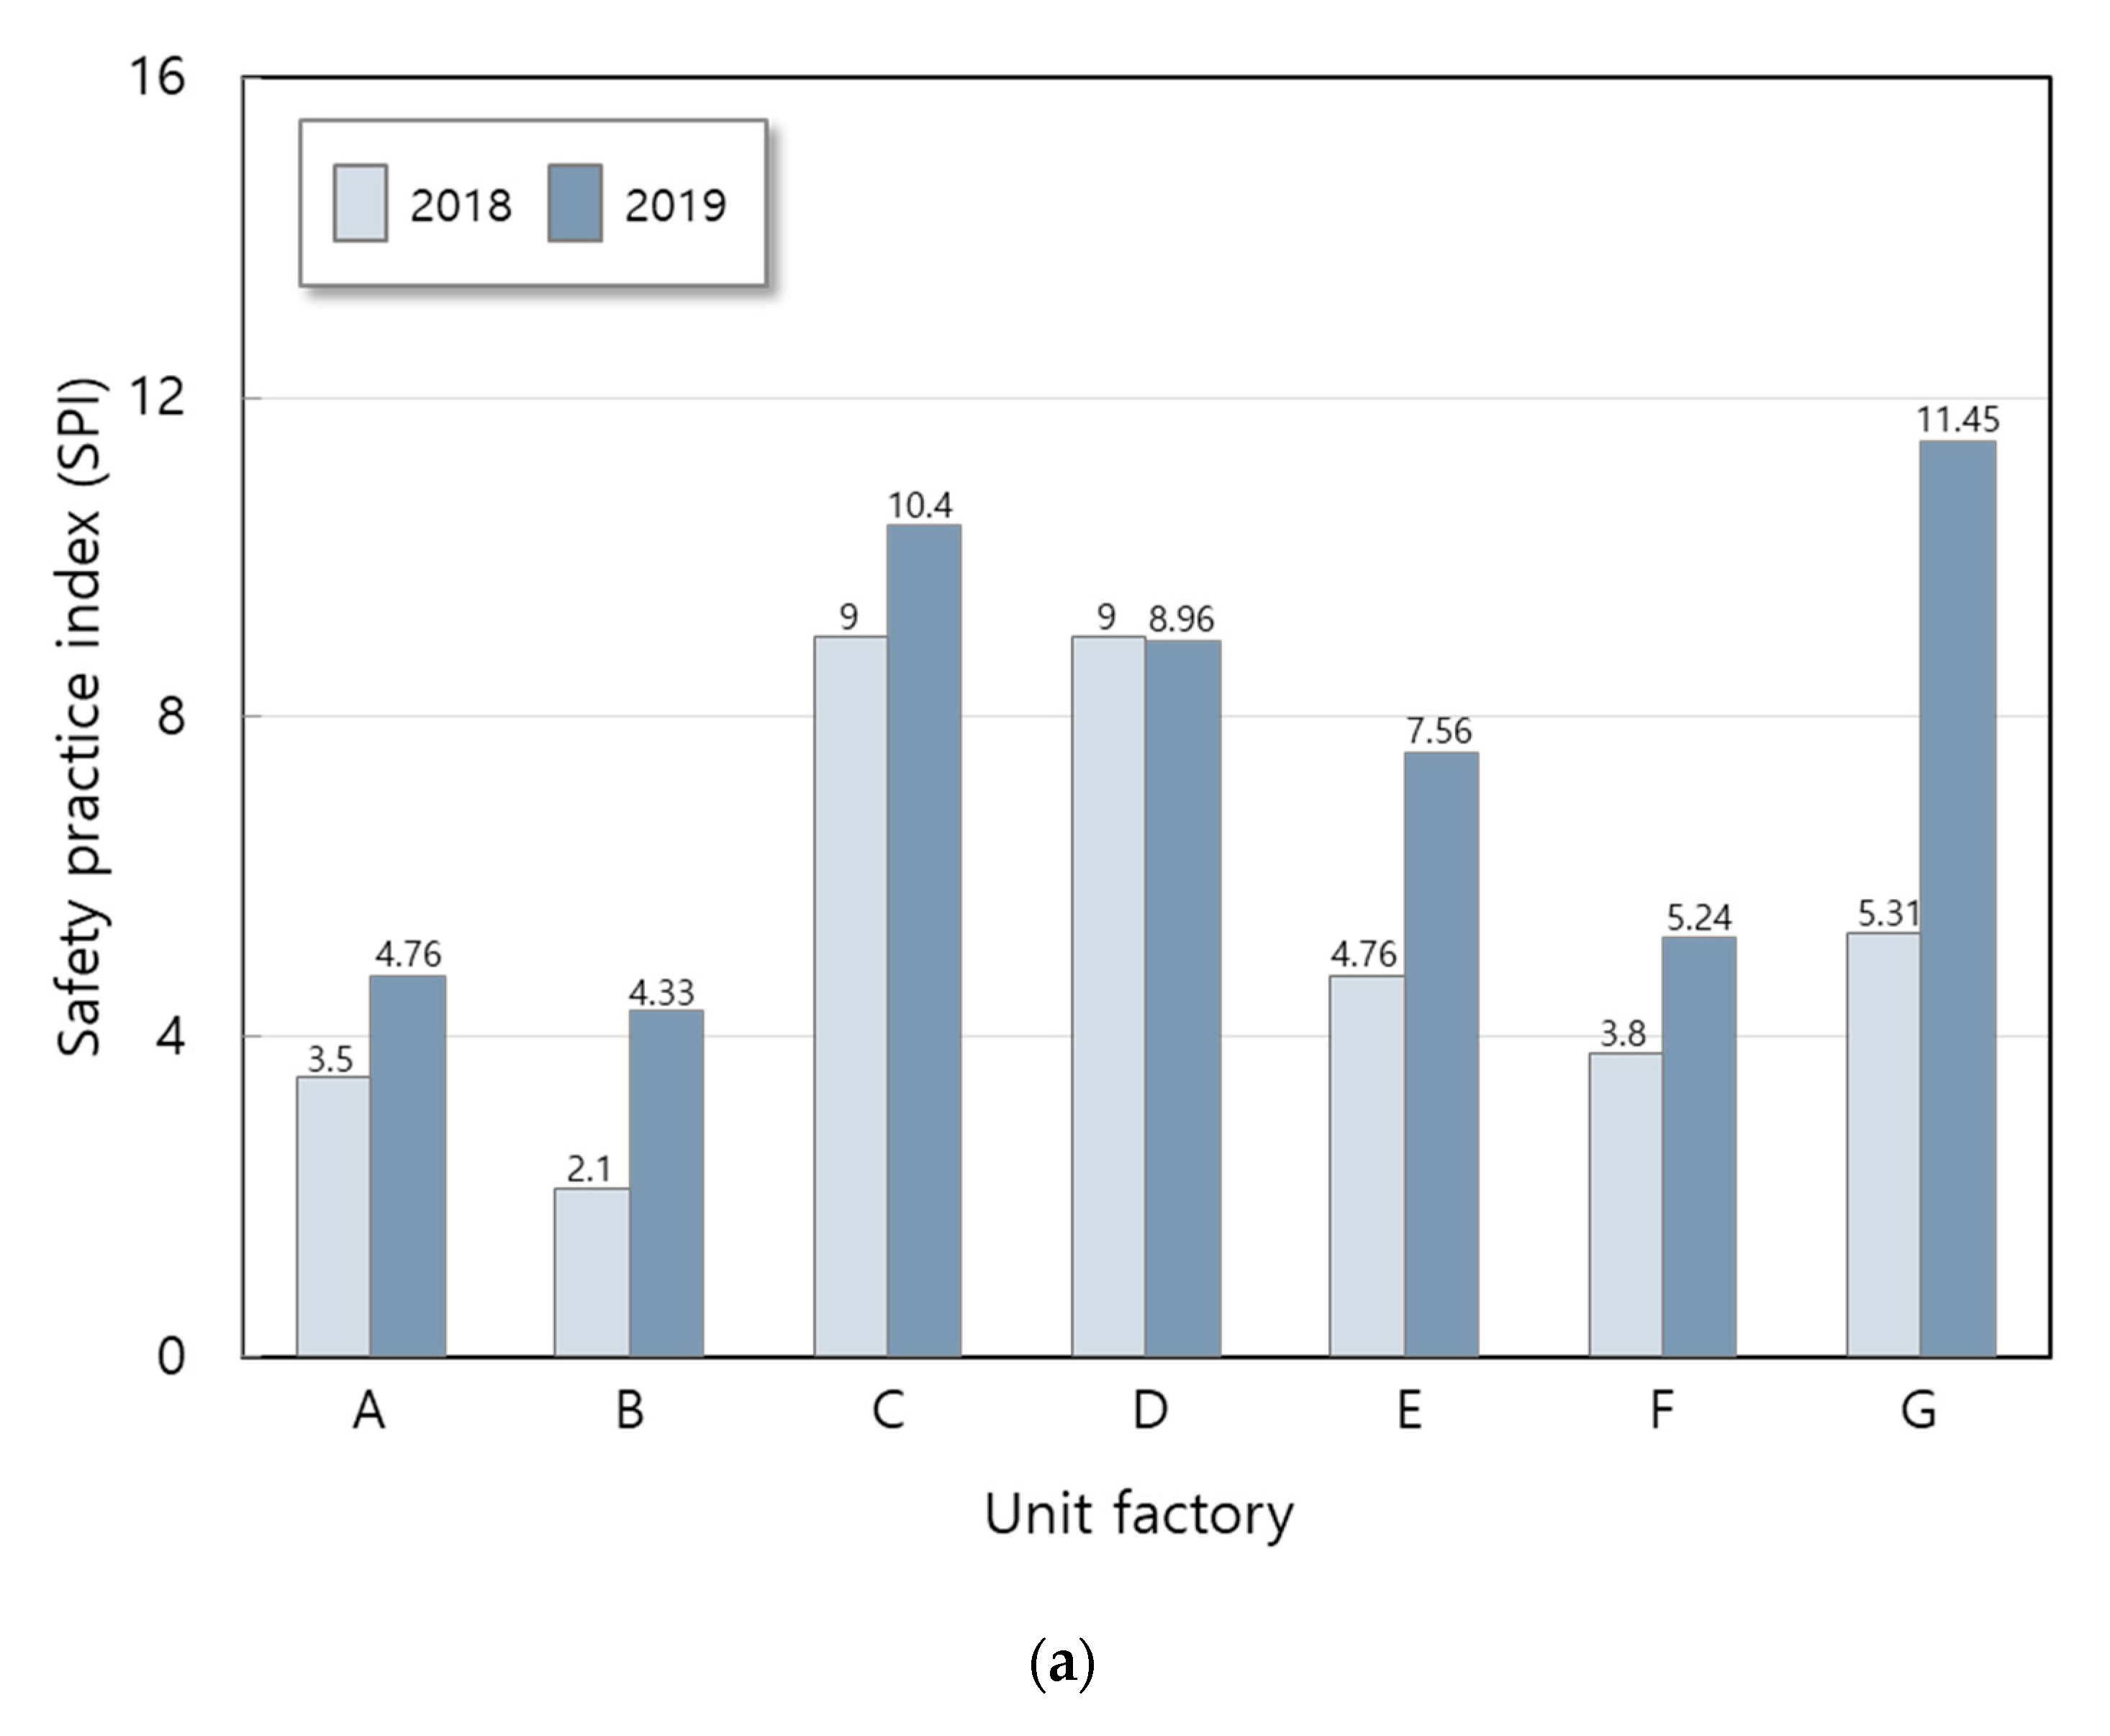
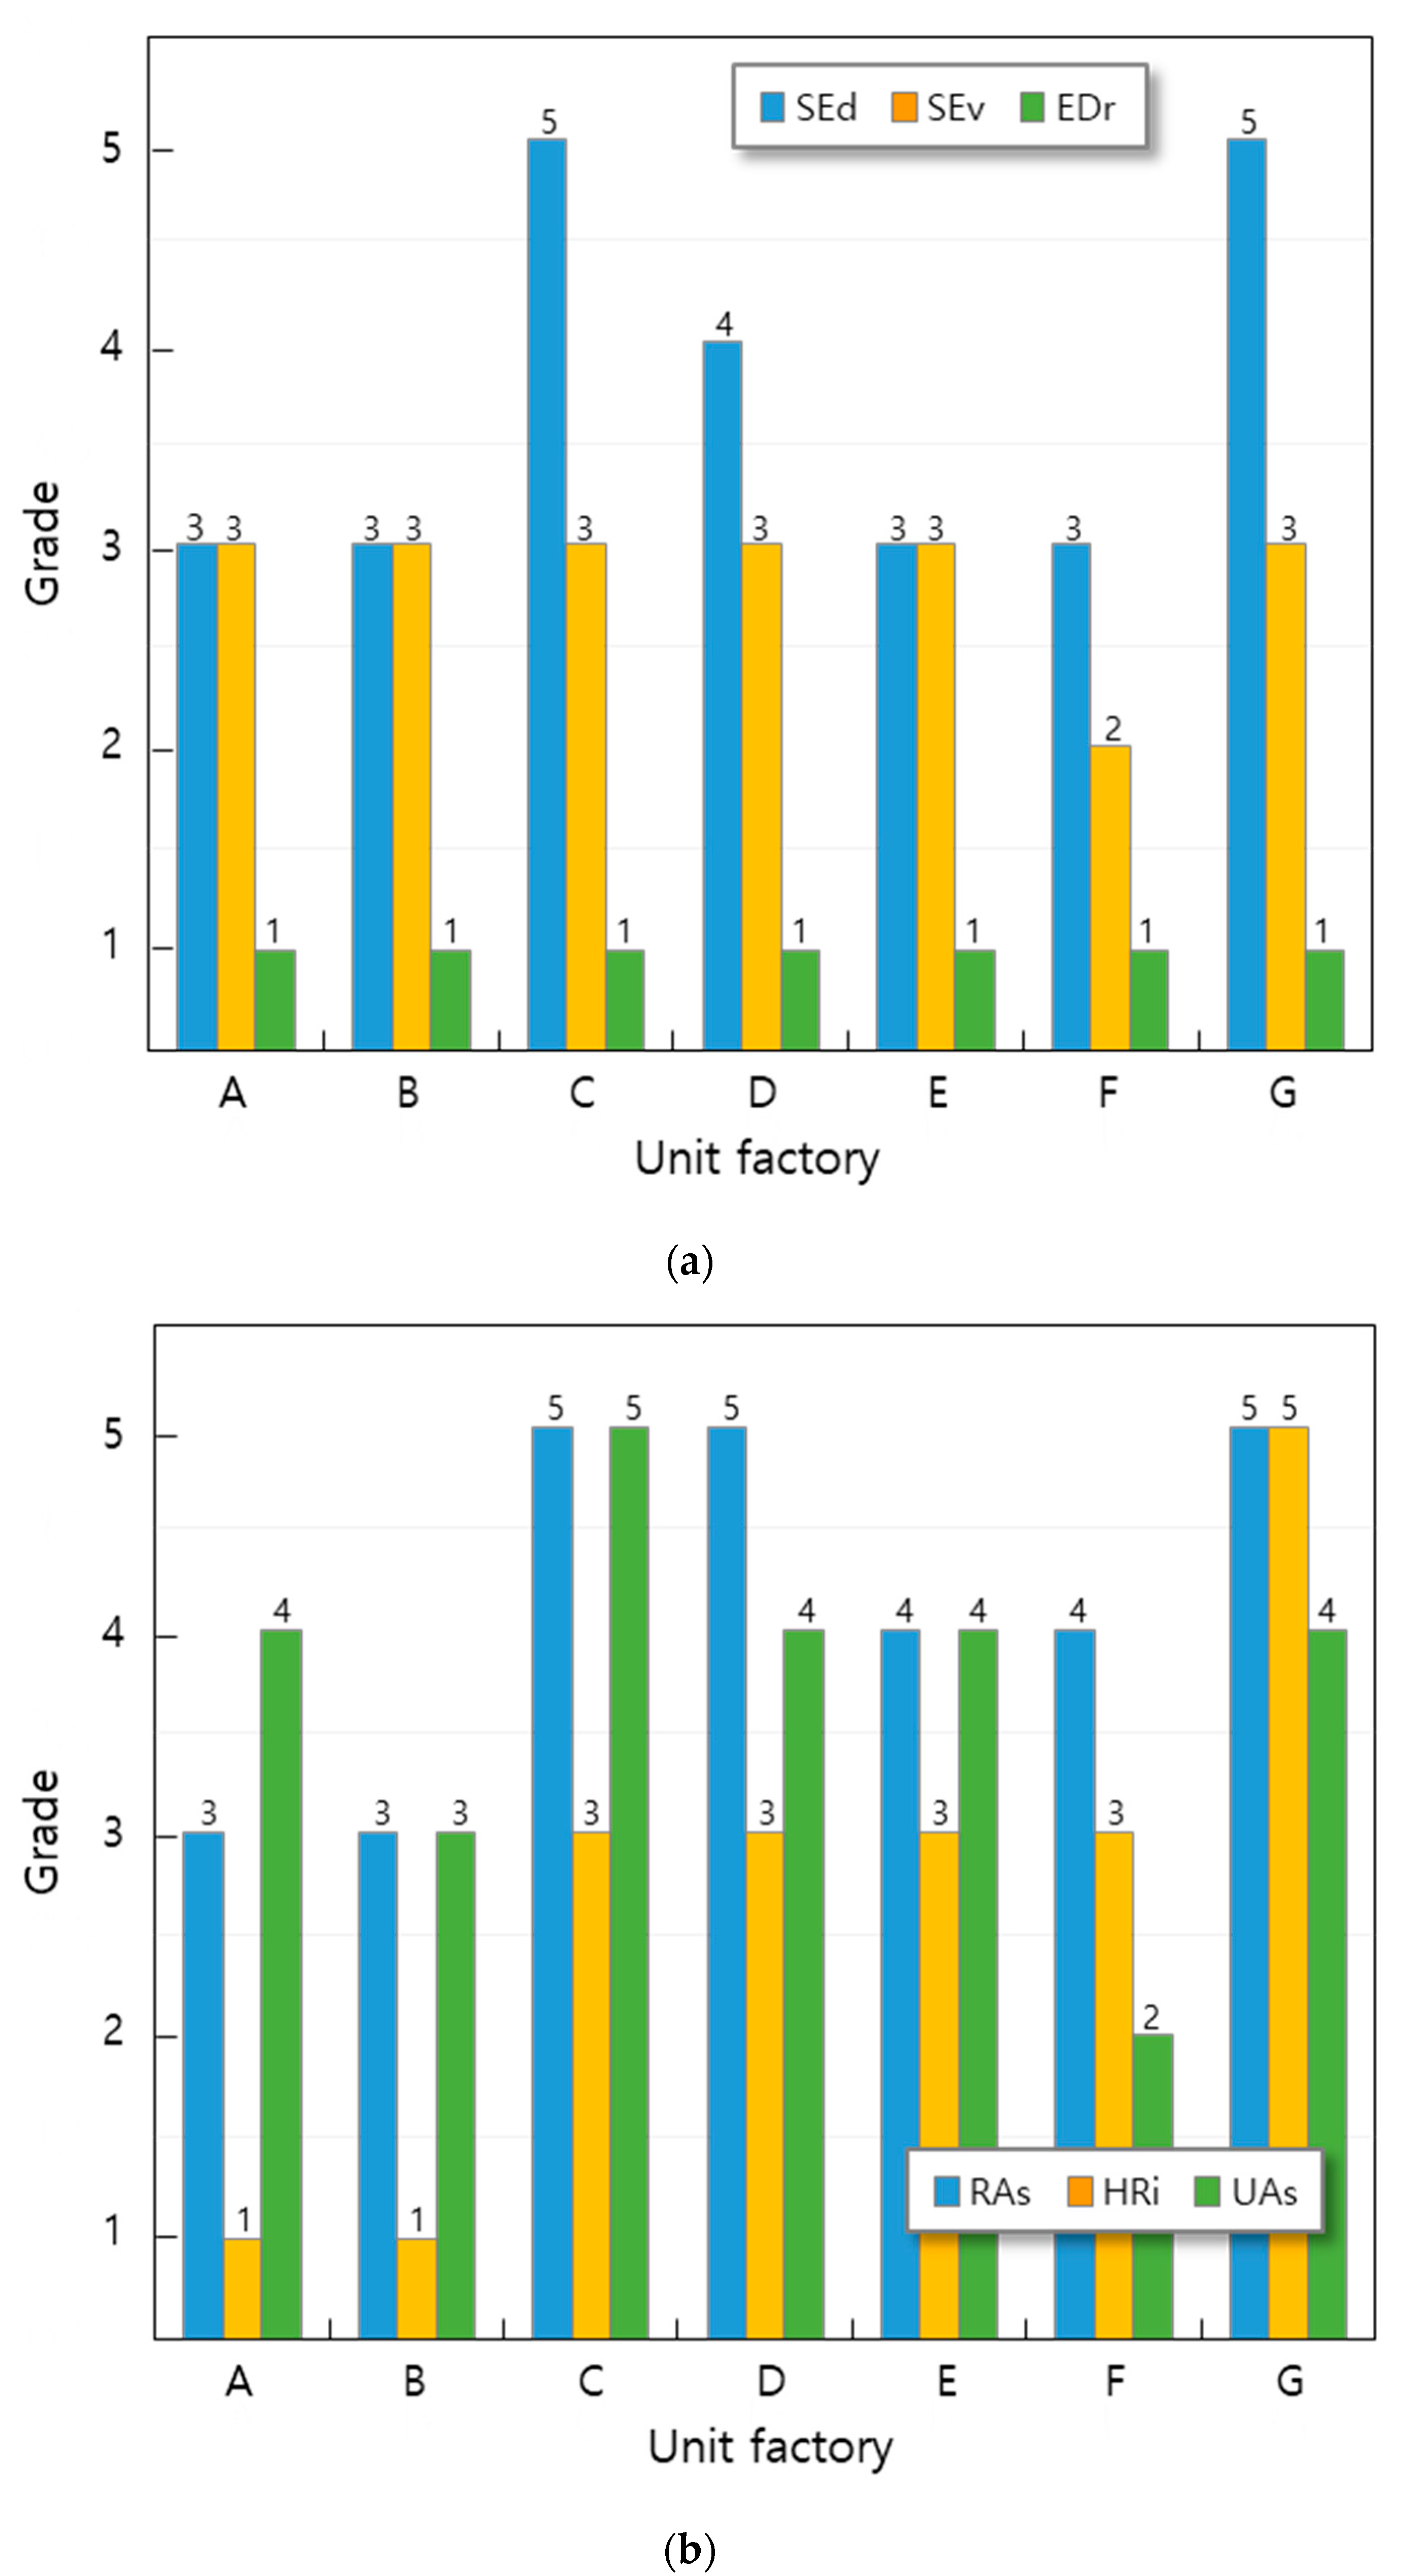
3.2. ’19 Safety Practice Index (SPI)

The safety activity and risk management detail items for each unit factory in 2019 were measured as presented in Table 13 and the results are shown in Figure 6.
The average grade for each item was measured as safety education (SEd) 3.71, safety event (SEv) 2.86, and emergency drill (EDr) 1, risk assessment (RAs) 4.14, high-risk improvement (HRi) 2.71, and unsafe act (UAc) 3.71. Therefore, the results of calculating the safety activity index (SAI) and risk management index (RMI) are as follows:
  • SAI = ( SEd × SEv × EDr ) 3 = ( 3.71 × 2.86 × 1 ) 3 = 2.2
  • RMI = ( RAs × HRi × UAc ) 3 = ( 4.14 × 2.71 × 3.71 ) 3 = 3.47
The result of calculating the safety practice index (SPI) by the product of the two indices (SAI, RMI) measured according to Equation (3) is as follows:
SPI = SAI × RMI = 2.2 × 3.47 = 7.63
The SPI calculation results for each unit factory were measured as presented in Table 13 and the results are shown in Figure 5a. To confirm the correlation with safety accidents, these results were compared with those in Figure 5b, which shows the number of accidents per unit factory. When SPI was grouped into safety practice levels (SPL), the A, B, E, and F unit factories were grade II, and an average of 4.25 safety accidents occurred in this group. The C, D, G unit factories were Grade III, and an average of 2.33 safety accidents occurred in this group. There were no unit factories corresponding to either grade I, or grade IV.
Based on the analysis of the two years of ‘18 and ‘19 presented thus far, it was verified that the higher the SPL grading, the fewer safety accidents, and the lower the SPL grading, the more safety accidents. In the safety practice index of ‘18 and ‘19, emergency drill (EDr) as a detailed item of safety activity was found to be low with a grade average of 1 in ‘18 and ‘19. In addition, as a detailed item for risk management, high-risk improvement (HRi) was low with an average grading of 2.71 in ‘18 and ‘19, so it was selected as an item subject to intensive management in ‘20, and it was applied to improve SPI and evaluate the safety accident prevention effect.

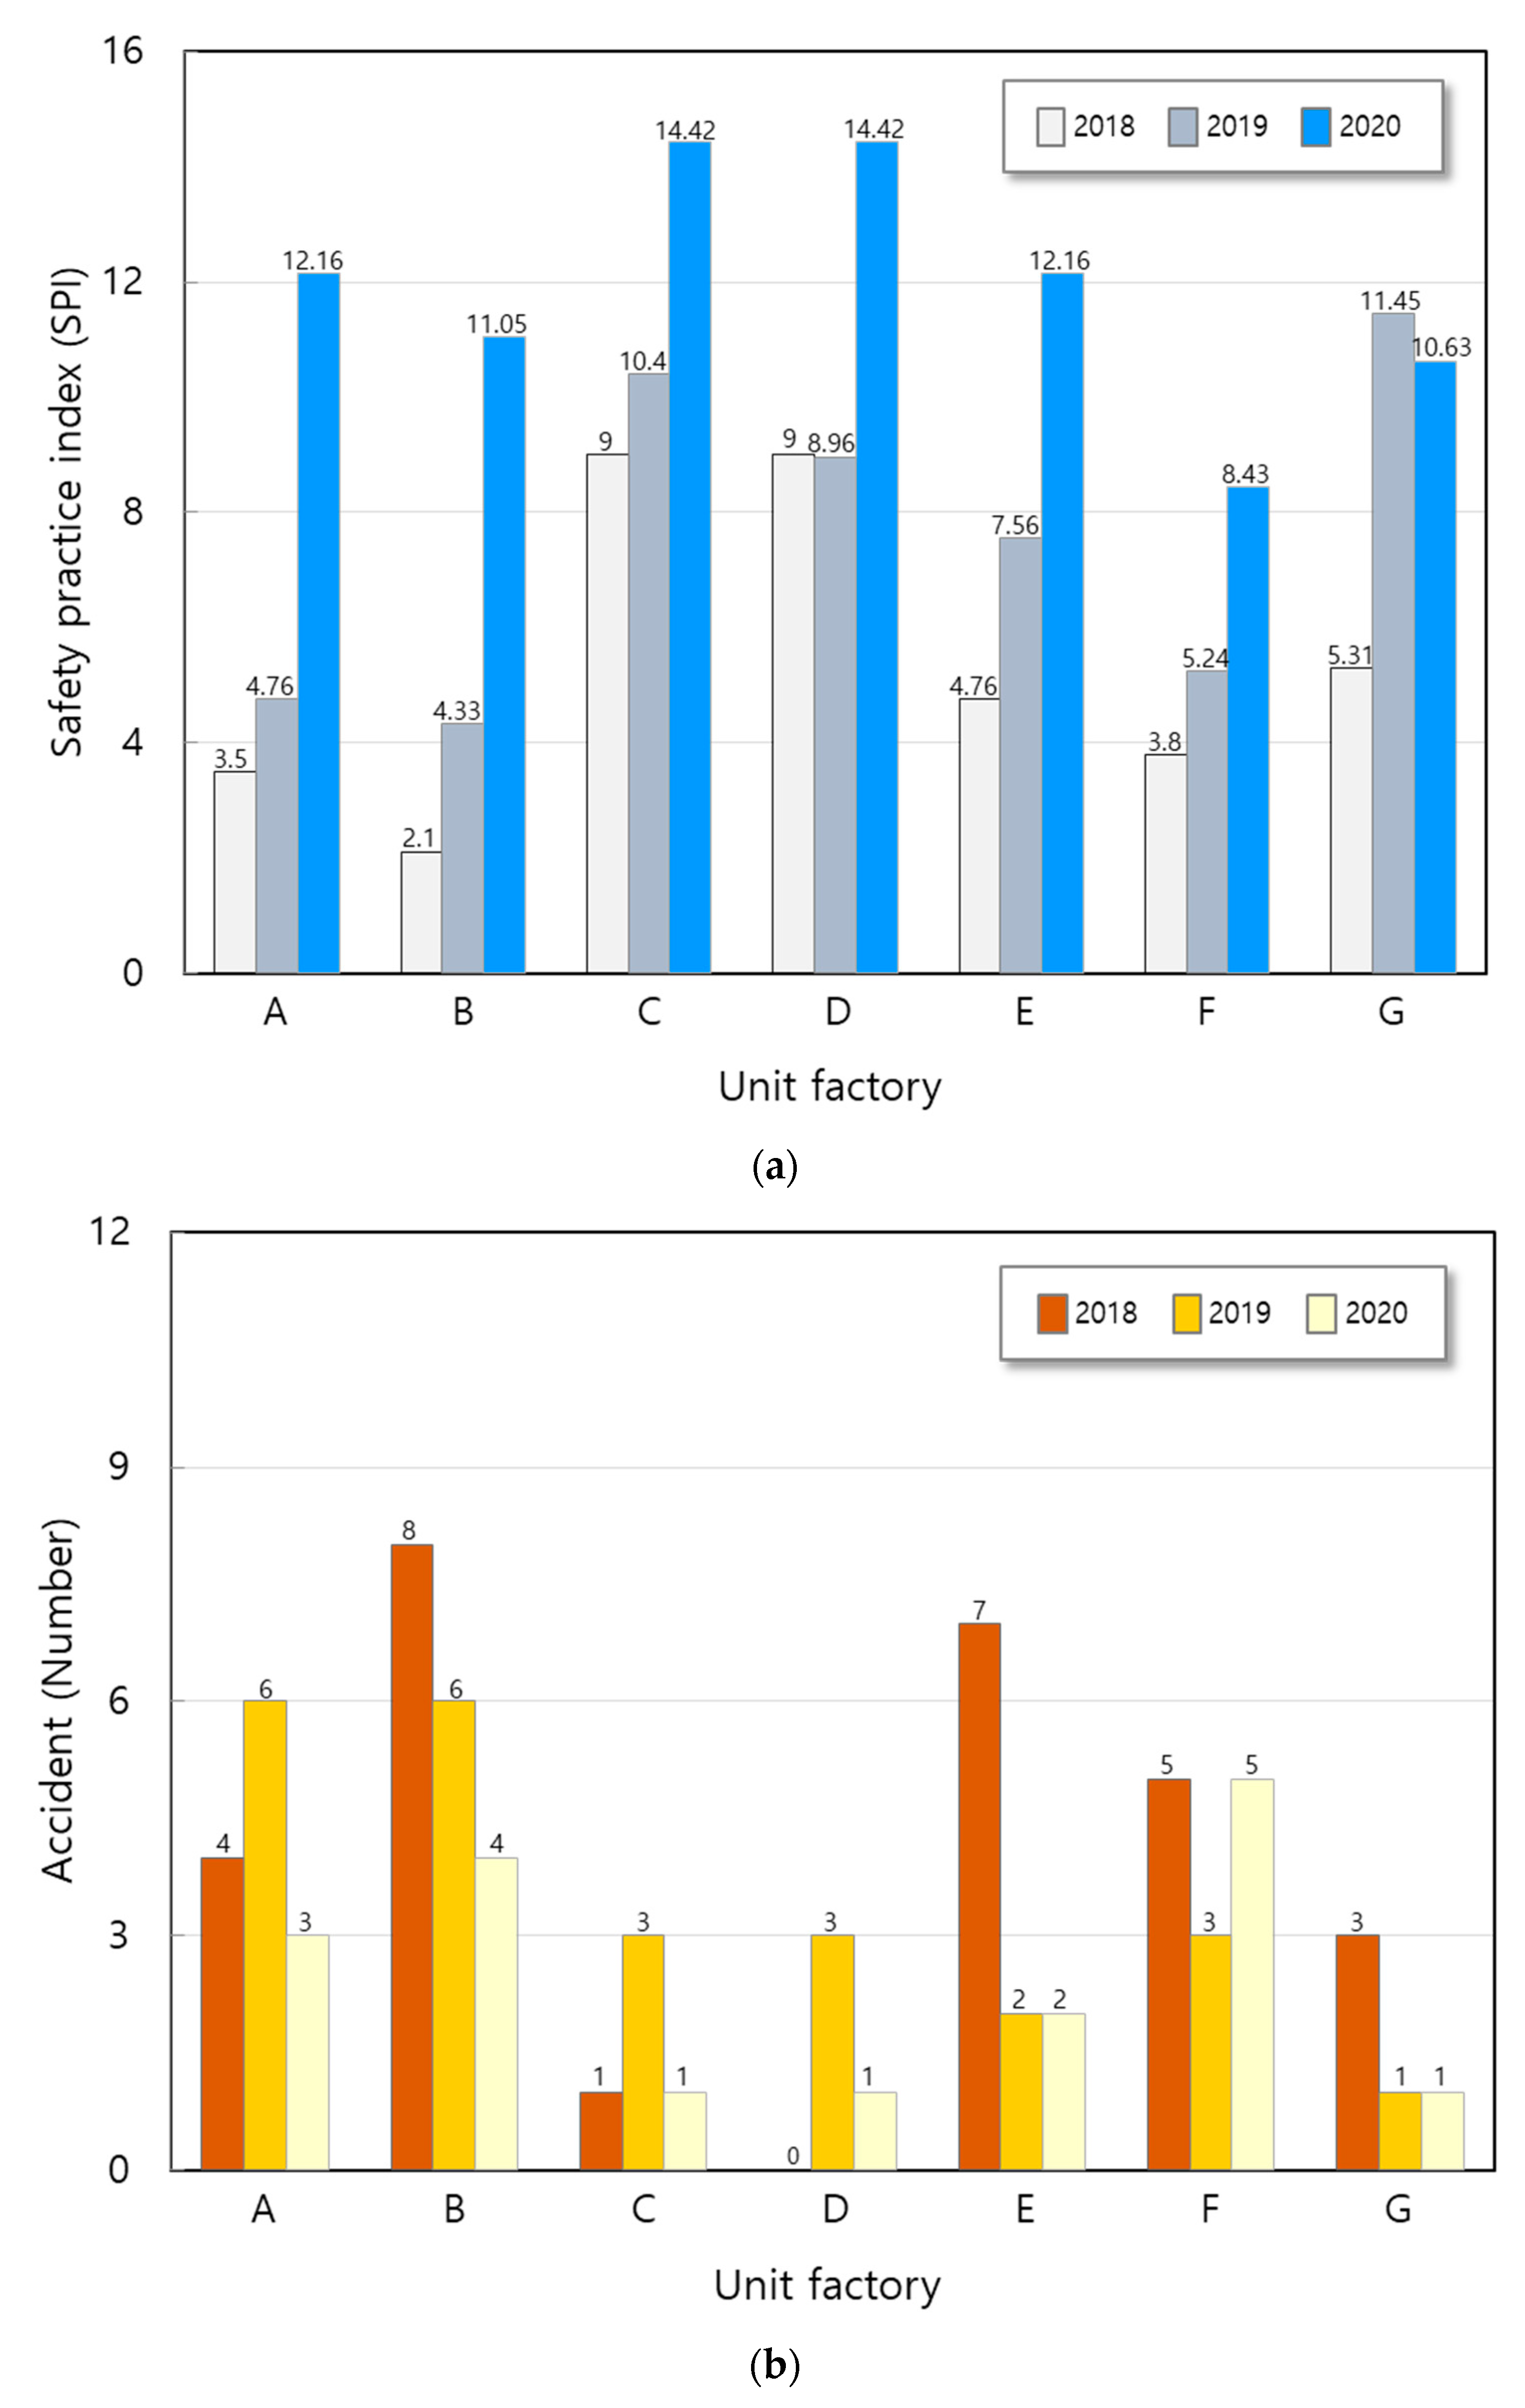
3.3. ’20 Safety Practice Index (SPI)

In ‘20, the results for intensive supplementation for emergency drill and high risk improvement, which are the items with the lowest index grade average in ‘18 and ‘19, are as follows.
  • Conduct emergency scenario and drill evaluation with the presence of the safety department to increase each unit factory’s participation rate in emergency drills.
  • Strengthening periodic inspections through safety meetings to increase high risk improvement.
The grades for safety activity and risk management detail items in ‘20 for each unit factory with the above contents improved were measured as presented in Table 14 and the results are shown in Figure 7. The grade average for each item was measured as safety education (SEd) 3.86, safety event (SEv) 3.0, emergency drill (EDr) 1.57, risk assessment (RAs) 4.86, high-risk improvement (HRi) 4.71, and unsafe act (UAc) 3.57. Therefore, the results of calculating the safety activity index (SAI) and risk management index (RMI) are as follows:
  • SAI = ( SEd × SEv × EDr ) 3 = ( 3.86 × 3.0 × 1.57 ) 3 = 2.63
  • RMI = ( RAs × HRi × UAc ) 3 = ( 4.86 × 4.71 × 3.57 ) 3 = 4.34
The SAI for 2020 was 2.63, representing an improvement of 25% compared to the average of 2.11 in ‘18 and ‘19; this was largely due to a 57% improvement in the emergency drill measurement value from 1 in ‘18 and ‘19 to 1.57 in ‘20. The RMI for 2020 was 4.34, up 36% from the average of 3.18 in ‘18 and ‘19; this was largely due to the 73% improvement in the high-risk improvement measurement value from 2.71 in ‘18 and ‘19 to 4.7 in ‘20.
The result of calculating the safety practice index (SPI) by the product of the two indices (SAI, RMI) measured according to Equation (3) is as follows:
SPI = SAI × RMI = 2.63 × 4.34 = 11.41
The SPI in ‘20 was 11.41, which was a 70% improvement from the average of 6.72 in ‘18 and ‘19. The SPI calculation results for each unit factory were evaluated as presented in Table 14 and the results are shown in Figure 8a. These results were compared with those in Figure 8b, which depicts the number of accidents per unit factory to confirm the correlation with safety accidents. When SPI was grouped into safety practice level (SPL), the B, F, and G unit factories were grade III, and an average of 3.33 safety accidents occurred in this group. The A, C, D, and E unit factories were Grade IV, and an average of 1.75 safety accidents occurred in this group. There was no factory corresponding to either grade I or grade II. As a result, it was confirmed that it is effective in improving SPI and preventing safety accidents by intensively strengthening emergency drills and high-risk improvement, which were the items with a low average index grade in ‘18 and ‘19. However, the safety accident reduction pattern according to the improvement of SPI requires long-term data acquisition to increase the accuracy of each safety practice index (SPI).

4. Conclusions

In this study, after calculating safety practice as an index from safety activity and risk management data, the trend of the occurrence of safety accidents was verified, and the insufficient items of the SPI index were intensively improved and supplemented to increase the SPI, as well as effectively applied for the prevention of safety accidents.
First, the safety practice index, an integrated evaluation index of safety practice, was proposed by introducing SAI, an index that oversees safety activity, and RMI, an index that oversees risk management; further, quantified grades were presented to increase the safety practice index.
Second, as a result of reflecting the safety practice index (SPI) for seven factories, it was confirmed that the safety practice level grade and safety accidents are quantitatively inversely proportional, revealing that it can be used as an effective index for safety management. In addition, by reinforcing leadership and safety policies such as classifying and managing the level of safety management for a specific period or department, weaknesses in safety management can be supplemented with strengths and used for safety accident prevention activities.
Third, to increase the safety activity index, it is necessary to expand participatory education, conduct regular emergency drills, and induce voluntary participation in safety events. To increase the risk management index, these results indicate that risk assessment, high-risk improvement, and the activation of unsafe act checks should be supported.
Fourth, by setting the safety practice index proposed in this study as a key performance indicator (KPI) and reflecting it in advance in safety policy, this study proved that it can be used for workplace safety management and the prevention of safety accidents.
Finally, reflecting this evaluation, the number of industrial accidents in 2020 decreased by nine cases compared to the average of 26 in 2018 and 2019, resulting in a decrease in industrial accident losses by KRW 22.5 billion (based on KRW 250 million per person in 2018).

Author Contributions

Conceptualization, D.R.; methodology, H.K.; formal analysis, H.K.; investigation, J.K.; resources, H.K.; writing—original draft preparation, H.K.; writing—review and editing, D.R.; supervision, D.R.; funding acquisition, D.R. All authors have read and agreed to the published version of the manuscript.

Funding

This research received no external funding.

Institutional Review Board Statement

Not applicable.

Informed Consent Statement

Not applicable.

Data Availability Statement

The data presented in this study are available on request from the corresponding author.

Acknowledgments

This work was supported by the Incheon National University (International Cooperative) Research Grant in 2019.

Conflicts of Interest

The authors declare no conflict of interest.

References

  1. Worst World Economy. How Ranked Is the Korean Economy? Financial News. Available online: http://www.fnnews.com/news/202105181435424202 (accessed on 20 May 2021).
  2. The Analysis of Industrial Injury, 2017~2019. Available online: http://www.kosha.or.kr (accessed on 15 July 2021).
  3. Comparison of Industrial Safety Penalties between Korea and G5, Global Insight. Available online: http://www.fki.or.kr (accessed on 30 April 2021).
  4. Bae, J.H. Corporate Social Responsibility and Occupational Safety & Health. Research Paper; Kangwon National University: Kangwon, Korea, 2010; Volume 649, p. 180. [Google Scholar]
  5. The Analysis of Industrial Injury Status. 2019. Available online: http://www.kosha.or.kr (accessed on 15 July 2021).
  6. DSS Bradley Curve Infographic. 2021. Available online: http://www.consultdss.com/bradley-curve-infographic/ (accessed on 2 July 2021).
  7. Terry, L. Mathis. Behind the Bradley Curve. EHS Today 2016, 9, 8–9. [Google Scholar]
  8. Sutherland, M.B. Safety culture idea & advice from the safety trenches. Prof. Saf. 2020, 65, 28–30. [Google Scholar]
  9. Terry, L. Mathis. Safety Excellence Maturity Model. EHS Today 2019, 12, 5–6. [Google Scholar]
  10. Kim, Y.S. A Study on the Difference in Recognition of Safety Culture between Construction Industry and Manufacturing Industry. Master’s Thesis, Songwon University, Chungcheongbuk, Korea, 2019; pp. 25–26. [Google Scholar]
  11. Li, L.; Hovsepian, J.H. A Proposed Safety Culture Development Model. Prof. Saf. 2020, 65, 53–54. [Google Scholar]
  12. Jones, S.; Kirchsteiger, C.; Bjerke, W. The Importance of Near Miss Reporting to Further Improve Safety. J. Loss Prev. Process Ind. 1999, 12, 59–67. [Google Scholar] [CrossRef]
  13. Chen, J.R.; Yang, Y.T. A Predictive Risk Index for Safety Performance in Process Industries. J. Loss Prev. Process Ind. 2004, 17, 233–242. [Google Scholar] [CrossRef]
  14. Fruggiero, F.; Riemma, S.; Ouazene, Y.; Macchiaroli, R.; Guglielmi, V. Incorporating the Human Factor within Manufacturing Dynamics. IFAC-Pap. Online 2016, 49, 1691–1696. [Google Scholar] [CrossRef]
  15. Hong, I.G.; Baek, J.B. Towards an Effective Assessment of Safety Culture. J. Korean Soc. Saf. 2016, 31, 118–125. [Google Scholar] [CrossRef] [Green Version]
  16. Nazaripour, E.; Halvani, G.; Jahangiri, M.; Fallahzadeh, H.; Mohammadzadeh, M. Safety Performance evaluation in a Steel Industry: A Short-term Time Series Approach. Saf. Sci. 2018, 110 Pt A, 285–290. [Google Scholar] [CrossRef]
  17. Center for Chemical Process Safety. Process Safety Metrics—Guide for Selecting Leading and Lagging Indicators; Center for Chemical Process Safety, American Institute of Chemical Engineers, 2018; Version 3.2; Available online: http://www.aiche.org/ccps (accessed on 15 July 2021).
  18. Walaski, P. The Role of Leading & Lagging Indicators in OSH Performance Management. Prof. Saf. 2020, 65, 29–35. [Google Scholar]
  19. Hopkins, A. Thinking about process safety indicators. Saf. Sci. 2009, 47, 460–465. [Google Scholar]
  20. Manuele, F.A. Leading and lagging indicators: Do they add value to the practice of safety? Prof. Saf. 2009, 54, 28–33. [Google Scholar]
  21. Susca, P.T. Measuring up: Evaluating effectiveness rather than results. Prof. Saf. 2019, 64, 22–24. [Google Scholar]
  22. Chiri, K.; Jansz, J. Examining the Relationship between Safety Culture and Safety Climate and the Role Leading Safety Indicators Play in Enhancing Safety Performance in the Oil and Gas Industry. World Saf. J. 2016, XXV, 4–14. [Google Scholar]
  23. Kim, B.S.; Jin, S.; Chang, S.R. Measurement of Incident-reporting Rate for Developing a Leading Indicator of Safety Culture. J. Korean Soc. Saf. 2018, 33, 93–101. [Google Scholar]
  24. Reiman, T.; Pietikäinen, E. Leading Indicators of System Safety—Monitoring and Driving the Organizational Safety Potential. Saf. Sci. 2012, 50, 1993–2000. [Google Scholar] [CrossRef]
  25. Math Encyclopedia. Available online: http://www.kms.or.kr/ (accessed on 28 February 2021).
  26. Brigham, E.F.; Houston, J.F. Fundamental of Financial Management, 4th ed.; Harcourt College: Fort Worth, TX, USA, 2021. [Google Scholar]
  27. Kim, H.S.; Kim, J.I.; Rie, D.H. A Study on the Utilization of Safety Practice Index to Increase the Effectiveness of Safety Management. J. Korean Soc. Saf. 2021, 36, 44–49. [Google Scholar]
Figure 1. Flow chart of research.
Sustainability 13 10990 g001
Figure 2. Conceptual chart of SPI (relation between RMI and SAI).
Sustainability 13 10990 g002
Figure 3. Bradley curve model (1995) and safety practice level.
Sustainability 13 10990 g003
Figure 4. Grades of SAI and RMI detail items for each unit factory in 2018. (a) Grade of SAI detail items for each unit factory. (b) Grade of RMI detail items for each unit factory.
Sustainability 13 10990 g004
Figure 5. Safety practice index and safety accidents in 2018, 2019. (a) SPI for each unit factory in 2018, 2019. (b) Accidents for each unit factory in 2018, 2019.
Sustainability 13 10990 g005aSustainability 13 10990 g005b
Figure 6. Grades of SAI and RMI detail items for each unit factory in 2019. (a) Grade of SAI detail items for each unit factory. (b) Grade of RMI detail items for each unit factory.
Sustainability 13 10990 g006
Figure 7. Grades of SAI and RMI detail items for each unit factory in 2020. (a) Grade of SAI detail items for each unit factory. (b) Grade of RMI detail items for each unit factory.
Sustainability 13 10990 g007aSustainability 13 10990 g007b
Figure 8. Safety practice index and safety accidents in 2018–2020. (a) SPI for each unit factory in 2018–2020. (b) Accidents for each unit factory in 2018–2020.
Sustainability 13 10990 g008
Table 1. The level of punishment in the event of death by industrial accidents in different countries(G5).
PunishmentKoreaUKFranceGermanyJapanUSA
Imprisonment
(personal)
7 years or less2 years or less1 year or less1 year or less6 months or less10 years or less
Fines
(corporate)
KRW 1 billion or less10% or less of salesEUR 30,000 or lessEUR 5000 or lessJPY 500,000 or lessUSD 7000 or less
Table 2. Punishment criteria for corporations with serious accidents in Korea and the UK.
PunishmentKoreaUK
Imprisonment (personal)1 year or more, 1 billion or less-
Fines (corporate)KRW 5 billion or lessUnlimited
(usually 10% of annual sales)
Original responsibilitySame way as subcontractorsWhen there is an actual command
Table 3. Classification of manufacturing industry in 2019.
RankingIndustryNumber of
Disaster Victims
Number of
Workers
Industry Applied
to This Study
1Manufacturing of metal and mechanical products11,2801,462,709A
2Manufacturing of chemical and rubber products2675452,800B
3Manufacturing of food2638316,021C
4Manufacturing of wood and paper products1451116,466Exception
(<300,000)
5Manufacturing of electrical machinery and electronic products1431906,585D
Table 4. Safety activity items for the manufacturing industry.
WorkplaceEducationDrillEventTraffic EnforcementSafety ProposalMentoring
A--
B--
C--
D--
○: being implemented, -: not being implemented.
Table 5. Measurement of participation in safety activity items.
ItemMeasurement ItemRatio (%)
Safety education (SEd)Ratio of implementation Ratio of
participation
Implementation/target count participants/target person
Safety event (SEv)Ratio of participationParticipants/number of trials
Emergency drill (EDr)Ratio of implementation Ratio of good timesImplementation/target count good times/number of checks
Table 6. Criteria of grade for safety activity items.
GradeSafety EducationSafety EventEmergency Drill
5100%100%100%
490~100%90~100%90~100%
380~90%80~90%80~90%
270~80%70~80%70~80%
1less than 70%less than 70%less than 70%
Table 7. Risk management items for the manufacturing industry.
WorkplaceRisk AssessmentHigh Risk ImprovementUnsafe ActLabor Joint InspectionSubcontractor Joint InspectionMy Safety Check
A--
B--
C--
D--
○: being implemented, -: not being implemented.
Table 8. Measurement of risk management level.
ItemMeasurement ItemRatio (%)
Risk assessment (RAs)Ratio of risk assessmentNumber of assessment/work procedure
High-risk improvement (HRi)Ratio of improvementNumber of improvement/high risk
Unsafe act (UAc)Ratio of unsafe actNumber of unsafe act/work cases
Table 9. Criteria of grade for risk management items.
GradeRisk AssessmentHigh Risk ImprovementUnsafe Act
5100%100%0~5%
495~100%90~100%5~10%
390~95%80~90%10~15%
285~90%70~80%15~20%
1less than 85%less than 70%more than 20%
Table 10. Safety practice level grade criteria.
GradeSPISafety Practice Level (SPL)Remark (Bradley Curve)
IV12~16Voluntary participation and high-level risk managementInterdependent
III8~12Increasing participation and consensusIndependent
II4~8Passive participation/supervision dependentDependent
I0~4Indifferent and ignorant of safety activities/unmanaged riskReactive
Table 11. Unit factories in the company applied as an example.
Unit FactoryABCDEFG
Employees808372867267121
ProductIntermediary steel materialFinished steel product
Table 12. Detailed item measurement results of SAI and RMI for unit factories in 2018.
IndexCategoryUnit AUnit BUnit CUnit DUnit EUnit FUnit GAverage
SAISEd (safety education) 33442233
score89.281.396.792.575.076.787.185.5
SEv (safety event) 33332322.71
score84.882.285.285.778.784.374.082.1
EDr (education drill) 11111111
score41.743.358.340.038.356.735.344.8
RMIRAs (risk assessment) 11553353.29
score82.482.410010091.291.210092.5
HRi (high-risk improvemt) 11333352.71
score404084.684.681.781.710073.2
UAc (unsafe act) 51443112.71
score4.122.46.08.113.826.531.116
SPI3.52.19.09.04.83.85.35.81
Accident481075328
Table 13. Detail item measurement results of SAI and RMI for unit factories in 2019.
IndexCategoryUnit AUnit BUnit CUnit DUnit EUnit FUnit GAverage
SAISEd (safety education) 33543353.7
Score858510095.4858510090.8
SEv (safety event) 33333232.9
Score80.383.581.781.380.378.580.380.8
EDr (education drill) 11111111
Score33.3454536.733.33033.336.7
RMIRAs (risk assessment) 33554454.1
Score91.291.210010098.398.310097
HRi (high-risk improvemt) 11333352.7
Score606084.684.681.781.710078.9
UAc (unsafe act) 43544243.7
Score8.112.24.27.17.515.86.18.7
SPI4.84.310.49.07.65.211.47.63
Accident663323124
Table 14. Detailed item measurement results of SAI and RMI for unit factories in 2020.
IndexCategoryUnit AUnit BUnit CUnit DUnit EUnit FUnit GAverage
SAISEd (safety education) 33553443.86
Score86.781.7100100859091.791.0
SEv (safety event) 33333333.0
Score87.187.585.885.880.387.986.787.0
EDr (education Drill) 22221111.57
Score71.770.076.778.333.343.373.369.3
RMIRAs (risk assessment) 55554554.9
Score10010010010098.310010099.8
HRi (high-risk improvemt) 55553554.7
Score10010010010081.710010097.4
UAc (unsafe act) 43444243.6
Score5.611.45.267.215.25.88.1
SPI12.1611.0514.4214.4212.168.4310.6311.41
Accident341125117
Publisher’s Note: MDPI stays neutral with regard to jurisdictional claims in published maps and institutional affiliations.

