Article

Potential Use of Native Yeasts to Produce Bioethanol and Other Byproducts from Black Sugarcane, an Alternative to Increment the Subsistence Farming in Northern Ecuador

by
Gabriela N. Tenea
* and
Fabricio Veintimilla
Biofood and Nutraceutics Research and Development Group, Faculty of Engineering in Agricultural and Environmental Sciences, Technical University of the North, Av. 17 de Julio s-21 Barrio El Olivo, Ibarra 100150, Ecuador
*
Author to whom correspondence should be addressed.
Sustainability 2021, 13(19), 10924; https://doi.org/10.3390/su131910924
Submission received: 26 August 2021 / Revised: 21 September 2021 / Accepted: 27 September 2021 / Published: 30 September 2021
(This article belongs to the Special Issue Recent Advances in Biofuels: Biorefinery toward Sustainability)

Abstract

:
The high consumption of energy, mainly in the automotive sector, is supplied by fossil fuels, which, when combusted, generate polluting gases leading to the great problem of climate change. This has led society to seek alternatives. Bioethanol is a biofuel that can be obtained from the fermentation of different raw materials rich in sucrose such as sugarcane, which can be mixed with gasoline and used to reduce polluting emissions. The following investigation focused on studying the efficiency of three selected native yeasts in the fermentation of black sugarcane POJ 27-14 variety juice to produce bioethanol and other byproducts of biotechnological interest. A comparison between the size of the inoculum of three selected native yeasts (Lev6, Lev9, and Lev30) and two reference commercial controls in the fermentation process was performed. The phylogenetic classification was carried out based on the analysis of the internal transcribed spacer 1 sequence, 5.8S ribosomal RNA, and internal transcribed spacer 2. Lev6 and Lev30 were classified as Saccharomyces cerevisiae, while Lev9 was Candida intermedia, with 99% nucleotide sequence identity. The results showed that the optimal growth temperature was 30 °C with constant agitation (200 rpm) for biomass production. The Lev30 strain presented the highest yield in the production of biomass from sugarcane juice fermentation, while the Lev6 strain presented the highest yield in ethanol production. Additionally, among native yeasts, Lev6 registered the highest ethanol concentration (Q) and volumetric productivity (Qp) values of 0.61 (g/L/h) and 43.92 g/L, respectively, which were comparable with the control yeasts. The gas chromatography coupled to mass spectrometry (GC-MS) indicated the presence of ethanol in all samples (98% to 99% relative percentages) along with some therapeutic substances such as (2-aziridinylethyl) amine and tetraacetyl-d-xylonic nitrile with greater efficiency than commercial controls from the alcoholic fermentation of black sugarcane juice.

1. Introduction

One of the greatest concerns of our generation is the phenomenon of global warming, its causes, and its effects. This phenomenon is largely caused by fossil fuels that, when burned, produce gases such as carbon dioxide, methane, and nitrous oxides. This problem has created the need to find an efficient substitute for the consumption of fossil fuels, such as the use of biofuels to reduce greenhouse gas emissions that overheat the earth’s surface and accelerate climate change [1]. An environmentally friendly fuel alternative to petroleum derivatives might be the biological conversion of cellulosic materials and industrial residues into ethanol using selected microorganisms [2,3,4]. According to the International Energy Agency [5], global energy-related carbon dioxide (CO2) emissions stabilized in 2019, at 33 gigatons (Gt), after two years of increases, due to lower emissions from the energy sector and the increasing use of renewable sources. However, it is still an excessive amount of CO2 emissions. Therefore, it is of great importance to find alternatives using renewable organic matter (biomass). In Latin America, the biofuel industry is highly exploited as is the case of Brazil, which is the first country in the world to use biofuels obtained from sugarcane with a percentage of 68.26%, followed by Mexico with 7.58%, Colombia is in third place with 5.97%, while Ecuador is in seventh place with 1.22% [6]. Modern biofuels have become commonplace in the pursuit of profitable and environmentally sustainable businesses and lifestyles. To be truly sustainable, however, biofuel production must achieve a balance between its benefits and its potential hidden costs, as well as harmony between energy security and food security [7]. Concerns are evident regarding rising fossil fuel prices, rising energy import bills, geopolitical changes, and environmental situations. One of the main challenges for the authorities when generating policies is the production of biofuels where they must protect the supply and prices of food when speaking of developing countries. Countries that produce biofuels do so in response to climate change and sometimes because of rising oil prices. However, while the production and use of biofuels fit into the political agenda, at the same time, policy makers and some researchers carefully anticipate the consequences it would have on food security [8,9].
Ecuador has set itself the challenge of taking environmental actions to counteract the effects of climate change using biomass produced daily by industry, with the main objective of promoting the development of bioenergy [10]. The sugar industry is one of the fundamental pillars of the economic development of several provinces [11]. There are more than 75,000 hectares of sugarcane fields and six sugar mills, of which 30% of the hectares are used to produce alcohol [12]. According to Ecuador’s Sugar Cane Research Center [6], the largest type of sugarcane harvested in the country in 2016 was the variety CC85-92. This variety is characterized by its high content of sucrose (112.2 kg of sugar/ton of cane). There are other varieties cultivated in the northside of the country such as Barbados, Colvarote, and Puerto Rico, the largest amount being destined to produce sugar [13]. Additionally, the sugarcane variety POJ27-14 (hybrid Saccharum sp.) is among the C4 group (plants in which the light-dependent reactions and the Calvin cycle are physically separated), very efficient in terms of using soil nutrients and transforming biomass into useful energy [14]. This variety has long and cylindrical stems, black-purple color, medium-length internodes and does not contain ceresin, it adapts easily to different agroecosystems such as acid soils and hillside soils, its maturation is late (20 months), and it generates juices of excellent quality, with an estimated production of 11.5 t/ha. The annual production of cane for sugar represents 2.95% of the national production of this crop; therefore, there is a high interest to produce ethanol and other byproducts employing this variety. At the local level, is exploited to extract juice that is sold by artisans along with chopped pieces ready to be consumed; this business is carried out by tradition or as a way of subsisting, since they do not have any other support or sustainable studies to look for alternatives that might help to increase the daily income [15].
Ethanol production in the country has been developed by several companies with a total capacity of 120,000 L of alcohol per day during the harvest season (July to December), although in the rest of the year, there is no production; therefore, each company would reach approximately 40,000 L per day on average [16]. Currently, there is a pilot project (Ecopais) whose purpose is to commercialize a renewable fuel, a mixture of 95% extra gasoline and 5% ethanol anhydrous obtained from sugarcane. The average cost of anhydrous ethanol per liter was estimated at USD 0.55 [17]. Even though ethanol has been produced for several years, there are still many technical quality shortcomings regarding sugarcane processing and ethanol production. For example, it has been found that the sugarcane juice fermentation process is not adequate. Additionally, there is an increase in the raw material loss due to the lack of appropriate storage conditions inducing its adulteration. The juice extracted upon crushing and grinding of biomass is collected in storage tanks before the fermentation phase. Here the conversion of sugars into alcohol is carried out without the use of selective yeasts. According to the literature, the resulting product after distillation may contain about 15% ethanol and the rest water [18]. Moreover, several steps must be performed to obtain anhydrous ethanol with 99.9% purity to be used as fuel. This is hard to achieve in Ecuador. In general, the ethanol has 95% purity, which is inappropriate to mix with gasoline, since this generates severe damage to the automobile carburetors [19].
However, an expanding demand is to use an efficient fermentation system with selected yeasts for high-quality ethanol production [20]. Alcoholic fermentation using yeasts is well studied [21]. Yeasts are tolerant to high temperatures and sugar concentration and alcohols; therefore, they are considered very attractive for the fuel alcohol industry [22]. To produce alcoholic beverages from cereals, Saccharomyces cerevisiae strains were used, since they are efficient in the fermentation process, converting sugars into ethanol, carbon dioxide, and numerous metabolites [23].
The selection and characterization of yeast species have a significant impact on ethanol production, profitability, and long-term viability [4]. Their performance on ethanol production depends on the species and their capacity to ferment a certain substrate. Recent studies suggested that the indigenous yeasts isolated from fruits, sugarcane, molasses, and cheese whey showed better performance in the production of ethanol than the commercial strains [24].
In recent research, we prospect the microbiome of tropical fruits of Ecuador to search for beneficial microorganisms that produce molecules of biotechnological interest [25]. Along with bacteria, various yeast isolates have been selected. However, with the aim of finding a viable solution for farmers to increase their daily income and reduce the loss of raw materials due to deterioration, we proposed to identify and characterize some native yeasts isolated from wild fruits and assess their potential to produce ethanol and other byproducts. Native yeasts might help the fermentation process. In addition, the costs of production might reduce, as no importation of reference yeasts from collection cultures is needed. Thus, for the fermentation process, we used juice extracted from the sugarcane POJ27-14 variety, locally known as the black variety, which is mainly cultivated in the northern region of Ecuador. The phylogenetic classification was carried out based on the analysis of the internal transcribed spacer 1 sequence, 5.8S ribosomal RNA, and internal transcribed spacer 2. The growth kinetics were assessed in vitro comparing the selected native yeasts (Lev6, Lev9, and Lev30) in both YPD medium and sugarcane juice. The size of the cell inoculum for the fermentation process was investigated for the native yeasts in comparison with two reference controls. Their capacity to produce ethanol and other byproducts was assessed using the gas chromatography method coupled to mass spectrometry (GC-MS). This small-scale project will further strengthen the development of social capital for sugarcane farmers and contribute to the overall increase in economic value to society.

2. Materials and Methods

2.1. Isolation and Selection of Native Yeasts

Yeasts originating from wild black or Andean blueberries (Vaccinium floribundum Kunth.) collected from El Cristal subtropical forest (Santo Domingo de Los Tsáchilas), Esmeraldas Province, Ecuador, were isolated by spread plating on Yeast Peptone Dextrose (YPD) agar medium (Difco, Detroit, MI, USA). The isolates were temporarily annotated and were subjected to preliminary microscopic investigations (Micros, St. Veit Glan, AU). A total of 25 yeast colonies were randomly selected for preliminary fermentation screening. Thus, YPD liquid medium with 5% glucose concentration was prepared, and 10 mL was dispensed in glass test tubes, each with inverted Durham tubes. The medium was sterilized and was inoculated with the selected yeast isolates culture. The gas formation was monitored daily for one week. Based on the fermentation results, three isolates annotated as Lev6, Lev9, and Lev30 were selected for further study.

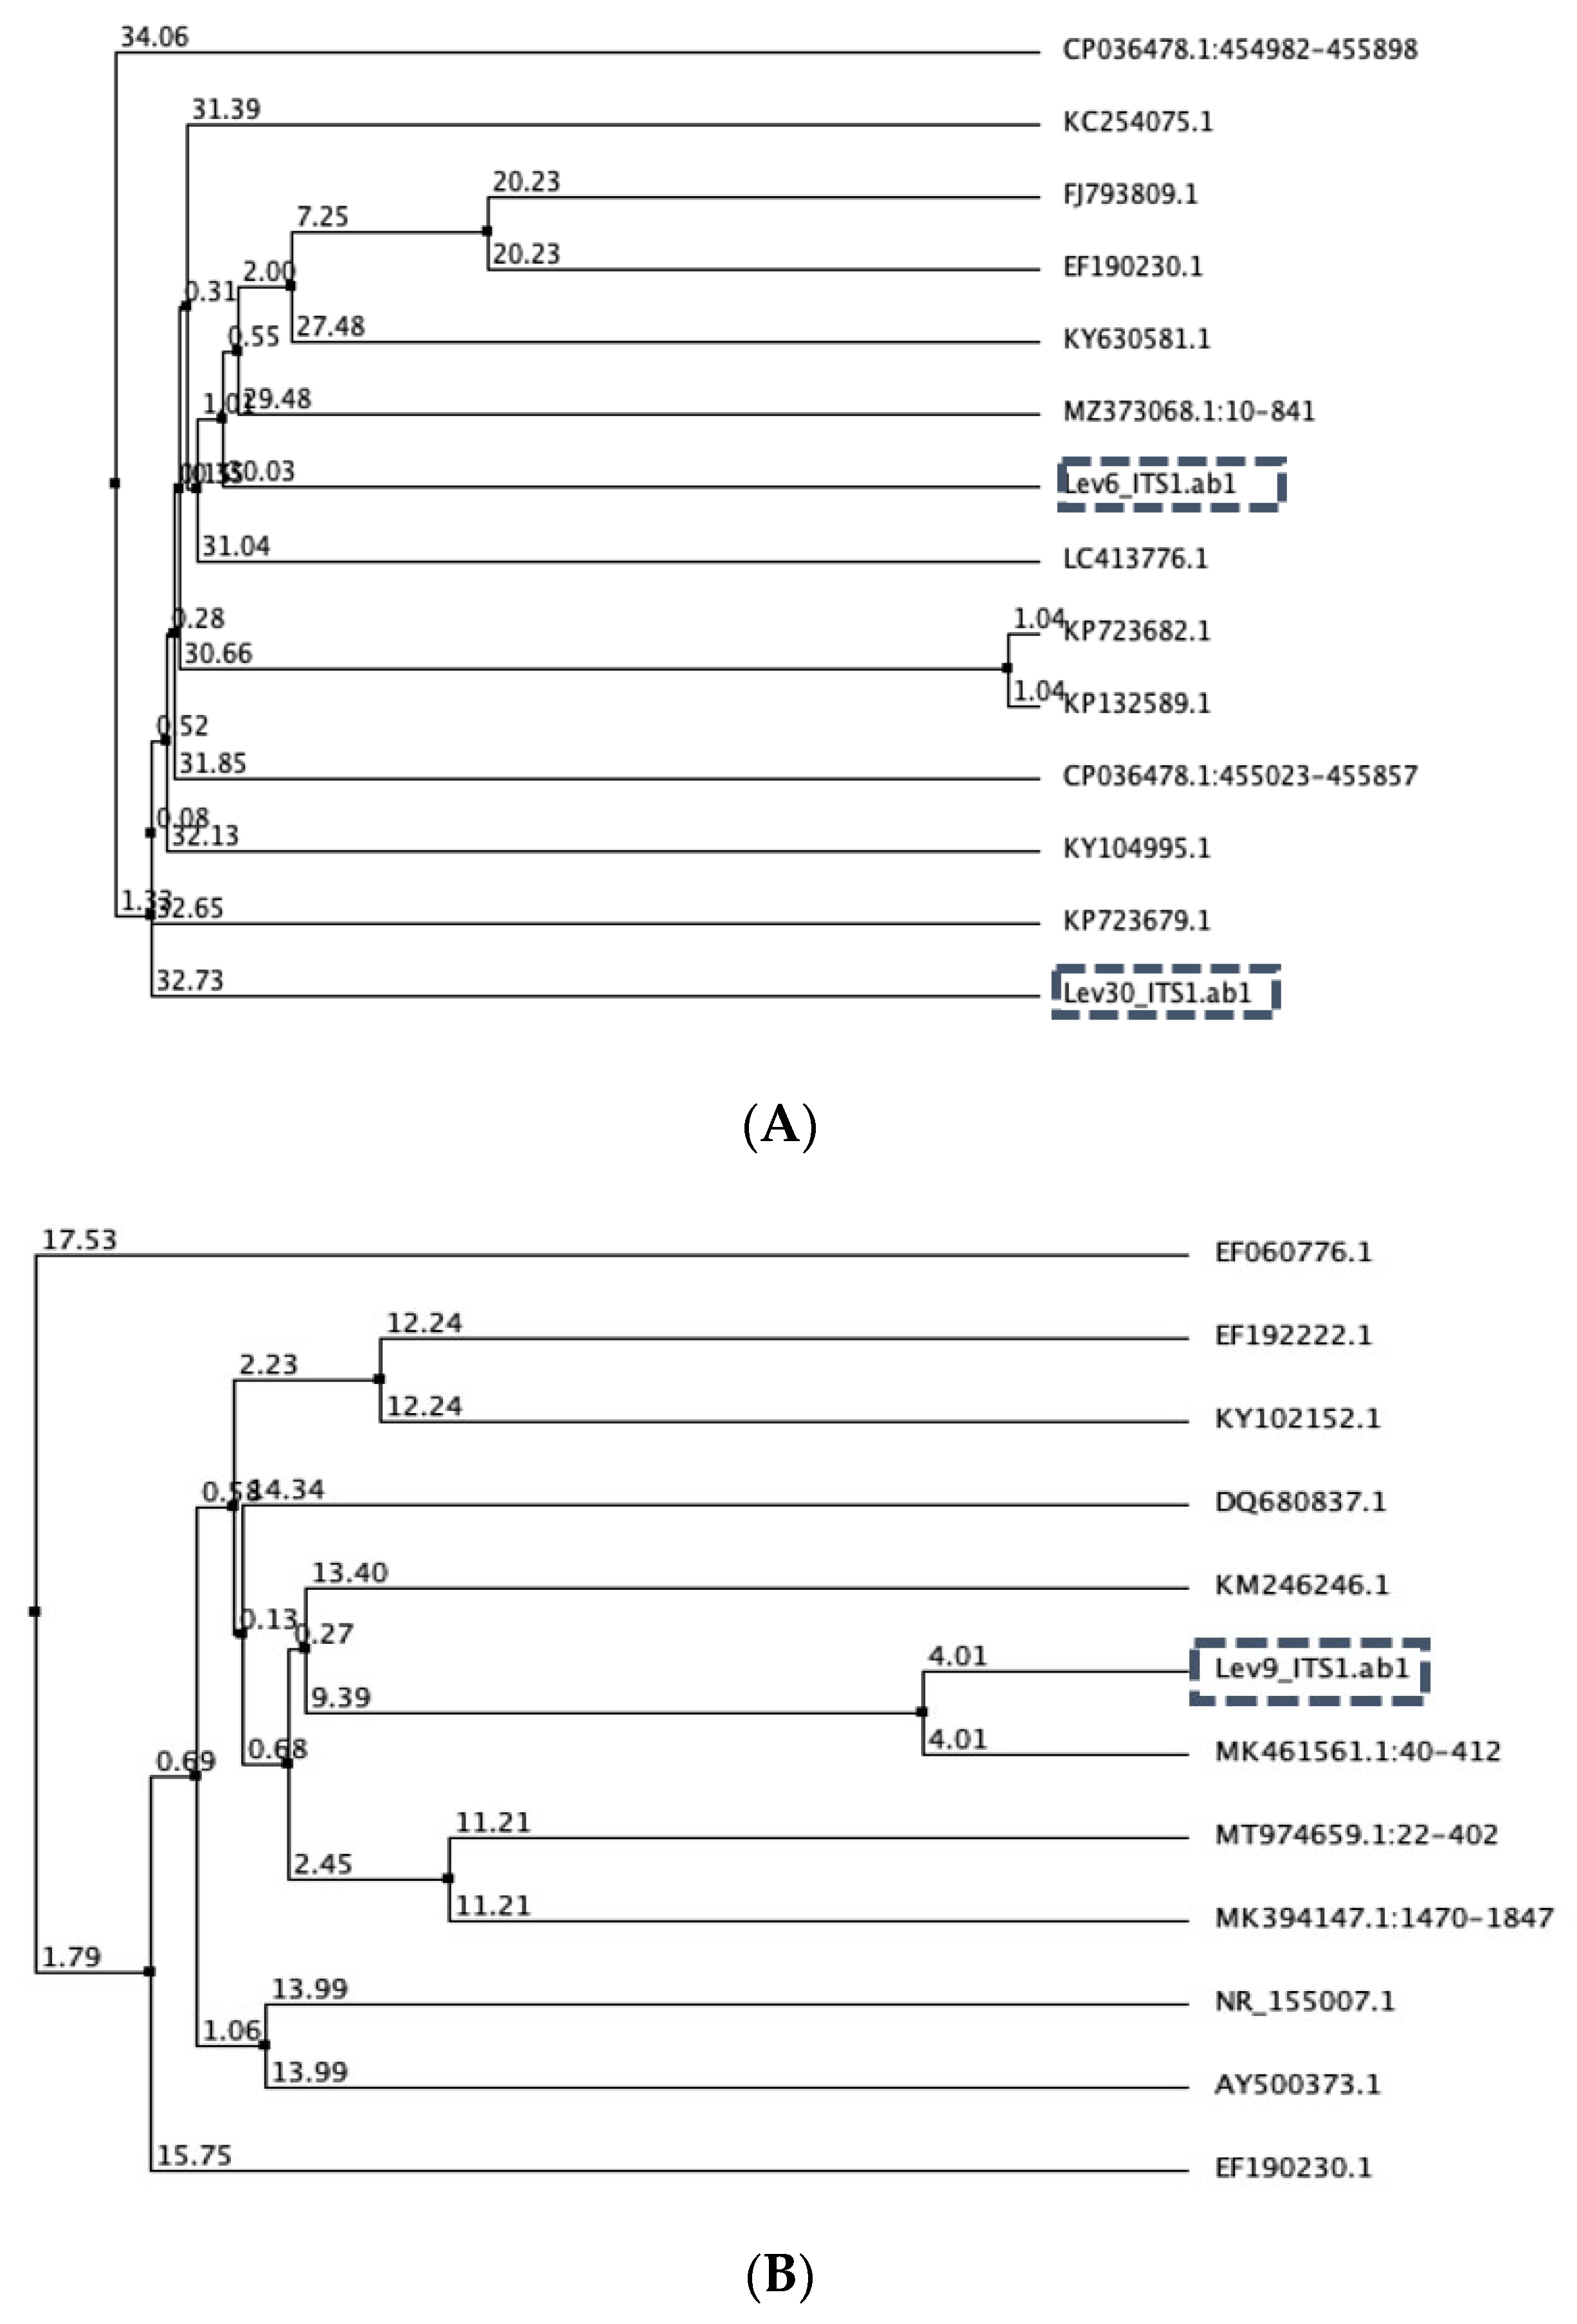
2.2. Identification of Selected Isolates

The identification of selected yeasts was performed using universal primers ITS1 (5′-TCCGTAGGTGAACCTGCGG-3′) and ITS4 (5′-GCATATCAATAAGCGGAGGA-3′) to amplify the 5.8S region, using a custom sequencing service (Macrogen Inc. Seoul, Korea). The genomic DNA isolation, PCR amplification, and sequencing were performed with a standard protocol developed by the manufacturer. The sequencing reaction was performed using a PRISM BigDye Terminator v3.1 Cycle Sequencing Kit. The DNA samples containing the extension products were added to Hi-Di formamide (Applied Biosystems, Foster City, CA, USA). The mixture was incubated at 95 °C for 5 min, followed by 5 min on ice, and then analyzed by ABI Prism 3730XL DNA analyzer (Applied Biosystems, Foster City, CA, USA). Species were phylogenetically classified by using the nBLAST sequence analysis tool to find closely related species (http://www.ncbi.nlm.nih.gov/BLAST/, accessed on 30 October 2019).

2.3. Evaluation of the Growth Kinetics of Native Yeasts In Vitro

In a total volume of 100 mL of YPD broth, 1 mL of the overnight culture (1 × 10⁷ CFU/mL) was inoculated with each selected isolate independently and incubated for 24 h at 30 °C with continuous shaking at different angular speeds of 100 rpm and 200 rpm. During incubation, a sample was taken every hour (for 8 h) to determine the cell viability. The optical density and the number of viable colonies were determined via spectrophotometric and plate count methods. At 24 h, the culture was centrifuged for 10 min at 4000 rpm and 20 °C. The cells were washed with sterile distilled water, and the weight of the biomass was determined (grams). The maximum specific growth rate (μmax) in batch culture was calculated using the rate equation μ2 = (1/t − t0) ln(x/x0), where μmax is the maximum specific growth rate (h − 1), x is the final biomass concentration log (CFU/mL), x0 is the initial log biomass concentration log(CFU/mL), t is the time where the maximum cell growth was recorded (h), and t0 is the time where the exponential phase (h) begins [26]. Moreover, the volumetric productivity (Pv), defined as the amount of biomass or cells produced in the unit of culture volume, and the unit of time were determined (Pv = Cx/t; where Pv is the volumetric productivity (CFU/mL × h), Cx is the total cell concentration (CFU/mL), and t is the total time of cell growth (h)), as previously described [27]. The data obtained from (CFU/mL) at 8 h were used, since at this time the maximum value of cell growth was obtained in all treatments.

2.4. Study of Fermentation Variables with Native Yeasts in Sugarcane Juice

The selected substrate was juice extracted from the black sugarcane POJ 27-14 variety, which was purchased from local cultivators. The juice was sterilized (15 min, 121 °C), and the initial characteristics were established at 18 °Brix and pH 5.5. The sugarcane juice was inoculated with 5% (1.3 g) and 8% (2.2 g) (250 mL flask) of each yeast biomass previously obtained from propagation in YPD broth and incubated for 24 h at 30 °C and 200 rpm. At different time intervals (0, 2, 4, 6, and 24 h), aliquots were taken to determine cell viability. The results were expressed in log (CFU/mL) using the plate count method. The changes in total soluble solids (°Brix) and pH were monitored during incubation. Briefly, a digital refractometer was employed to determine the total sugar in the solution, and for pH determination, a digital pH meter (Mettler Toledo SevenCompact S210, Merck & Co., Kenilworth, NJ, USA) was used. For the fermentation process, two commercial yeasts were used: Reference Control 1: Pure Turbo Yeast (PTY), a mixture of dried yeast (Saccharomyces cerevisiae), nutrients, bentonite, antifoam agent, vitamins, and trace elements; and Reference Control 2: Classic 8 Turbo Yeast (CTY), consisting of bentonite, a mixture of dried yeast (Saccharomyces cerevisiae), nutrients, silicon dioxide, antifoam agent, vitamins, trace elements. Both controls are yeasts extracted from wine grapes mixed with nutrients specifically intended for alcoholic fermentation [28,29].

2.5. Determination of Alcoholic Degree

The alcoholic fermentation was carried out in a volume of 1 L of sterile sugarcane juice with a constant soluble solids content of 18 °Brix and pH 5.5. The fermentation time was 72 h. Measurements of °Brix and pH were taken at the beginning and end of the experimentation, and the amount of biomass obtained was determined at the end of the fermentation. The calculation of the alcoholic degree (ABV% v/v) of the product obtained was carried out based on the standard method issued by the Organization International of Vine and Wine (Method OIV-MA-AS312-01A).

2.6. Determination of the Yield of Alcohol, Biomass Production, Ethanol Concentration and Volumetric Productivity

The evaluation of the alcoholic fermentation process was based on the biomass/substrate yield (Yx/s) and product/substrate yield (Yp/s) determination. This method was used to evaluate whether the target yeasts had a greater tendency to produce alcohol or biomass during the fermentation process. The consumption of the substrate was carried out as previously described [15]. The yield expresses the amount of yeast produced per amount of substrate consumed, which was determined as described [1,26]. In brief, the following equation was used: Y(x/s) = ∆X/∆S (where Y(x/s) is the biomass/substrate yield, ∆X is the amount of biomass produced (g/mL), and ∆S is the amount of substrate consumed (g/mL). To determine the Yp/s, the following equation was used: Yp/s = ∆P/∆S, where Yp/s is the product/substrate yield, ∆P is the amount of product produced (g/mL), and ∆S is the amount of substrate consumed (g/mL) [30]. The fermentation efficiency was calculated according to the following equation: % efficiency = (practical yield of ethanol/theoretical ethanol) × 100. In addition, ethanol concentration (Q = g/L) and volumetric productivity (Qp: ethanol produced per volume of medium per unit of time (g/L/h) were determined as previously described [31].

2.7. GC-MS Spectrometry to Analyze the Production of Ethanol and Other Byproducts

GC-MS analysis was performed on an Agilent GC-MS 7820A—5977E gas chromatograph with a flame ionization detector. The results of this process were expressed in the relative percentages of the molecules identified for each retention time analyzed [32].

2.8. Statistical Analysis

The results were reported as mean ± standard deviation. The normal distribution of the data was employed with the Shapiro–Wilk test (RStudio Version 1.2.1335, RStudio, Inc., Boston, MA, USA, 2019). One-way ANOVA and Tukey’s means comparison test were performed to determine significant differences (p < 0.05) in the viability of the yeasts and agitation process results (SPSS 13.0, Inc., Chicago, IL, USA). Principal component analysis (PCA) was conducted on the consumption of soluble solids (°Brix), pH variation, and cell viability expressed as log (CFU/mL). In addition, Pearson correlation was performed to find whether there was an interaction between the response variables.

3. Results and Discussion

3.1. Yeast Identification

In this study, three native yeasts isolated from wild tropical fruits were selected, identified, and assessed for their capacity to produce ethanol from black sugarcane juice. The isolates showed small variation according to their shape, color, margins, and surface. The isolates Lev6 and Lev30 were oval cells with budding, smooth colonies, white-yellow in color, and a shiny surface, while Lev9 showed small cells with a beige color. Cell morphology was observed under an electronic microscope (Figure S1). Based on BLAST analysis of the internal transcribed spacer 1 sequence, 5.8S ribosomal RNA, and internal transcribed spacer 2 against the NCBI database, Lev6 and Lev30 were classified as Saccharomyces cerevisiae with 99% and 98% nucleotide sequence identity, respectively. The isolate Lev9 was classified as Candida intermedia with 99% identity. In general, Saccharomyces ssp. are ubiquitous microorganisms that grow on different substrates with superior fermentation capacity on glucose [33]. Candida intermedia is a nonconventional, xylose-utilizing species of the Metchnikowiaceae family, genus Clavispora, with a high-capacity xylose transport system; therefore, it was detected as an attractive species to produce ethanol from lignocellulosic biomass [34]. Using multiple sequences alignment with Jalview (version 2.10.1) [35], the average distance was calculated from the percentage of identity between the sequences of some Saccharomyces cerevisiae and Candida ssp. strains retrieved from the database and the IST1 contig of the selected yeasts, revealing larger genetic variability within the strains (Figure 1A,B). Lev6 and Lev30 were very distant from each other and were located on different clades. The closest genome to Lev6 was S. cerevisiae obtained from wine (MZ373068.1), while the closest genome to Lev30 was S. cerevisiae strain CEN. PK113/7D (CP046092.1). The closest genome to Lev9 was C. intermedia strain BRM 046304 (MK461561.1).

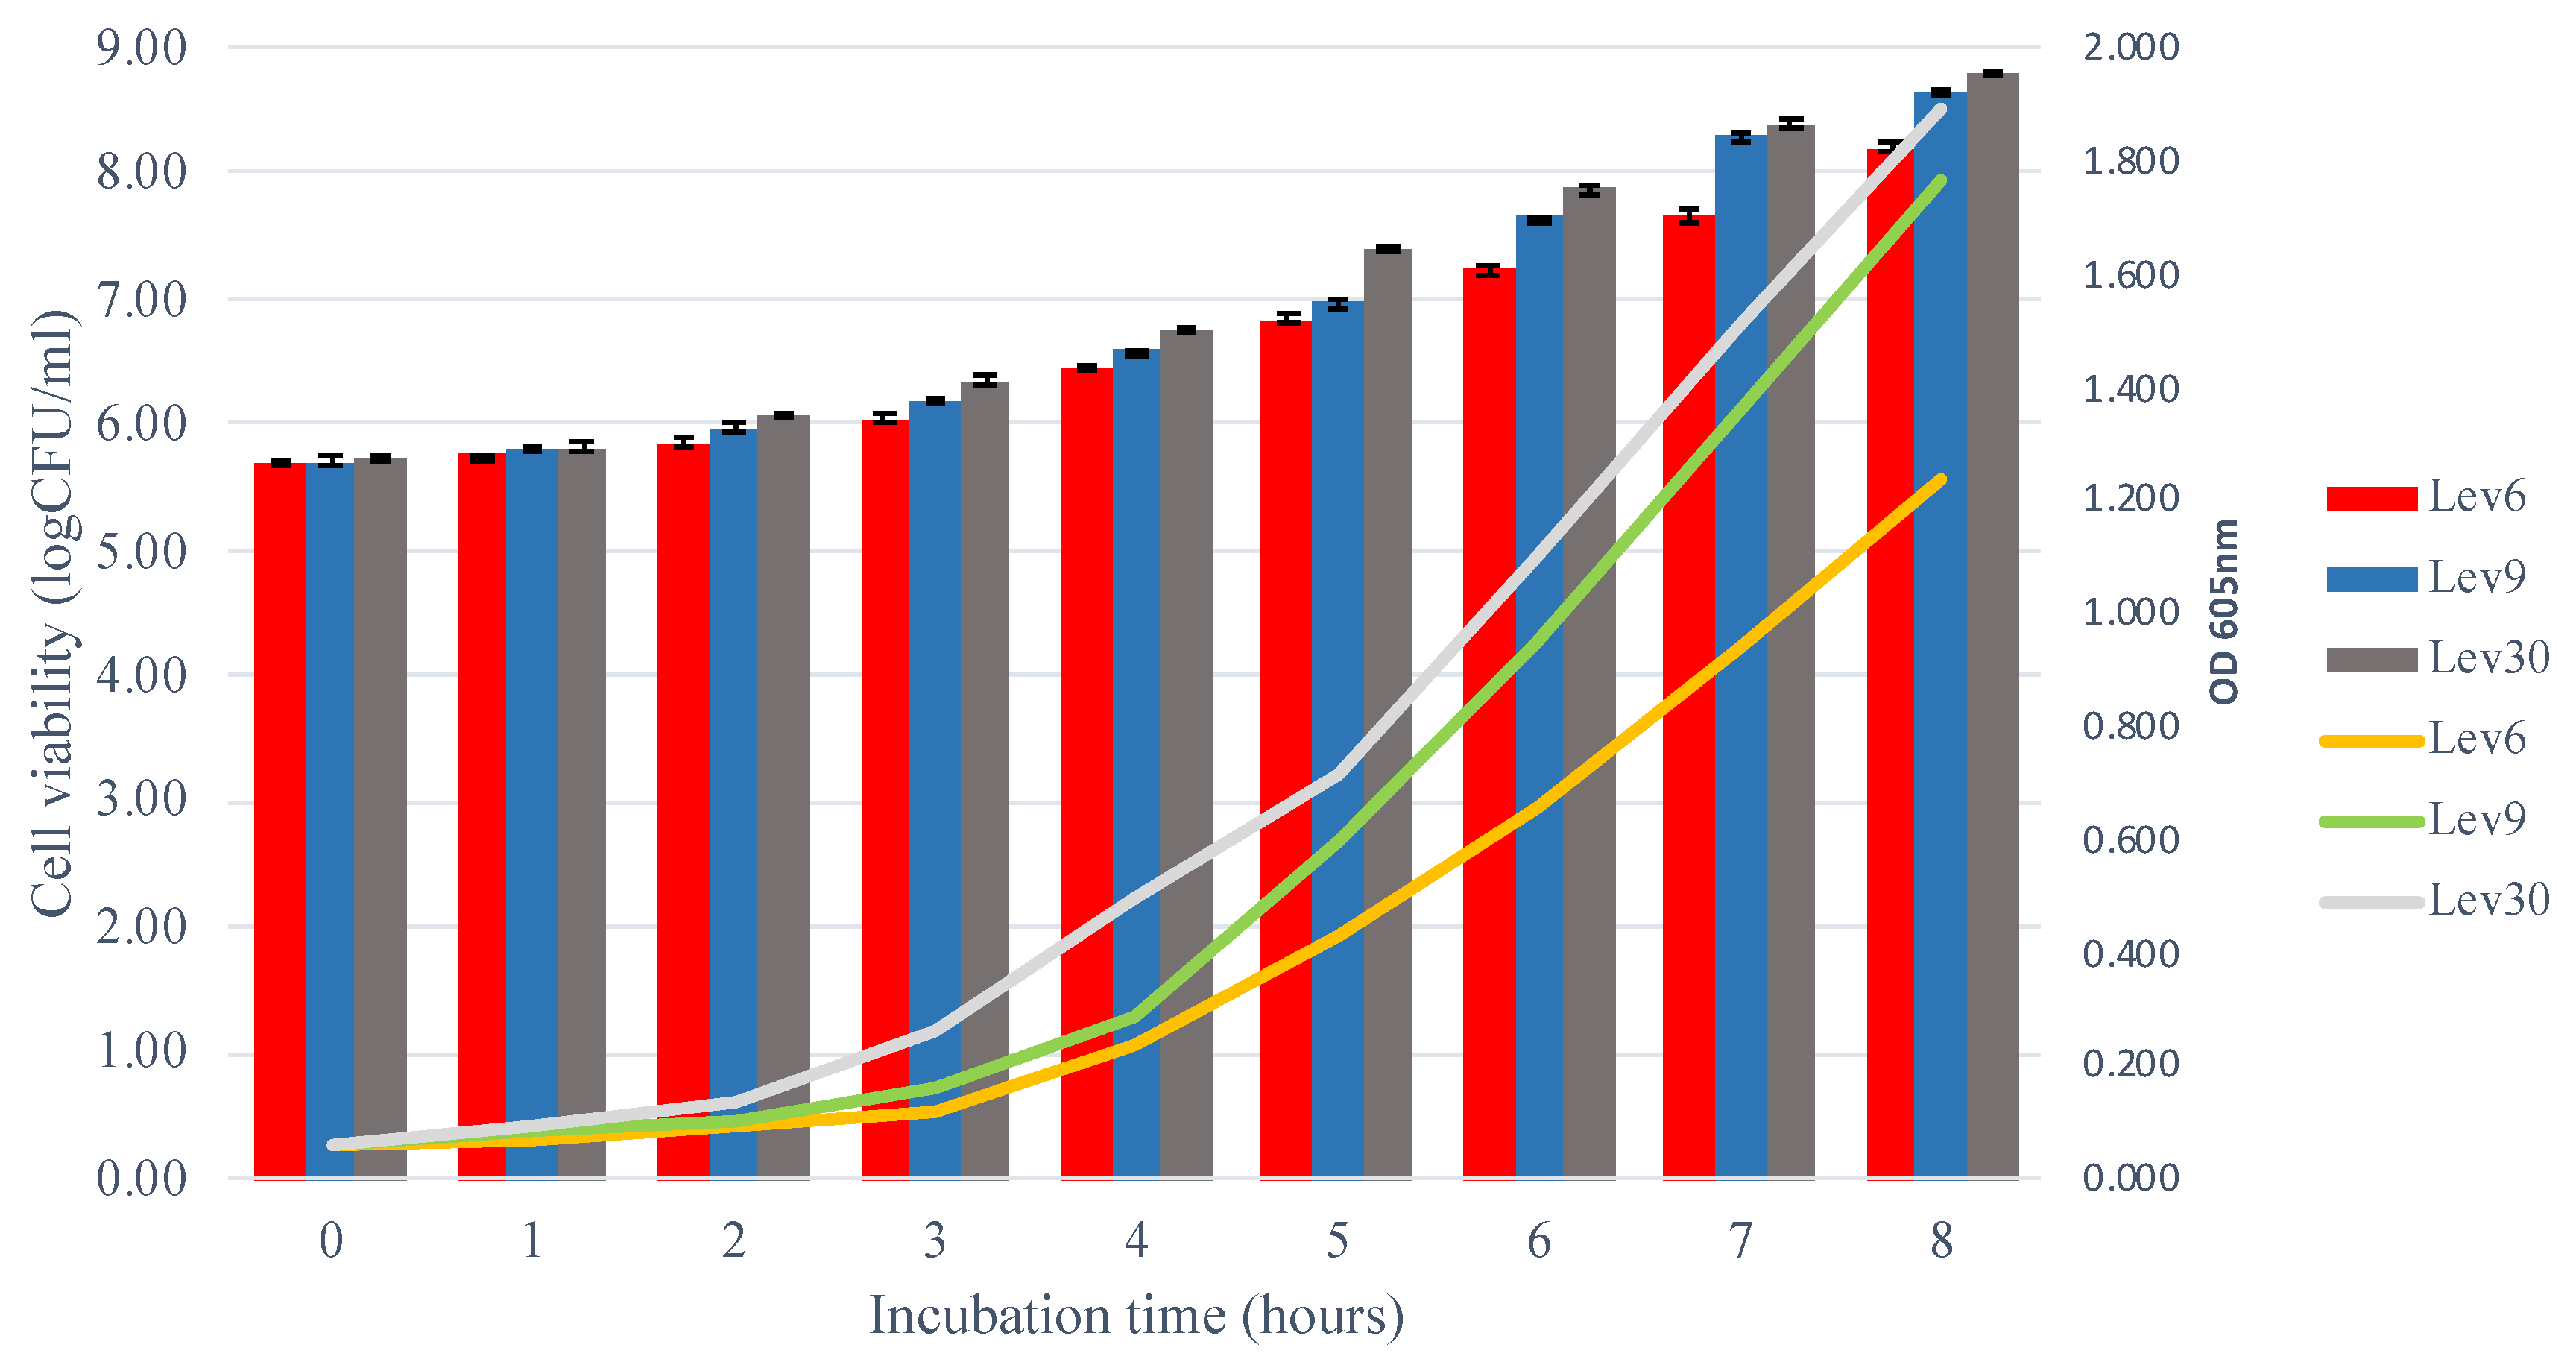
3.2. Growth Kinetics of Selected Yeasts

The results from the 8 h of incubation in YPD broth showed greater cell growth of the isolates at 200 rpm (Figure 2). A comparison between the cell growth at 100 and 200 rpm is shown in Figure S2A–C. The exponential phase of cell growth began at 4 h of incubation. At Hour 5, the superiority in the cell growth of the treatment incubated at 200 rpm of shaking was evident. At Hour 8, the maximum cell growth registered for Lev6 was 1.239 (OD605), with final biomass of 1.3 g at 24 h. Similarly, Lev9 showed greater growth at 200 rpm, with 8.64 log (CFU/mL) and 1.4 g biomass production. At both 100 and 200 rpm, the exponential growth phase began from Hour 3 for Lev30. Lev30 showed the greatest cell biomass obtained with 200 rpm shaking, with 1.5 g and 8.78 log (CFU/mL). Based on the statistical analysis, there was a significant increase (p < 0.0001) in cell growth for Lev9 and Lev30 and the lowest growth for Lev6 (Figure 3). These results were comparable with previous research showing an increase in yeast biomass production at 200 rpm at 30 ºC [36]. The statistical analysis [quantile-quantile graph (Q-Q plots)] allowed us to observe that there was normality in the distribution of the data with a result of r = 0.986 (Figure S3A), while the scatter diagram indicated that the data were homogeneous (Figure S3B). Regarding the growth rate (µmax), analysis of variance and Tukey’s test were carried out to show whether there was a significant difference between the treatments. The highest growth rate of 0.41 g/h was registered for Lev9 and Lev30, while the lowest growth rate was registered for Lev6 (0.31 g/h) (Figure S4A). Similarly, the volumetric productivity (Pv) showed the same trend as obtained with the growth rate (Figure S4B). These results were superior to those reported by Aguilar et al. [37], who showed a maximum µmax value of 0.1033/h when growing Saccharomyces cerevisiae in a cane molasses medium. The superiority in the µmax values might depend on the strain performance on adaptation to a certain substrate. Regarding volumetric productivity (Pv), the Lev30 strain presented the highest value of this variable with an average of 7.55 (CFU/mL) × h, followed by the Lev9 strain, with an average of 5.52 (CFU/mL) × h.

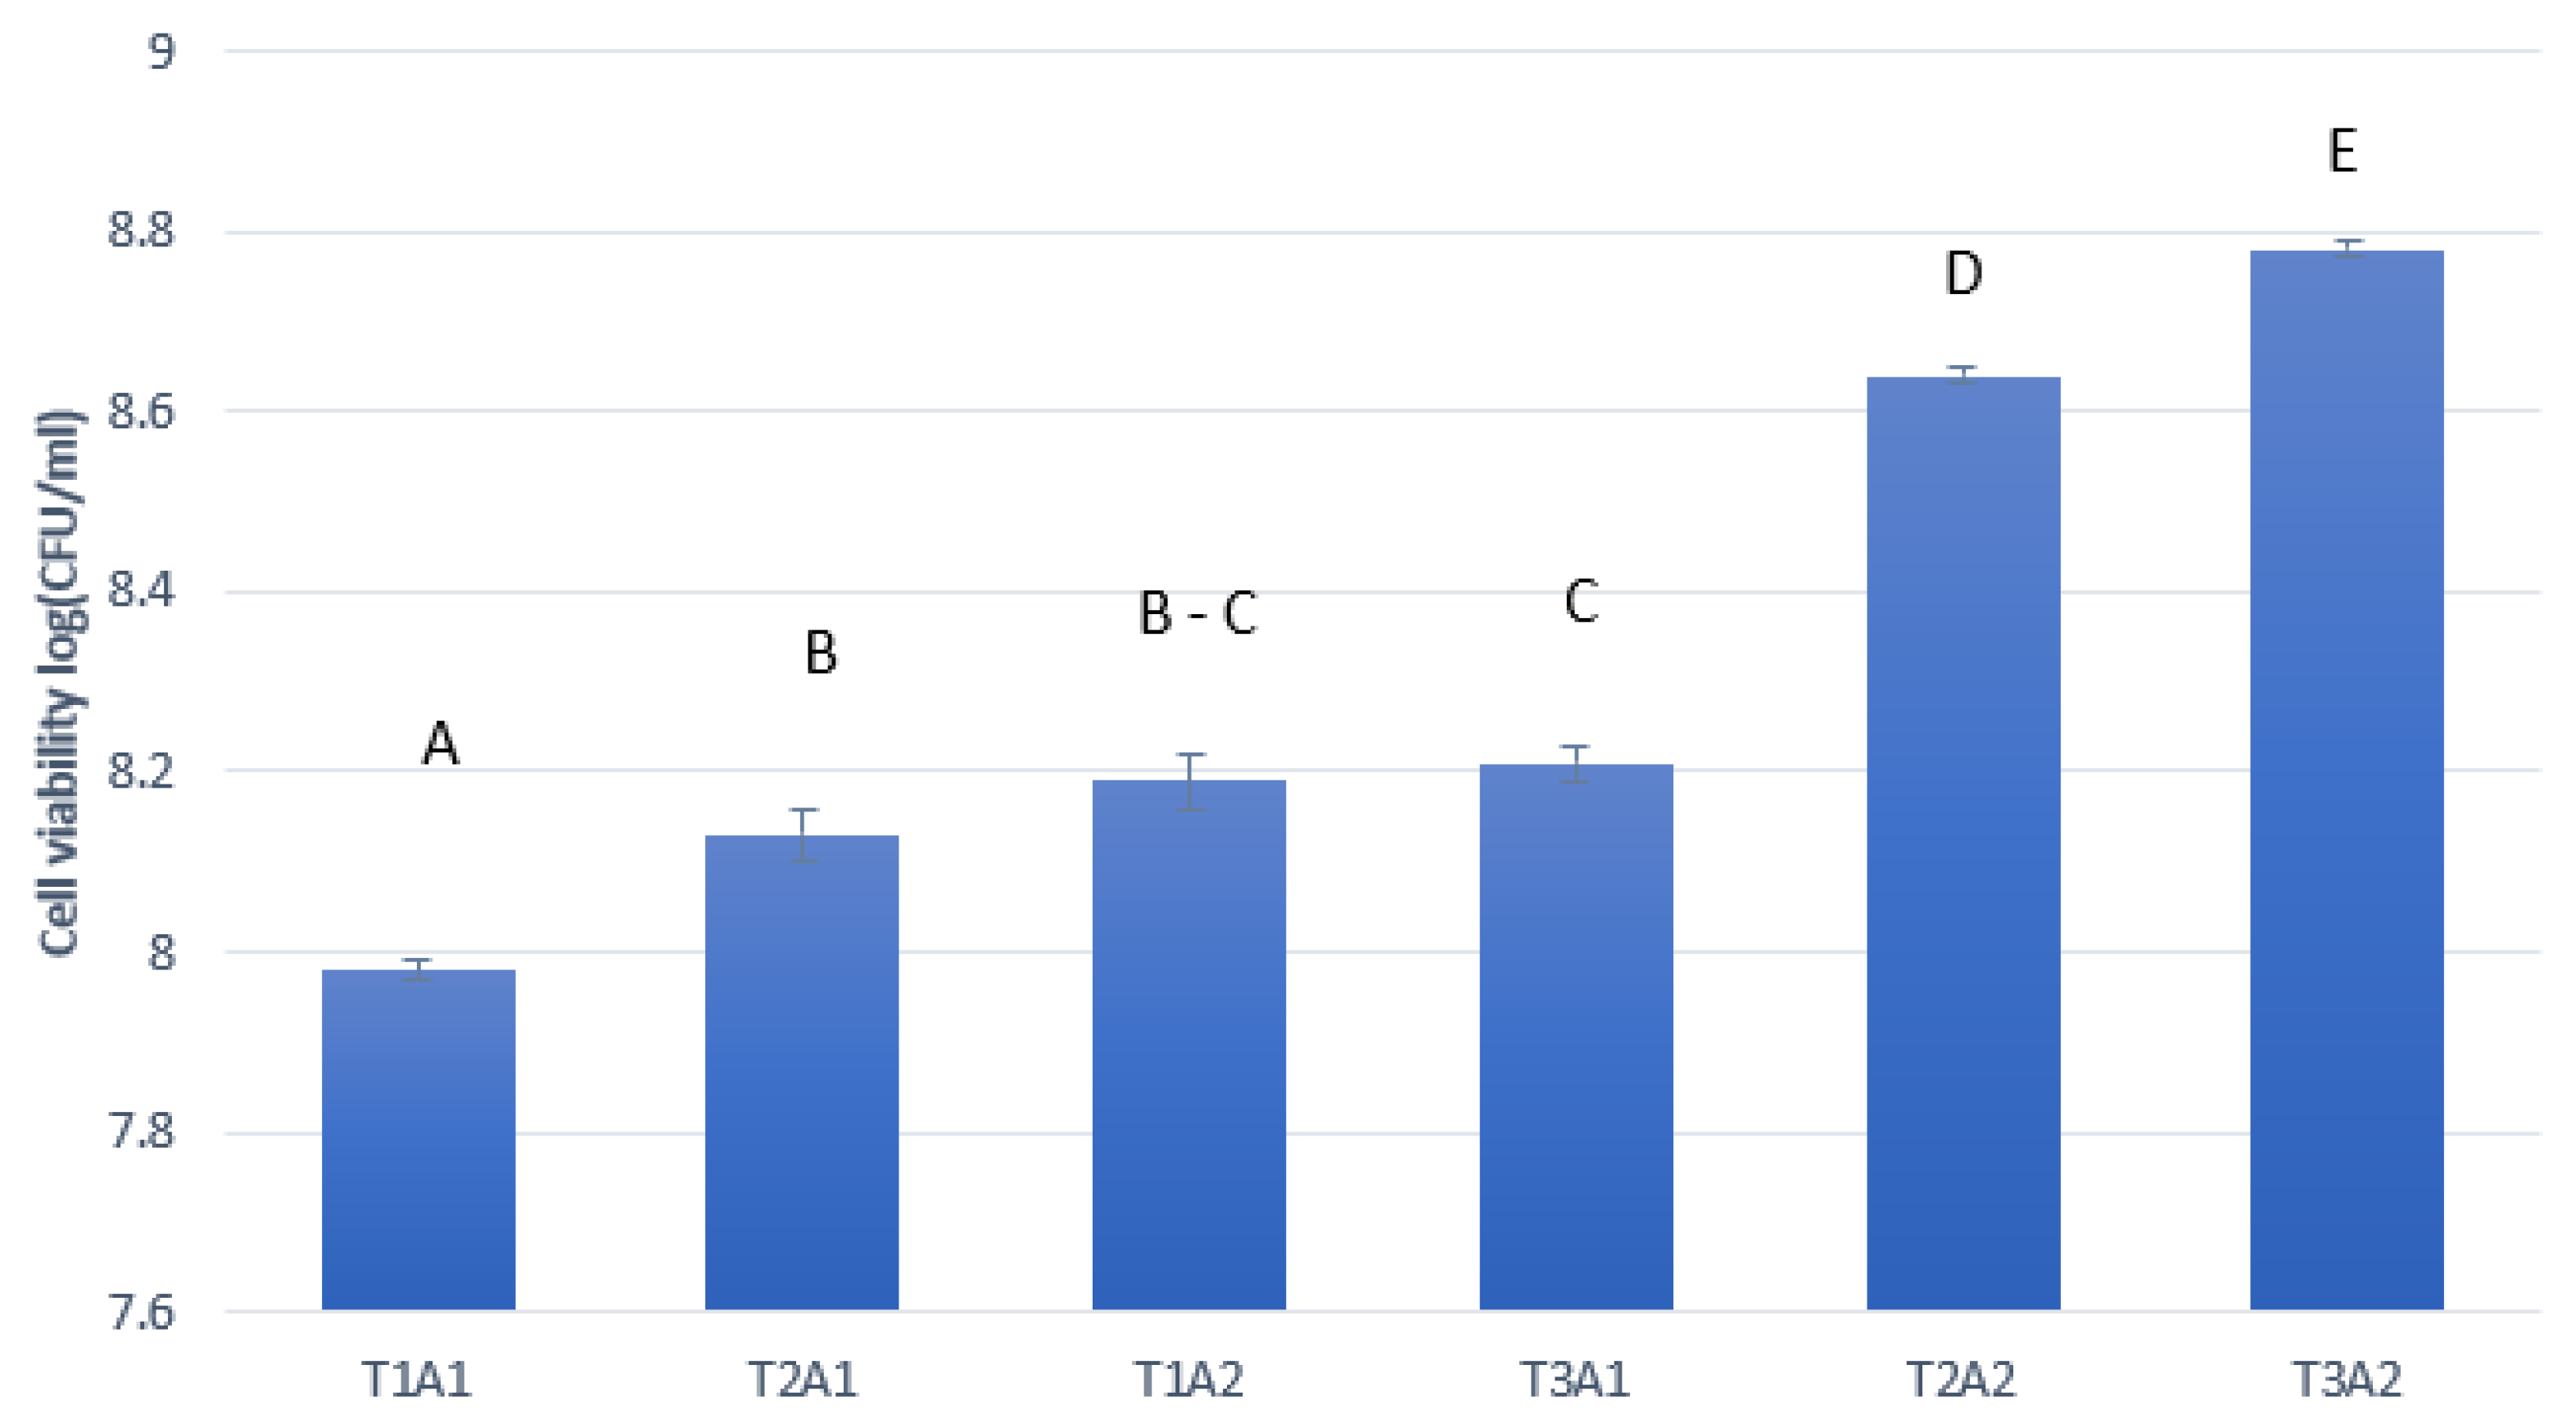
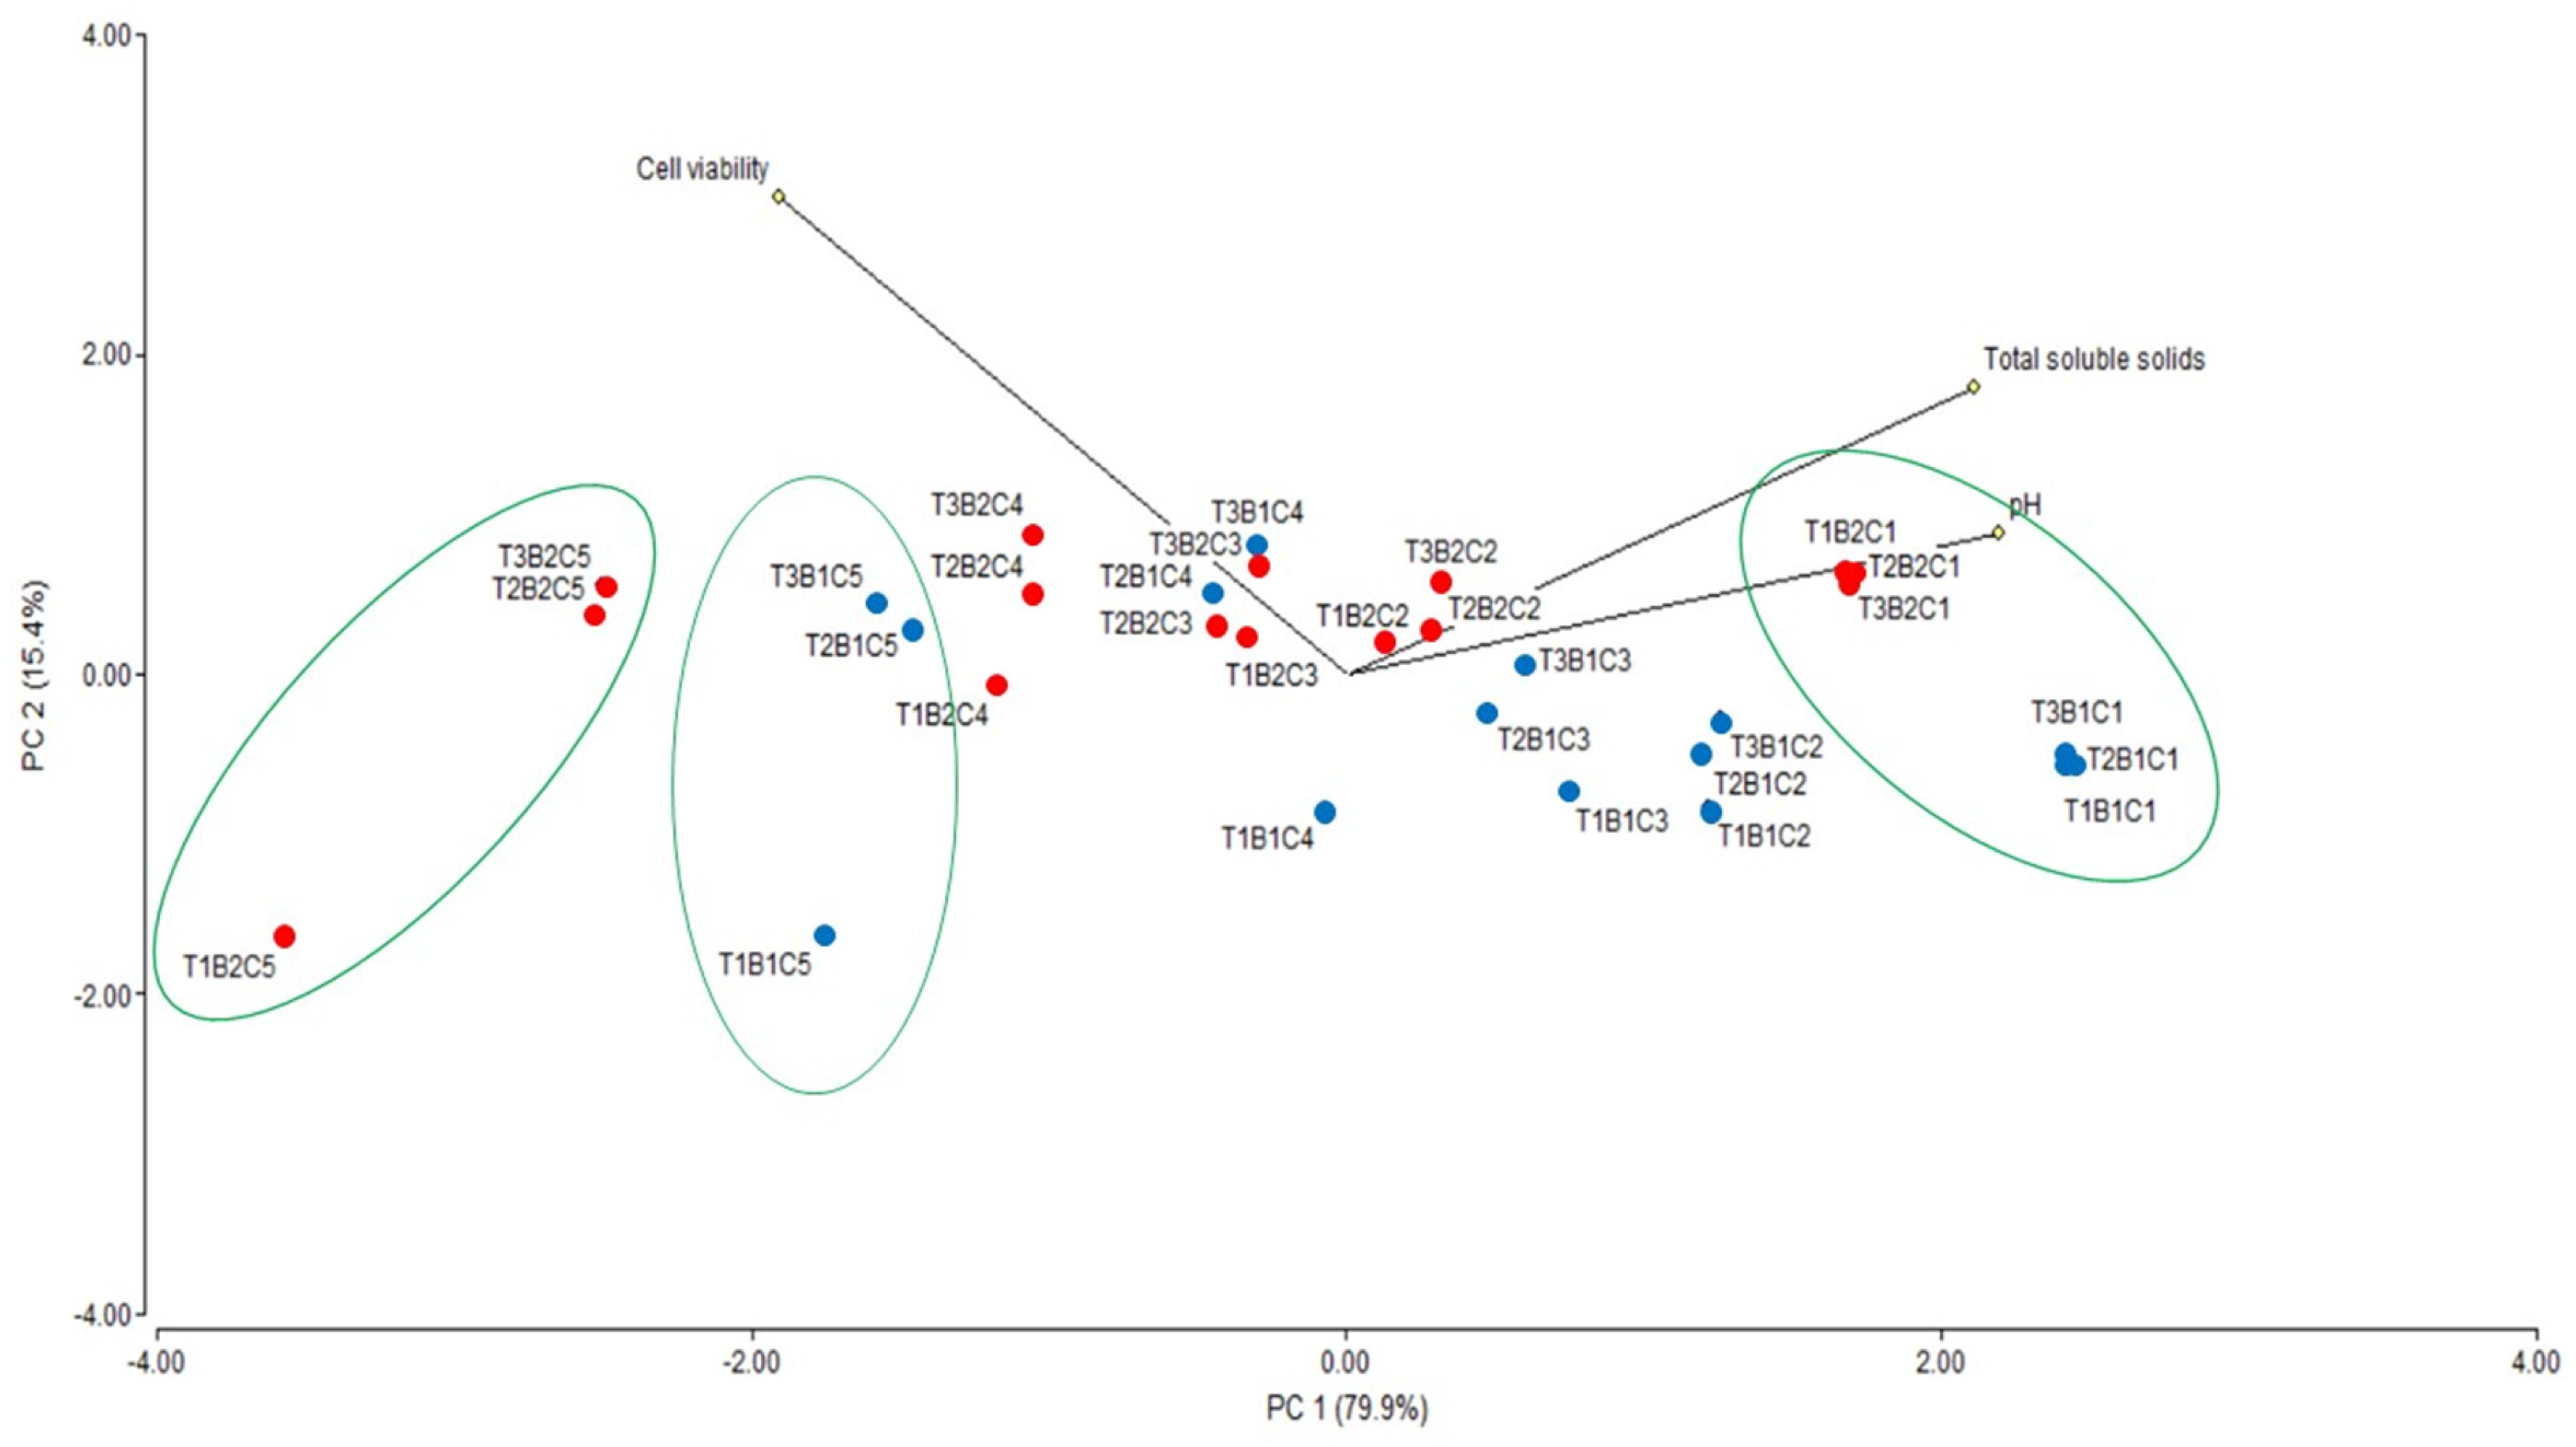
3.3. Fermentation and Ethanol Production from Sugarcane

The black sugarcane juice POJ27-14 variety was used as a substrate to obtain bioethanol by the fermentation process due to the high production and availability throughout the year in northern Ecuador. However, the selected native yeasts were tested for ethanol production capacity, as the alcoholic fermentation microorganisms are vital to obtaining a high-quality product. To optimize the fermentation process, the variables pH and soluble solids of sugarcane were established at 5.5 and 18 °Brix. These values were considered based on the initial measurements of the sugarcane juice, showing a constant pH of 5.5 but variable in the total soluble solids content (16–18). Previous research established initial parameters for sugarcane juice with 24–26 °Brix and pH 5.5 to be tested for ethanol production [38]. In addition, the effect of the initial biomass inoculum of native yeasts was evaluated based on the optimal quantity (8% concerning the volume of the substrate) recommended for the commercial controls [29]. In this study, during fermentation, the pH, the total soluble solids, and cell viability of the three native yeasts with an initial inoculum of 5% and 8% cell biomass in the sugarcane medium were compared with the commercial yeasts at different intervals of incubation time. A biplot was created using the PCA scores and factor loading to compare the similarities of the variables obtained with the five yeasts during fermentation. PCA of the three factors demonstrated a clear separation between the yeasts employed in the fermentation process (Figure 4). PC1 explained 79.9% of the total variance, while PC2 explained 15.4%. We observed that the samples at the beginning of the fermentation process (0 h) were loaded in a positive (+) direction, with the samples showing greater pH and soluble solids and the lowest viability. At 2, 4, and 6 h of fermentation, all yeasts with the initial inoculum of 5% represented the lowest viability; therefore, they were located distant from this vector. At 24 h, both Lev9 and Lev30, with the initial inoculum of 8% cells showed the highest viability, while Lev6 showed the lowest viability but the highest consumption of total solids and decrease in pH, indicating that this strain has superior fermentation capacity. Lev9 and Lev30 were found to exhibit similar behavior in terms of cell viability, as they produced superior biomass at 24 h of fermentation. Nonetheless, all native yeasts with an initial inoculum of 8% cell biomass showed a similar fermentation pattern with greater consumption of total solids, which coincides with the diminution of pH, indicating that the highest biomass accelerates the fermentation process. These results agree with previous investigations, which state that the higher the inoculum, the shorter the fermentation time. However, exceeding the initial inoculum in the order of 10–20% of the volume of substrate demands resources, time, and money, since it is advisable to use an inoculum less than 10% [39]. In the treatment with 5% initial biomass, the substrate consumption was lower, resulting in low ethanol production. It was suggested that the insufficient low cell density might cause cellular inhibition due to osmotic stress [40]. The treatment with 8% initial biomass had a higher consumption of substrate; nonetheless, the consumption of soluble solids was low in all treatments. This effect can be caused by high concentrations of ethanol, extreme temperatures, pesticide residues, deficiency of some type of nutrients, competition from other microbes, or high concentrations of SO2 [41]. Regarding the three vectors of the variables studied, it was observed that the soluble solids and pH were very close to each other, indicating that both variables are correlated throughout the experimentation. However, the cell viability vector formed an angle of approximately 90º between the other vectors, which means that this is an independent vector, or it has a low relation with the soluble solids and pH variables. The soluble solids and pH vectors are those that most influence the main component or axis 1 (59% and 61%), while the vector of cell viability influences with greater superiority on the main component 2 (83%). However, a Pearson correlation coefficient test was performed to study in detail the intensity of the correlations between the variables. Table 1 shows the correlation values that exist between the variables studied. The pH and soluble solids showed the highest correlation value of 0.84; with decreased soluble solids, a decrease in pH was noted. In addition, the highest correlation occurs between cell viability and pH with a value of −0.668, which indicates that there is an inverse correlation between the variables. As the cell viability increased, the pH decreased. Finally, the variables of soluble solids and cell viability showed a moderate inverse correlation of −0.571, suggesting that with an increase in cell viability, the soluble solids decrease, but this will not always happen according to Pearson’s correlation.

3.4. Production of Ethanol and Byproducts Obtained from Alcoholic Fermentation

The analysis of the products obtained from the alcoholic fermentation of the treatments (native yeasts and commercial controls) allowed us to determine the characteristics they possess in terms of the yield of alcoholic or biomass products and what types of alcoholic compounds can be produced. Table 2 shows the results obtained from the yield Yp/s, Yx/s, Q, and Qp corresponding to the native yeasts and reference strains. The yields were calculated based on the consumption of substrate (soluble solids). Regarding the yield Yp/s, a superiority of Lev6 was evident, whose treatment presents the highest value in terms of alcoholic production (225 mL) and 3.4% ABV, indicating that a low substrate was required to generate the said product. Although Control 1 generated a superior % ABV (7.1), the yield Yp/s was low because it consumed a high amount of substrate for the said product. The fermentation of sugarcane juice with Lev30 registered the best yield Yx/s, with a high value of 28.2%. This is because it generated a large amount of biomass while the consumption of the substrate was lower, and the controls were those treatments that generated less biomass production. Based on these Yp/s results, we determined that the native yeasts presented better performance than the commercial controls. Among native yeasts, Lev6 showed the highest ethanol concentration of 43.92 g/L, followed by Lev9 and Lev30, with 25.92 g/L and 24.48 g/L, respectively. The volumetric productivity was 0.61 g/L/h for Lev6 and 0.36 and 0.34 g/L/h for Lev9 and Lev30, respectively, in sugarcane juice without nutrients supplementation. Nonetheless, the commercial yeasts are intended to be used in alcoholic fermentation in a water substrate plus turbo sugar, but the yield of 14% guaranteed by the producer could not be achieved when sugarcane was used as substrate [28]. The substrate required for these controls was 286 g of turbo sugar for each liter of water, which is equivalent to an initial 28–29 °Brix and a controlled temperature of 18–20 °C. Therefore, native yeasts in sugarcane juice at conditions of 18 °Brix, 5.5 pH, and room temperature have better fermentation capacity than commercial controls. In the Yx/s yield, there was a notable superiority of the native yeasts concerning the commercial controls. This high yield is due to two main causes: the native yeasts generated a large amount of biomass with low consumption of substrate. This generated a high yield value, and the low yield of commercial yeasts was generated because they are not intended for biomass production and additionally require high consumption of substrate to generate said biomass. The high level of biomass production by some yeast species is related to their sugar metabolism is directed toward the oxidative pathway to achieve the maximum energy yield of ATP and the formation of biomass. For said production, there are two fundamental variables: the oxygen transfer rate and glucose concentration in the broth medium. A previous study indicated 50% of biomass yield in pure oxidative growth [42]. Early research using two recombinant microorganisms, Escherichia coli strain KO11 and Klebsiella oxytoca strain P2, showed an increase in ethanol production from sugarcane juice fermentation after being supplemented with 0.5% yeast extract, LB medium with broth ingredients or ammonium sulfate micronutrients, and/or thiamine [31]. The recombinant P2 showed superior results than KO11 in the fermentation of sugarcane juice and molasses, with higher ethanol yields, volumetric production, and stability during fermentation [31]. In this study, considering that no supplementary nutrients were added in the medium, Lev6 strain presented the highest yield in ethanol production and comparable Qp value with the control yeasts, while Lev 30 strain presented the highest yield in the production of biomass in sugarcane juice.

3.5. Analysis of Molecules Detected upon Fermentation

For the identification of products or molecules resulting from the fermentation product (alcohol), the gas chromatography method (GC-MS) was used [43,44]. The results obtained are presented in Table 3. The byproducts chromatograms are shown in Figure S5A–E. The selected native and control yeasts produced ethanol from sugarcane juice substrate and showed similar retention times (around 1.5 min). The retention time (Rt) obtained from gas chromatography provides information about the time a solute is maintained in a column, and its duration depends on the interaction of the analyte with the stationary phase. The stronger the interaction, the greater the retention time [45]. However, the Lev6 treatment presented the highest peak of ethanol concentration in 1542 min. This result is related to the Yp/s calculated yield. The highest concentration of ethanol was produced by the commercial reference control 2 with a 99.965% relative percentage. Lev6 is the microorganism that had the best results for alcoholic fermentation according to the Yp/s yield and purity of the ethanol obtained (99.712%). Although Lev9 is a nonconventional yeast, the results indicated a relatively high percentage of ethanol (99.653%), while the lowest ethanol concentration was produced by Lev30 (98.735%). Along with ethanol, 2-aziridinylethyl amine was detected in all samples, and the highest concentration in relative percentage of this molecule was presented in Lev30. In addition, the molecules nitrile tetraacetyl-d-xylonic and carbon dioxide were detected in Lev30 and Reference Control 2, respectively. The production of ethanol is species specific and depends on the substrate used in the fermentation process. The nitrile tetraacetyl-d-xylonic is a component found within glucosinolates [46]. This molecule was detected in the alcoholic extract obtained from Croton bonplandianum leaves and was associated with the metabolism of Aspergillus niger [47]. Additionally, the authors state that this molecule is a volatile metabolite that can be extracted from endophytic fungi Fusarium spp. and has been included as one of the nitrogenous products of soybean meal fermented with Trichoderma spp. These molecules appear to be harmless in small amounts and were found to be involved in the in vitro cytotoxicity of propolis on cancer lines [48]. In addition, (2-aziridinylethyl) amine was detected in all treatments, except Reference Control 2, which is an alkaloid molecule used as an antihypertensive, antidiuretic, antidiabetic, and anti-inflammatory drug [49]. This bioactive molecule was recently extracted from the fungi Psilocybe cubensis DPT1 [49] and seeds of Persea americana (avocado) [50].

4. Conclusions

Taken together, the selected native yeasts generated ethanol and other byproducts with greater efficiency than commercial controls from the alcoholic fermentation of black sugarcane juice. The optimal conditions for the propagation of the three native yeasts were 30 °C and 200 rpm with constant stirring. By inoculating 8% of the initial biomass, a faster fermentation was generated, and a greater amount of final product was obtained. The Lev30 strain presented the highest yield in the production of biomass, while the Lev6 strain presented the highest yield in ethanol production. The use of Lev30 at a larger scale may reduce the costs of the processes because of its high biomass production performance. We shall further investigate the alcoholic fermentation efficiency using substrates of the second and third generations for greater sustainability in the production of bioethanol using the selected native yeasts. Additionally, the effect of nutrients supplementing the sugarcane juice medium to increase the yield in the alcoholic production of native yeasts should be further investigated. Overall, this research showed the efficiency of ethanol production from black sugarcane juice by employing native yeasts as a cheap and sustainable way to support small farmers to look for alternatives that may increase their daily income. The eventual implementation of using the native yeasts in the production chain of ethanol would mean an improvement in the performance of the production systems, with the added benefit of environmental sustainability.

Supplementary Materials

The following are available online at https://www.mdpi.com/article/10.3390/su131910924/s1, Figure S1: Morphology of the native yeasts; Figure S2: Growth kinetics of selected yeasts; Figure S3: (A). Q-Q plot of the data obtained from the growth of native yeasts in YPD broth. (B). Dispersion diagram; Figure S4: Analysis of variance of the µmax (A) and pV values (B). Figure S5: Chromatogram plots of byproducts detected by GC-MS analysis.

Author Contributions

Conceptualization, G.N.T.; methodology, G.N.T. and F.V.; software, F.V.; formal analysis, G.N.T. and F.V.; investigation, G.N.T. and F.V.; resources, G.N.T.; data curation, G.N.T.; writing—original draft preparation, G.N.T.; writing—review and editing, G.N.T.; visualization, G.N.T.; supervision, G.N.T.; project administration, G.N.T.; funding acquisition, G.N.T. All authors have read and agreed to the published version of the manuscript.

Funding

This research was funded by Technical University of the North, Centre of Research (CUICYT), Grant No.: 2929/2019.

Institutional Review Board Statement

Not applicable.

Informed Consent Statement

Not applicable.

Data Availability Statement

The yeasts sequences were deposited at the NCBI Database on 16 August 2021, with Accession Numbers MZ768866, MZ768867, and MZ768868, corresponding to the isolates Lev6, Lev9, and Lev30.

Acknowledgments

The authors wish to thank J. Nuñez for technical advice and D. Brown for kindly reviewing this article.

Conflicts of Interest

The authors declare no conflict of interest.

References

  1. Naik, S.N.; Goud, V.V.; Rout, P.K.; Dalai, A.K. Production of first and second generation biofuels: A comprehensive review. Renew. Sustain. Energy Rev. 2010, 14, 578–597. [Google Scholar] [CrossRef]
  2. Antoni, D.; Zverlov, V.V.; Schwarz, W.H. Biofuels from microbes. Appl. Microb. Biotechnol. 2007, 77, 23–35. [Google Scholar] [CrossRef]
  3. Sharma, Y.C.; Singh, B.; Upadhyay, S.N. Advancements in development and characterization of biodiesel: A review. Fuel 2008, 87, 2355–2373. [Google Scholar] [CrossRef]
  4. Zabed, H.; Faruq, G.; Sahu, J.N.; Azirun, M.S.; Hashim, R.; Boyce, A.N. Bioethanol production from fermentable sugar juice. Sci. World. J. 2014, 2014, 957102. [Google Scholar] [CrossRef] [PubMed] [Green Version]
  5. International Energy Agency. Global CO2 Emissions in 2019. 2020. Available online: https://www.iea.org/articles/global-co2-emissions-in-2019 (accessed on 15 March 2020).
  6. Organización Latinoamericana de Energía. Bioetanol de Caña de Azúcar. Energía para el Desarrollo Sostenible. 2008. Available online: http://www.olade.org/sites/default/files/CIDA/Biocomustibles/CEPAL/bioetanol%20ca%C3%B1a%20de%20azucar.pdf (accessed on 20 June 2020).
  7. Halder, P.; Azad, K.; Shah, S.; Sarker, E. Prospects and technological advancement of cellulosic bioethanol ecofuel production. In Advances in Eco-Fuels for a Sustainable Environment; Azad, K., Ed.; Woodhead Publishing Series in Energy; Elsevier Ltd.: Amsterdam, The Netherlands, 2019; pp. 211–236. [Google Scholar] [CrossRef]
  8. Susmozas, A.; Martín-Sampedro, R.; Ibarra, D.; Eugenio, M.E.; Iglesias, R.; Manzanares, P.; Moreno, A.D. Process strategies for the transition of 1G to sdvanced bioethanol production. Processes 2020, 8, 1310. [Google Scholar] [CrossRef]
  9. Filip, O.; Janda, K.; Kristoufek, L.; Zilberman, D. Food versus fuel: An updated and expanded evidence. Energy Econ. 2019, 82, 152–166. [Google Scholar] [CrossRef] [Green Version]
  10. Ministry of Environment and Water. Ecuador Impulsa la Gestión Adecuada de Residuos Orgánicos en las Ciudades. Available online: https://www.ambiente.gob.ec/ecuador-impulsa-la-gestion-adecuada-de-residuos-organicos-en-las-ciudades/ (accessed on 22 July 2020).
  11. Ecuador Sugar Cane Research Center. Report 2016. Available online: https://cincae.org/wp-content/uploads/2013/04/Informe-Anual-2016.pdf (accessed on 10 June 2020).
  12. Piedra, V.; Núñez, J. Importancia de la Destilación de Etanol para el Desarrollo de la Economía del Ecuador. Report 2016. Available online: https://es.scribd.com/document/339659614/Produccion-de-etanol-en-el-ecuador (accessed on 23 January 2020).
  13. Paucar, J.; Robalino, J. Modelo Estratégico para la Industrialización de la Caña de azucar en el Ecuador. 2009. Available online: http://bibdigital.epn.edu.ec/bitstream/15000/8489/3/CD-2144.pdf (accessed on 5 December 2019).
  14. Sánchez, O.J.; Cardona, C.A. Trends in biotechnological production of fuel ethanol from different feedstocks. Bioresour. Technol. 2008, 99, 5270–5295. [Google Scholar] [CrossRef]
  15. National Institute of Statistics and Censuses. Estadísticas Agropecuarias. Report 2019. Available online: https://www.ecuadorencifras.gob.ec/estadisticas-agropecuarias-2/ (accessed on 22 July 2020).
  16. Jurado, C.N. La Industria de los Biocombustibles en Ecuador: Caso Producción y Comercialización de Etanol Anhidro en la Provincia de Bolívar. 2014. Available online: http://repositorio.puce.edu.ec/bitstream/handle/22000/6903/7.36.000576.pdf?sequence=4&isAllowed=y (accessed on 5 December 2019).
  17. Garzón, I. Biocombustibles: Conversión de Sistema de Alimentación de un Motor de Gasolina a Etanol. 2012. Available online: http://repositorio.usfq.edu.ec/bitstream/23000/2007/1/105526.pdf (accessed on 23 January 2020).
  18. Aguilar-Rivera, N. Bioetanol de la caña de azúcar. AIA 2007, 11, 25–39. [Google Scholar]
  19. Elfasakhany, A. State of art of using biofuels in spark ignition engines. Energies 2021, 14, 779. [Google Scholar] [CrossRef]
  20. Bezerra, T.L.; Ragauskas, A.J. A review of sugarcane bagasse for second-generation bioethanol and biopower production. Biofuel. Bioprod. Biorefin. 2016, 10, 634–647. [Google Scholar] [CrossRef]
  21. Arshad, M.; Abbad, M.; Iqbal, M. Ethanol production from molasses: Environmental and socioeconomic prospects in Pakistan: Feasibility and economic analysis. Environ. Technol. Innov. 2019, 14. [Google Scholar] [CrossRef]
  22. Ylitervo, P.; Franzén, C.J.; Taherzadeh, M.J. Ethanol production at elevated temperatures using encapsulation of yeast. Biotechnol. J. 2011, 156, 22–29. [Google Scholar] [CrossRef] [PubMed]
  23. Walker, G.M.; Stewart, G.G. Saccharomyces cerevisiae in the production of fermented beverages. Beverages 2016, 2, 30. [Google Scholar] [CrossRef]
  24. Djelal, H.; Chniti, S.; Jemni, M.; Weill, A.; Sayed, W.; Amrane, A. Identification of strain isolated from dates (Phœnix dactylifera L.) for enhancing very high gravity ethanol production. Environ. Sci. Pollution Res. 2017, 24, 9886–9894. [Google Scholar] [CrossRef] [PubMed]
  25. Tenea, G.N.; Jarrin-V, P.; Yepez, L. Microbiota of wild fruits from the amazon region of Ecuador: Linking diversity and functional potential of lactic acid bacteria with their origin. In Ecosystem and Biodiversity of Amazonia; Mikkola, H.J., Ed.; IntechOpen: London, UK, 2020; Available online: https://www.intechopen.com/online-first/microbiota-of-wild-fruits-from-the-amazon-region-of-ecuador-linking-diversity-and-functional-potenti (accessed on 22 January 2021). [CrossRef]
  26. Gupthar, A.; Bhattacharya, S.; Basu, T. Evaluation of the maximum specific growth rate of a yeast indicating non-linear growth trends in batch culture. World J. Microbiol. Biotechnol. 2000, 16, 613–616. [Google Scholar] [CrossRef]
  27. van Dijken, J.P.; Weusthuis, R.A.; Pronk, J.T. Kinetics of growth and sugar consumption in yeasts. Antonie Leeuwenhoek 1993, 63, 343–352. [Google Scholar] [CrossRef] [PubMed] [Green Version]
  28. Still Spirits. A Guide to Help you Choose the Right Yeast for Your at Home Distilling Needs. Available online: https://www.cannonhillbrewing.com.au/wp-content/uploads/2017/08/still-spirits-yeast-1.pdf (accessed on 18 November 2019).
  29. Stills Spirits. Turbo Yeast Best Practices. 2019. Available online: https://stillspirits.com/pages/turbo-yeast-best-practices (accessed on 18 November 2019).
  30. Hashsham, S.A.; Baushke, S.W. Energetics, stoichiometry, and kinetics of microbial growth. In Methods for General and Molecular Microbiology, 3rd ed.; Reddy, C.A., Ed.; American Society for Microbiology Press: Washington, DC, USA, 2007. [Google Scholar] [CrossRef]
  31. Da Silva, G.P.; de Araujo, E.F.; Silva, D.O.; Guimaraes, W.V. Ethanolic fermentation of sucrose, sugarcane juice and molasses by Escherichia coli strain ko11 and Klebsiella oxytoca strain P2. Braz. J. Microbiol. 2005, 36, 395–404. [Google Scholar] [CrossRef]
  32. Cordell, R.L.; Pandya, H.; Hubbard, M.; Turner, M.A.; Monks, P.S. GC-MS analysis of ethanol and other volatile compounds in micro-volume blood samples-quantifying neonatal exposure. Anal. Bioanal. Chem. 2013, 405, 4139–4147. [Google Scholar] [CrossRef]
  33. Tikka, C.; Osuru, H.P.; Atluri, N.; Raghavulu, P.C.; Yellapu, N.K.; Mannur, I.S.; Prasad, U.V.; Aluru, S.; Narashimba Varna, K.; Bhaskar, M. Isolation and characterization of ethanol tolerant yeast strains. Bioinformation 2013, 9, 421–425. [Google Scholar] [CrossRef]
  34. Moreno, A.D.; Tomás-Pejó, E.; Olsson, L.; Geijer, C. Candida intermedia CBS 141442: A Novel Glucose/Xylose Co-Fermenting Isolate for Lignocellulosic Bioethanol Production. Energies 2020, 13, 5363. [Google Scholar] [CrossRef]
  35. Waterhouse, A.M.; Procter, J.B.; Martin, D.M.; Clamp, M.; Barton, G.J. Jalview version 2-a multiple sequence alignment editor and analysis workbench. Bioinformatics 2009, 25, 1189–1191. [Google Scholar] [CrossRef] [Green Version]
  36. Khongsay, N.; Laopaiboon, L.; Jaisil, P.; Laopaiboon, P. Optimization of agitation and aeration for very high gravity ethanol fermentation from sweet sorghum juice by Saccharomyces cerevisiae using an orthogonal array design. Energies 2012, 5, 561–576. [Google Scholar] [CrossRef] [Green Version]
  37. Aguilar, J.; Espinoza, M.; Cabanillas, J.; Ávila, I.; García, A.; Julca, J.; Tacanga, D.; Zuta, I.; Linares, G. Evaluación de la cinética de crecimiento de Saccharomyces cerevisiae utilizando un medio de cultivo a base de melaza de caña y suero lácteo. Agroind. Sci. 2015, 5, 37–47. [Google Scholar] [CrossRef] [Green Version]
  38. Tzeng, D.I.; Chia, Y.C.; Tai, C.Y.; Ou, A. Investigation of chemical quality of sugarcane (Saccharum officinarum L.) wine during fermentation by Saccharomyces cerevisiae. J. Food Qual. 2010, 33, 248–267. [Google Scholar] [CrossRef]
  39. Maier, R. Bacterial Growth. In Environmental Microbiology; Pepper, I.L., Gerba, C.P., Gentry, T.J., Maier, R.M., Eds.; Academic Press: Cambridge, MA, USA, 2009; pp. 37–54. [Google Scholar]
  40. Maicas, S. The role of yeasts in fermentation processes. Microorganisms 2020, 8, 1142. [Google Scholar] [CrossRef] [PubMed]
  41. Bisson, L.; Butzke, C.E. Diagnosis and rectification of stuck and sluggish fermentations. Am. J. Enol. Vitic. 2000, 51, 168–177. [Google Scholar]
  42. Vieira, E.; Stupiello, M.; Andrietta, S. Yeast biomass production: A new approach in glucose-limited feeding strategy. Braz. J. Microbiol. 2013, 44, 551–558. [Google Scholar] [CrossRef] [Green Version]
  43. Wang, M.L.; Choong, Y.M.; Su, N.W.; Lee, M.H. A rapid method for determination of ethanol in alcoholic beverages using capillary gas chromatography. J. Food Drug Anal. 2003, 11, 133–140. [Google Scholar] [CrossRef]
  44. Tiscione, N.; Alford, I.; Yeatman, D.; Shan, X. Ethanol analysis by headspace gas chromatography with simultaneous flame-Ionization and mass spectrometry detection. J. Anal. Toxicol. 2011, 35, 501–511. [Google Scholar] [CrossRef] [Green Version]
  45. Bushra, R. Functionalized nanomaterials for chromatography. In Nanomaterials in Chromatography, 1st ed.; Hussain, C.M., Ed.; Elsevier: Newark, NJ, USA, 2018; pp. 403–414. [Google Scholar] [CrossRef]
  46. El-Moaty, H. Bioactive compounds of Moricandia nitens and its anticancer effect. Indo Am. J. Pharm. Sci. 2016, 3, 1283–1290. [Google Scholar]
  47. Nwaiwu, O.; Itumoh, M. Chemical contaminants associated with palm wine from Nigeria are potential food safety hazards. Beverages 2017, 3, 16. [Google Scholar] [CrossRef]
  48. Shubharani, R.; Sivaram, V.; Kishore, B.R. In Vitro cytotoxicity of Indian bee propolis on cancer cell lines. Int. J. Pharm. Biol. Sci. 2014, 5, 698–706. [Google Scholar]
  49. Dhanasekaran, D.; Latha, S.; Suganya, P.; Panneerselvam, A.; Kumar, T.; Alharbi, N.; Arunachalam, C.; Alharbi, S.A.; Thajuddin, N. Taxonomic identification and bioactive compounds characterization of Psilocybe cubensis DPT1 to probe its antibacterial and mosquito larvicidal competency. Microb. Pathog. 2020, 143, 1–10. [Google Scholar] [CrossRef] [PubMed]
  50. Bhuyan, D.J.; Alsherbiny, M.A.; Perera, S.; Low, M.; Basu, A.; Devi, O.A.; Barooah, M.S.; Li, C.G.; Papoutsis, K. The odyssey of bioactive compounds in avocado (Persea americana) and their health benefits. Antioxidants 2019, 8, 426. [Google Scholar] [CrossRef] [Green Version]
Figure 1. Average distance calculated based on percentage of similarity between sequences of some Saccharomyces strains from the database and the contig IST1 sequence of Lev6 and Lev 30 (A); some Candida strains from the database and Lev9 (B). Legend: KC254075.1: S. cerevisiae strain UOA/HCPF 10839; FJ793809.1: S. cerevisiae 18S ribosomal RNA gene; LC413776.1: S. cerevisiae IFM 61207; KY630581.1: S. cerevisiae strain GITA14; KY104995.1: S. cerevisiae culture CBS:4903; KP723679.1: S. cerevisiae isolate L26A; KP723682.1: S. cerevisiae isolate Soi103; KP132589.1: S. cerevisiae strain CNRMA7.474; CP036478.1:454982-455898: S. cerevisiae strain ySR128 chromosome XII, complete sequence; CP036478.1:455023-455857: S. cerevisiae strain ySR128 chromosome XII, complete sequence; MZ373068.1:10-84: S. cerevisiae isolate from wine; EF190230.1: C. parapsilosis strain Zhuan112; EF192222.1: C. intermedia strain zhuan202; NR_155007.1: C. pseudointermedia CBS6918; AY500373.1: C. intermedia 18S ribosomal RNA gene; DQ680837.1: C. intermedia strain YA01a; KM246246.1: C. intermedia isolate C1/23; KY102152.1: C. intermedia culture CBS:7153. MT974659.1:22-402: C. intermedia strain 2MG-A0603-47; MK394147.1:1470-1847: C. pseudointermedia strain CBS 6918; MK461561.1:40-412: C. intermedia isolate strain BRM 046304. Trees were calculated based on a measure of similarity between each pair of sequences in the alignment: PID. The percentage identity between the two sequences at each aligned position. The number on the branch is the bootstrap value that indicates the extent of relatedness between two subjects.
Sustainability 13 10924 g001
Figure 2. Growth kinetics comparison of the selected yeasts at 200 rpm. The lines represent the absorbance data (OD605), and the bars represent the number of cells expressed in log (CFU mL) of three independent repeats and the SD.
Sustainability 13 10924 g002
Figure 3. Cell viability at 8 h of growth expressed in log (CFU/mL). The letters in each bar represent the statistical difference between each treatment. Bars with a letter in common are not significantly different. Legend: T1, T2, and T3 are Lev6, Lev9, and Lev30; A1, A2: 100 and 200 rpm.
Sustainability 13 10924 g003
Figure 4. Biplot PCA analysis of the fermentation variables of black sugarcane juice with the selected native yeasts. The blue points represent the treatments with 5% biomass, and the red points represent the treatments with 8% biomass. Legend: T1, T2, and T3 are Lev6, Lev9, and Lev30; B1, B2: 100 and 200 rpm; C1, C2, C3, C4, and C5: the values registered and 0, 2, 4, 6, and 24 h for each variable.
Sustainability 13 10924 g004
Table 1. Analysis of the Pearson correlation coefficient to the fermentation variables.
Correlation of VariablesCell ViabilityTotal Soluble SolidspH
Cell viabilityPearson correlation1−0.571 **−0.668 *
Sig. (bilateral) 0.0010.000
N303030
Total soluble solidsPearson correlation−0.571 **10.849 **
Sig. (bilateral)0.001 0.000
N303030
pHPearson correlation−0.668 *0.849 **1
Sig. (bilateral)0.0000.000
N303030
* The correlation is significant at the 0.05 level (bilateral). ** The correlation is significant at the 0.01 level (bilateral).
Table 2. Ethanol yield, biomass production, ethanol concentration, and volumetric productivity.
Ethanol (mL)∆S (g)% ABVBiomass (g)Yp/s (%)Yx/s (%)Q (g/L)Qp (g/L/h)
Lev67.7583.414.010.49.843.920.61
Lev94.1332.014.79.819.425.920.36
Lev303.1281.716.28.828.224.480.34
PTY11.61197.112.47.73.447.520.66
CTY10.01116.613.27.14.548.960.68
Legend: ∆S is the amount of substrate consumed (g/mL); % ABV: °Alcoholic (v/v). Yp/s (%): product/substrate yield in percentage. Yx/s (%): Biomass/substrate yield in percentage. Q: ethanol concentration (g/L). Qp: ethanol volumetric productivity (g/L/h). PTY: reference control 1; CTY: reference control 2.
Table 3. Detected molecules from each treatment in the fermentation of black sugarcane juice by GC-MS.
SamplesRetention Time (min)MoleculeRelative (%)
Lev61.3872-aziridinylethyl amine0.306
1.542Ethanol99.712
Lev91.3892-aziridinylethyl amine0.347
1.489Ethanol99.653
Lev301.3952-aziridinylethyl amine0.758
1.444nitrile tetraacetyl-d-xylonic0.507
1.486Ethanol98.735
PTY1.3902-aziridinylethyl amine0.204
1.487Ethanol99.796
CTY1.390Carbon dioxide0.035
1.489Ethanol99.965
Publisher’s Note: MDPI stays neutral with regard to jurisdictional claims in published maps and institutional affiliations.

