Article

Optimizing Temperature and Photoperiod in a Home Cultivation System to Program Normal, Delayed, and Hastened Growth and Development Modes for Leafy Oak-Leaf and Romaine Lettuces

by
Kyungdeok Noh
1 and
Byoung Ryong Jeong
1,2,3,*
1
Department of Horticulture, Division of Applied Life Science (BK21 Four Program), Graduate School of Gyeongsang National University, Jinju 52828, Korea
2
Institute of Agriculture & Life Science, Gyeongsang National University, Jinju 52828, Korea
3
Research Institute of Life Science, Gyeongsang National University, Jinju 52828, Korea
*
Author to whom correspondence should be addressed.
Sustainability 2021, 13(19), 10879; https://doi.org/10.3390/su131910879
Submission received: 7 September 2021 / Revised: 25 September 2021 / Accepted: 27 September 2021 / Published: 30 September 2021

Abstract

:
As the risk of open-field cultivation increases with climate change, some analysts say that the day when ordinary vegetables will be produced at home is not far away. Moreover, due to the recent coronavirus outbreak, outdoor activities are becoming difficult, leisure activities that can be done at home have become more necessary, and the demand for home gardening has increased. This study was conducted to improve the technology for hydroponics at home. We experimented with whether the harvest time can be hastened or delayed by environmentally controlling the growing season, and what conditions are appropriate. Experiments were conducted with leafy vegetables (Lactuca sativa L. ‘Oak-leaf’ and Lactuca sativa L. var. longifolia, or romaine) that can easily be grown in a closed plant cultivator in which the external air can circulate, and the temperature/photoperiod can be controlled. Two settings for the temperature (25/18 °C and 20/15 °C; day/night) and three settings for the photoperiod (10, 14, and 18 hours; day/night) were employed. It took a total of four weeks from sowing to harvest, and the appropriate harvest time was predicted from the yield. As a result, although there was a difference depending on the vegetable variety, a temperature setting of 25/18 °C and a photoperiod of 14 hours were the most suitable for hastened growth, and a 20/15 °C temperature and 18 hours of photoperiod were suitable for the delayed growth.

1. Introduction

Home hydroponics are expected to make urban farming more convenient in the home as a way to cope with limited land use and insufficient urban agricultural infrastructure [1], such as the decrease in urban farmland due to the increase in farmland use [2,3]. In fact, the use of hydroponic cultivation for various purposes [4] in different geographical environments around the world [5,6,7] has steadily increased. Many studies have shown that with hydroponics, a greater amount of water can be reused [8,9,10] compared to agar cultivation, the external environment can be controlled for cultivation [5,11], and traditional cultivation processes such as plowing fields and weeding can be omitted [12,13,14]. Vegetables grown in urban streets can accumulate increased heavy metal contents due to air, water, and soil contamination, and threaten food safety [15]. There are also concerns about exposure to radiation [16]. Indoor hydroponics can reduce such risks. In the U.S., the supply and demand for hydroponic cultivation has increased [17] and the hydroponic cultivation industry has significantly grown [18] as it was able to yield better quality crops and increase production [19]. In order to increase the production of hydroponic crops, various hydroponic cultivation systems have been developed, and products that can be easily utilized at home, such as gardens attached to kitchen walls, are being distributed [20]. Hydroponic systems are now expanding their market from commercial to domestic, and need to be transformed into a customized system that accommodates a wider range of consumer needs [21]. This study aimed to adjust the harvest time of vegetables through simple mechanical operation and temperature control to suit the characteristics of a small-scale home hydroponic cultivation machine.

2. Materials and Methods

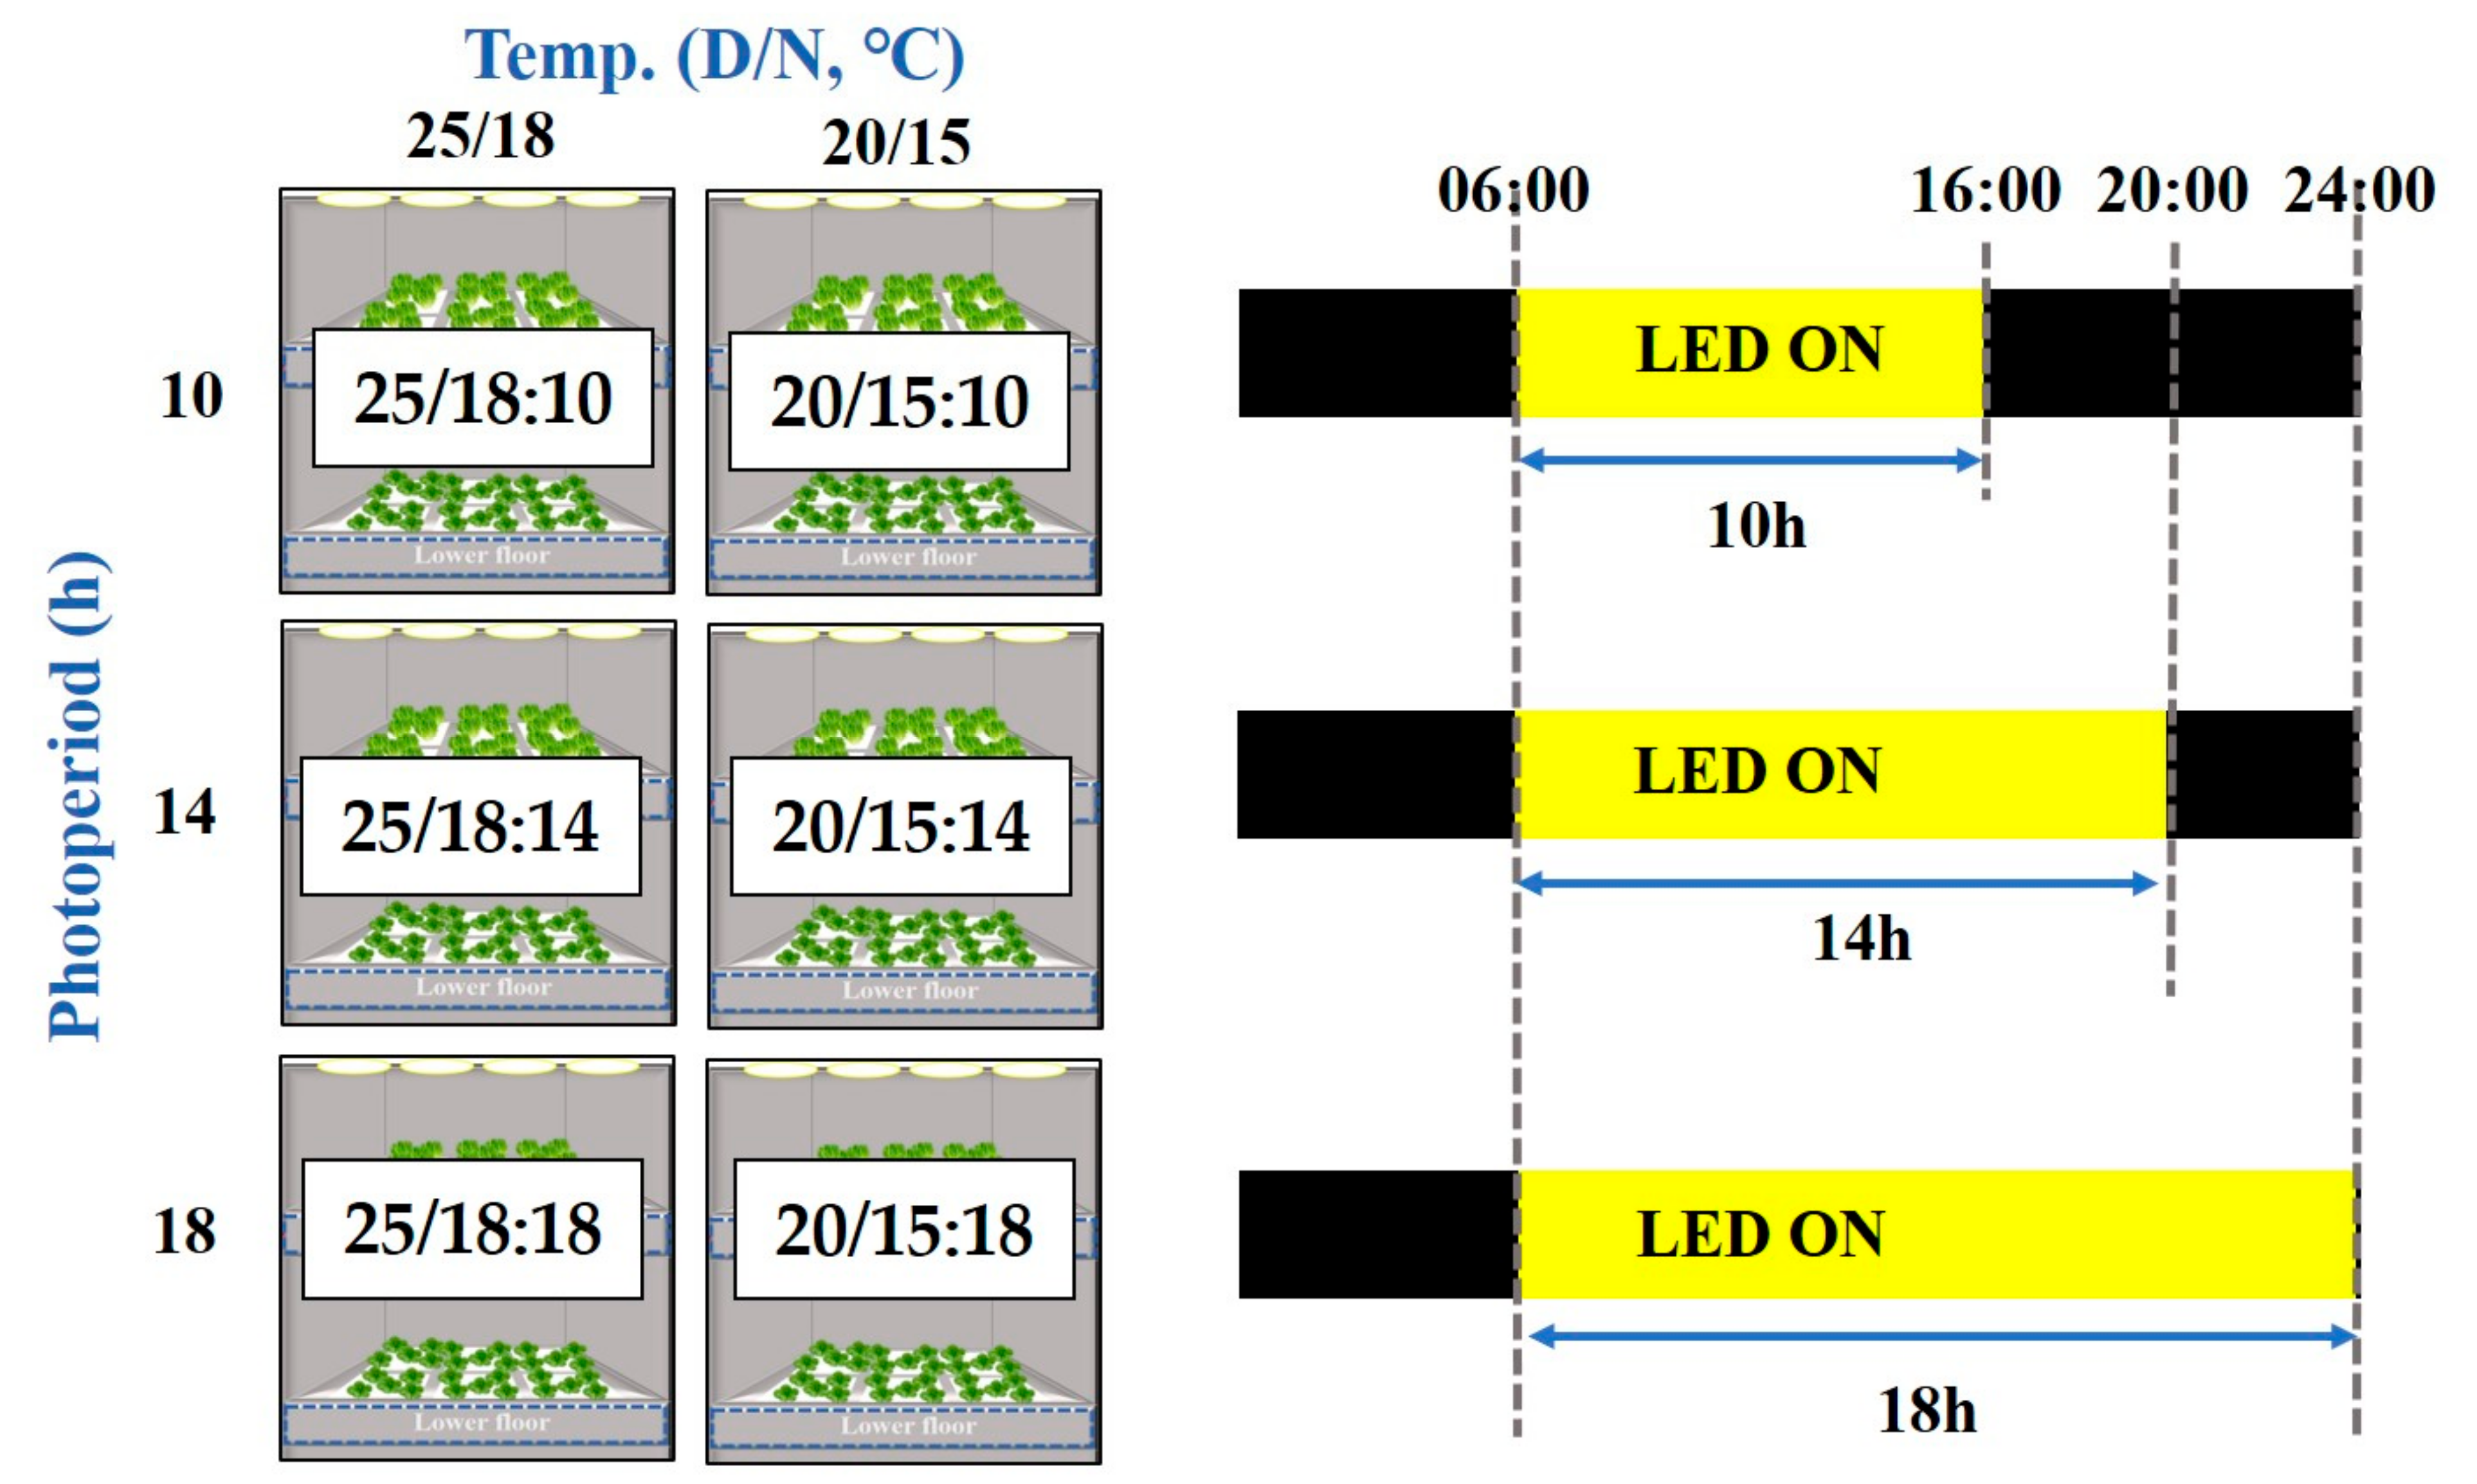
2.1. Cultivation System and Environment

The hydroponic cultivator (tiiun L061G1, LG Electronics Inc., Seoul, Korea) used in the experiment consisted of an upper floor and a lower floor, with three sections on each floor. Each zone had 10 cells. Therefore, a total of 60 plants were grown in each round of cultivation. The hydroponic cultivators had a ventilation system where air enters and leaves, but there was no separate carbon dioxide supply system.
As a sub-irrigation system, the cultivator had a nutrient solution tank at the bottom of the system. Nutrient solutions were automatically supplied every 180 min. Three different photoperiods were employed: 10, 14, and 18 h. Two sets of temperatures were used: 25/18 ± 2 °C and 20/15 ± 2 °C day/night (Figure 1). The hydroponic cultivator was installed in a growth chamber at Gyeongsang National University. Three environmental parameters were measured: carbon dioxide concentration, temperature, and relative humidity. The CO2 concentration was measured with a data logger (ALMEMO 2890, Ahlborn, Holzkirchen, Germany) at three points: one outside the cultivator or the growth chamber and the other two inside the cultivators of the 20/15:14 and 20/15:18 (Figure 2). The light was supplied at 300 mmol·m−2·s−1 PPFD from white LEDs.

2.2. Nutrient Solution

‘Hanbang’, a commercially available hydroponic nutrient solution (Coseal Co., Ltd., Seoul, Korea), was used in this study. Initially, 3 L of the nutrient solution was provided to each machine. An additional 2 L of the nutrient solution was provided when the level in the tank dropped to below 1 L. The fluid in the nutrient tank was collected once a day for the pH and EC measurements. When the pH was outside the valid range (5.6–6.4) it was adjusted to 6.0.

2.3. Plant Materials and Mesurements

The oak-leaf (Lactuca sativa L. ‘Oak-leaf’) and romaine (Lactuca sativa L. var. longifolia) lettuces were selected in this study, which are commonly consumed as food. The seeds were sown on 22 November 2020 in the OASIS® Horticubes (OASIS® Grower Solutions, Kent, OH, USA) (2.1 × 2.2 × 3.8 cm3). The cultivation period lasted 4 weeks from 23 November to 21 December 2020.
After sowing, the insides of the foam media cells were observed one by one. The germination was recorded as the time when young roots broke through the seed shell, and the emergence was recorded as the time when young sprouts appeared above the horizon of the foam media. Three seeds were sown in each cell, but cells were measured on a per-unit-basis rather than based on the number of seeds when observing the germination and emergence. For each treatment, 20 cells were observed for the oak-leaf and romaine lettuces. Germination rate (GR) [22], mean germination time (MGT) [23], and germination energy (GE) [24] were calculated from the recorded germination data. In addition, emergence rate (ER), mean emergence time (MET), and emergence energy on the 5th, 6th, and 7th days after sowing (EE) were calculated for the emergence data in the same way. About 10 days after sowing the seeds, unhealthy plants were removed. The first growth measurement was taken on the thinned vegetables. It was judged that the harvest time of lettuce was when it had grown to the point where it was no longer possible to grow it in the home cultivation system. Fully grown treatments (25/18:14 and 25/18:18) were all harvested 4 weeks after sowing. The undergrown treatments were half-harvested at this time. The treatment where growth stopped and aging started (25/18:10) was half harvested 31 days after sowing. Finally, the remaining half of the remaining treatments (20/15:10, 20/15;14, and 20/15:18) were harvested 34 days after sowing. In every harvest the shoot length, leaf length, leaf width, fresh weight, and dry weight were measured.
The vegetables grown at Gyeongsang National University were harvested on 21 December 2020. Measurements of the different parameters were taken shortly after they were harvested. Leaf pieces were collected using a cork borer to measure the specific leaf weight, after the chlorophyll a and chlorophyll b contents were measured. The leaf pieces were also examined for chlorosis and tip burn. Using a cork borer, round leaf pieces with a diameter of 1 cm were collected. A 2 mL solvent with ethanol, acetone, and distilled water mixed in a ratio of 4.5:4.5:1 was prepared. After putting the collected leaf pieces in the solvent, light was blocked, and pigments were extracted at 4 °C for 12 h. The absorbance of the solution into which the leaf fragments had been removed was measured with a spectrometer at wavelengths of 645 nm and 663 nm. Thereafter, the chlorophyll a and b contents were obtained by substituting them with the formula found in [25].

2.4. Statistical Analysis

The SAS statistical software, release 9.2 (SAS Inst., Cary, NC, USA) was used for the statistical analysis of variance (ANOVA) and Duncan’s multiple range test at a significance level of p = 0.05. The F-test was also run based on the Fisher’s least significant difference test at a threshold of p = 0.05.

3. Results

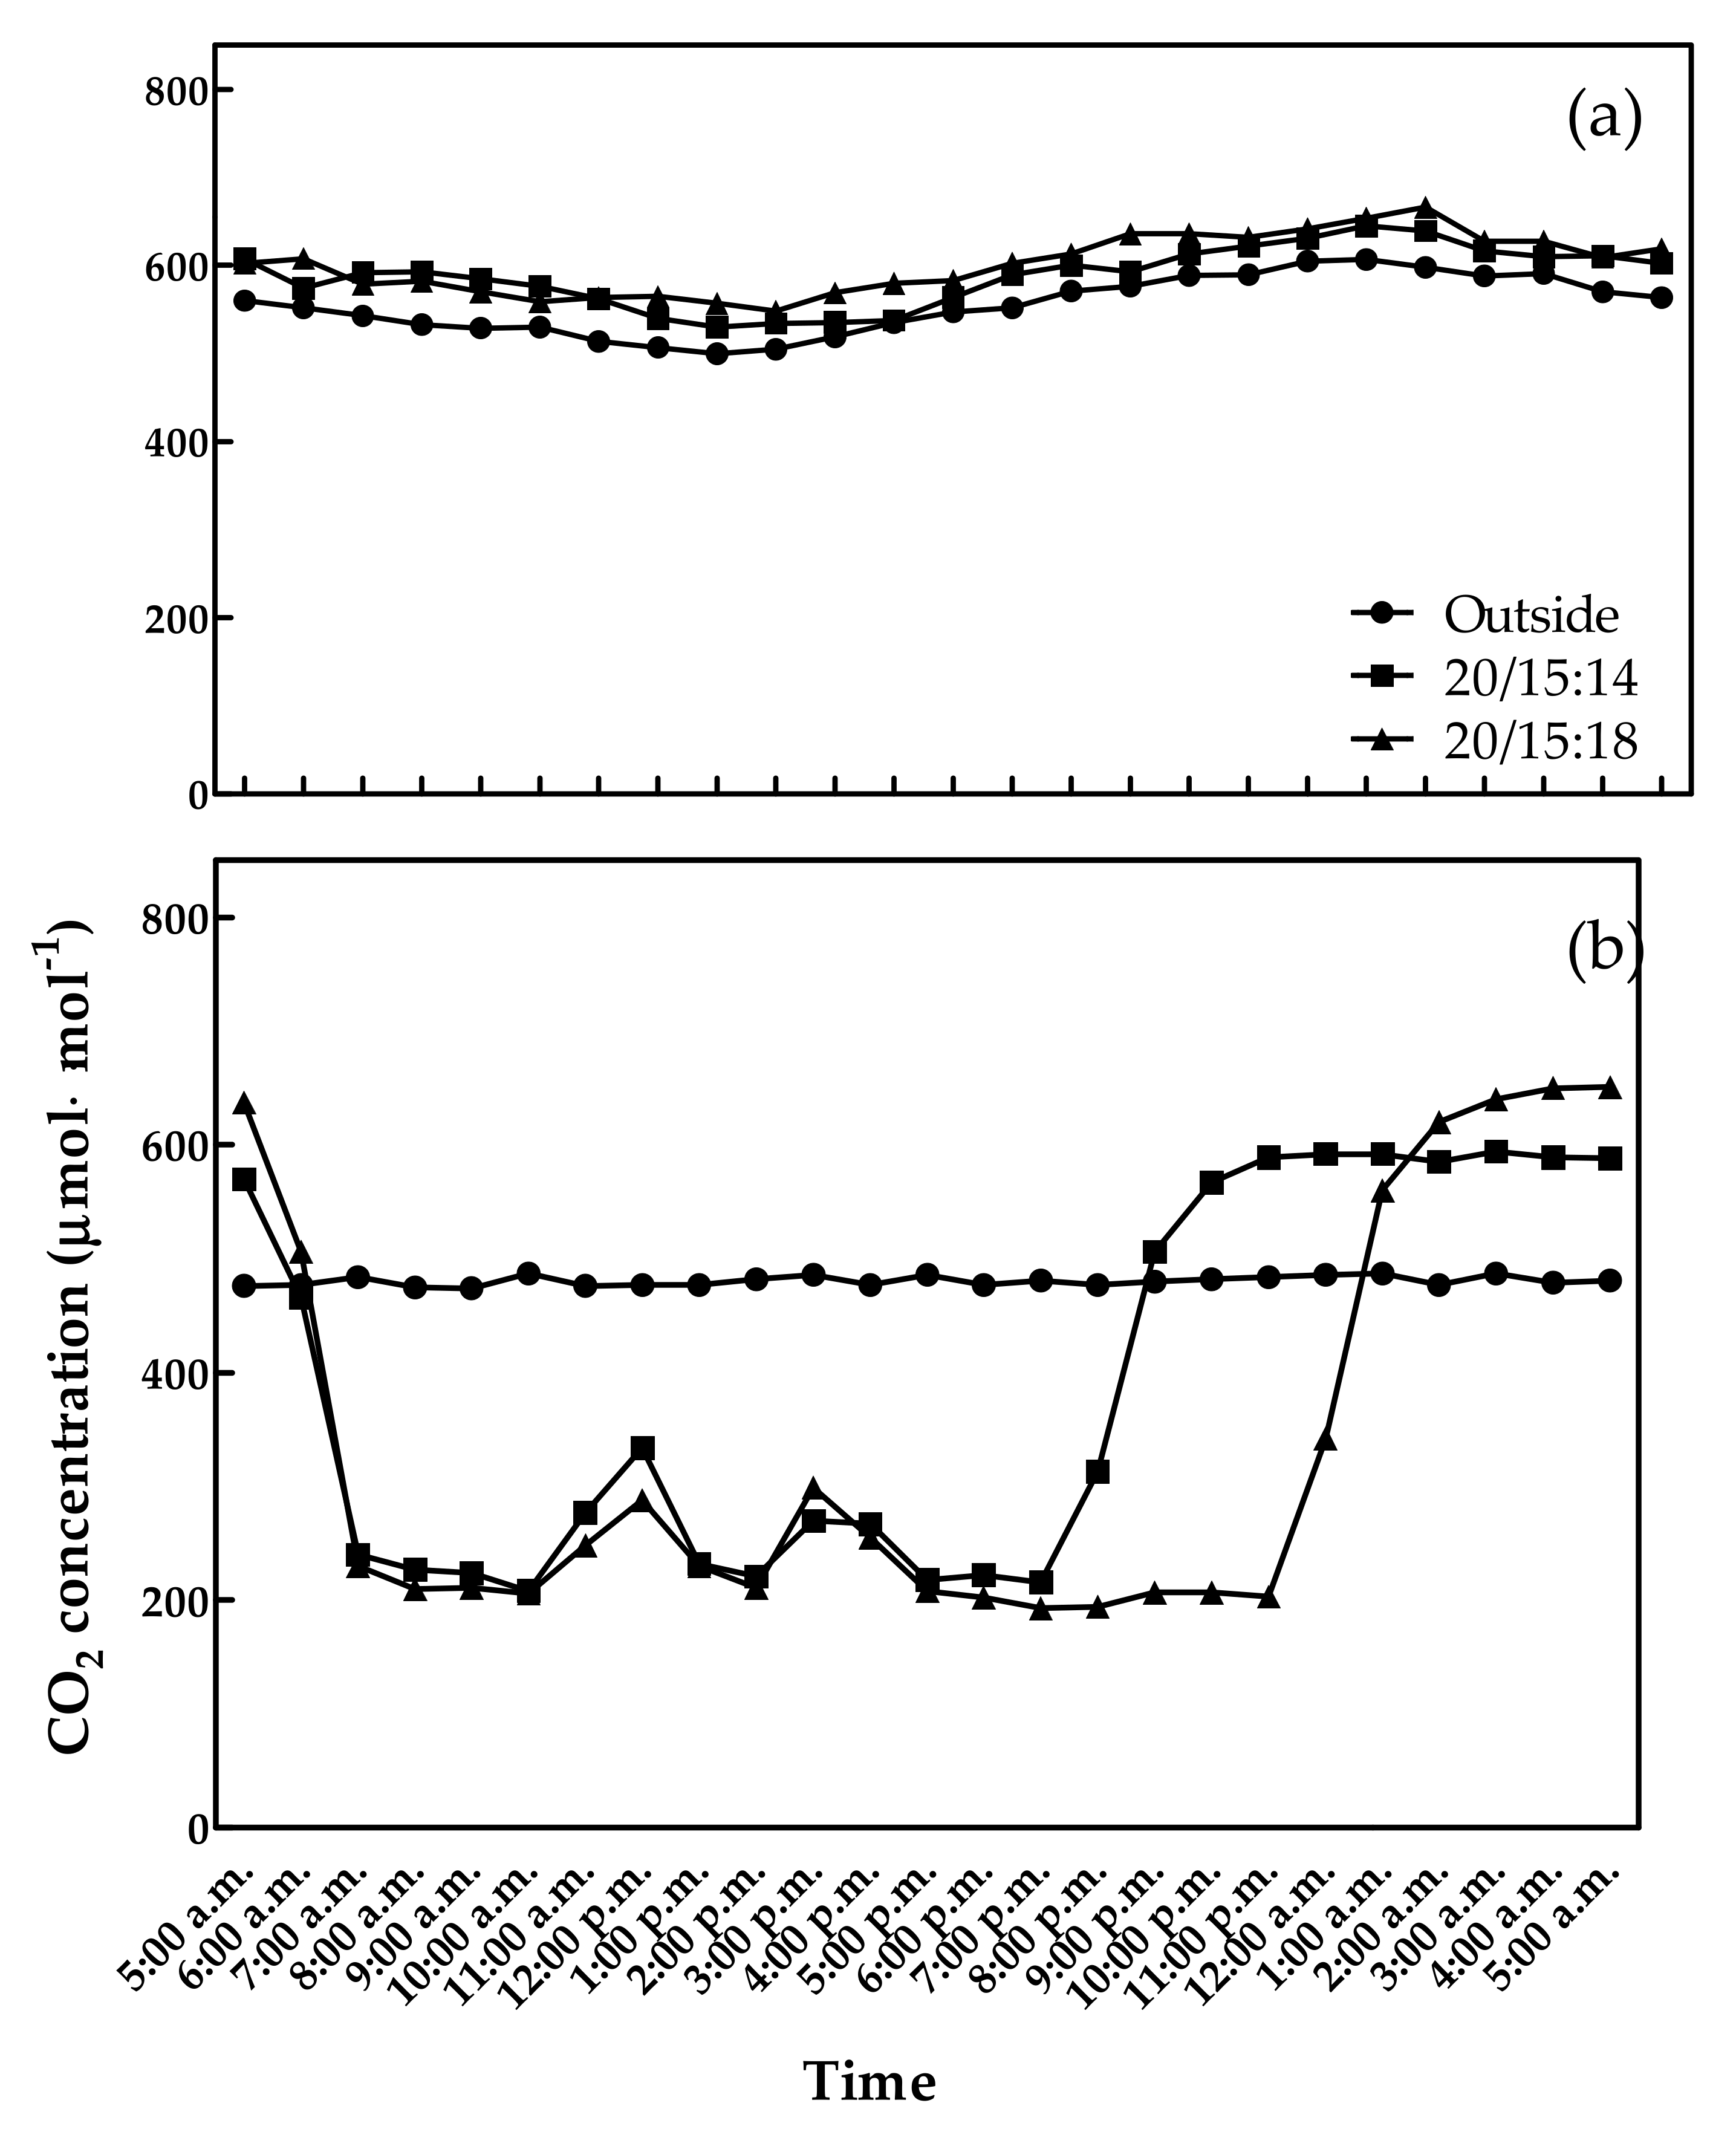
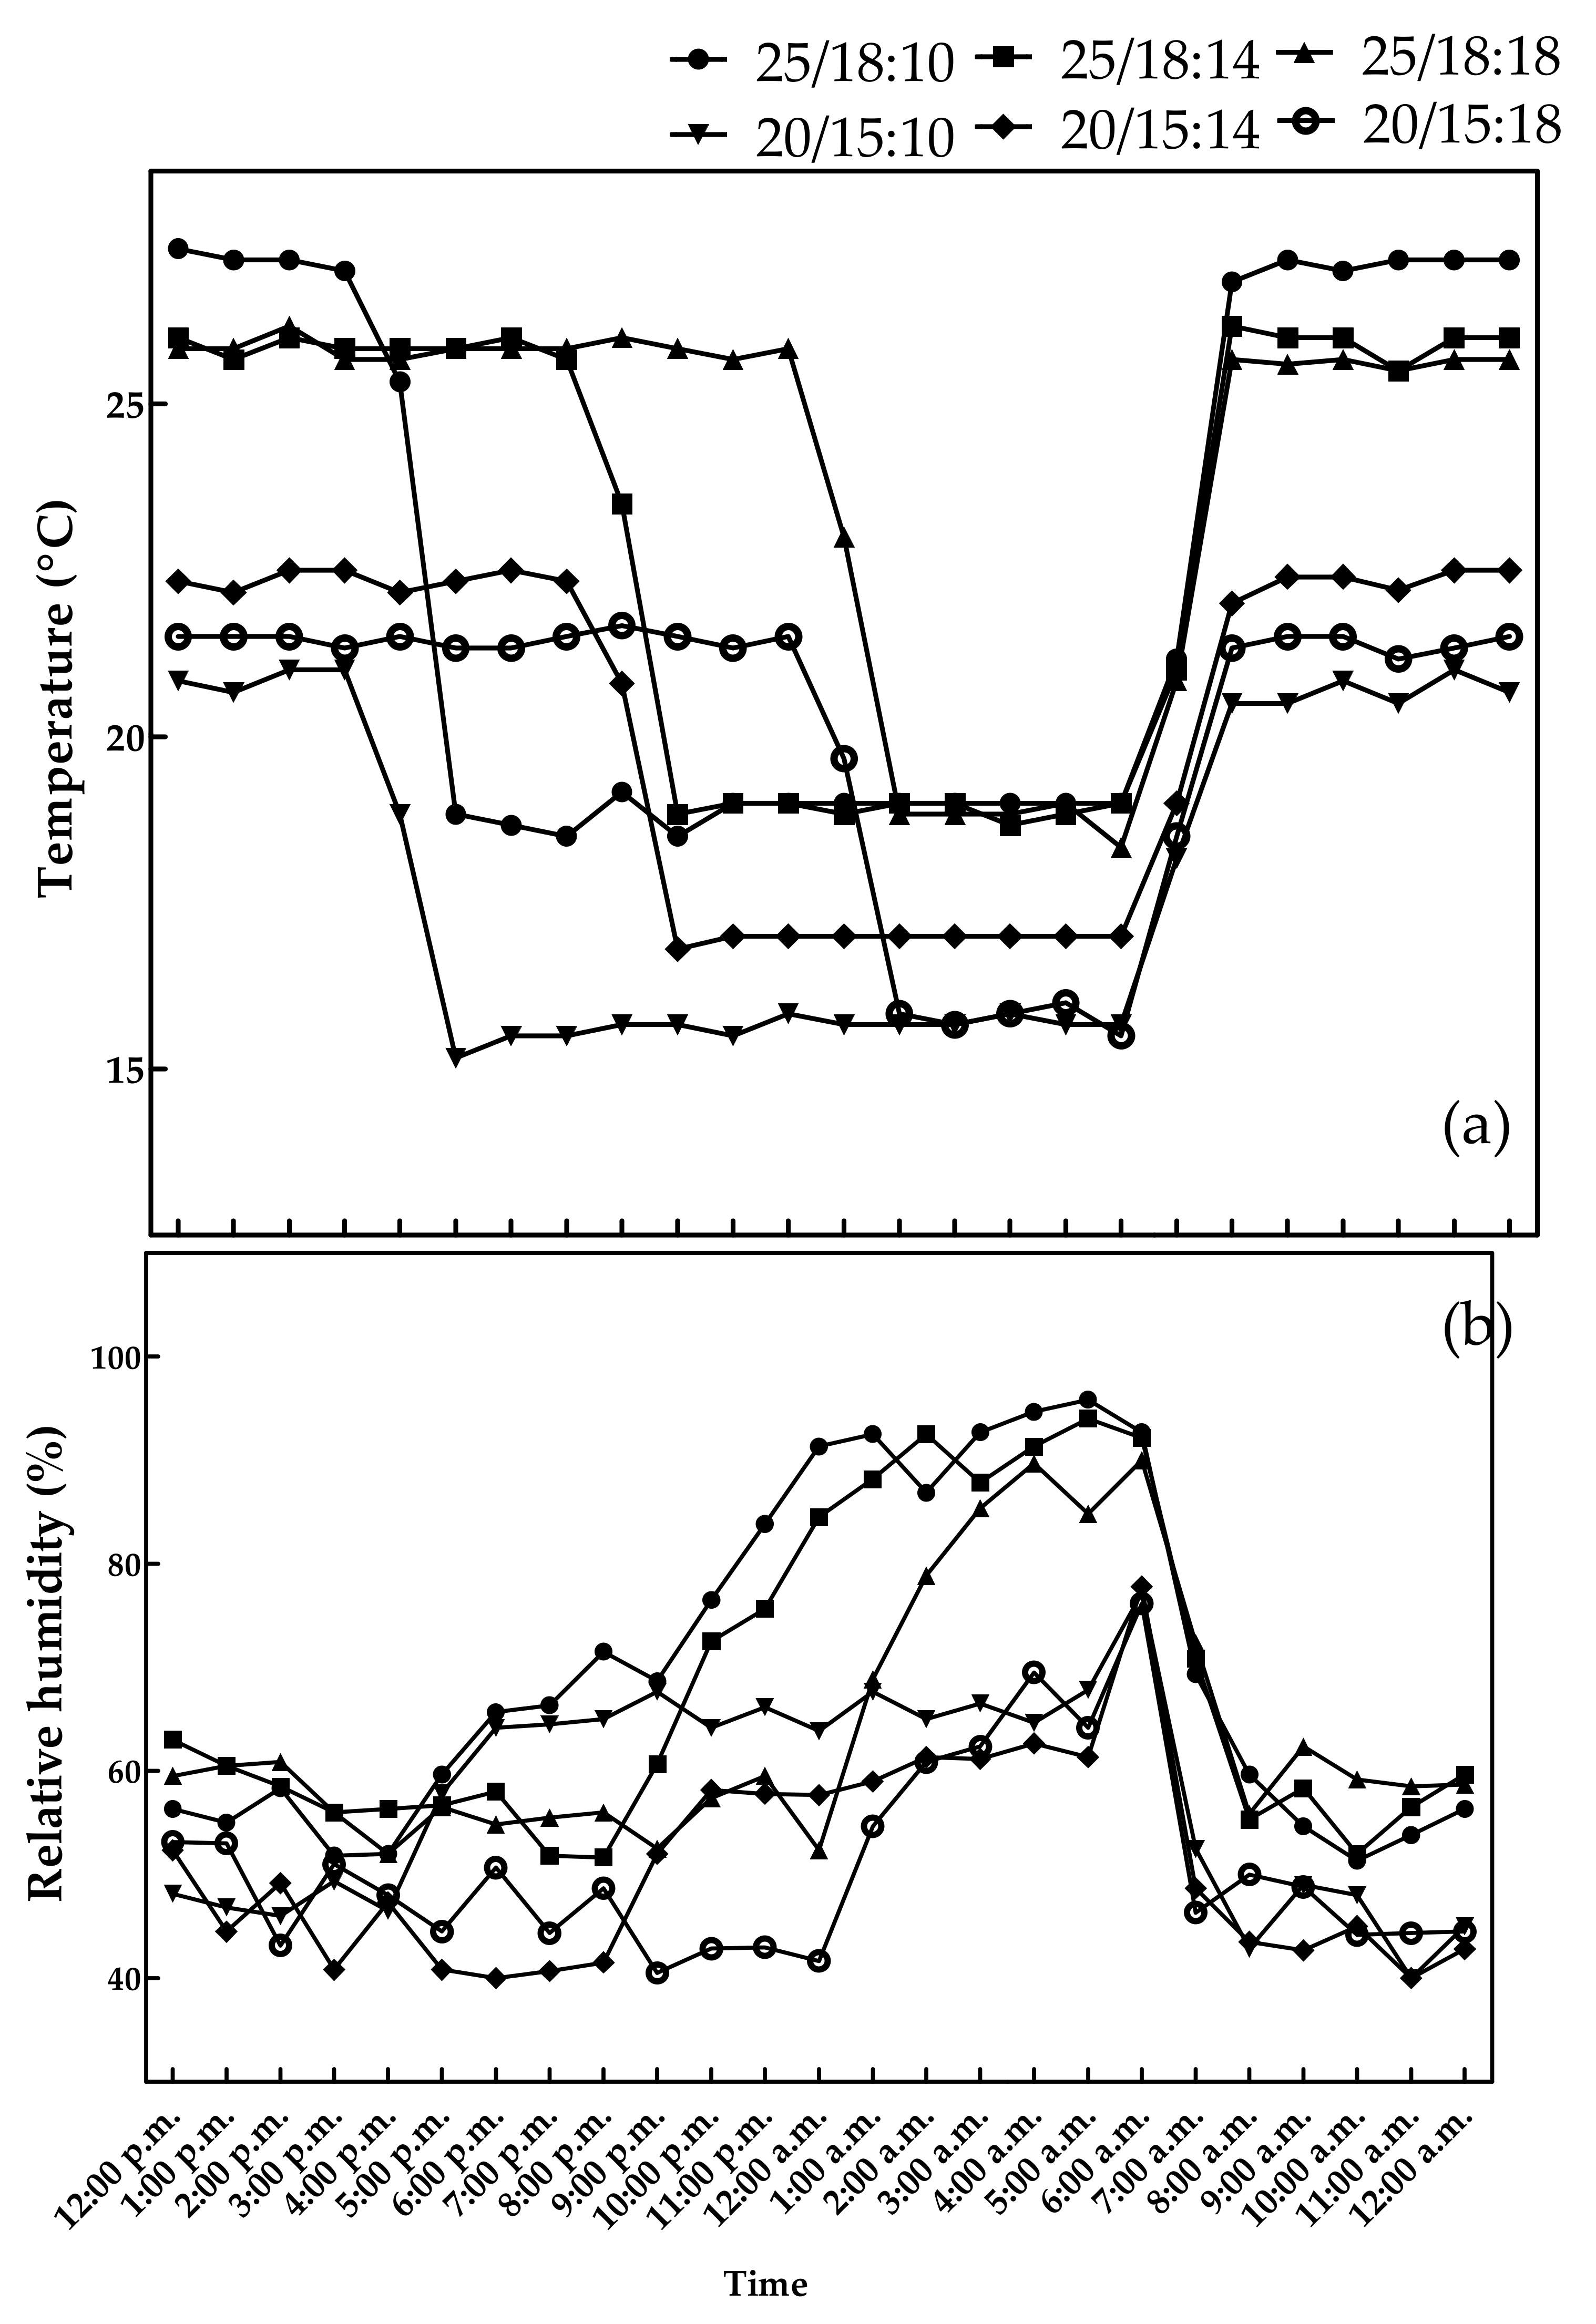
3.1. CO2 Concentrations, Temperature, and Relative Humidity

The temperature and relative humidity in each treatment were measured. The change in the relative humidity (Figure 3b) could be observed according to the temperature change (Figure 3a). In all treatments, daytime started at 6:00 a.m. Since the photoperiods were 10, 14, or 18 h, respectively, the nighttime was set at 4:00 p.m., 8:00 p.m., or midnight. The error range of the temperature was ± 2 °C of each set temperature, and the timing of the temperature change varied depending on the length of the day. The relative humidity moved between a minimum of about 40% and a maximum of 100%. The external CO2 concentration was slightly different depending on the activity of people, but it was maintained around 500 μmol·mol−1. When measured in an empty chamber where no plants were grown, it was confirmed that the CO2 concentration in the chamber changed similarly to that outside the chamber (Figure 2a).
The CO2 concentration during the cultivation period did not change much in the early growth stages, but the difference in the CO2 concentration grew during the second half of the period when the growth was vigorous. In particular, the concentration in the growing season fell below 200 μmol·mol−1 during the period when photosynthesis was vigorous (Figure 2b). In the end, it was observed that CO2 acted as a limiting factor for photosynthesis during the cultivation period when CO2 was not separately supplied. Later, it took two hours to adjust to the CO2 concentration outside at the beginning of the night, and four hours later, the inflow of CO2 outside was added to the carbon dioxide caused by breathing, resulting in the highest CO2 concentration (Figure 2b).

3.2. Nutrient Solution

The pH and EC of the nutrient solutions were measured every day. In the case of the pH, it was calibrated based on 6.0. The EC remained between 1.4 and 4.0 mS·cm−1. There was a difference in the amount of the nutrient solution consumed according to the growth rate. For each feeding, 2 L of the nutrient solution was supplied. The daily average temperature by treatment was 25/18:18 = 23.25 °C, 25/18:14 = 22.08 °C, 25/18:10 = 20.92 °C, 20/15:18 = 18.75 °C, 20/15:14 = 17.92 °C, and 20/15:10 = 17.09 °C. The longer the photoperiod, the higher the average temperature. If the average temperature increases, the relative humidity decreases, which leads to more transpiration. In the second half of the growth period, the difference in the growth level increased, making the difference in the usage of positive solutions even bigger. Based on 25/18:14, 25/18:18 consumed the greatest amount of the nutrient solution, followed by 20/15:18, and the other three treatments similarly consumed the least amount of the nutrient solution (Figure 4).

3.3. Germination and Emergence Rate

There was no significant difference in germination rate (GR), average number of days required for germination (MGT), and germination energy measured on the 4th day of germination (GE) in the case of oak-leaf (Table 1). In the case of romaine, the average number of days (MGT) required for germination was short and the germination rate (GR) was slightly faster in the treatment (Table 1). The MET was shorter in the high-temperature treatment (Table 2). The EE was measured 5 days, 6 days, and 7 days after sowing, and it was found that the temperature difference was offset as time went on. It was confirmed that emergence was a little faster at a high temperature, but followed the difference even at a low temperature after time passed (Table 2). This difference was larger in oak-leaf than in romaine.

3.4. Comparison of the Early Growth Stages

The growth was more excellent at the temperature treatment of 25/18. The longest observed photoperiod was 18 h, which resulted in a significantly higher growth (Table 3). The same trend was observed in both oak-leaf and romaine. The leaves grew stronger with the 20/15 treatment, although this is not numerically expressed. The fresh weights were observed to be twice as large at high temperatures (Table 3). At the same temperature, the longer the photoperiod, the faster the growth rate. The difference was larger between 14 h and 18 h of photoperiod than that between 10 h and 14 h.
The difference in the shoot length, leaf length, and leaf width was also noticeable. Due to the high temperature, a short photoperiod did not seem to provide enough light for growth in the 25/18 °C treatment. Therefore, the shoot length was longer with the relatively short 10-hour photoperiod (Table 3).

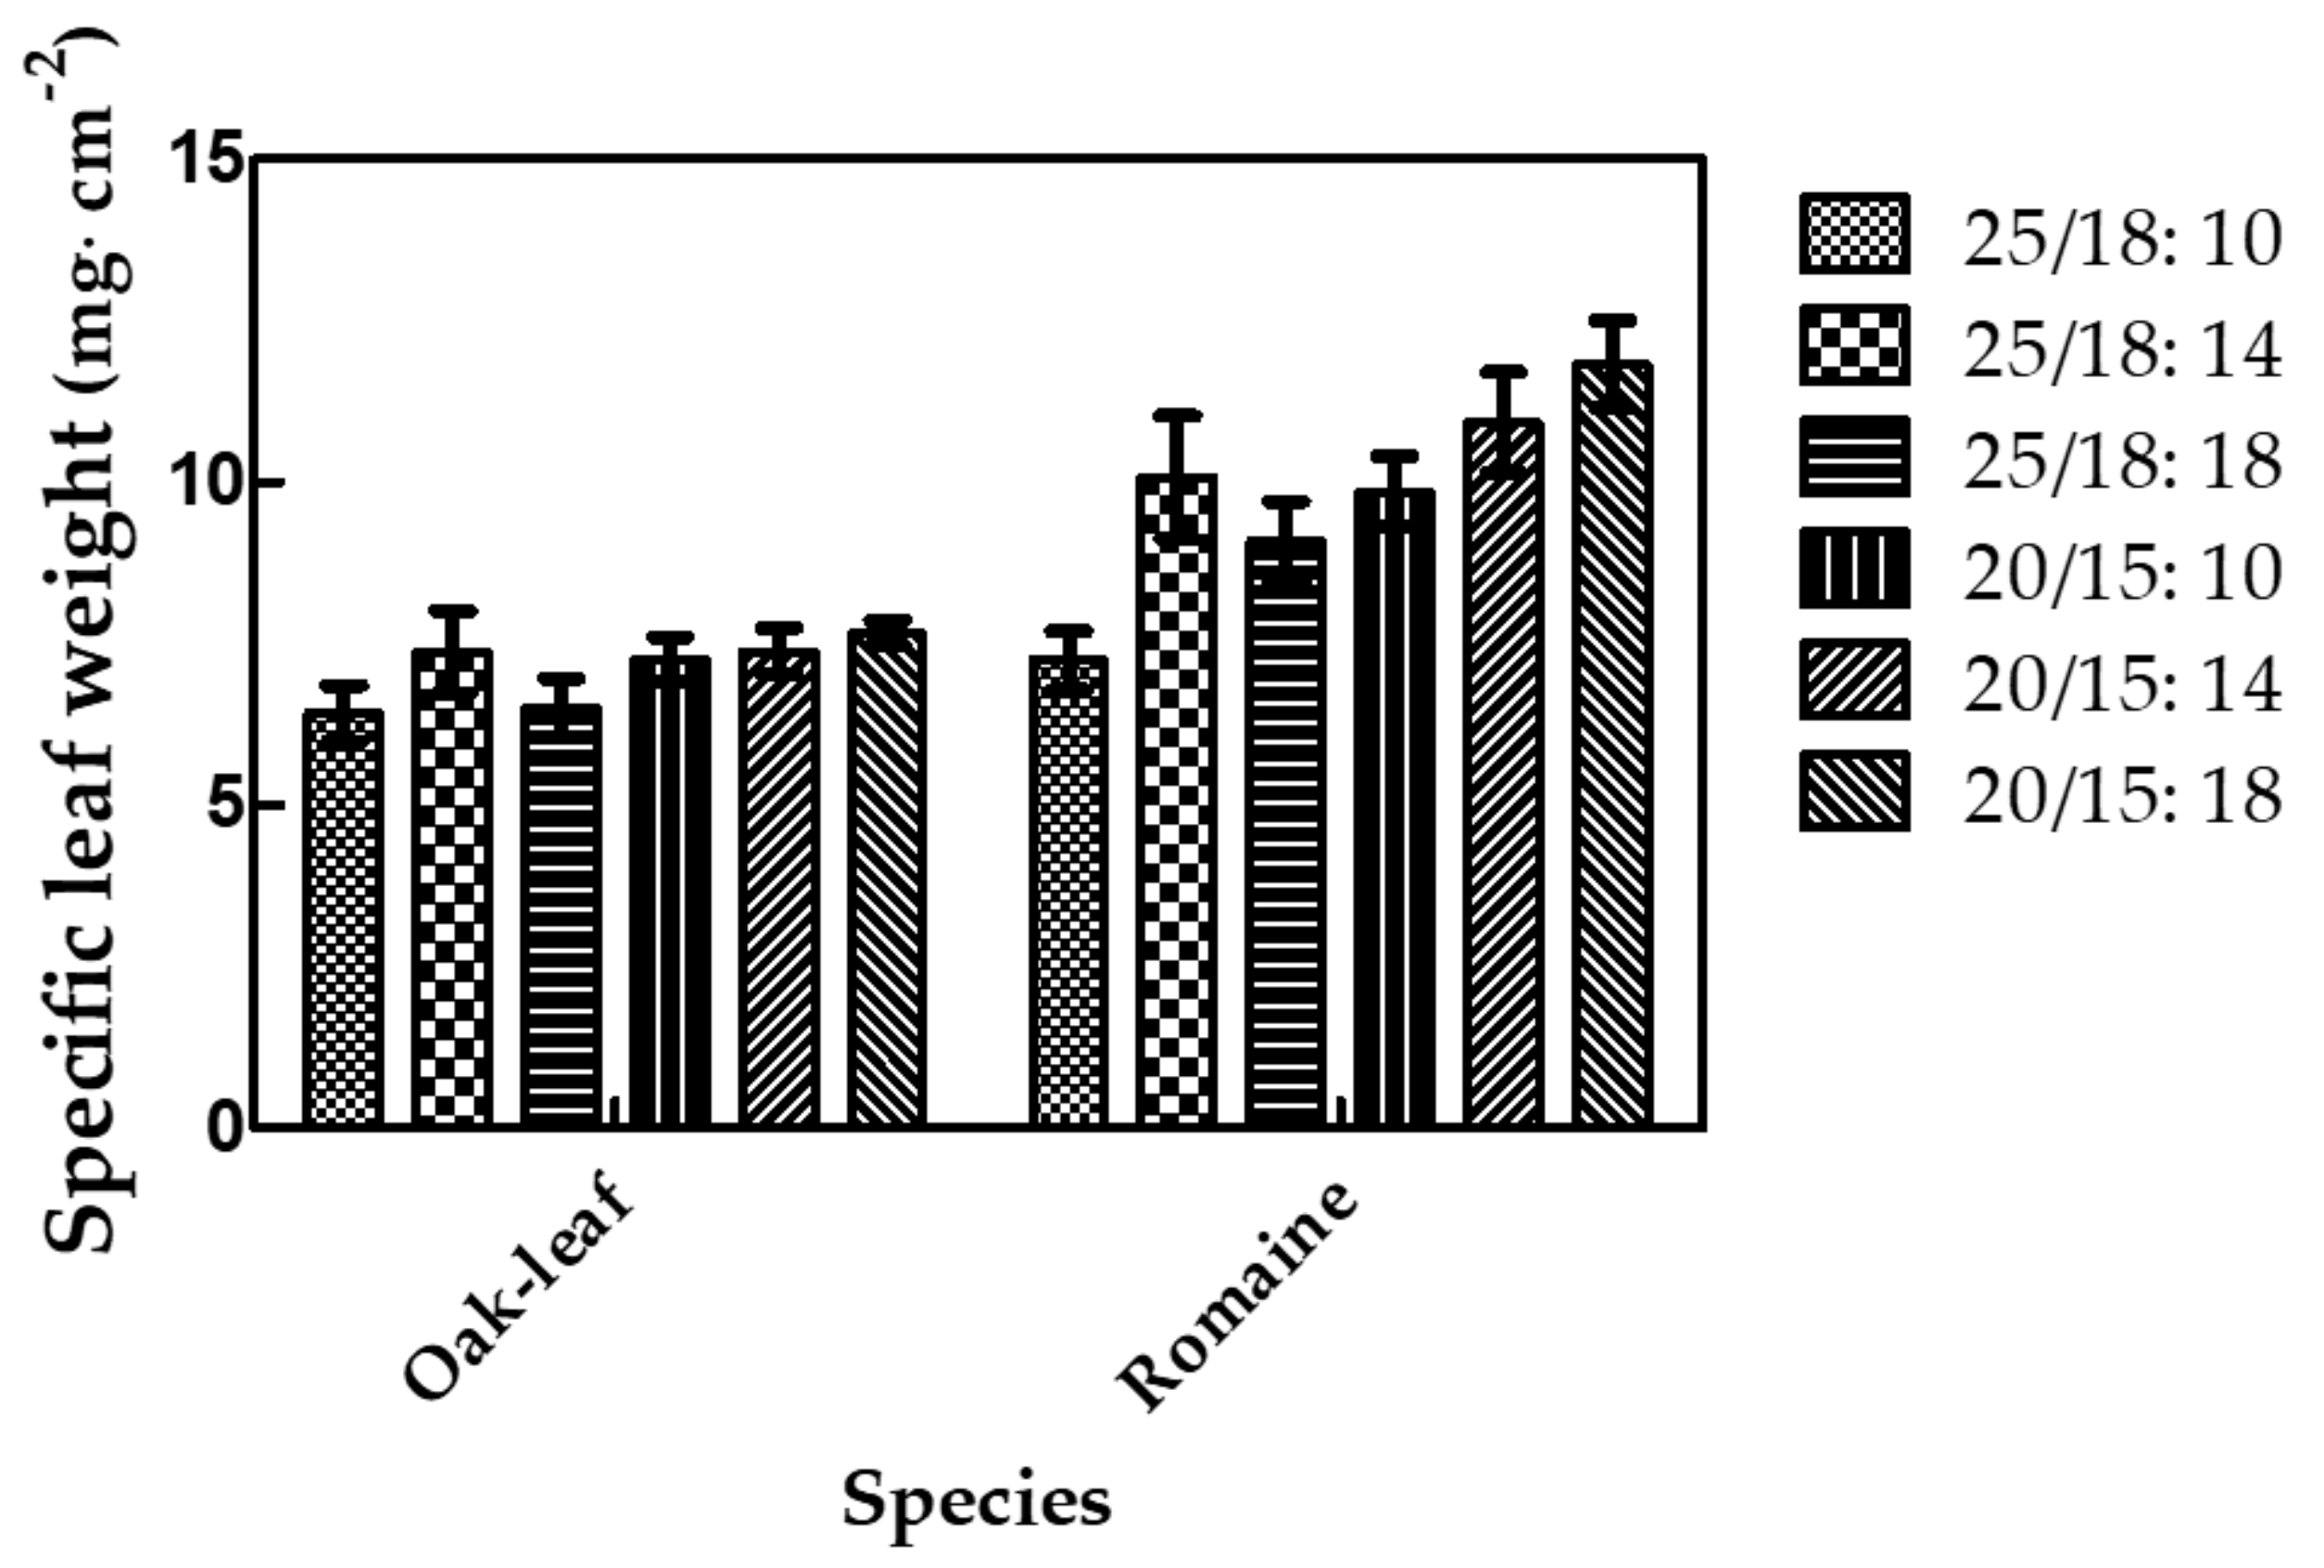
3.5. Yield and Quality

In some cases, the throughput did not sufficiently grow and the yield was insufficient, resulting in differences in the harvest days. The quality of vegetables is as important as the yield. The quality of vegetables was determined by the chlorophyll content, specific leaf weight, and ratio of the fresh weight to the dry weight. The chlorophyll a and b contents were measured separately, to measure the total chlorophyll content (Figure 5).
There were no tendencies observed for either species, especially at 25/18 °C. However, at 20/15 °C, the chlorophyll content was positively correlated with the photoperiod, although there were no significant differences. The second quality assessment was made with the dry weight to fresh weight ratio (Table 4). Although this ratio varied according to the vegetable variety, it was found that for the same photoperiod, this ratio was greater at the lower temperature set of 20/15 °C than at 25/18 °C. This agrees with results of other studies, in which growth under low temperature conditions acted as a stress and decreased the water content [26].
The specific leaf weight (Figure 6) showed a difference in the distribution depending on the temperature range. Both species overgrew at 25/18:10, apparently lowering the specific leaf weight due to insufficient thickness of the leaves. Both breeds also appeared to have greater leaf thicknesses at 25/18:10 than at 25/18:18. In the 20/15 treatments, longer photoperiods led to insignificant changes in the specific leaf weight for oak-leaf, but significant increases in the specific leaf weight of romaine lettuce. Due to the slow growth rate at low temperatures, lettuces at 20/15 °C seemed to have grown relatively more steadily than at 25/18 °C.
The yield (g/plant) of oak-leaf lettuce was the greatest at 25/18:18 28 days after sowing, followed by that at 25/18:14 (Figure 7b). The lowest yield was observed at 20/15:10. The yield at 20/15:18 was much smaller, but six days later, the weight per plant grew to similar levels as that at 25/18:14. With 25/18:18, some aging occurred and yellowing was observed in the lower leaves (Figure 7a).
The yield of romaine lettuce also tended to be like that of the oak-leaf lettuce. The 25/18:18 treatment resulted in the largest yield, followed by 25/18:14 (Figure 8b). The 20/15:18 treatment had the third highest yield, and the difference was more significant than that between the greatest yield and the second greatest yield. Six days later, however, it grew to similar levels as that of the 25/18:14 treatment in the harvest. The photograph shown in Figure 8a was taken just before the first harvest on day 28 after sowing, showing the most proliferation at 25/18:18, followed by 20/15:18.
Tip burn was observed in new romaine leaves 20 days after sowing. Eighty percent of plants in the 25/18:18 treatment, 50% of the plants in the 20/15:14 treatment, and 30% in the 20/15:18 treatment displayed tip burn (Table 5). At the photoperiod of 10 h, tip burn did not occur in either temperature treatment.

4. Discussion

Plant factories with artificial lighting (PFALs) are used for a wide range of crops, ranging from leafy vegetables to strawberries and bananas. The PFALs boast a high resource utilization efficiency, high annual productivity per unit land area, and high quality plants without pesticide use [27]. In addition, the growth rate of plants is greater and the mineral content is higher with hydroponics than with soil cultivation [28]. Recently, the climate crisis has made stable crop production difficult [29]. Opinions on whether agriculture should respond to the climate crisis vary, and amid the differences in opinions, PFALs are emerging as a sustainable agricultural technology [30]. Plant cultivation using these PFALs can control the harvest time by changing the environmental conditions. Methods for accelerating the growth rate include controlling the temperature, photoperiod, light quality, light quantity, carbon dioxide content, nutrient solution, etc. [27].
In this study, we tried to control the environment without the input of additional factors. So, we changed only the temperature and the photoperiod. The temperature (day/night temperature) was set to 25/18 °C and 20/15 °C in two levels. Temperature had a greater effect on early growth than photoperiod. As a result of measuring GR, MGT, and GE, no significant difference was found in oak-leaf. However, in Romaine, it was confirmed that GR was large and MGT was short under high temperature treatment. Emergence was faster in the 25/18 °C treatment of both species (oak-leaf and romaine lettuce) [31]. This was followed by favorable early growth. In the initial growth data investigated on the 10th day of sowing, it was confirmed that the high temperature treatment promoted growth significantly more than the low temperature treatment [32]. In particular, it was confirmed that in the 25/18 °C treatment, the difference in initial growth according to the photoperiod was larger than that in the 20/15 °C treatment. In the treatment in which germination and emergence was promoted, the securing of leaf area was accelerated, which appeared to be the result of promoting photosynthesis. In both species, shoot length, leaf length, leaf width, and number of leaves were large in the 25/18 °C treatment. In the 20/15 °C treatment, the effect of photoperiod was relatively greater than in the 25/18 °C treatment [33]. In both oak-leaf and romaine lettuce, shoot length, leaf length, leaf width, and number of leaves tended to increase as the daytime was longer under 20/15 °C treatment.
The quality of each treatment was evaluated by the content of chlorophyll, dry weight/fresh weight (%), specific leaf weight, and tip burn. There was no significant difference between treatments for chlorophylls a, b, and total. Specific leaf weights also confirmed that there was no significant difference between treatments. The ratio of dry weight to fresh weight was affected by both temperature and photoperiod. In both species, lettuce grown under the low temperature treatment had a lower moisture content and a higher amount of solid content. However, the moisture content of vegetables affects the texture [34], and preference varies depending on the use or individual preference, so the cultivation method can be selected according to the need.
Tip burn was also observed. Tip burn appeared mainly in new leaves, and the longer the photoperiod, the more frequently it appeared. Collier and Tibbitts (1984) confirmed that the development of tip burn was delayed when the growth of romaine lettuce was delayed; the Ca concentration increased, and the relative humidity decreased from 74% to 51% during the light season. In this experiment, the occurrence of tip burn was observed less in the 20/15 treatment, probably due to the lower relative humidity during the daytime. On the other hand, tip burn tends to appear with a rapid growth rate [35], and similarly, it was confirmed that tip burn appeared relatively more at 20/15 °C with 14-h and 18-h photoperiods. However, when the RH is lowered from 95% to 90% at nighttime, growth is reduced [36], the Ca concentration is lowered, and tip burn occurs faster. At 25/18:18, tip burn occurred the most. The other 25/18 treatments ranged from 95% to 98% nighttime relative humidity.
The final yield of oak leaves was highest at 25/18:18 on the 28th day of sowing, followed by the highest at 25/18:14 treatment [37]. After 6 days, the 20/15:18 treatment reached similar levels to the 25/18:14 treatment. Romaine had the same result. When the proper yield was set to 28 days after sowing with the 25/18:14 treatment, harvesting was possible approximately one day earlier than with 25/18:18 treatment. Harvest of the 20/15:18 treatment required 6 more days.

5. Conclusions

In this research, it was found that the cultivation period can be effectively controlled by temperature and photoperiod alone. The study concluded that the normal mode was 25/18:14, the hastened mode was 25/18:18, and the delayed mode was 20/15:18. However, it seems that the harvest is not always ideal due to such environmental changes. It was difficult to reach the desired yield and quality of the harvested leafy vegetables by controlling only temperature and photoperiod. For example, high temperature with shorter photoperiods caused overgrowth. It was possible to shorten or delay the days to harvest, and this was influenced more by temperature than photoperiod. However, there was a limit in accelerating or delaying cultivation time linearly only by adjusting the temperature and the photoperiod, since the hastened mode accelerated harvest only by one day, whereas the delayed mode required 6 more days to reach harvest stage. Additional studies will be conducted on the change in growth and development as affected by changes in the carbon dioxide concentration, nutrient solution, light intensity, and light quality using this cultivation system.

Author Contributions

Conceptualization, K.N. and B.R.J.; data curation, K.N.; formal analysis, K.N. and B.R.J.; funding acquisition, B.R.J.; investigation, K.N.; methodology, K.N.; project administration, B.R.J.; resources, B.R.J.; software, K.N.; supervision, B.R.J.; validation, B.R.J.; visualization, B.R.J.; writing—original draft, K.N.; writing—review and editing, B.R.J. Both authors have read and agreed to the published version of the manuscript.

Funding

This research was funded by LG Electronics (Project No. C2020040728). Kyungdeok Noh was supported by a scholarship from the BK21 Four, Ministry of Education, Republic of Korea.

Institutional Review Board Statement

Not applicable.

Informed Consent Statement

Not applicable.

Conflicts of Interest

The authors declare no conflict of interest.

References

  1. Plaut, T.R. Urban expansion and the loss of farmland in the United States: Implications for the future. Am. J. Agric. Econ. 1980, 62, 537–542. [Google Scholar] [CrossRef]
  2. Hande, M.J. Indoor Farming Hydroponic Plant Grow Chamber. Int. J. Sci. Res. Eng. Trends 2021, 7, 2050–2052. [Google Scholar]
  3. Eigenbrod, C.; Gruda, N. Urban vegetable for food security in cities. A review. Agron. Sustain. Dev. 2015, 35, 483–498. [Google Scholar] [CrossRef] [Green Version]
  4. Van Tuijl, E.; Hospers, G.J.; Van Den Berg, L. Opportunities and challenges of urban agriculture for sustainable city development. Eur. Spat. Res. Policy 2018, 25, 5–22. [Google Scholar] [CrossRef]
  5. Jensen, M.H. In Controlled Environment agriculture in deserts, tropics and temperate regions-A World Review. Int. Symp. Des. Environ. Control Trop. Subtrop. Greenh. 2001, 578, 19–25. [Google Scholar] [CrossRef]
  6. Campiotti, C.; Balducchi, R.; Incrocci, L.; Pardossi, A.; Popovski, K.; Popovska, S. In Hydroponics technology as a tool for plant fresh food support in Antarctica. World Congr. Soil. Cult. Agric. Coming Millenn. 2000, 554, 279–284. [Google Scholar] [CrossRef]
  7. Bamsey, M.T.; Zabel, P.; Zeidler, C.; Gyimesi, D.; Schubert, D.; Kohlberg, E.; Mengedoht, D.; Rae, J.; Graham, T. In Review of Antarctic greenhouses and plant production facilities: A historical account of food plants on the ice. In Proceedings of the 45th International Conference on Environmental Systems, Bellevue, DC, USA, 12–16 July 2015. [Google Scholar]
  8. Oyama, N.; Nair, J.; Ho, G. Recycling of treated domestic effluent from an on-site wastewater treatment system for hydroponics. Water Sci. Technol. 2005, 51, 211–219. [Google Scholar] [CrossRef]
  9. Oyama, N.; Nair, J.; Ho, G. Wastewater hydroponics for horticulture. In Proceedings of the International Water Association 4th World Water Congress, Marrakesh, Morocco, 21–22 September 2004. [Google Scholar]
  10. Kumar, R.R.; Cho, J.Y. Reuse of hydroponic waste solution. Environ. Sci. Pollut. Res. 2014, 21, 9569–9577. [Google Scholar] [CrossRef]
  11. Ikeda, A.; Tanimura, Y.; Ezaki, K.; Kawai, Y.; Nakayama, S.; Iwao, K.; Kageyama, H. In Environmental control and operation monitoring in a plant factory using artificial light. In Proceedings of the International Workshop on Sensors in Horticulture, Noordwijkerhout, The Netherlands, 29–31 January 1991; Volume 304, pp. 151–158. [Google Scholar]
  12. Vidhya, R.; Valarmathi, K. In Survey on automatic monitoring of hydroponics farms using IoT. In Proceedings of the 2018 3rd International Conference on Communication and Electronics Systems (ICCES), Coimbatore, India, 15–16 October 2018; pp. 125–128. [Google Scholar]
  13. Dinpanah11, G.; Jamshidi, A.; Lashgarara, F. Influencing factors on attitude toward hydroponics cultivation viewpoint of experts. J. Biodivers. Environ. Sci. 2014, 5, 141–147. [Google Scholar]
  14. Barbosa, G.L.; Gadelha, F.D.A.; Kublik, N.; Proctor, A.; Reichelm, L.; Weissinger, E.; Wohlleb, G.M.; Halden, R.U. Comparison of land, water, and energy requirements of lettuce grown using hydroponic vs. conventional agricultural methods. Int. J. Environ. Res. Public Health 2015, 12, 6879–6891. [Google Scholar] [CrossRef] [Green Version]
  15. Noh, K.; Jeong, B.R. Particulate matter in the cultivation area may contaminate leafy vegetables with heavy metals above safe levels in Korea. Environ. Sci. Pollut. Res. 2019, 26, 25762–25774. [Google Scholar] [CrossRef] [Green Version]
  16. Sugano, M. In Elemental technologies for realizing a fully-controlled artificial light-type plant factory. In Proceedings of the 2015 12th International Conference & Expo on Emerging Technologies for a Smarter World (CEWIT), Melville, NY, USA, 19–20 October 2015; pp. 1–5. [Google Scholar]
  17. Venter, G.D. Hydroponics today. SABI Mag.-Tydskr. 2015, 7, 8–10. [Google Scholar]
  18. Quagrainie, K.K.; Flores, R.M.V.; Kim, H.-J.; McClain, V. Economic analysis of aquaponics and hydroponics production in the US Midwest. J. Appl. Aquac. 2018, 30, 1–14. [Google Scholar] [CrossRef]
  19. Walters, K.J.; Behe, B.K.; Currey, C.J.; Lopez, R.G. Historical, current, and future perspectives for controlled environment hydroponic food crop production in the United States. HortScience 2020, 55, 758–767. [Google Scholar] [CrossRef]
  20. Loh, S. Living walls–a way to green the built environment. Environ. Des. Guide 2008, 26, 1–7. [Google Scholar]
  21. Brown-Paul, C. Diversifying for success. Pract. Hydroponics Greenh. 2015, 155, 32–39. [Google Scholar]
  22. Sadeghianfar, P.; Nazari, M.; Backes, G. Exposure to ultraviolet (UV-C) radiation increases germination rate of maize (Zea maize L.) and sugar beet (Beta vulgaris) seeds. Plants 2019, 8, 49. [Google Scholar] [CrossRef] [Green Version]
  23. Afsheen, S.; Naseer, H.; Iqbal, T.; Abrar, M.; Bashir, A.; Ijaz, M. Synthesis and characterization of metal sulphide nanoparticles to investigate the effect of nanoparticles on germination of soybean and wheat seeds. Mater. Chem. Phys. 2020, 252, 123216. [Google Scholar] [CrossRef]
  24. Zhang, T.; Fan, S.; Xiang, Y.; Zhang, S.; Wang, J.; Sun, Q. Non-destructive analysis of germination percentage, germination energy and simple vigour index on wheat seeds during storage by Vis/NIR and SWIR hyperspectral imaging. Spectrochim. Acta Part A Mol. Biomol. Spectrosc. 2020, 239, 118488. [Google Scholar] [CrossRef]
  25. Wang, M.; Xiao, J.; Wei, H.; Jeong, B.R. Supplementary light source affects growth and development of carnation ‘Dreambyul’cuttings. Agronomy 2020, 10, 1217. [Google Scholar] [CrossRef]
  26. Rubatzky, V.E.; Yamaguchi, M. Spinach, table beets, and other vegetable chenopods. World Veg. 1997, 457–473. [Google Scholar] [CrossRef]
  27. Kozai, T. Plant Factories with Artificial Lighting (PFALs): Benefits, Problems, and Challenges. Smart Plant Fact. 2018, 1227, 15–29. [Google Scholar]
  28. Lee, S.-Y.; Kim, H.-J.; Bae, J.-H. Growth, vitamin C, and mineral contents of Sedum sarmentosum in soil and hydroponic cultivation. Hortic. Sci. Technol. 2011, 29, 195–200. [Google Scholar]
  29. Zhang, H.; Li, Y.; Zhu, J.-K. Developing naturally stress-resistant crops for a sustainable agriculture. Nat. Plants 2018, 4, 989–996. [Google Scholar] [CrossRef]
  30. Anpo, M.; Fukuda, H.; Wada, T. Plant Factory Using Artificial Light: Adapting to Environmental Disruption and Clues to Agricultural Innovation; Elsevier: Amsterdam, The Netherlands, 2018. [Google Scholar]
  31. Choi, K.Y.; Paek, K.Y.; Lee, Y.B. Effect of air temperature on tipburn incidence of butterhead and leaf lettuce in a plant factory. In Transplant Production in the 21st Century; Springer: Dordrecht, The Netherlands, 2000; pp. 166–171. [Google Scholar]
  32. Challa, H.; Heuvelink, E.; Van Meeteren, U. Crop growth and development. In Greenhouse Climate Control: An Integrated Approach; Wageningen Academic Publishers: Wageningen, The Netherlands, 1995; pp. 62–84. [Google Scholar]
  33. Kang, J.H.; KrishnaKumar, S.; Atulba, S.L.S.; Jeong, B.R.; Hwang, S.J. Light intensity and photoperiod influence the growth and development of hydroponically grown leaf lettuce in a closed-type plant factory system. Hortic. Environ. Biotechnol. 2013, 54, 501–509. [Google Scholar] [CrossRef]
  34. Mou, B. Lettuce. In Vegetables I; Springer: New York, NY, USA, 2008; pp. 75–116. [Google Scholar]
  35. Lee, R.J.; Bhandari, S.R.; Lee, G.; Lee, J.G. Optimization of temperature and light, and cultivar selection for the production of high-quality head lettuce in a closed-type plant factory. Hortic. Environ. Biotechnol. 2019, 60, 207–216. [Google Scholar] [CrossRef]
  36. Collier, G.; Tibbitts, T. Effects of relative humidity and root temperature on calcium concentration and tipburn development in lettuce. J. Am. Soc. Hortic. Science. Am. Soc. Hortic. Sci. 1984, 109, 128–131. [Google Scholar]
  37. Ito, T. More intensive production of lettuce under artificially controlled conditions. Int. Symp. Growth Yield Control Veg. Prod. 1989, 260, 381–390. [Google Scholar] [CrossRef]
Figure 1. A schematic diagram showing the photoperiod and temperature control of the cultivator used in the experiment. The codes in the white boxes represent the abbreviation of each treatment. For example, the treatment of day temperature 25 °C, night temperature 18 °C, and photoperiod of 10 h is expressed as 25/18:10. All cultivators were operated to turn LEDs on at 6:00 a.m. and off according to the photoperiod setting of each treatment.
Sustainability 13 10879 g001
Figure 2. Comparison of the carbon dioxide concentration outside and inside the growing machine over time: (a) the period without plant; and (b) the period of plant cultivation. The codes represent the abbreviation of each treatment as described in Figure 1.
Sustainability 13 10879 g002
Figure 3. The recorded temperature (a) and relative humidity (b) in each treatment. All treatments were set to start the day at 6:00 a.m. The photoperiod was 10, 14, or 18 h a day, making the time at which the night started vary in different treatments. The codes represent the abbreviation of each treatment as described in Figure 1.
Sustainability 13 10879 g003
Figure 4. Quantity of nutrient solution consumed. The codes represent the abbreviation of each treatment as described in Figure 1. Significant differences among treatments are indicated by lower case letters at p ≤ 0.05 according to Duncan’s multiple range test.
Sustainability 13 10879 g004
Figure 5. Contents of chlorophyll a and b of oak-leaf (a) and romaine (b). The codes represent the abbreviation of each treatment as described in Figure 1. The vertical bars represent SEs of three biological replicates n = 3). Significant differences among treatments are indicated by lower case letters at p ≤ 0.05 according to Duncan’s multiple range test.
Sustainability 13 10879 g005
Figure 6. Specific leaf weight of oak-leaf and romaine. The codes represent the abbreviation of each treatment as described in Figure 1. The vertical bars represent SEs of five biological replicates (n = 5). Significant differences among treatments are indicated by lower case letters at p ≤ 0.05 according to Duncan’s multiple range test.
Sustainability 13 10879 g006
Figure 7. Growth (a) and yield (b) of oak-leaf lettuce measured 28, 31, and 34 days after sowing. The codes represent the abbreviation of each treatment as described in Figure 1. The vertical bars for the 25/18:14 and 25/18:18 on the 28th day represent SEs of 20 biological replicates (n = 20) and other vertical bars represent SEs of 10 biological replicates (n = 10).
Sustainability 13 10879 g007
Figure 8. Growth (a) and yield (b) of romaine lettuces measured 28, 31, and 34 days after sowing. The codes represent the abbreviation of each treatment as described in Figure 1. The vertical bars for the 25/18:14 and 25/18:18 on the 28th day represent SEs of 20 biological replicates (n = 20) and other vertical bars represent SEs of 10 biological replicates (n = 10).
Sustainability 13 10879 g008
Table 1. Germination rate (GR), mean germination time (MGT), and germination energy measured 4 days after sowing (GE) by treatment of oak-leaf and romaine.
SpeciesTemp. (D/N, °C) (A)Photoperiod,
(h) (B)
Germination Rate (GR)Mean Germination Time (MGT, day)Germination Energy (GE)
Oak-leaf25/18105.61.983.3
146.72.093.3
185.91.680.0
20/15105.42.593.3
146.52.396.7
184.32.276.7
F-testAz NSNSNS
BNSNSNS
A* BNSNSNS
Romaine25/18106.9 ab y2.2 ab96.7
147.4 a2.0 b100.0
187.3 a2.1 b100.0
20/15106.2 ab2.5 ab100.0
146.9 ab2.3 ab100.0
185.7 b2.7 a100.0
F-testA**NS
BNSNSNS
A* BNSNSNS
zNS and * represent no significant or significant difference at p = 0.05, respectively. y Mean (n = 20) values separated within columns followed by different letters are significantly different according to the Duncan’s multiple range test at p ≤ 0.05.
Table 2. Emergence rate (ER), mean emergence time (MET), and emergence energy on the 5th, 6th, 7th days after sowing (EE) by treatment of oak-leaf and romaine.
SpeciesTemp. (D/N, °C)
(A)
Photoperiod (h)
(B)
Emergence Rate (ER)Mean Emergence Time (MET, day)Emergence Energy (EE)
5th6th7th
Oak-leaf25/18107.3 ab3.3 c85.0 a100.0 a100.0
148.5 a3.4 bc85.0 a100.0 a100.0
187.0 ab3.2 c85.0 a100.0 a100.0
20/15104.6 c4.0 a10.0 b55.0 b95.0
145.5 bc4.3 a25.0 b50.0 b95.0
184.3 c3.9 ab5.0 b60.0 b80.0
F-testAz *******NS
BNSNSNSNSNS
A* BNSNSNSNSNS
Romaine25/18105.83.0 b y100.0 a100.0100.0
147.53.1 b100.0 a100.0100.0
185.83.1 b90.0 ab100.0100.0
20/15106.03.9 a25.0 c85.0100.0
148.23.6 a65.0 b95.0100.0
186.53.8 a30.0 c100.0100.0
F-testANS****NSNS
BNSNSNSNSNS
A* BNSNSNSNSNS
zNS, *, **, and ***, represent no significant or significant difference at p = 0.05, 0.01, or 0.001, respectively. y Mean (n= 20) values separated within columns followed by different letters are significantly different according to the Duncan’s multiple range test at p ≤ 0.05.
Table 3. Comparison of shoot length, leaf length, leaf width, and number of leaves in the early growth stage.
SpeciesTemperature (Day/Night, °C) (A)Photoperiod (h)
(B)
FW
(mg)
Shoot Length (cm)Leaf Length (cm)Leaf Width (cm)No. of Leaves
Oak-leaf25/1810153.5 b6.6 a5.3 a3.9 a1.8 a
14169.4 b6.0 b5.1 a3.3 b1.5 b
18221.9 a5.4 b5.0 a3.4 ab1.5 ab
20/151030.2 c3.2 d3.5 d1.3 d0.7 d
1451.0 c3.7 cd4.1 c1.8 d1.0 c
1872.4 c3.9 c4.6 b2.6 c1.2 c
F-testAz ***************
B**NS**NS
A* BNS************
Romaine25/181066.8 b y4.7 a1.9 b1.0 b3.9 b
1470.4 b4.3 b2.1 b1.1 b3.9 b
1896.9 a4.3 b2.6 a1.3 a4.4 a
20/151028.6 d3.3 c0.4 d0.3 c2.9 d
1432.2 cd2.9 c0.7 d0.5 c3.4 c
1844.8 c3.2 c1.0 c0.6 c3.9 b
F-testA***************
B*************
A* BNSNSNSNS**
zNS, *, **, and ***, represent no significant or significant difference at p = 0.05, 0.01, or 0.001, respectively. y Mean (n = 16) values separated within columns followed by different letters are significantly different according to the Duncan’s multiple range test at p ≤ 0.05.
Table 4. Ratio of dry weight to fresh weight by treatment of oak-leaf and romaine.
Temperature (Day/Night, °C)
(A)
Photoperiod (h)
(B)
Dry Weight/Fresh Weight Ratio (%)
Oak-LeafRomaine
25/18105.1 bc y4.6 ab
144.3 c3.9 bc
185.1 bc3.5 c
20/15105.4 b5.3 a
146.7 a4.2 bc
185.3 bc5.1 a
F-testAz *****
BNS**
A* B**NS
z NS, *, **, and ***, represent no significant or significant difference at p = 0.01, or 0.001, respectively. y Mean (n = 16) values separated within columns followed by different letters are significantly different according to the Duncan’s multiple range test at p ≤ 0.05.
Table 5. Incidence (%) of plants showing tip burn in romaine checked 20 days after sowing.
Temperature (D/N °C)Photoperiod (h)Tip Burn (%)
25/18100
1410
1880
20/15100
1450
1830
Publisher’s Note: MDPI stays neutral with regard to jurisdictional claims in published maps and institutional affiliations.

