Article

Effects of Contact Time and Flow Configuration on the Acid Mine Drainage Remediation Capabilities of Pervious Concrete

by
Sandisiwe Khanyisa Thisani
1,*,
Daramy Vandi Von Kallon
1 and
Patrick Byrne
2
1
Department of Mechanical and Industrial Engineering Technology, University of Johannesburg, Johannebsurg 2006, South Africa
2
School of Biological and Environmental Sciences, Liverpool John Moores University, Liverpool L2 2QP, UK
*
Author to whom correspondence should be addressed.
Sustainability 2021, 13(19), 10847; https://doi.org/10.3390/su131910847
Submission received: 20 July 2021 / Revised: 19 September 2021 / Accepted: 20 September 2021 / Published: 29 September 2021

Abstract

:
This paper investigates the Acid Mine Drainage (AMD) remediation capabilities of pozzolanic pervious concrete Permeable Reactive Barriers (PRBs) with a specific focus on the effects of flow configuration and contact time on the remediation efficiency. Raw AMD was collected from an abandoned coal mine. Two flow configurations, gravity flow and column flow, were tested at a laboratory scale with gradually increasing contact times. The gravity flow configuration with two orders of magnitude less liquid-concrete contact time achieved AMD treated water quality equivalent to the high retention column flow configuration. Concentrations of iron, aluminium, sulphate, magnesium and sodium were reduced by more than 99%, 80%, 17%, 22% and 20%, respectively, at the tested limits while calcium and potassium concentrations were increased by up to 16% and 300%, respectively. The study findings indicate that the lifecycle costs of pervious concrete PRBs can be significantly reduced when the PRBs are operated under gravity flow.

1. Introduction

Acid Mine Drainage (AMD) and the pollution associated with it are among the greatest environmental issues faced by mining operations globally [1]. When oxygenated water accumulates in active or abandoned mines and comes into contact with sulphide-rich minerals from exposed rock faces, the water is converted to a low pH leachate which dissolves heavy metals and other toxic contaminants from the surrounding environment [2,3,4]. The resulting stream is typically characterised by low pH, high dissolved metals and high dissolved sulphate (SO4) concentrations and is referred to as AMD [4,5]. The AMD can continue to decant for centuries after commercial mining operations have ceased and thus poses long-term environmental damage when left untreated [6,7]. The development of a low cost, low maintenance and effective AMD treatment process is one of the most important solutions required for the sustainable future of sulphide-rich mineral mining [1,8].
Permeable Reactive Barriers (PRBs) are porous mediums with reactive material specifically designed to react with passing fluids through chemical or biochemical processes [9,10,11]. Since the 1970s, PRBs have been installed in the flow path of groundwater and used as an in situ remediation method for various water contaminants including heavy metals, organohalogen compounds, nitrate and SO4, among others [9,12,13]. The major advantages of using PRBs for groundwater remediation include the low operational and maintenance costs, minimal operational supervision required and the potential for in situ installation, which limits land usage [12,14]. The major limitations of PRBs include the depletion of the reactive chemical compounds over time, the potential for armouring of the reactive surface and the gradual clogging from precipitant build-up in the flow path, all of which can necessitate the need for PRB replacement or the use of sequenced multi-barrier techniques [12,15].
In recent studies [9,16,17,18,19,20], pervious concrete has been investigated as a PRB for the remediation of inorganic pollutants in AMD. When AMD flows through the pervious concrete’s porous network, it reacts with the highly alkaline surface which has a pH typically between 12 and 13 [17,21]. The resulting reaction leads to an increase in the AMD pH which reduces the solubility of dissolved metals, leading to their precipitation as metal hydroxides. The dissolution of calcium compounds, mainly portlandite (Ca(OH)2) and lime (CaO), from pervious concrete is attributed to three main chemical reactions which result in pH correction, metal removal as metal hydroxide precipitants as a result of increased pH and sulphate removal through gypsum precipitation.
The material composition design for pervious concrete PRBs is well publicised [9,15,16,17,18,21,22]. Studies conducted on pervious concrete material selection found that a water to cement ratio of between 0.25 and 0.3 is most optimal [16,17,19], granite aggregates can achieve marginally improved treated AMD quality over dolomite aggregates [16] and aggregate size of 9.5 mm achieves marginally improved treated AMD quality over larger 13.2 mm stone, with the drawback of lower porosity and higher risk of clogging [18].
The geometric and flow design parameters of pervious concrete PRBs play an important role on the overall performance of the chemical processes involved in AMD remediation as well as the lifecycle cost of the system. Limited literature is available to inform the optimisation of these parameters towards achieving efficient AMD treatment. The main criteria for the geometric and flow design parameters of PRBs are the liquid-concrete contact time and the flow configuration, respectively. The contact time can directly influence pH correction, metal hydroxide precipitation and sulphate removal. The contact time can have a significant influence on the lifecycle cost as higher contact times require greater volumes of pervious concrete. Flow configuration, on the other hand affects, the distribution of the AMD across the PRB porous network, which can influence the chemical reactions taking place during remediation and clogging of the porous network. Flow configuration also has an influence on the concrete volume required and therefore also affects the economics of the system. The two flow configurations available for PRB treatment are column flow and gravity flow. At the time of this study, limited literature was available on the comparative AMD remediation performance of these flow configurations.
This study was conducted to evaluate the effects of flow configuration on the AMD remediation capabilities of pozzolanic pervious concrete using primary experimental data. The study further aimed to evaluate the relationship between contact time and the AMD remediation capabilities for the tested PRB flow configurations. For the column flow experiments, the contact time was adjusted by varying the flow rate of the AMD feed pump. For the gravity flow experiments, the contact time was adjusted by varying the height of the pervious concrete PRB.

2. Methodology

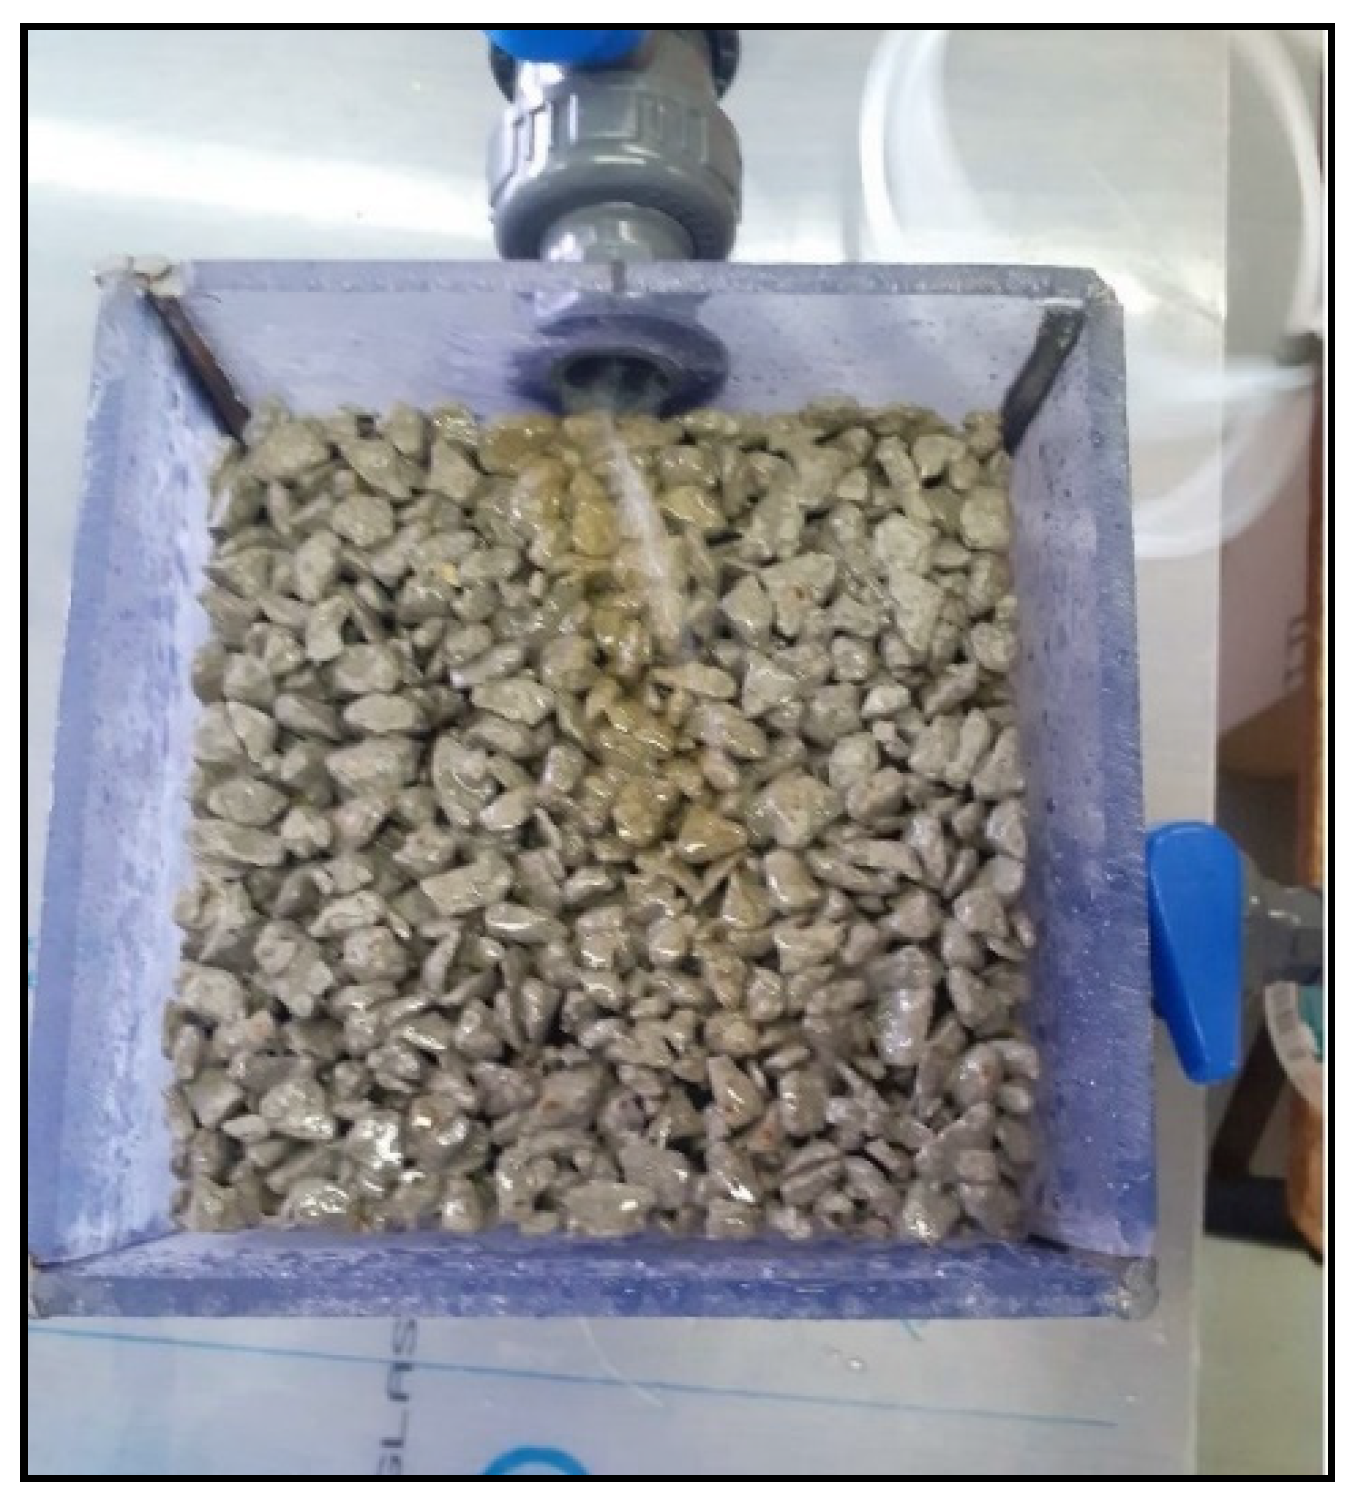
2.1. Equipment and Materials

Pozzolanic CEM IV A and 9.5 mm granite stone were selected as the cement and aggregate for the PRB due to the proven AMD treatment capabilities of siliceous cement from existing literature [16,17,20,23] and the chemical resisting properties of silica-based concrete [24]. The CEM IV A mix design comprised Portland CEM I with 4% silica fume CSF-90TM and 8% siliceous fly ash. Both extenders contain high amounts of reactive SiO2 (exceeding 80% in silica fume and exceeding 50% in siliceous fly ash), which improves the strength of concrete through a pozzolanic reaction with the Ca(OH)2 produced during the cement hydration process, forming the cementing compound Calcium Silicate Hydrate (CSH) [23,24]. Silica Fume was incorporated to the mix design to enhance the chemical resisting properties of the concrete against sulphates, improve cementing of the aggregates and improve the overall concrete strength. CHRYSO® Optima 175 was used as the superplasticiser for the concrete to improve workability.
The concrete was cast in standard 150 mm moulds. The pervious concrete cubes were prepared by weighing the required dry mix and stirring them in a 50-litre mixing pan. Water and the CHRYSO® Optima 175 admixture were added slowly into the mixing pan until a water to cement mass ratio of 1:3 was achieved. The mix was stirred for approximately two minutes. The mixed concrete was then filled into 150 mm cube moulds. The mould filling was carried out with three layers of concrete, each compacted with 20 strokes using a steel rod. The top layer was levelled off and the moulds were covered with plastic sheets and water sprayed once every few hours during the first 24 h. The concrete cubes were then demoulded and placed in a water curing bath for 20 days. The porosity of the cured concrete cubes was determined using the liquid displacement method. Table 1 gives the mix designs for the pervious concrete cubes and the percentage porosity.

2.2. Acid Mine Drainage Collection and Storage

Raw AMD was collected from a coal mine that was abandoned over 40 years ago in the north-eastern coal fields of KwaZulu-Natal province of South Africa. Figure 1 shows the condition of the water at the mine site during sample collection. The raw AMD determinands are given in Table 2.

2.3. Experimental Methods

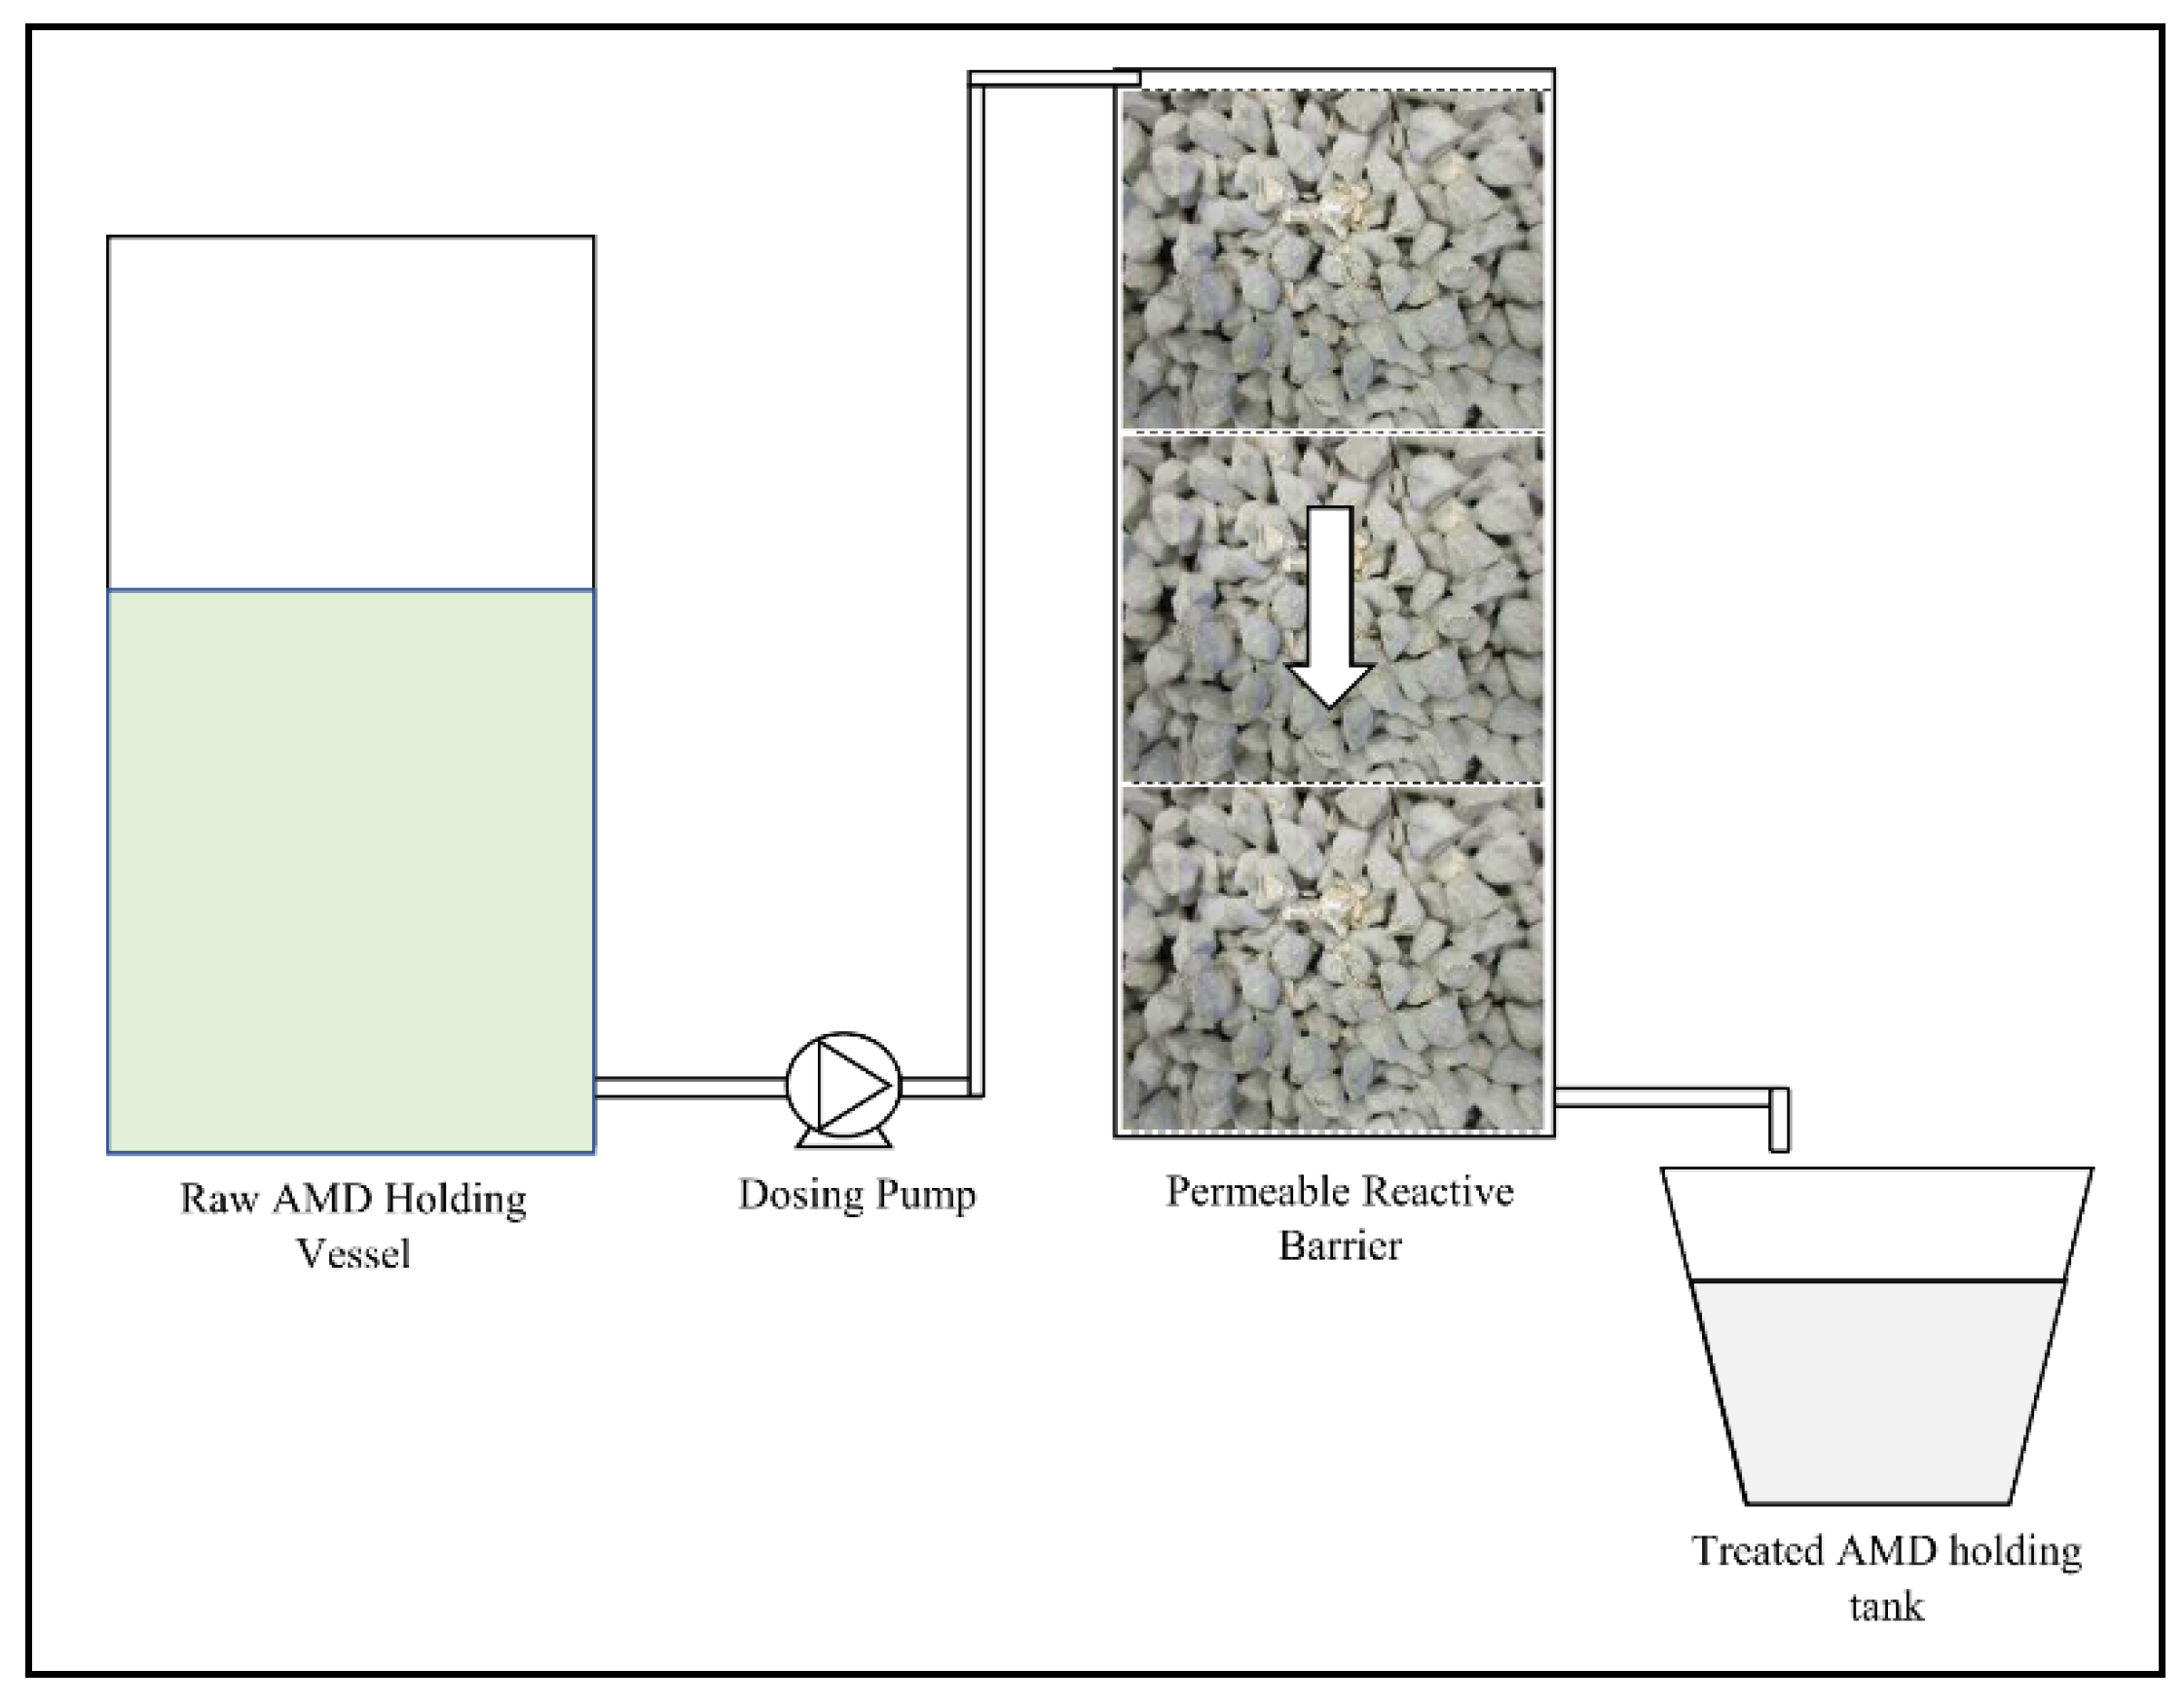
2.3.1. Column Flow Test Procedure

The pervious concrete cube was inserted into a holding vessel made of cast acrylic sheet with internal dimensions of 155 × 155 × 180 mm (L × B × H). The column configuration was tested at increasing contact time in 30 min intervals. An Etatron D.S. peristaltic dosing pump was used to adjust the flow rate and contact time. The AMD was discharged under the column flow configuration at flow rates of 6.7, 11.1, 16.7, 33.3 and 200 mL/min to achieve contact times of 150, 90, 60, 30 and 5 min, respectively. The AMD was allowed to flow through the cube for a total of three retentions, which equates to 2.5 L of AMD, at each flow rate with a homogenised 500 mL sample collected for chemical analysis. Figure 2 shows the experimental set-up for the column flow configuration.

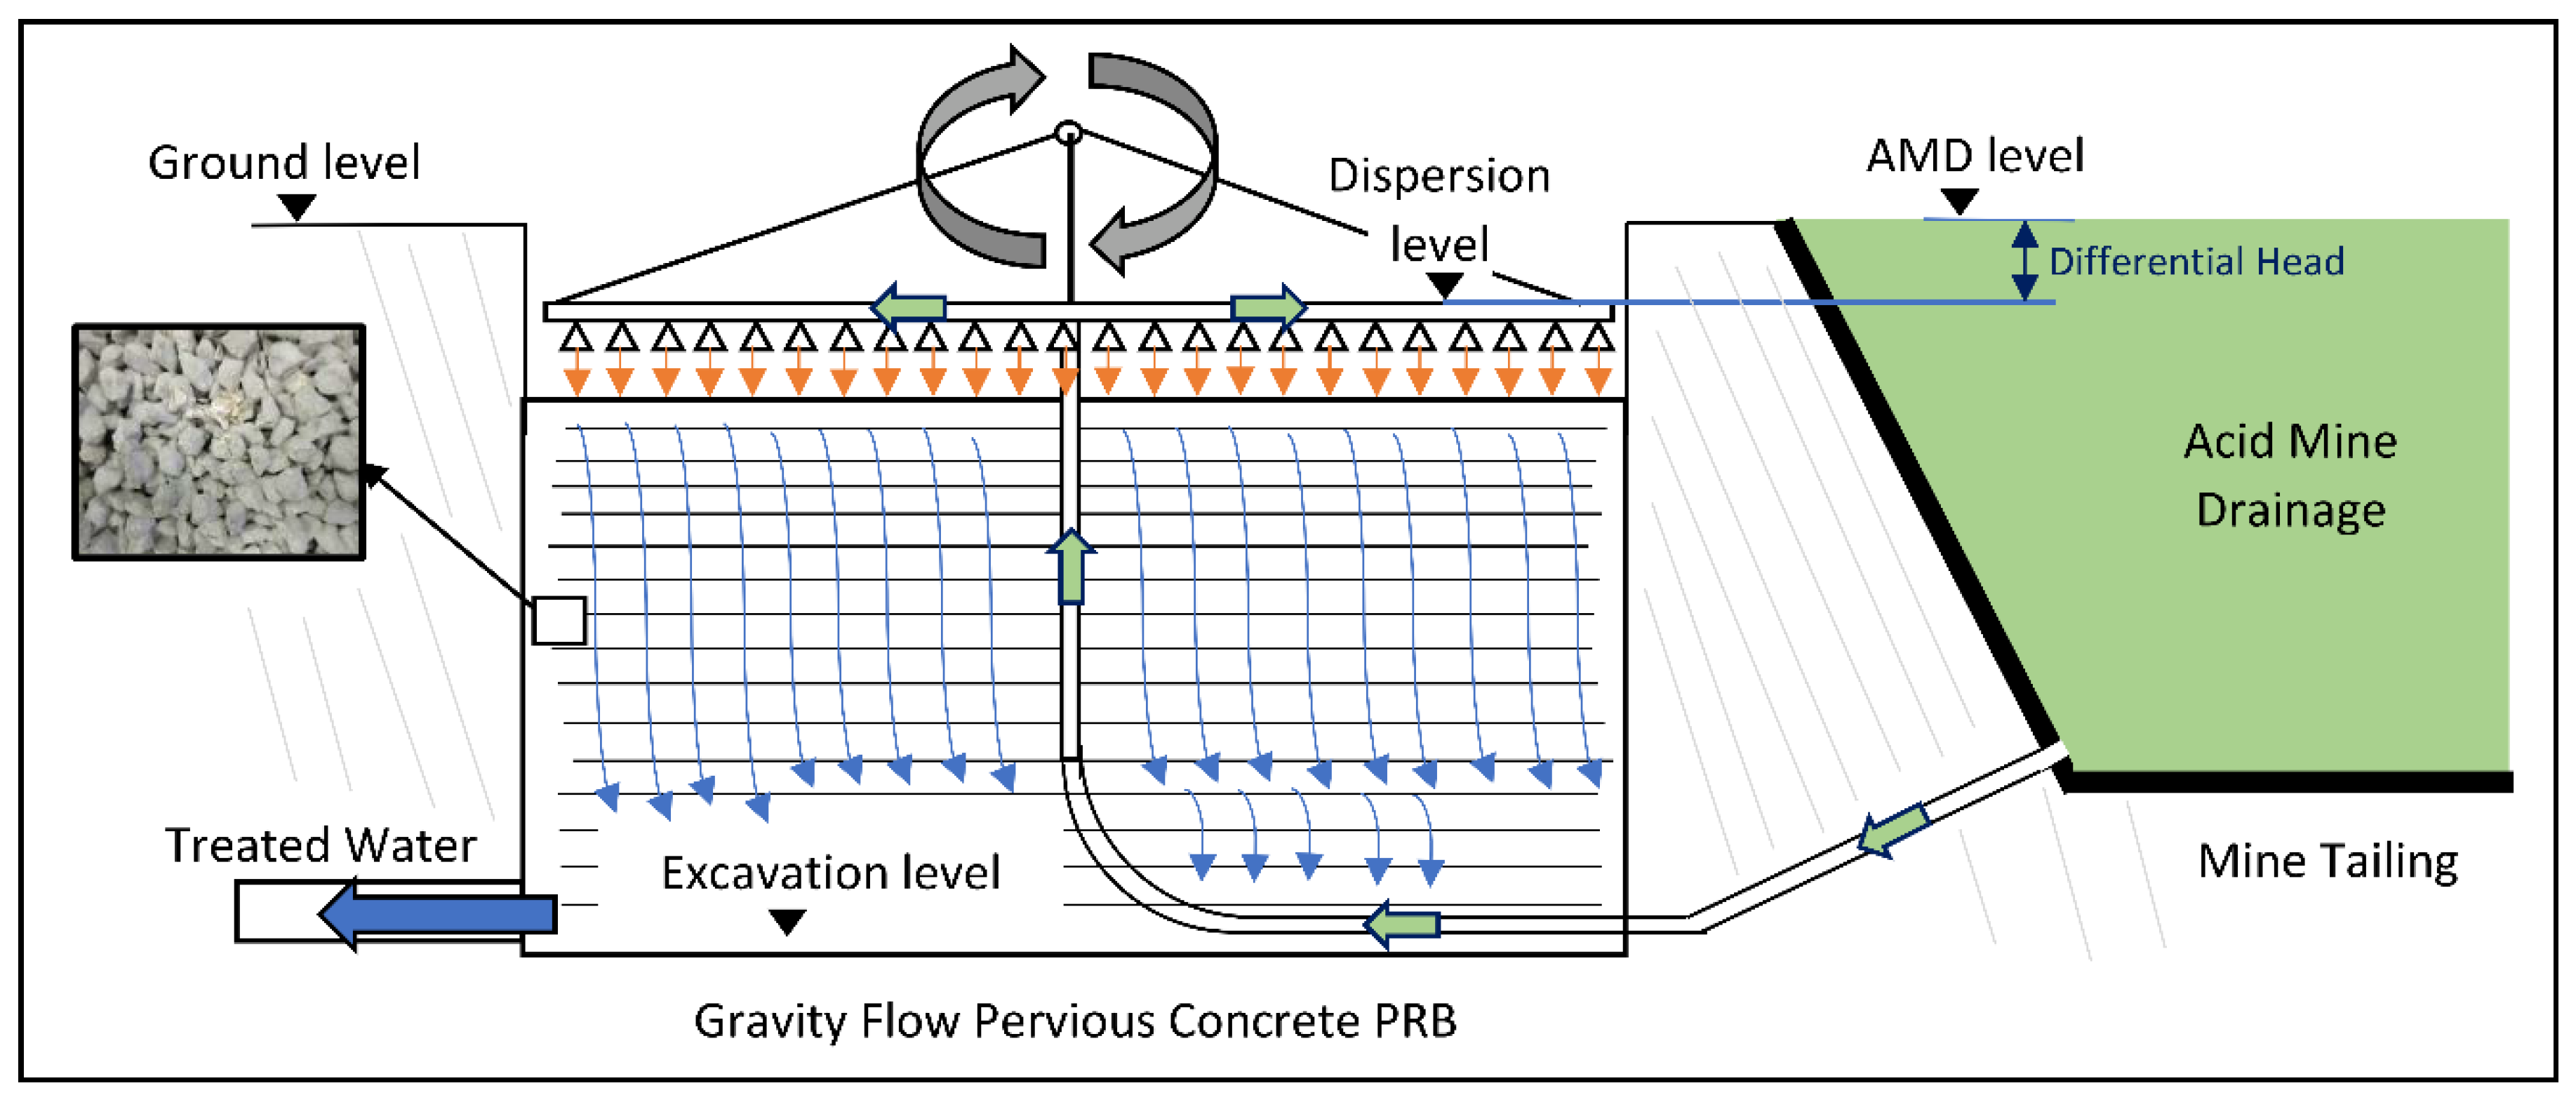
2.3.2. Gravity Flow Test Procedure

The gravity flow configuration was tested at three contact times by varying the height of the pervious concrete assembly. The column heights tested were 150, 300 and 450 mm. The column height was adjusted by stacking the pervious concrete cubes one on top of the other. The AMD was discharged through each column assembly for a total volume of 2.5 L and a homogenised 500 mL sample collected for chemical analysis. The AMD was discharged at the top of the concrete cubes using an Etatron D.S. peristaltic pump dosing at 200 mL/min. Once discharged, the AMD trickled through the concrete’s porous network under gravity. The contact time was measured using a stopwatch with the timer started when the AMD fluid initially made contact with the concrete block and stopped when the fluid exited at the bottom of the block. Three timer readings were captured and the average calculated. The average contact time measured at column height 150, 300 and 450 mm was 7, 19 and 28 s, respectively. The corresponding flow velocities for the system were 1.3, 0.9 and 1 m/min. Figure 3 shows the experimental set-up for the 450 mm height gravitational flow configuration.

2.4. Chemical Analysis Methods

The raw AMD and samples of the treated AMD were analysed for the following key determinands: Calcium (Ca), Sodium (Na), Iron (Fe), Manganese (Mn), Magnesium (Mg), Aluminium (Al), Potassium (K), pH, Total Suspended Solids (TSS) and Sulphate (SO4). The chemical analyses were conducted by South African commercial laboratories accredited by the South African National Accreditation System (SANAS).

2.4.1. Dissolved Metals

Concentrations of the dissolved metals were determined using the Varian 700-ES Inductive Coupled Plasma Atomic Emission Spectroscopy (ICP-OES) instrument. The samples were prepared by filtering through a 0.45 µm cellulose nitrate filter paper and acidified with nitric acid. The concentration of Fe2+ was determined colourmetrically for the raw AMD using the Ferrous 1–10 Phenanthroline method, Hach method 8146.

2.4.2. Sulphate

The SO4 concentrations were determined using a Thermo Scientific Aquakem 200 selective photometric analyser. The samples were diluted followed by precipitation of the sulphate ion using a strong acid medium with barium chloride. The resulting turbidity was measured photometrically at 405 nm against calibration standard solutions.

2.4.3. pH

The pH values were measured using a Thermo Scientific Orion 5-Star plus portable multimeter with two-point calibration conducted on the meter before pH testing.

2.4.4. Total Suspended Solids

The TSS was determined by agitating the sample and filtering it through 2 µm filter paper with the residue retained dried at 105 °C ± 2 °C using an EcoTherm Drying Oven. The weight of the dried solids was measured to determine the TSS. The TSS method is as per Standard Method 2540 B.

2.4.5. Statistical Methods

Statistical significance testing was conducted to test the relationship between the treated AMD properties and the change in contact time for the column flow experiments. Testing was performed using Pearson’s correlation method. The statistical analysis was conducted with the IBM SPSS 25 software package and the Pearson’s correlation was conducted using two-tailed significance testing. Statistical significance was accepted at a 95% degree of confidence.

3. Results and Discussions

3.1. Column Flow Experimental Results

The chemical analysis results from the samples collected during the conduct of the column experiments are graphically illustrated in Figure 4 and Figure 5. The contact time of 0 min on the graphs represent the composition of the raw AMD.

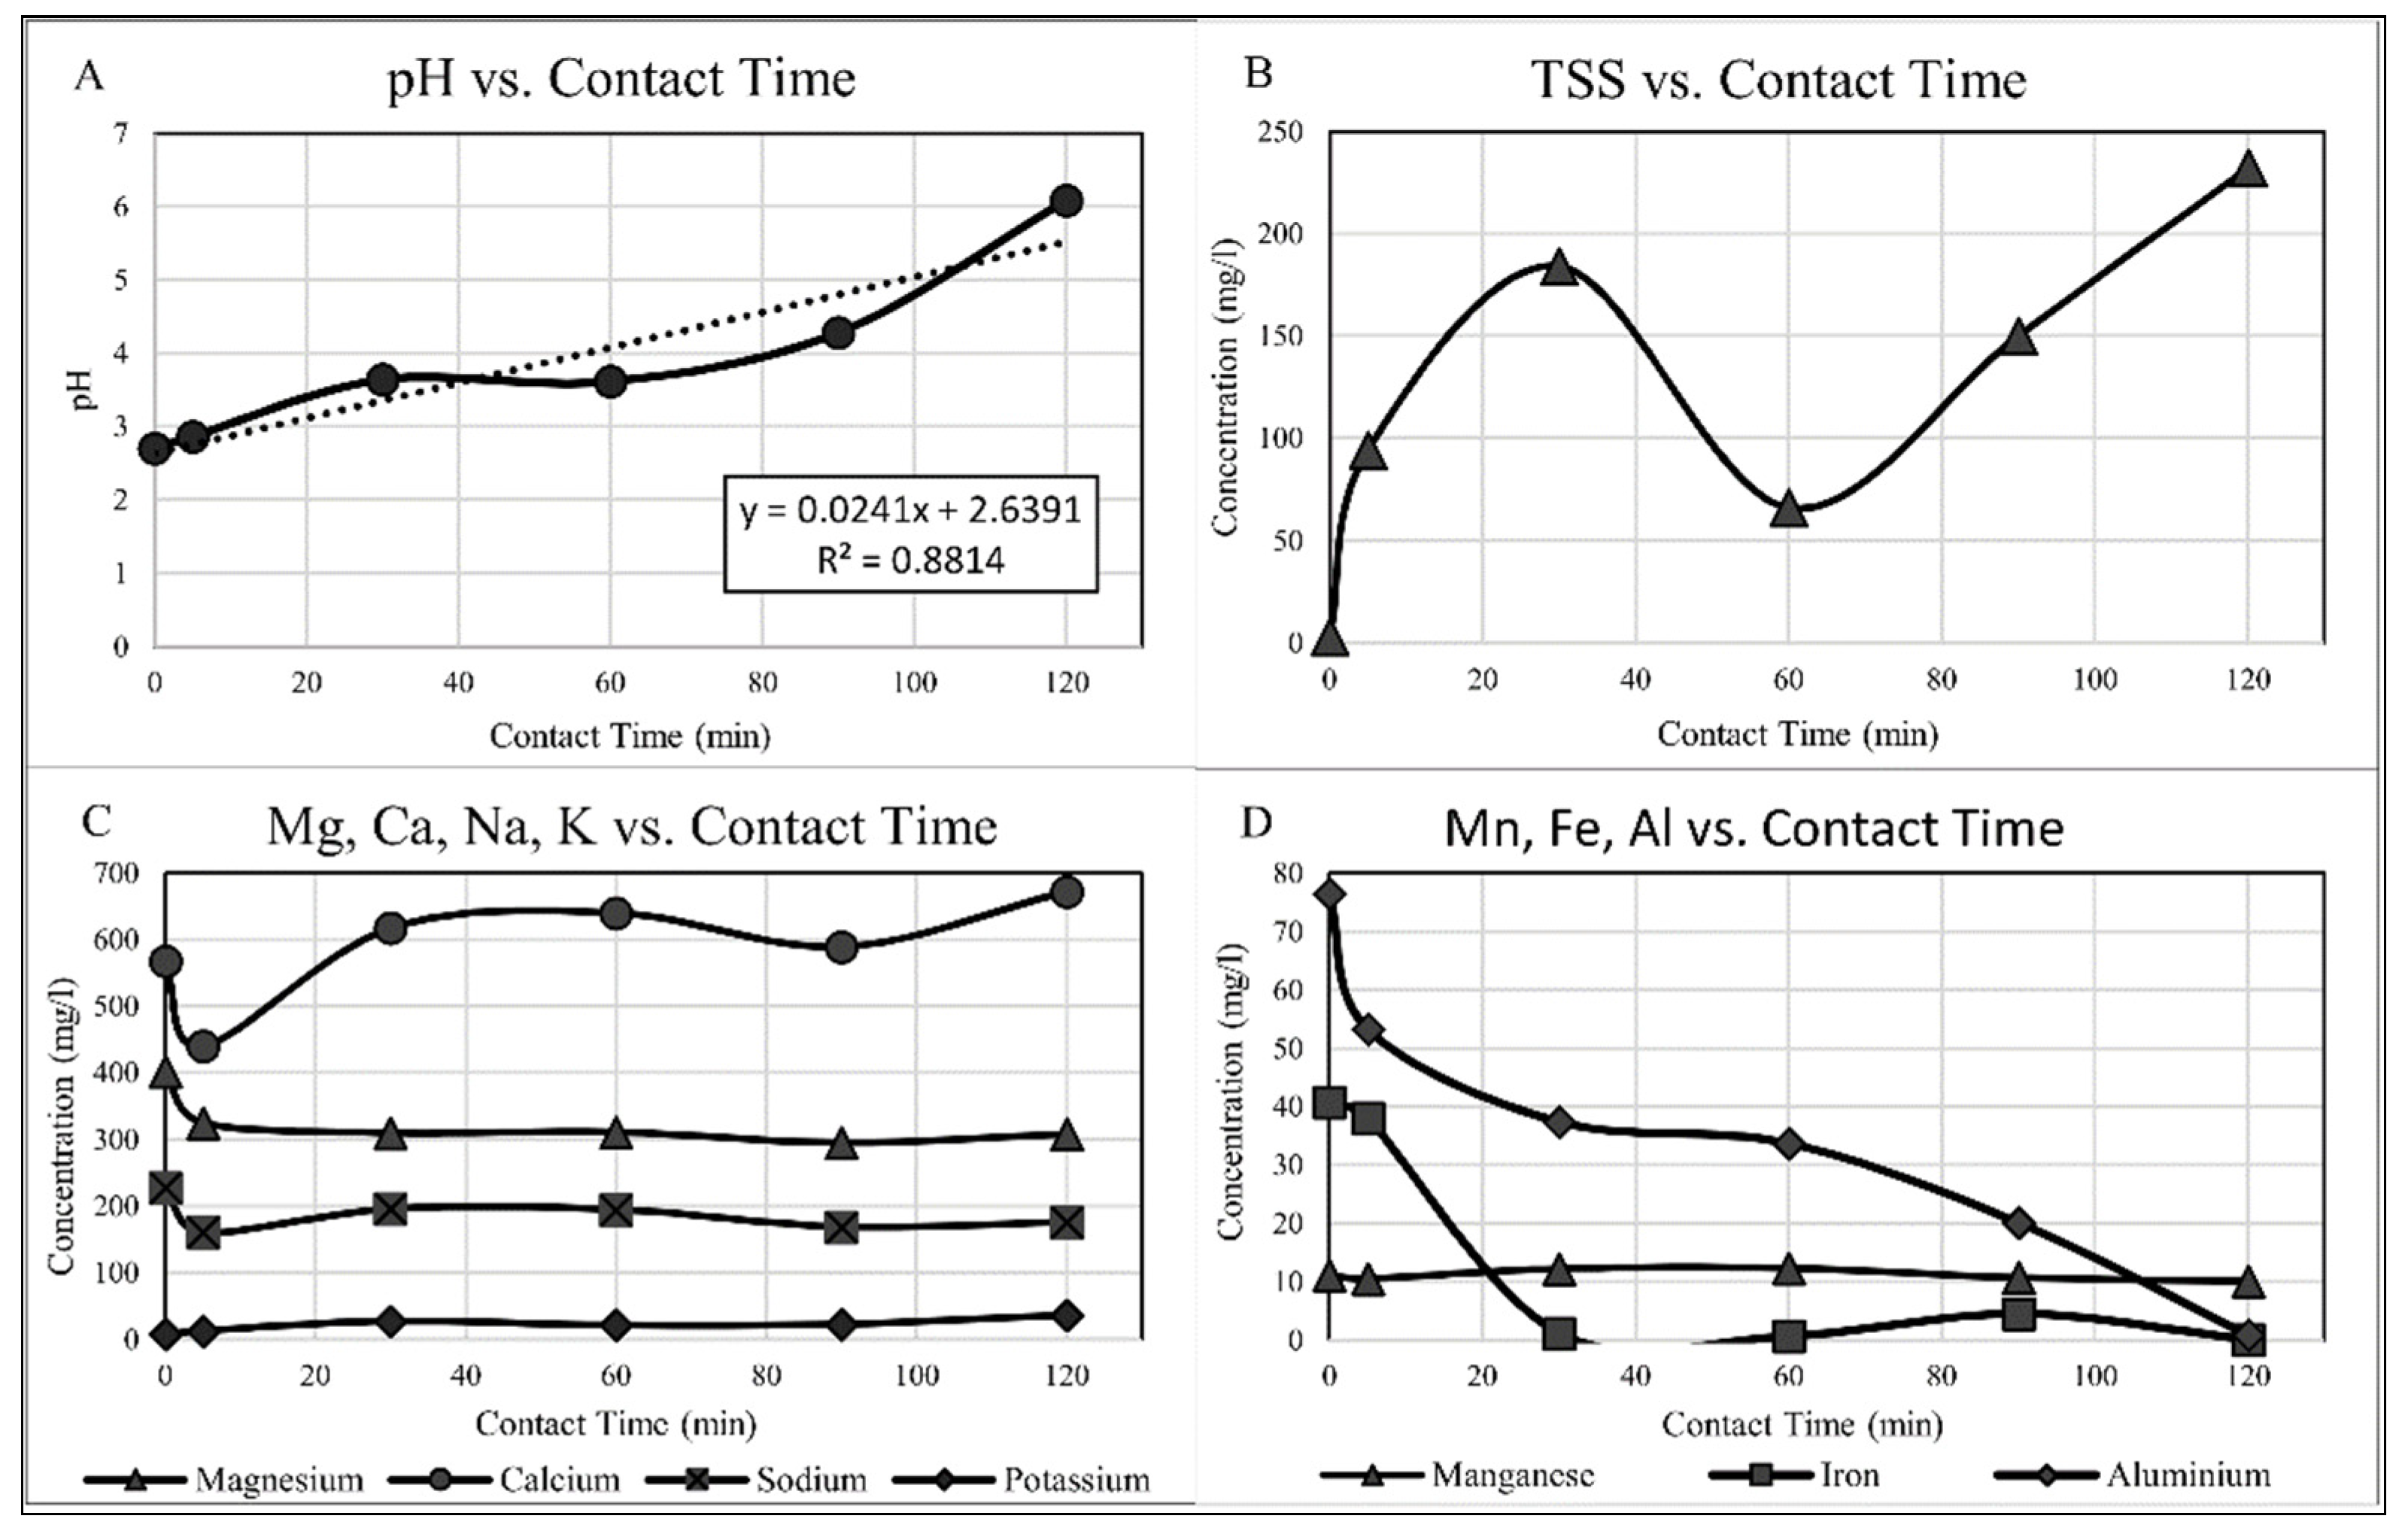
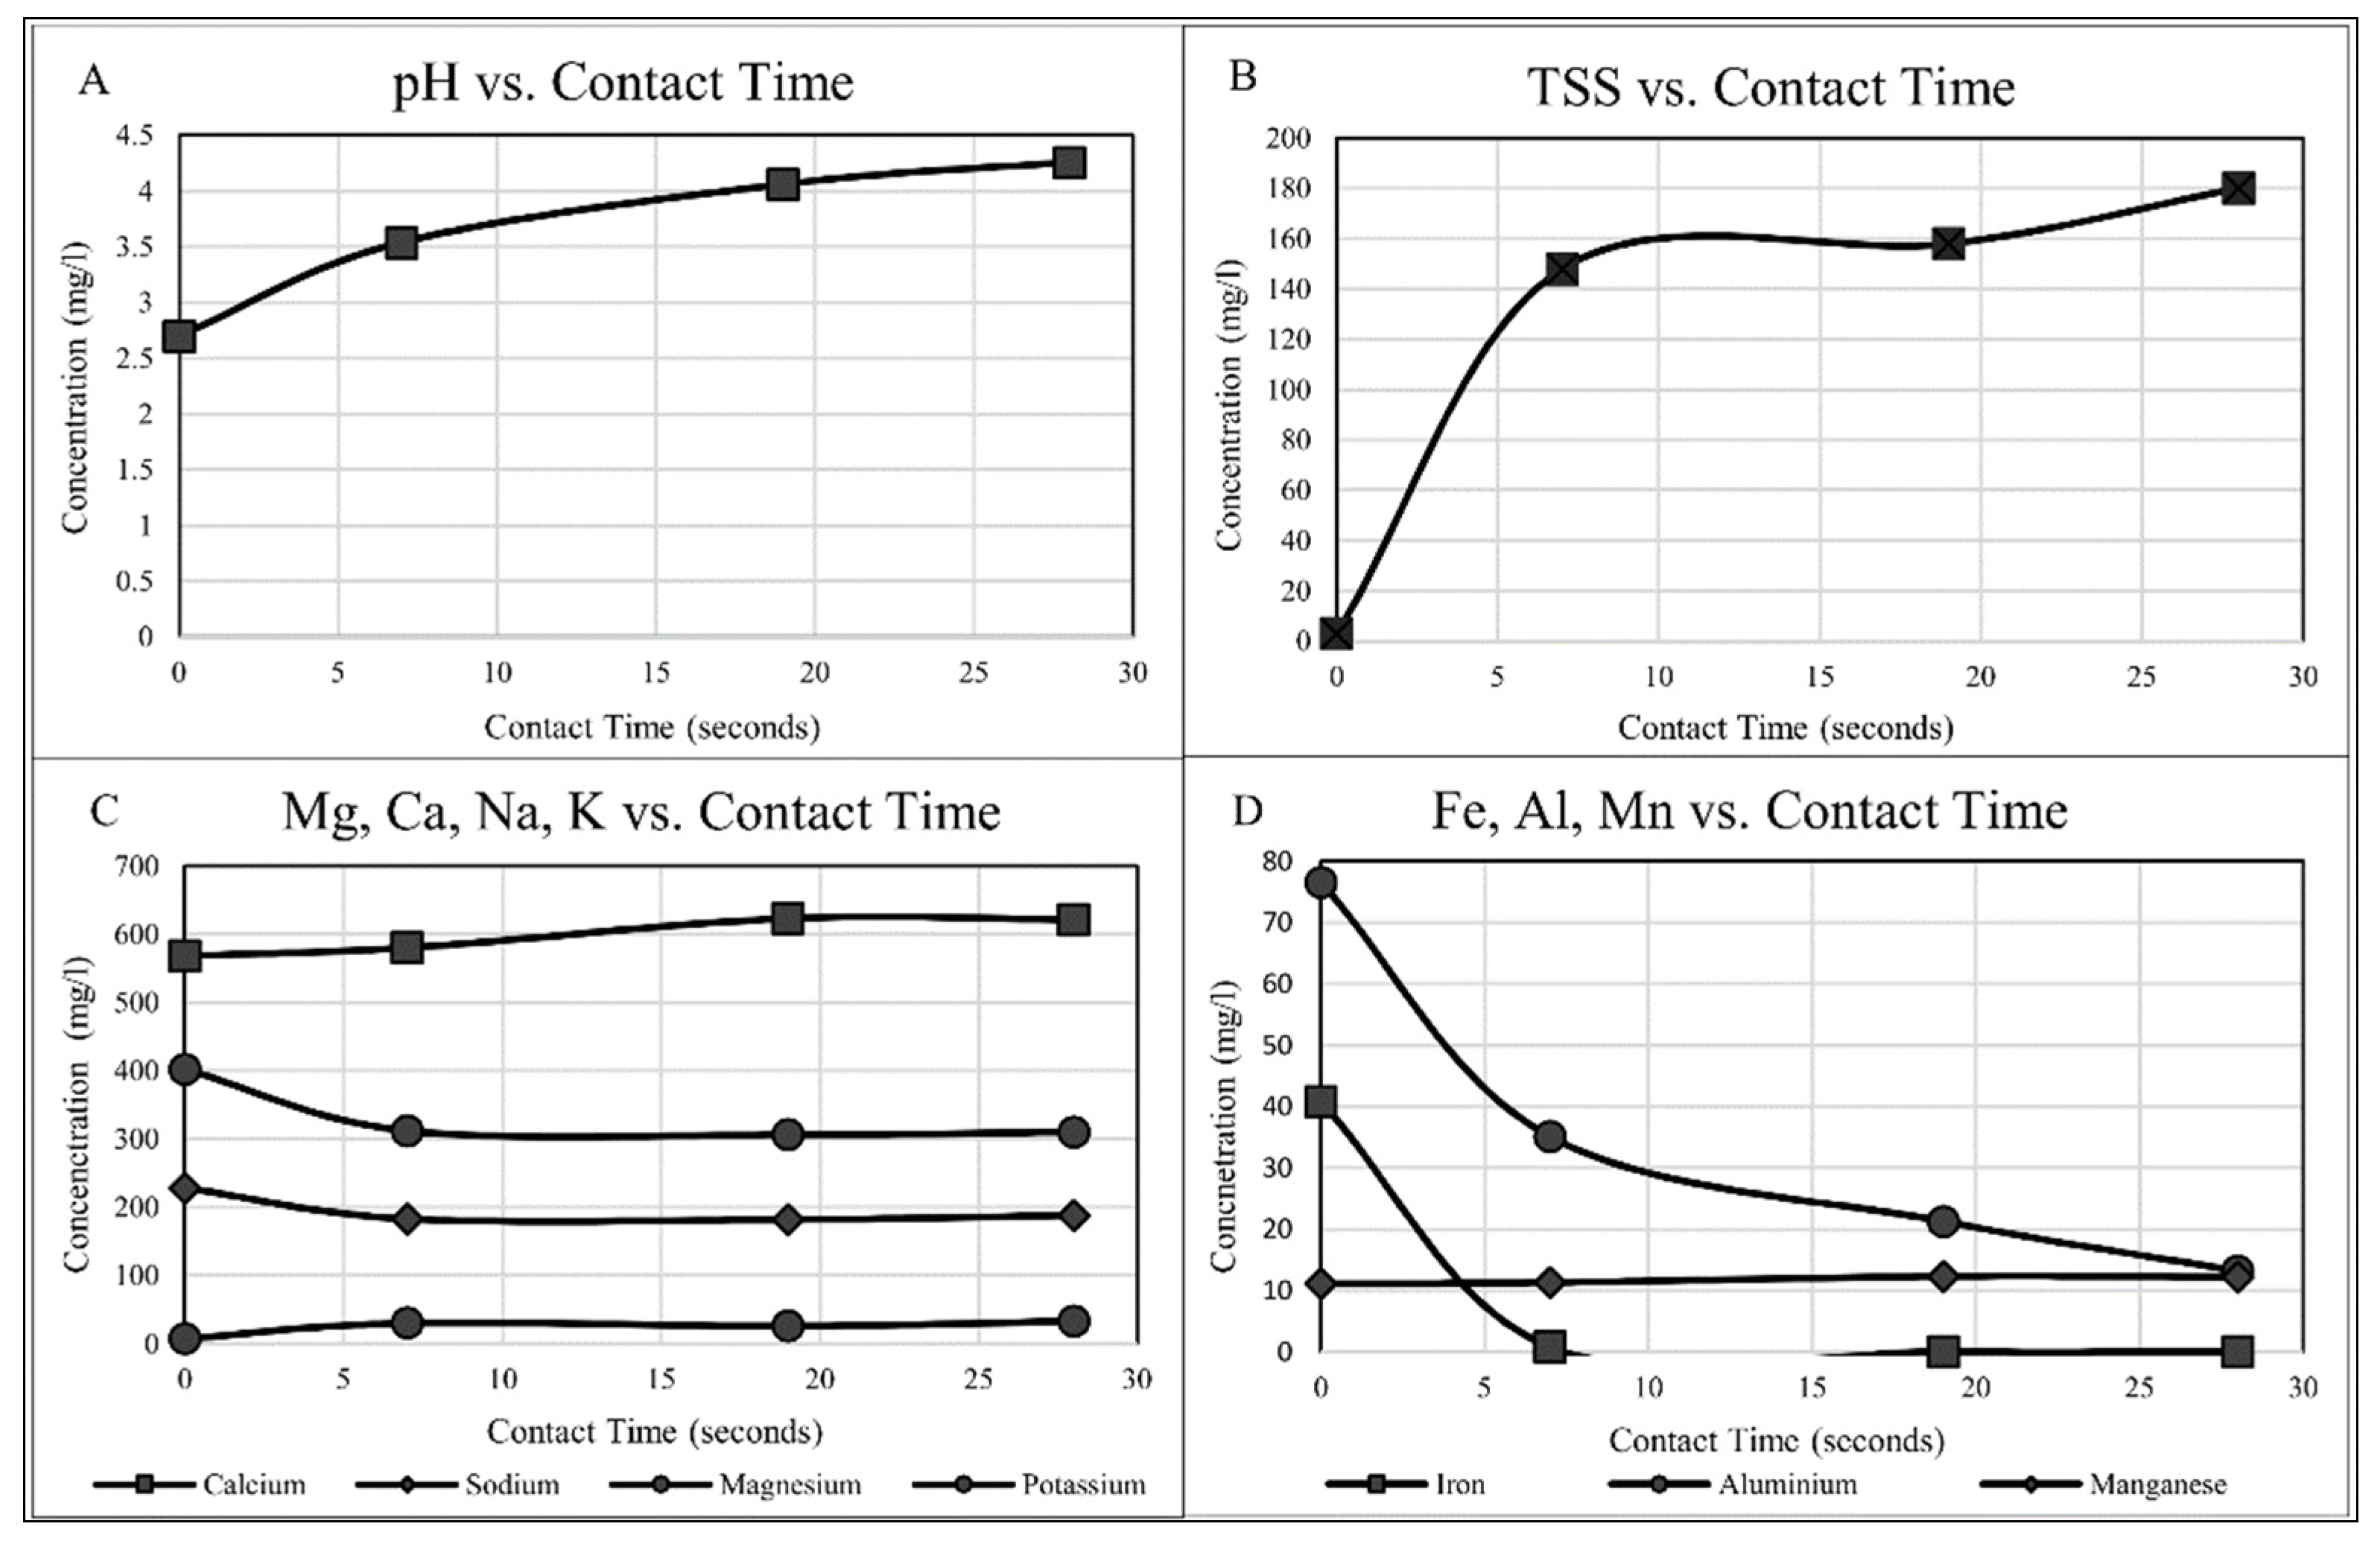
3.1.1. pH Correction

The pH vs contact time graph in Figure 4A shows that pH increases proportionally with an increase in contact time and a peak pH of 6.08 was achieved at the highest contact time of 120 min. The relationship between contact time and pH was found to be statistically significantly with a two-tailed significance value (p value) of 0.026 (p < 0.05) and Pearson correlation coefficient (r value) of 0.992. The coefficient of determination (R2) was high at 0.8814 as a result of the close fit of the data points to the regression line and the linear regression equation is shown in Figure 4A. The relationship between pH and contact time is attributed to longer contact times leading to greater leaching of Ca(OH)2 and other alkaline compounds from the concrete resulting in higher dissolved alkalinity and increased pH [17,22,25,26]. As a result of the leaching of alkaline compounds, the experimental findings show an increase in the concentrations of dissolved Ca and K at the longer contact times. The increase in the concentration of K may be associated with the leaching of K2O present in the fly ash admixture and the Portland cement and may also play a role in increasing the basicity of the solution. The leaching of Ca(OH)2, K2O and other elements from concrete is documented in literature [27,28,29].

3.1.2. Aluminium

The solubility of metals in water is highly dependent on pH with most metals having low solubility at pH values between 5 and 10 [30]. The dissolved concentration of Al reduced proportionally in response to increasing contact time as a result of the increasing pH (refer to Figure 4D). The dissolved Al concentration was reduced from an initial concentration of 76.59 mg/L to the lowest concentration of 0.85 mg/L at the 120 min contact time with a pH of 6.08. The lowest Al concentration achieved equates to a 98.9% removal rate. The Al removal achieved at each contact time directly corresponds to the solubility of aluminium hydroxide at the respective pH values [30,31]. The decrease in the Al concentration may primarily be attributed to the increase in pH resulting in aluminium hydroxide precipitation.

3.1.3. Iron

The dissolved concentration of total Fe was reduced from an initial concentration of 43.6 mg/L to below 1 mg/L at the 30 min contact time which equates to a 97.5% removal efficiency. The lowest measured dissolved concentration of total Fe was 0.1 mg/L, equating to a 99.75% removal efficiency and was achieved at the 120 min contact time (refer to Figure 4D). Iron as Fe2+ is soluble under reducing conditions at pH values of up to 8 while in the Fe3+ oxidation state, iron remains soluble at pH values below 3 [32]. The high iron removal rate achieved in this study from the 30 min contact time with a pH of 3.61 corresponds with the solubility of Fe3+ at the respective pH [30,31], suggesting that the remediation mechanisms involved oxidation of Fe2+ to Fe3+ and precipitation as insoluble ferric compounds. Similar results of oxidative precipitation were obtained by Galob et al. (2009), where total Fe concentrations were reduced to below 1 mg/L at pH values below 6 using concrete as a PRB. The removal of total Fe may be associated with the precipitation of Fe(OH)3, as proposed by similar findings [26].

3.1.4. Magnesium and Manganese

The concentration of Magnesium (Mg) was reduced from 402 mg/L to 325 mg/L, equating to a 19.2% removal efficiency at the 5 min contact time. The removal rate remained relatively steady throughout the various contact times with the lowest concentration of 295 mg/L achieved at 90 min as shown in Figure 4C. The decrease in Mg concentration may be attributed to ion exchange with Ca, which is abundant in the pervious concrete. For Manganese (Mn), the raw concentration remained virtually the same throughout the experiment as shown in Figure 4D. Both Mg and Mn are known to precipitate at high pH, typically a pH range of 9 to 10, respectively [30]. At the tested limits, the PRB treatment did not achieve the required pH to effectively precipitate these metals. Based on the determined correlational relationship between contact time and pH as well as pH values achieved in recent studies on AMD remediation using concrete [17,18,22,26], it is anticipated that with prolonged retention time, the required pH of 11 can be achieved to effectively reduce the concentration of Mn.

3.1.5. Sodium and Potassium
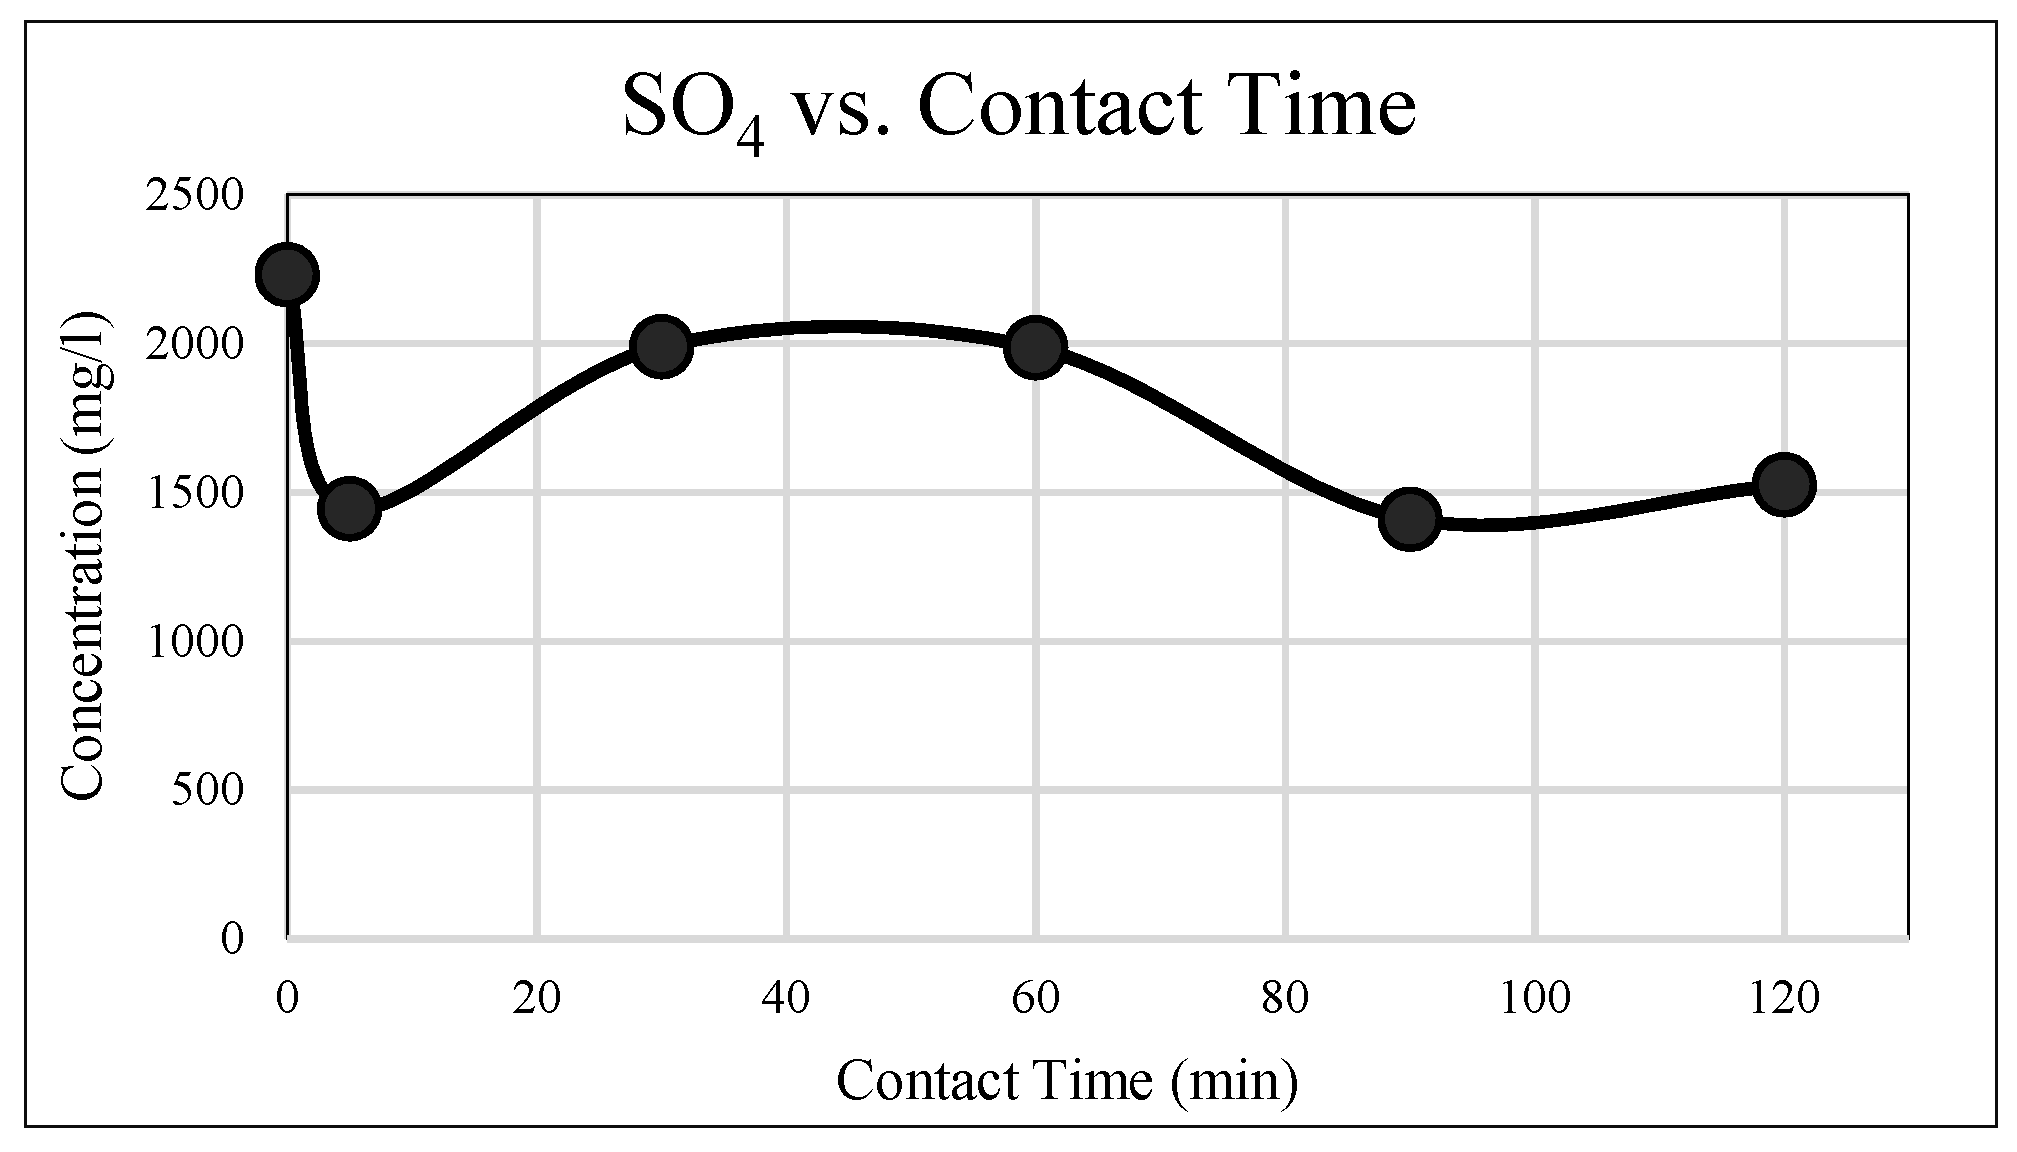
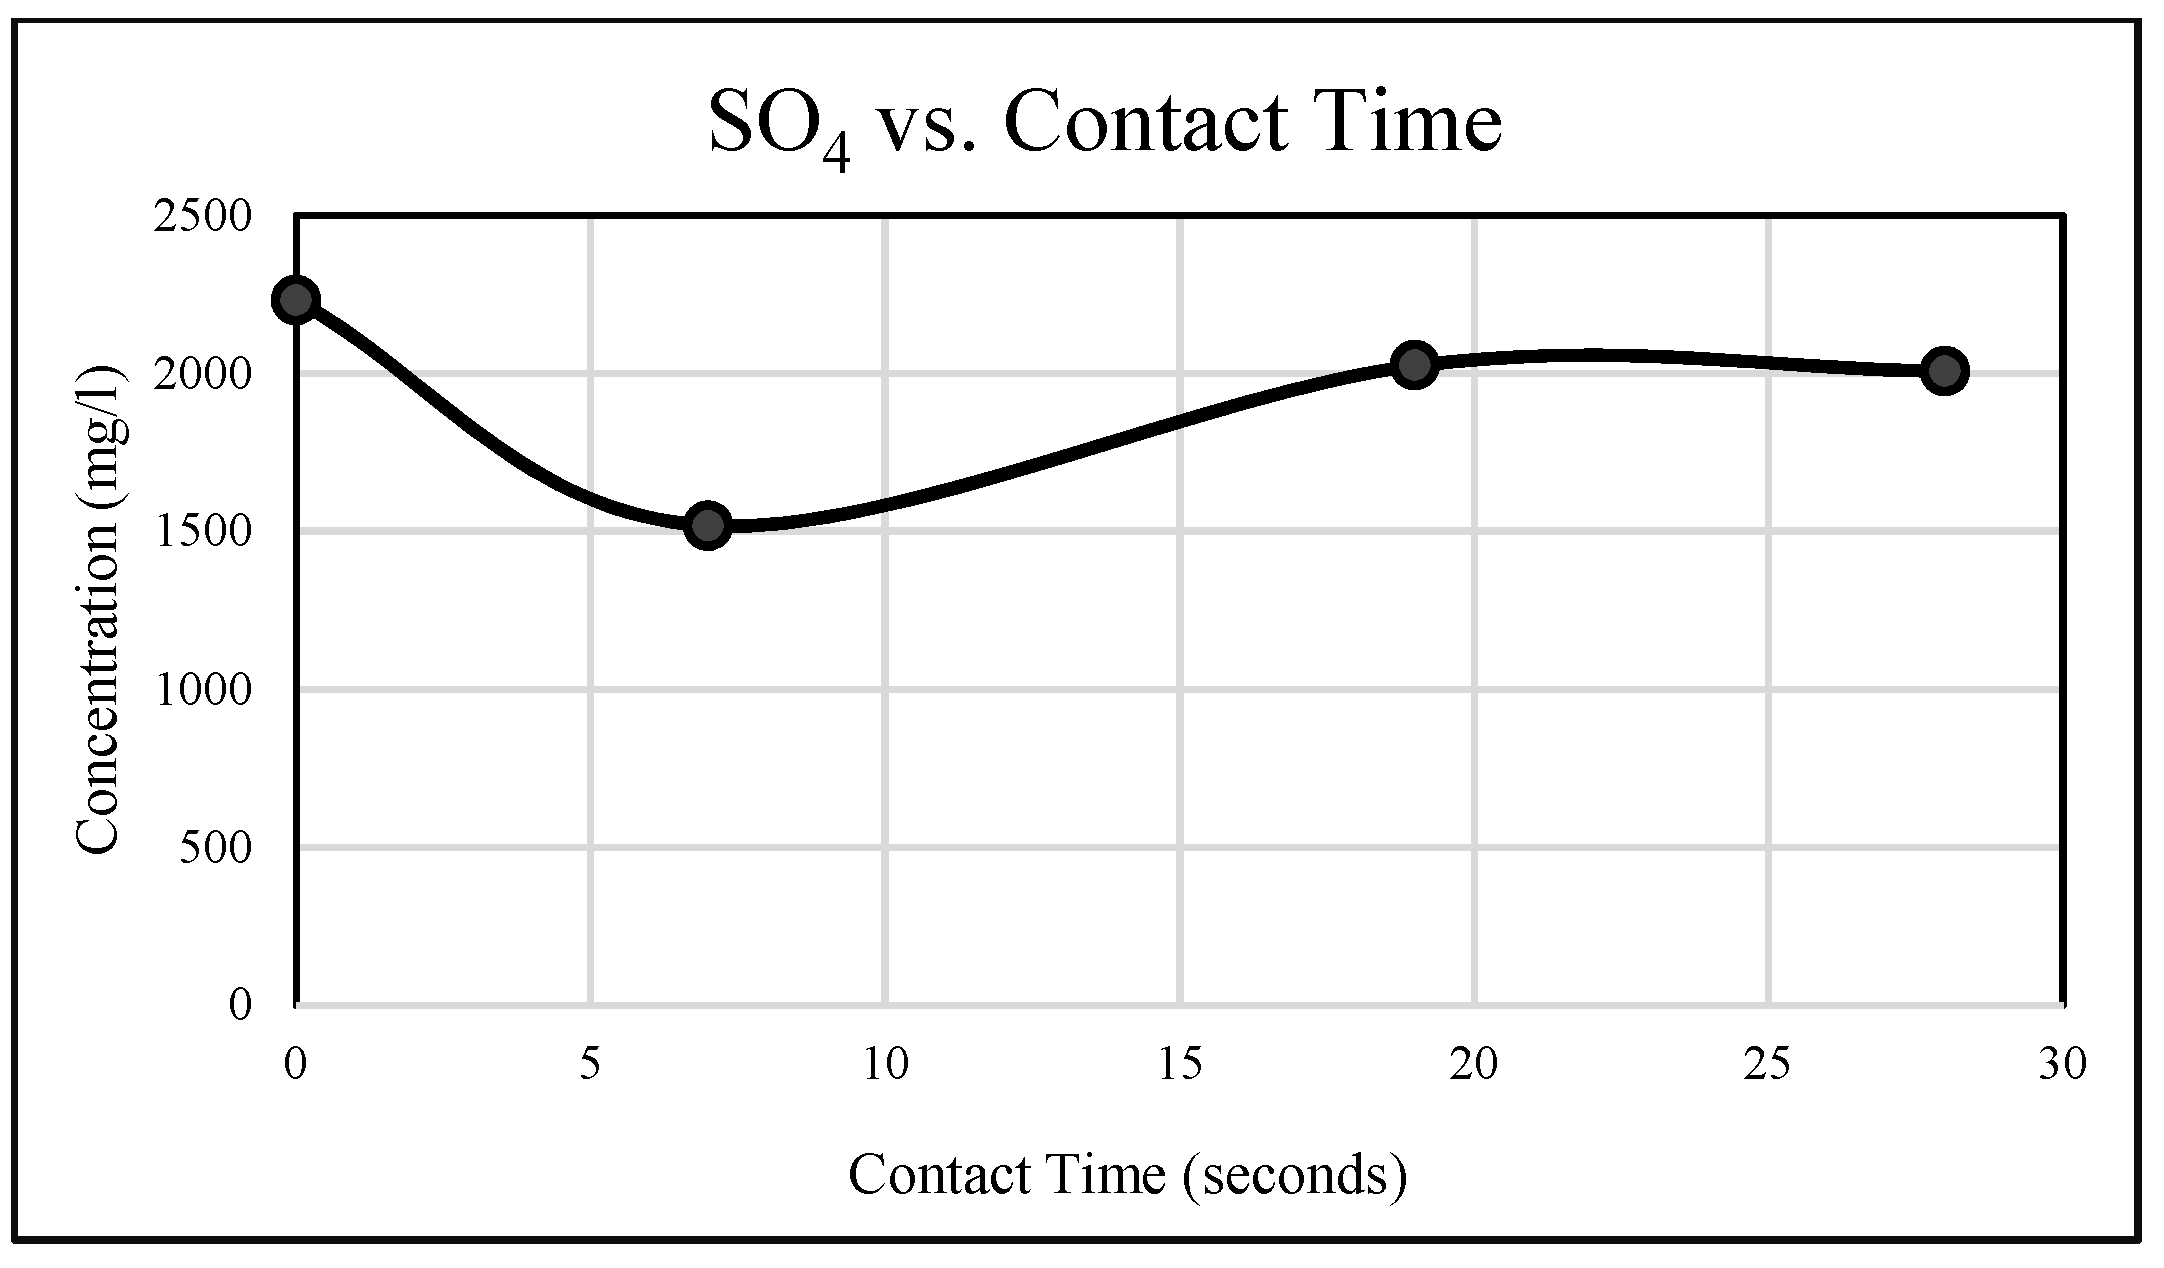
The results for Na show a low removal rate with an average of 21% concentration removal across the five contact times as shown in Figure 4C. Similarly to Mg, the removal of Na may be attributed to ion exchange with Ca. The results for K, the other alkali metal examined in this experiment, show an increase in the concentration at longer contact times and reach a threefold concentration increase at the 120 min contact time (refer to Figure 4C). Similar results for the alkali metals were obtained in literature [17]. The limited effectiveness of pervious concrete to reduce the concentrations of alkali metals can be attributed to the high solubility of alkali hydroxides in water. Furthermore, Na and K concentrations can be increased through the leaching of Na2O3 and K2O present in the fly ash admixture and the Portland cement.

3.1.6. Sulphate

The results for SO4 at the tested contact times are shown in Figure 5. A high degree of variation in the SO4 removal was experienced. The mean percentage removal across the five contact times was 25%. The removal of SO4 from AMD when using pervious concrete PRBs has mainly been attributed to the dissolution of Ca from the concrete and the formation of the gypsum precipitates [17,33]. Unlike metal precipitation, the removal of SO4 is not pH dependent; instead, compounds such as gypsum tend to crystallise at concentrations above their solubility limit [34].

3.1.7. Total Suspended Solids

The TSS concentrations tend to increase with an increase in contact time with a degree of fluctuation as shown in Figure 4B. This is expected as the highest removal rates occurred at the longest contact times and the precipitated contaminants can be carried over into the treated water, forming TSS. This finding importantly illustrates that pervious concrete is capable of reacting with AMD, resulting in the precipitation of contaminants, but is unable to completely entrap the suspended precipitants in the porous network and thus, an additional process step would be required to either settle or filter the particles before disposal or further treatment. On examination of the concrete cubes after experimentation, a uniform metal precipitant coating was observed at the bottom of the concrete block where the fluid initially makes contact with the cubes. This surface of the concrete is also where the settleable precipitants would settle. Figure 6 shows an image of the bottom of a concrete cube after column experimentation.

3.2. Gravity Flow Experimental Results

The chemical analysis results from the samples collected during the conduct of the gravity flow experiments are graphically illustrated in Figure 7 and Figure 8. The contact time of 0 s on the graphs represents the composition of the raw AMD.

3.2.1. pH Correction

The pH vs. contact time graph in Figure 7A shows that pH increases proportionally in response to increasing contact time. A peak pH of 4.26 was achieved at a liquid-concrete contact time of 28 s. The pH values achieved in the 7 and 28 s contact time under the gravity flow configuration were only achieved in the 30th and 90th minute contact times under the column flow configuration, respectively. This finding can be interpreted as pH correction under the gravity flow configuration being two orders of magnitude more efficient than the column configuration at the tested limits. It is hypothesised that the sprayed discharge of the AMD at the top of the concrete column and the trickling of AMD through the porous surface allows for aeration of the AMD, resulting in CO2 degassing and accelerated pH correction [35,36]. Figure 10 shows the sprayed discharge of the AMD at the top of concrete column. Similarly to the column flow configuration, the gravity experiment shows an increase in Ca and K concentration as a result of mineral leaching from the concrete (refer to Figure 7C). The findings suggest that the mechanisms involved in pH correction under the gravity configuration include the leaching of Ca(OH)2 and other basic compounds from the concrete and aeration through the sprayed discharge of the AMD.

3.2.2. Aluminium

The dissolved concentration of Al reduced proportionally in response to increasing contact time, as shown in Figure 7D. Like the column flow experiment, the removal of Al for each pH value achieved corresponds with the theoretical solubility of aluminium hydroxide at the given pH [30,31]. The lowest concentration of Al was 13.2 mg/L, achieved at a contact time of 28 s and equating to a removal rate of 82.7%. A comparable result of 20.8 mg/L was obtained at the 90 min contact time under the column flow experiment, where both configurations achieved similar pH values. The removal of Al concentration under the gravity configuration may primarily be attributed to the increase in pH resulting in precipitation as aluminium hydroxide. It can be expected that further increase to the concrete height resulting in longer liquid-concrete contact time and higher pH will lead to a greater degree of Al precipitation as experienced in the column experiment.

3.2.3. Iron

The dissolved concentration of total Fe was reduced from an initial concentration of 43.6 mg/L to below 1 mg/L in the 7 s contact time with pH of 3.51, as shown in Figure 7D. In contrast, this degree of total Fe removal under the column configuration was achieved at the 30 min contact time. The Fe concentrations at the 19 and 28 s contact time were below 0.1 mg/L, equating to a removal rate exceeding 99%. Like in the column configuration, a high degree of total Fe precipitation was achieved at the low pH values corresponding with the solubility of Fe3+ [30,31], suggesting that the mechanisms involved in total Fe precipitation comprises the oxidation of Fe2+ to Fe3+.

3.2.4. Magnesium and Manganese

The concentration of Magnesium (Mg) was reduced from 402 mg/L to 312 mg/L, equating to a 22.4% concentration removal in the 7 s contact time, and the removal rate remained steady throughout the various concrete heights, as shown in Figure 7C. The results for Mg removal under the gravity configuration are a near replica to those attained in the column configuration. As with the column flow experiment, the raw concentration of Manganese (Mn) remained virtually the same throughout the experiment. As mentioned before, Mn and Mg precipitate at pH values greater than 9 and 11, respectively, and thus, the removal rates of both metals are ineffective [30]. pH values of 11 have been achieved in previous studies under the column flow configuration [17,18,22,26]. With a sufficient increase in PRB height, achieving pH values as high as 11 for the precipitation of Mn and Mg may be possible under the gravity flow configuration. The same remediation mechanism involved in the column configuration can be attributed to the remediation of Mg under the gravity configuration.

3.2.5. Sodium and Potassium

The results for Na show a low removal rate with an average of 20% concentration removal across the three contact times. The concentration of K increased by four times the raw concentration at the 7 s contact time and remained relatively steady throughout the experiment. The findings for the alkali metals for the gravity experiments are similar to those obtained in the column experiments. The mechanisms involved in the change in concentrations for the alkali metals under the gravity experiments are as discussed in the column experiment results.

3.2.6. Sulphate

The gravity experiment results for SO4 are shown in Figure 8. The mean percentage removal across the three concrete was 17% and was relatively steady. The column experiment results yielded marginally improved SO4 removal over the gravity configuration, which can be attributed to the longer contact times, allowing for a greater degree of gypsum formation and precipitation. This hypothesis is supported by the higher concentration of dissolved calcium measured in the longer retention times of the column experiment in comparison to those achieved in the gravity experiment.

3.2.7. Total Suspended Solids and Clogging

The TSS concentrations under the gravity flow tend to increase with an increase in the contact time due to the higher degree of contaminant precipitation with increased surface area, as shown in Figure 7B. Figure 9A shows the Total Removed Solids (TRS) concentration vs. pH for the column and gravity flow configuration. TRS is the summed concentration of the removed elements and was calculated using Equation (1). Figure 9B shows the Total Suspended Solids (TSS) concentration vs. pH for the column and gravity flow configuration.
T R S = ( + Δ S O 4 ) + ( + Δ F e ) + ( + Δ A l ) + ( + Δ M n ) + ( + Δ M g ) + ( + Δ N a ) + ( + Δ C a ) + ( + Δ K )
where Δelement is the initial element concentration minus final element concentration. Only positive values (removal in concentration) are used in the equation (mg/L).
The pH range between 3.5 and 4.5 has three data points for each configuration. When comparing the results within this range, the average TRS of 659 mg/L under the column flow configuration is greater than the average TRS of 612 mg/L under the gravity flow (refer to Figure 9A). This result shows that within the same pH range, the column study achieved a higher degree of contaminant removal. However, the TSS results were inversed, with a higher degree of suspended solids found in the treated AMD of the gravity flow configuration (refer to Figure 9B). The TSS as a percentage of the TRS was found to be 18% for the column flow configuration and 26.5% for the gravity flow configuration. This finding shows that up to 8% more suspended solids are allowed to overflow under the gravity flow configuration, leading to fewer solids being captured in the porous network of the pervious concrete.
From examination of the concrete cubes after experimentation, localised metal precipitation was observed in the flow path of the liquid under gravity flow. Figure 10 shows an image of the top of a concrete cube captured during gravity experimentation. This observation shows that gravity flow configurations are more prone to localised clogging.

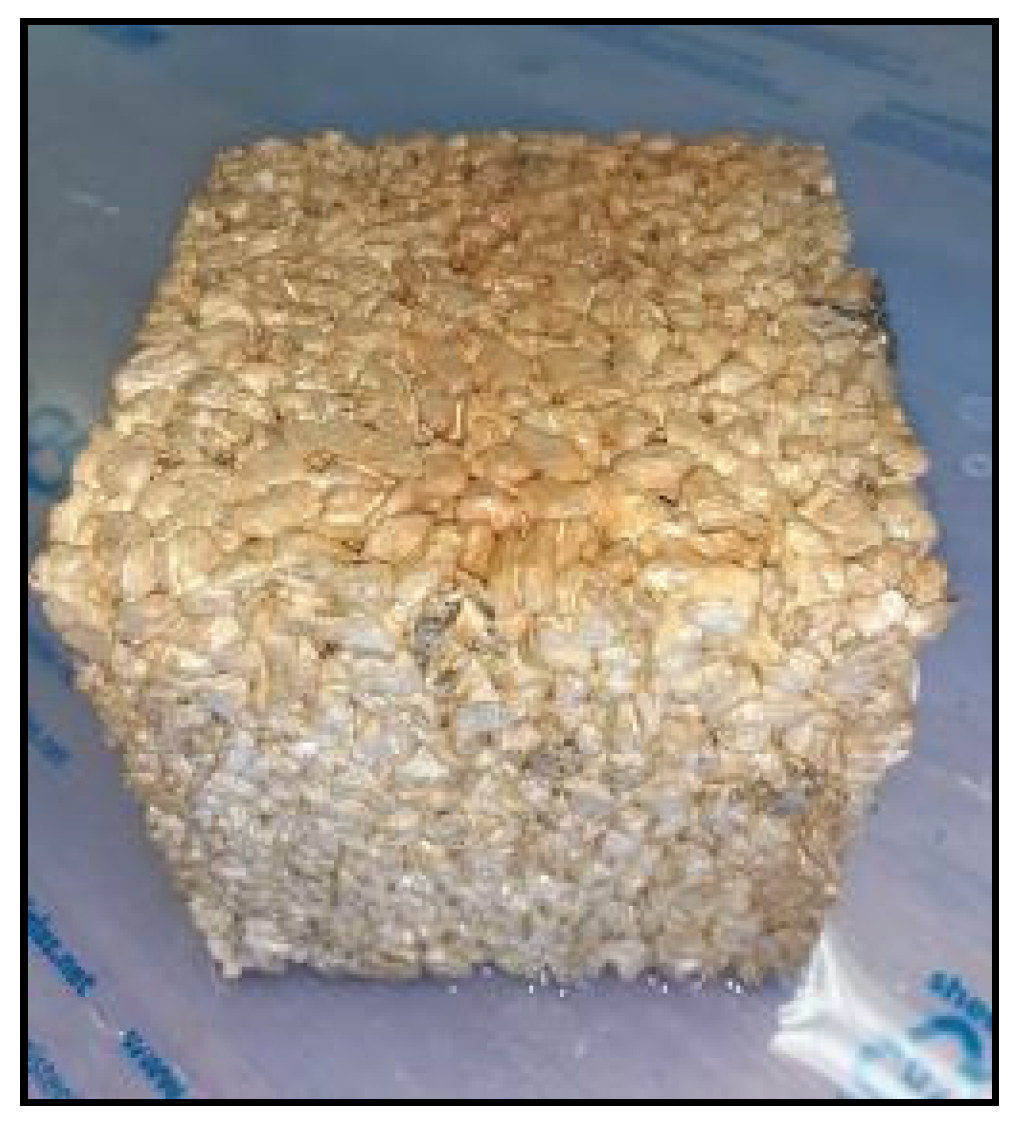
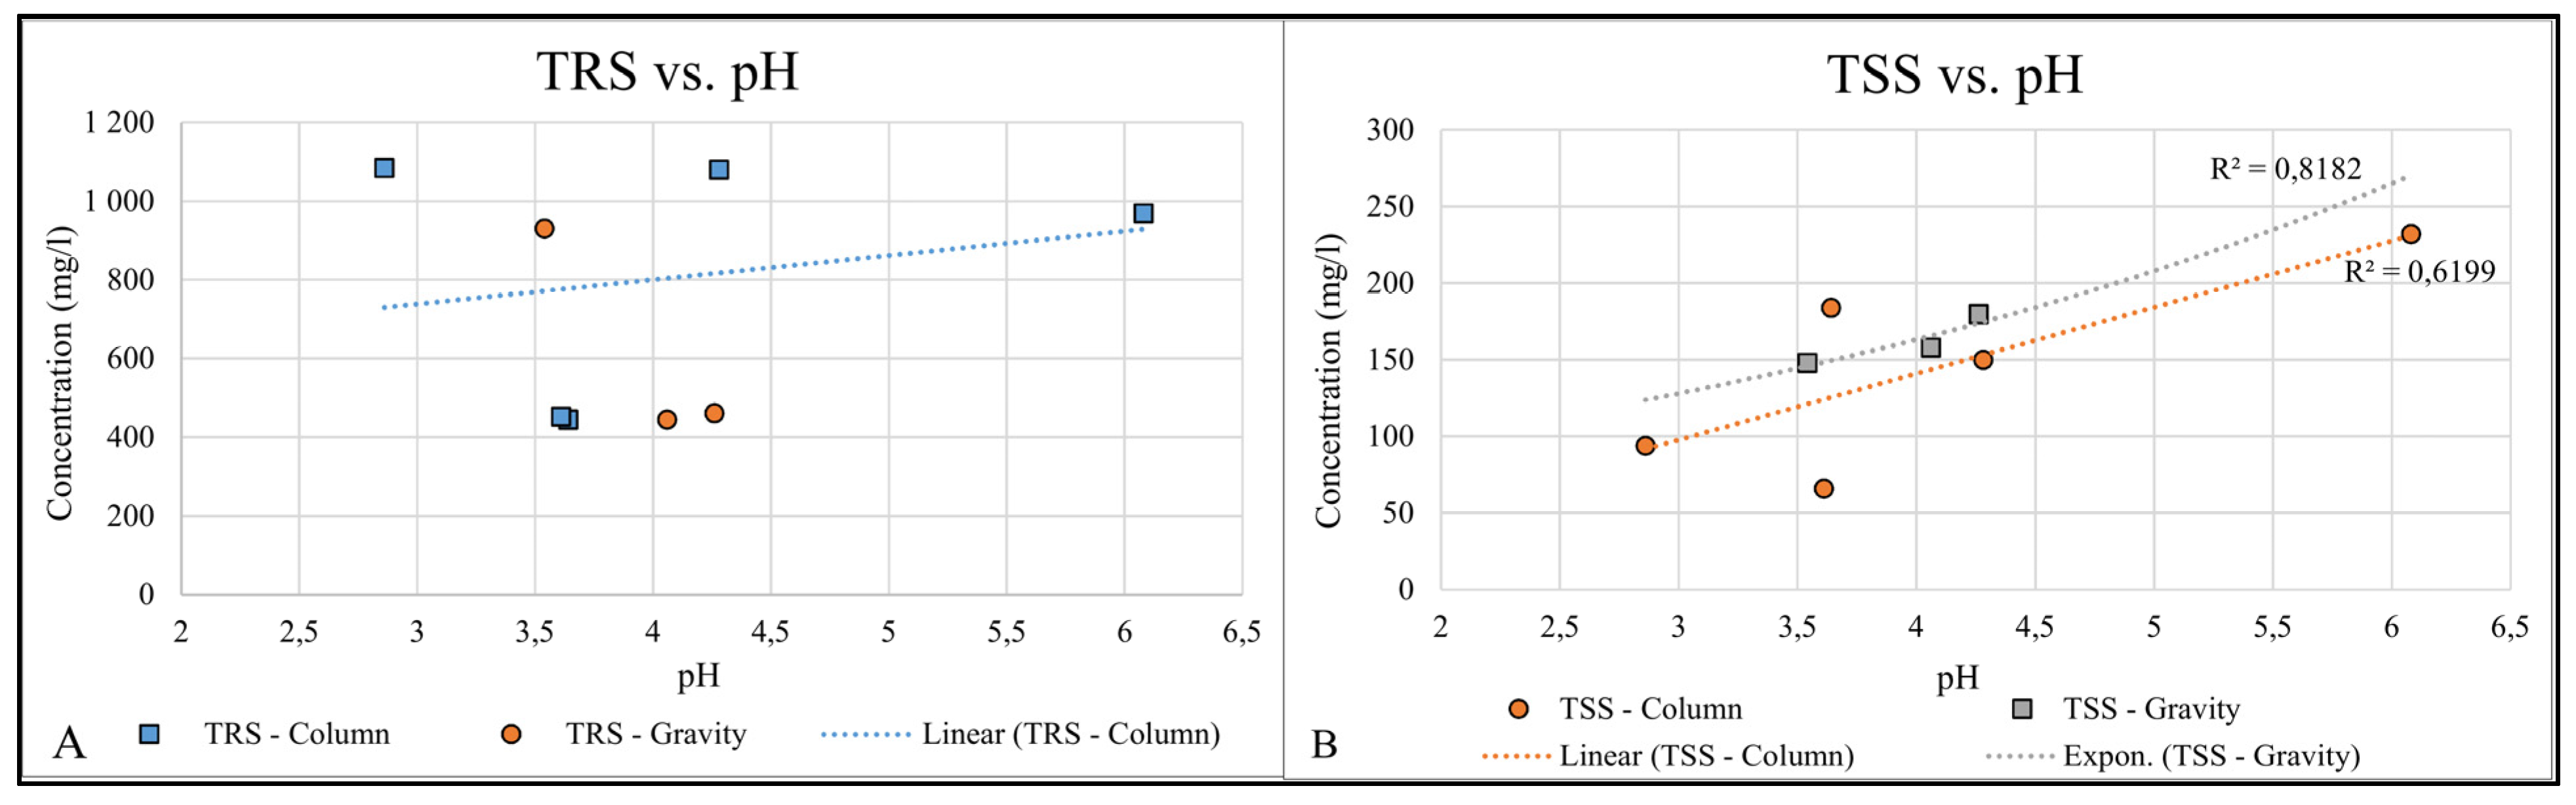
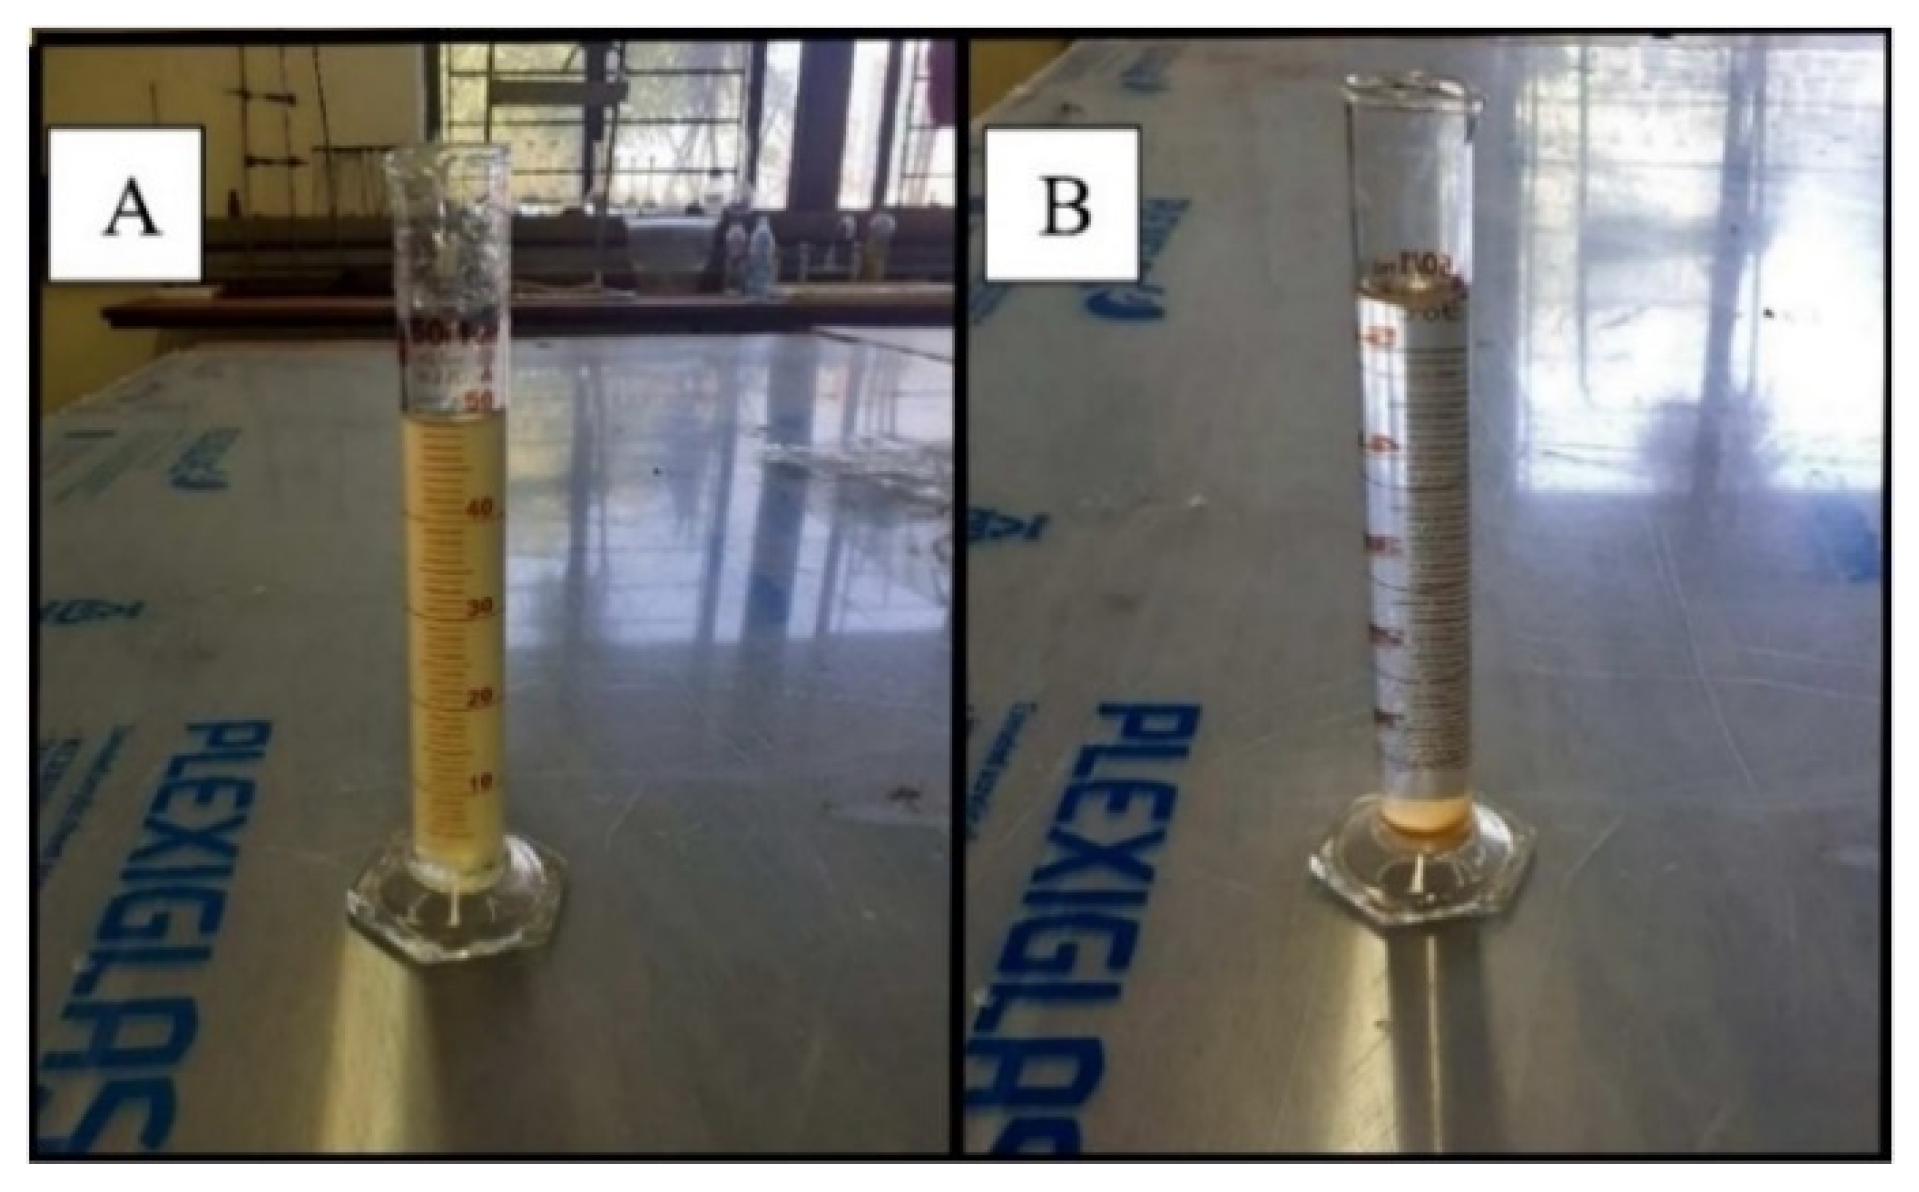
3.3. Suspended Solids Settleability

The treated AMD under both experiments was tested for settleability. Samples were collected in 50 mL glass beakers of 120 mm height and the solids were allowed to completely settle. The average settling time for all the samples was two hours, equating to a settling velocity of 0.67 mm/s. Figure 11A shows the highly turbid treated AMD before settling and Figure 11B shows the clarified treated AMD after the 2 h settling time. It can be seen that the suspended solids formed after PRB remediation are highly settleable without flocculation.

4. Implications

Research on pervious concrete and other PRBs for AMD remediation has primarily been focused on material composition and PRB design [15,16,17,18,19,20,22,26,37,38]. The influence of design factors such as flow configuration on the AMD remediation capabilities and the lifecycle cost of PRBs is largely not understood. This study was undertaken to test the influence of flow configuration and contact time and thereby contribute towards the engineering development of efficient PRB systems for AMD remediation.
This study’s results show that flow configuration has a significant influence on AMD remediation efficiency when using pozzolanic pervious concrete. Experiments conducted in this study found that gravity flow configurations achieved equivalent treated AMD quality to the column flow configuration with two orders of magnitude less liquid-concrete contact time. This finding can have a significant impact on implementation costs. Installation costs are the greatest cost driver for PRBs and it has been estimated that the trenching for in situ PRBs accounts for 70% of the total capital investment cost while the reactive material makes up 10–15% of the total cost [15,39]. The gravity flow configuration at a 450 mm barrier height with 1 m/min flow velocity and the column flow configuration at 90 min HRT achieved very similar results. Table 3 presents the volumetric treatment rate of the flow configurations at these duty points where remediation results were most similar. Under unsaturated flow, the gravity configuration achieved a volumetric treatment rate five times higher than the column flow configuration. The finding suggests that significant capital investment cost savings could be gained through the design of pervious concrete PRBs under the gravity flow configuration as a result of the lower concrete volumes required per litre of AMD treated, leading to less reactive material usage and smaller trenching footprints. Gravity flow designs with uniform distribution of AMD across the surface area of the concrete can promote greater utilisation of the concrete’s reactive volume as a result of increased flow saturation, which may reduce the required concrete volume and further improve capital cost savings. One such design is discussed in the following section.
The study results further show that flow configuration has an influence on the degree of suspended solid carryover to the treated AMD. Under the column flow configuration, a greater degree of the precipitated solids was captured on the pervious concrete’s porous surface due to the solids settling inside the PRB in a direction opposing the flow and solids adhering to the concrete through adsorption mechanisms. Under the gravity flow configuration, 8% more suspended solids were carried over into the treated AMD stream due to the flow being in the same direction as the settling suspended solids, allowing sweeping of the solids. The described flow conditions are graphically illustrated in Figure 12. The reduced solid capturing under the gravity flow configuration is advantageous as slower build-up of solids in the flow path prolongs pore clogging and increases the productive lifespan of PRBs [40,41]. Therefore, the research findings indicate that PRBs under gravity flow configurations may have longer productive lifespans than PRBs under column flow. Further research into this finding is recommended to assess the solid retention rate over longer operational timespans.
The results achieved in this study as well as in literature [16,17,26] show that pervious concrete PRBs can be effective at raising pH and at removing contaminants from the AMD. Under both configurations, however, the removed contaminants formed suspended solids, some of which were carried over into the treated AMD. Should pervious concrete PRBs be implemented as an in situ remediation technique, some of the precipitated contaminants can be carried in suspension and still contaminate other water bodies, causing environmental damage. The study found that the suspended solids are highly settleable with settling velocity or 0.67 mm/s, allowing for a fully passive treatment process. The implementation of a sedimentation or filtration process is an essential secondary treatment process after PRB treatment for optimum remediation performance.
The presented study findings suggest that a suitably sized pervious concrete PRB under gravity flow configuration followed by a suitably sized sedimentation basin may provide the most optimal pervious concrete PRB process when optimising for remediation efficiency and capital costs. However, site-specific conditions such as aquafer depth and AMD flow rates may present challenges for a scalable design of the described process. One potential scalable design solution for gravity flow configurations which maximises flow saturation follows the principles of a rotary arm trickling filter where a manifold feeds a rotary distribution system which discharges AMD over the surface area of the pervious concrete medium. The design can operate passively using differential head between the dispersion level of the trickling filter and the static water level of the mine tailings. Figure 13 illustrates the described solution. Design constraints will need to be taken into account when further developing gravity flow solutions.

5. Conclusions

This study investigated the influence of flow configuration and liquid-concrete contact time on the AMD remediation capabilities of pozzolanic pervious concrete PRBs. Laboratory experiments were conducted on the remediation capabilities of the PRBs under column flow and gravity flow with increasing liquid-concrete contact times. The research found that flow configuration plays a significant role in the remediation efficiency of pervious concrete PRBs. The research found that the two flow configurations achieved equivalent quality of treated AMD while the gravity flow configuration was operated with two orders of magnitude less liquid-concrete contact time than the high retention column flow configuration. The research found that flow configuration also influences the rate at which PRBs captured the precipitated solids in the porous network, leading to pore clogging. This study’s findings suggest that the lifecycle costs of pervious concrete PRBs can be minimised through design of PRBs under the gravity flow configuration due to the lower volume of concrete required per unit of treated AMD and potentially longer productive lifespans due to prolonged clogging. The specific findings of this study are as follows.
The research found a statistically significant (p < 0.05) correlation relationship between the liquid-concrete contact time and pH correction under the column flow configuration. The increase in pH is attributed to the precipitation of most metals from AMD and therefore, the correct sizing of PRBs to satisfy required contact times is a critical design parameter for PRB performance.
  • Initial concentrations of Fe were reduced to concentrations of less than 1 mg/L at pH values of less than 4 under both configurations, suggesting that the remediation mechanisms of pozzolanic pervious concrete PRB involve the oxidation of Fe2+ to Fe3+ leading to precipitation as Fe(OH)3.
  • Both gravity flow and column flow configurations at the tested contact times are highly effective for heavy metals Fe and Al removal, with 99% and over 80% removal efficiency, respectively; are limited for SO4, Mg and Na removal with up to 17%, 22% and 20% removal rates, respectively; and are ineffective at reducing Mn concentrations.
  • The dissolved concentrations of Ca and K under gravity flow and column flow configuration increased by up to 16% and more than threefold, respectively, due to the leaching of the minerals from the pervious concrete resulting in alkalinity and raising the pH.
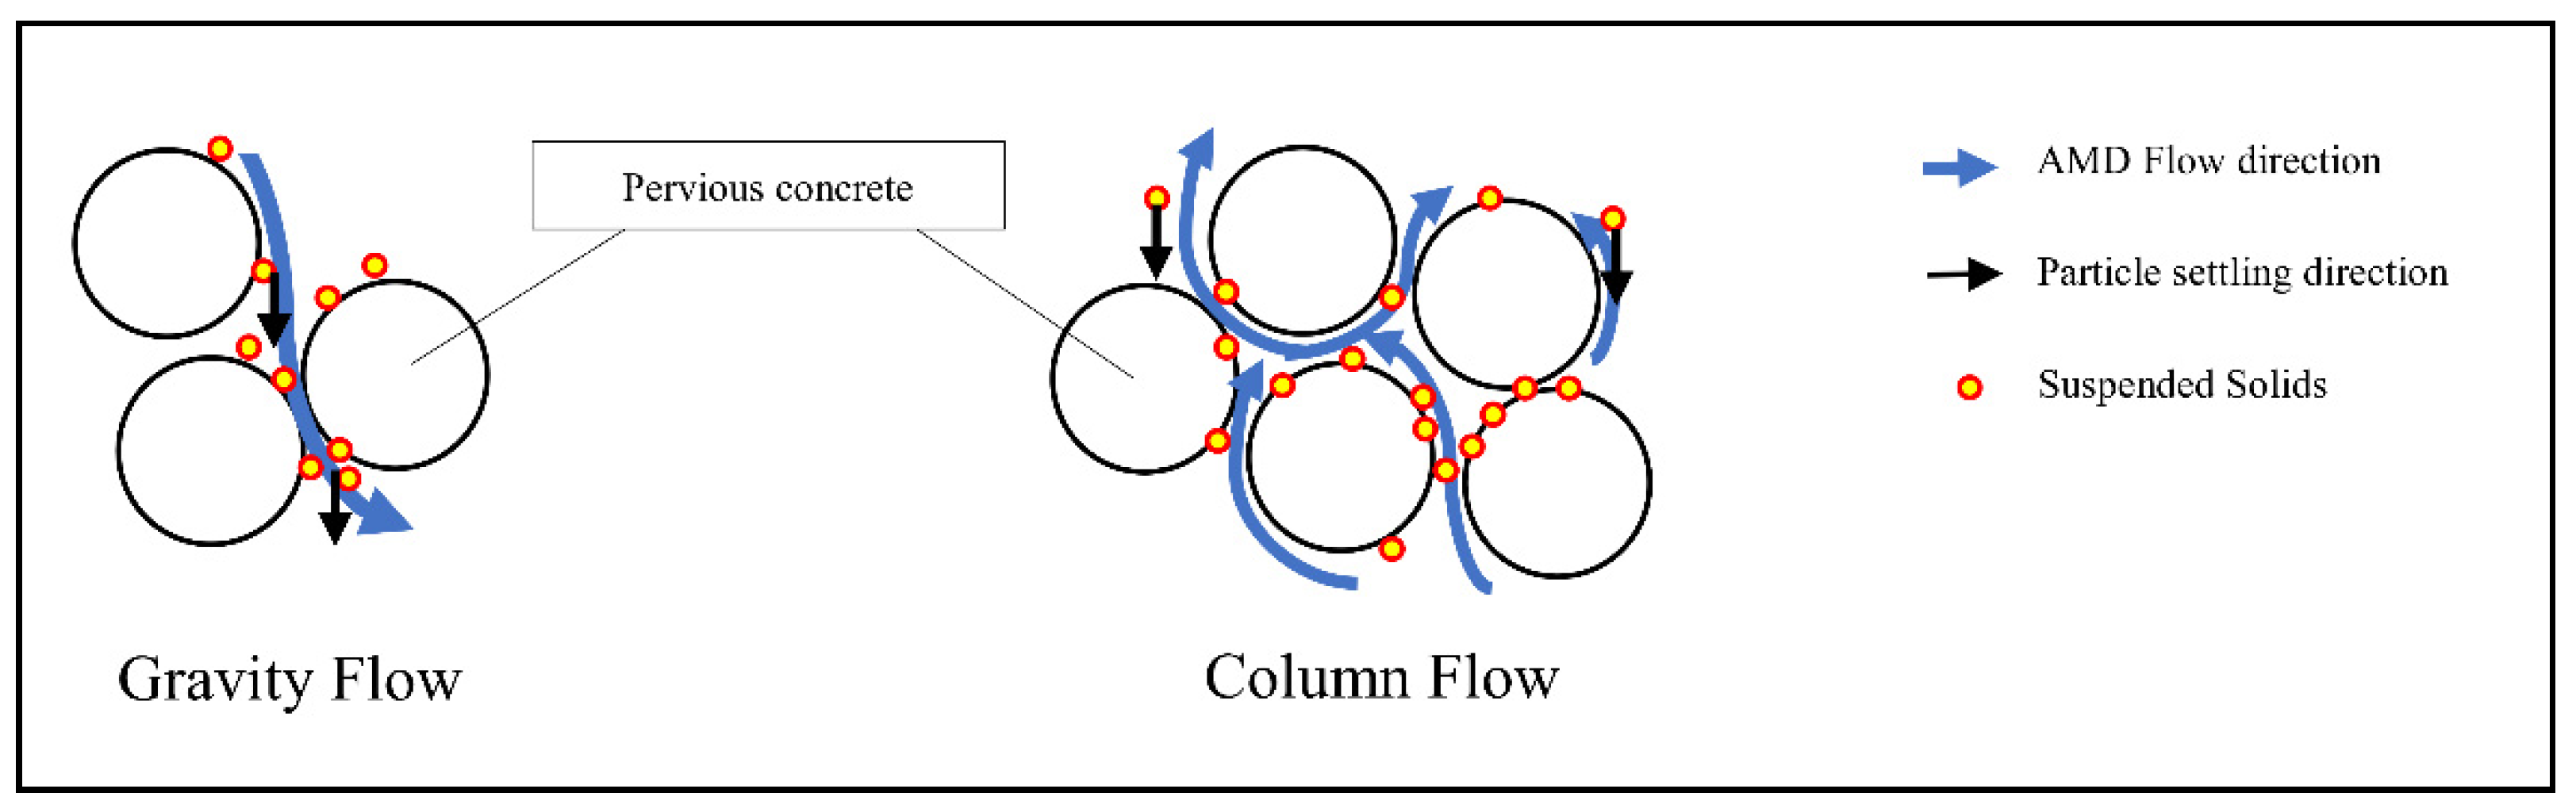
  • The pervious concrete PRBs under the gravity flow configuration captured 8% fewer precipitated solids on the reactive surface when compared to the column flow configuration. This finding suggests that slower clogging of the PRB could be attained when operating under the gravity flow configuration leading to longer productive lifespan.

Author Contributions

Conceptualisation, S.K.T.; methodology, S.K.T.; formal analysis, S.K.T.; resources, D.V.V.K. and S.K.T.; writing—original draft preparation, S.K.T.; writing—review and editing, D.V.V.K. and P.B.; supervision, D.V.V.K. and P.B.; funding acquisition, D.V.V.K. All authors have read and agreed to the published version of the manuscript.

Funding

This research was funded by theSouth African Systems Analysis Centre (SASAC) Newton Fund. The funding was facilitated by SASAC and the British Council through the South African National Research Foundation (NRF). The open access funding was provided by the University of Johannesburg Library, Doonfontein Campus (DFC), Doonfontein, Johannesburg 2006, South Africa.

Institutional Review Board Statement

Not applicable.

Informed Consent Statement

Not applicable.

Data Availability Statement

Data are contained within the article.

Acknowledgments

We would like to acknowledge the South African Systems Analysis Centre (SASAC) Newton Fund for funding this research. We would also like to acknowledge the South African National Research Foundation (NRF) and the British Council for facilitating the funding.

Conflicts of Interest

The authors declare no conflict of interest.

References

  1. Younger, P.L.; Banwart, S.A.; Hedin, R.S. Mine Water: Hydrology, Pollution, Remediation; Kluwer Academic Publishers: Dordrecht, The Netherlands, 2002. [Google Scholar]
  2. Braungardt, C.B.; Achterberg, E.P.; Elbaz-Poulichet, F.; Morley, N.H. Metal geochemistry in a mine-polluted estuarine system in Spain. Appl. Geochem. 2003, 18, 1757–1771. [Google Scholar] [CrossRef]
  3. Msagati, T.A.; Nkambule, T.I.; Kefeni, K.; Mamba, B. Synthesis and application of hematite nanoparticles for acid mine drainage treatment. J. Environ. Chem. Eng. 2018, 6, 1865–1874. [Google Scholar]
  4. Thisani, S.K.; Kalllon, D.V.V.; Byrne, P. Geochemical Classification of Global Mine Water Drainage. Sustainability 2020, 12, 10244. [Google Scholar] [CrossRef]
  5. Akcil, A.; Koldas, S. Acid Mine Drainage (AMD): Causes, treatment and case studies. J. Clean. Prod. 2006, 14, 1139–1145. [Google Scholar] [CrossRef]
  6. Rose, P. Long-term sustainability in the management of acid mine drainage wastewaters—Development of the Rhodes BioSURE Process. Water S. Afr. 2013, 39, 583–592. [Google Scholar] [CrossRef] [Green Version]
  7. Johnson, B.D.; Hallberg, K.B. Acid Mine Drainage Remediation Options: A Review. Sci. Total Environ. 2005, 338, 3–14. [Google Scholar] [CrossRef]
  8. Thisani, S.K.; Kallon, D.V.V. Review of Remediation Solutions for Acid Mine Drainage Using the Modified Hill Framework. Sustainability 2021, 13, 8118. [Google Scholar] [CrossRef]
  9. Shabalala, A.N.; Ekolu, S.O.; Diop, S. Permeable Reactive Barriers for Acid Mine Drainage Treatment: A Review. In Construction Materials and Structures; IOS Press: Amsterdam, The Netherlands, 2014; pp. 1416–1425. [Google Scholar]
  10. Waybrant, K.R.; Blowes, D.W.; Ptacek, C.J. Selection of Reactive Mixtures for use in Permeable Reactive Walls for Treatment of Mine Drainage. Environ. Sci. Technol. 1998, 32, 1972–1979. [Google Scholar] [CrossRef]
  11. Perez, N.; Schwarz, A.O.; Barahona, E.; Sanhueza, P.; Diaz, I.; Urrutia, H. Performance of two differently designed permeable reactive barriers with sulfate and zinc solutions. Sci. Total Environ. 2018, 642, 894–903. [Google Scholar] [CrossRef] [PubMed]
  12. Carey, M.A.; Fretwell, B.A.; Mosley, N.G.; Smith, J.W. Guidence on the Use of Permeable Reactive Bariers for Remediating Contaminated Groundwater; National Groundwater Contaminated Land Centre Report NC/01/51; UK Environmental Agency: Bristol, UK, 2002.
  13. Henderson, A.D.; Demond, A.H. Long-Term Performance of Zero-Valent Iron Permeable Reactive Barriers: A Critical Review. Environ. Eng. Sci. 2007, 24, 401–423. [Google Scholar] [CrossRef] [Green Version]
  14. Moodley, I.; Sheridan, C.M.; Kappelmeyer, U.; Akcil, A. Environmentally sustainable acid mine drainage remediation: Research developments with a focus on waste/by-products. Miner. Eng. 2018, 126, 207–220. [Google Scholar] [CrossRef]
  15. Obiri-Nyarko, F.; Grajales-Mesa, S.; Malina, G. An overview of permeable reactive barriers for in situ sustainable groundwater remediation. Chemosphere 2014, 111, 243–259. [Google Scholar] [CrossRef]
  16. Ekolu, S.O.; Azane, F.Z.; Diop, S. A concrete reactive barrier for acid mine drainage treatment. In Proceedings of the Institution of Civil Engineers—Water Management; Thomas Telford Ltd.: London, UK, 2015; Volume 167, pp. 373–380. [Google Scholar]
  17. Shabalala, A.N.; Ekolu, S.O.; Diop, S.; Solomon, F. Pervious concrete reactive barrier for removal of heavy metals from acid mine drainage—Column study. J. Hazard. Mater. 2017, 353, 641–653. [Google Scholar] [CrossRef] [PubMed]
  18. Mafanya, L.; Kallon, D.V.V.; Simelane, S.P. Chemical Analysis of AMD Properties Based on Factorial Method; OIC: Jeddah, Saudi Arabia, 2019; pp. 399–403. [Google Scholar]
  19. Zaal, S.M. Passive Treatment of Acid Mine Drainage Through Permeable Concrete and Organic Filtration. Ph.D. Thesis, University of Witwatersrand, Johannesburg, South Africa, 2016. [Google Scholar]
  20. Mafanya, L.; Kallon, D.V.V.; Simelane, S.P. Flow Properties Upon Treatment of Acid Mine Drainage Using Pervious Concrete. In Proceedings of the SAIIE NeXXXt 21, Gqeberha, South Africa, 30 September–2 October 2019; pp. 399–403. [Google Scholar]
  21. Mafanya, L. Flow properties Upon Treatment of Acid Mine Drainage Using Pervious Concrete. Master’s Thesis, University of Johannesburg, Johannesburg, South Africa, 2020. [Google Scholar]
  22. Ekolu, S.O.; Bitandi, L.K. Prediction of Longevities of ZVI and Pervious Concrete Reactive Barriers Using the Transport Simulation Model. J. Environ. Eng. 2018, 144, 1–10. [Google Scholar] [CrossRef]
  23. Thisani, S.K.; Kallon, D.V.V.; Byrne, P. A fixed bed pervious concrete anaerobic bioreactor for biological sulphate remediation of acid mine drainage using simple organic matter. Sustainability 2021, 13, 6529. [Google Scholar] [CrossRef]
  24. Cement & Concrete Institute. Cementitious Material for Concrete Standards, Selection and Properties; Cement & Concrete Institute: Midrand, South Africa, 2009. [Google Scholar]
  25. Neville, A.M. Properties of Concrete, 4th ed.; John Wiley and Sons Inc.: New York, NY, USA, 1996. [Google Scholar]
  26. Golab, A.N.; Indraratna, B.; Peterson, M. Selection of permeable reactive barrier materials for treating acid mine groundwater in sulphate soil terrains based on laboratory column tests. Environ. Earth Sci. 2009, 59, 241–254. [Google Scholar] [CrossRef]
  27. Ekstrom, T. Leaching of Concrete: Experiments and Modelling. Division of Building Materials. Ph.D. Thesis, LTH, Lund University, Lund, Sweden, 2001. [Google Scholar]
  28. Hoglund, L.O. Project SAFE. Modelling of Long-Term Concrete Degradation Processes in the Swedish SFR Repository; SKB Rapport R-01-08; Svensk Kärnbränslehantering AB: Solna, Sweden, 2001. [Google Scholar]
  29. Lu, H.; Wei, F.; Tang, J.; Giespy, J.P. Leaching of metals from cement under simulated environmental conditions. J. Environ. Manag. 2016, 169, 319–327. [Google Scholar] [CrossRef] [PubMed]
  30. Monhemius, J. Precipitation diagrams for metal hydroxides, sulphates, arsenates and phosphates. Trans. Inst. Min. Metall. 1977, 86, C202–C206. [Google Scholar]
  31. Stewart, D.R. Water Filtration Innovation to Optimize Recovery and Lower TCO. J. Int. Mine Water Assoc. 2013, 1, 735–740. [Google Scholar]
  32. Rose, A.W. Advances in Passive Treatment of Coal Mine Drainage 1998–2009. In Proceedings of the 27th ASMR, Pittsburgh, PA, USA, 5–10 June 2010; pp. 847–887. [Google Scholar]
  33. Komnitsas, K.; Bartzas, G.; Paspaliaris, I. Efficiency of limestone and red mud barriers: Laboratory column studies. Miner. Eng. 2004, 17, 183–194. [Google Scholar] [CrossRef]
  34. Takahide, S. Kurita Water Treatment Handbook, 2nd ed.; Kurita Water Industries, Ltd.: Tokyo, Japan, 1999. [Google Scholar]
  35. Kirby, C.S.; Dennis, S.; Kahler, A. Aeration to degas CO2, increase pH, and increase iron oxidation rates for efficient treatment of net alkaline mine drainage. Appl. Geochem. 2009, 24, 1175–1184. [Google Scholar] [CrossRef]
  36. Zang, C.; Huang, S.; Wu, M.; Du, S.; Scholz, M.; Geo, F.; Lin, C.; Guo, Y.; Dong, Y. Comparison of relationships between pH, dissolved oxygen and chlorophyll a for aquaculture and non-aquaculture waters. Water Air Soil Pollut. 2011, 219, 157–174. [Google Scholar] [CrossRef]
  37. Farage, R.M.P.; Quina, M.J.; Gando-Ferreira, L.; Silva, C.M.; de Souza, J.L.L.; Torres, C.M.M.E. Kraft pulp mill dregs and grits as permeable reactive barrier for removal of copper and sulfate in acid mine drainage. Sci. Rep. 2020, 10, 4083. [Google Scholar] [CrossRef] [PubMed]
  38. Shabalala, A.N. Assessment of locally available reactive materials for use in permeable reactive barriers (PRBs) in remediating acid mine drainage. Water SA 2013, 39, 251–256. [Google Scholar] [CrossRef] [Green Version]
  39. AFCEE. Technical Protocol for Enhanced Anaerobic Bioremediation Using Permeable Mulch Biowalls and Bioreactors; Air Force Center for Engineering and the Environment: Denver, CO, USA, 2008. [Google Scholar]
  40. Liang, L.; Sullivan, A.B.; West, O.R.; Moline, G.R.; Kamolpornwijit, W. Predicting the precipitation of mineral phases in permeable reactive barriers. Environ. Eng. Sci. 2003, 20, 635–653. [Google Scholar] [CrossRef]
  41. Wantanaphong, J.; Mooney, S.J.; Bailey, E.H. Quantification of pore clogging characteristics in potential permeable reactive barrier (PRB) substrates using image analysis. J. Contam. Hydrol. 2006, 86, 299–320. [Google Scholar] [CrossRef]
Figure 1. Condition of the water at the abandoned mining site.
Sustainability 13 10847 g001
Figure 2. Experimental set-up for column flow configuration.
Sustainability 13 10847 g002
Figure 3. Experimental set-up for gravity flow configuration.
Sustainability 13 10847 g003
Figure 4. Metals, pH, sulphate and TSS vs. contact time for column experiment.
Sustainability 13 10847 g004
Figure 5. Sulphate vs. hydraulic retention time for column experiment.
Sustainability 13 10847 g005
Figure 6. Precipitant formation across pervious concrete cube—column experiment.
Sustainability 13 10847 g006
Figure 7. Metals, pH, sulphate and TSS vs. contact time for gravity experiment.
Sustainability 13 10847 g007
Figure 8. Sulphate vs. hydraulic retention times for gravity experiment.
Sustainability 13 10847 g008
Figure 9. Total suspended and total removed solids vs. pH—gravity and column experiments.
Sustainability 13 10847 g009
Figure 10. Precipitant formation across pervious concrete block—gravity experiment.
Sustainability 13 10847 g010
Figure 11. Treated AMD before and after settling test.
Sustainability 13 10847 g011
Figure 12. Flow characteristics under the gravity and column flow.
Sustainability 13 10847 g012
Figure 13. Proposed layout for gravity flow installation.
Sustainability 13 10847 g013
Table 1. Concrete mix design.
Concrete IDMix Proportion (dry)—kg per m3% ExtenderPorosity
CEM 1Fly AshSilica Fume9.5 mm GraniteOptima 175Water
CEM VI A19718914621.757512.1%21.5%
Table 2. Raw AMD quality parameters.
DeterminandConcentrationUnits
Sulphate (SO4)2232mg/L
Total Suspended Solids (TSS)<3mg/L
Arsenic (As)1.3µg/L
Calcium (Ca)568mg/L
Sodium (Na)228mg/L
Ferrous Iron (Fe2+)40.7mg/L
Total Iron (Total Fe)43.6mg/L
Manganese (Mn)11,124µg/L
Magnesium (Mg)402mg/L
Aluminium (Al)76,587µg/L
Potassium (K)7.59mg/L
Copper (Cu)1.02µg/L
Zinc (Zn)84µg/L
Boron (B)51µg/L
Nickel (Ni)54µg/L
Lead (Pb)3.05µg/L
pH2.7
Turbidity0.9NTU
Table 3. Treatment rates achieved.
Gravity FlowColumn FlowUnits
Flow TypeUnsaturatedSaturated-
PRB Reactive Volume0.0101250.003375m3
AMD Volume Treated2525L
Time to Treat Volume2.337.5min
Treatment Rate1066.667197.333L/m3/min
Publisher’s Note: MDPI stays neutral with regard to jurisdictional claims in published maps and institutional affiliations.

