Article

The Impact of COVID-19 on Electricity Demand and Generation in Japan

1
School of Earth and Environmental Sciences, University of Queensland, Brisbane 4702, Australia
2
International Institute for Carbon Neutral Energy Research, Kyushu University, Fukuoka 819-0395, Japan
*
Author to whom correspondence should be addressed.
Sustainability 2021, 13(19), 10836; https://doi.org/10.3390/su131910836
Submission received: 29 August 2021 / Revised: 15 September 2021 / Accepted: 19 September 2021 / Published: 29 September 2021
(This article belongs to the Section Energy Sustainability)

Abstract

:
This research considered changes in monthly electricity generation and demand in Japan during the COVID-19 pandemic. Observed network electricity demand and generation type for the January–June 2020 period were compared to forecast values (using a triple exponential smoothing method) based on trends established from 2016 to 2019. Regional level electricity demand data showed little variation from expected trends for domestic energy users, but lower than expected business and industrial network demand, particularly in the 50–2000 kW cohort. Electricity demand was most likely to deviate from existing trends in May 2020, which is in-line with the voluntary lockdown activities. These results are consistent with observed patterns from other international studies into the impact of COVID-19 on electricity demand. Generation was found to be reduced in May and June of 2020, without significant impacts to the generation makeup, largely due to Japan’s positioning within a broader energy transition context. These findings validate previous studies and add to the broader discussions on drivers and the rationale for electricity demand behaviors between user scales. Previous studies examined the electricity demand reductions of full and partial lockdowns. This analysis adds to this discourse by documenting the impacts of a voluntary lockdown.

1. Introduction

The virus that causes COVID-19 is, foremost, a public health and humanitarian crisis. Secondarily, there has been widespread recognition of the impacts the pandemic is having on our environmental and economic systems.
The necessary interventions taken to manage the impact of the pandemic on global populations have actuated social implications, which have had pronounced consequences. While not considered a ‘black swan’ event (owing to the broad predictability of repeat pandemics), the magnitude and range of the virus is in part a result of growing global connectivity, meaning interruption of those networks has been critical to slowing and stopping transmission.
By April 2020, it was estimated that over half of the global population had experienced a full or partial lockdown, with closures of non-essential businesses, schools, and universities impacting most of the remainder [1].
These changes have impacted sociotechnical systems globally, including electricity demand and supply. The impacts of the pandemic and subsequent lockdown events on the Japanese electricity system were investigated here to explore what changes, if any, have been triggered.
Previous research of average monthly electricity demand in Japan following both the global financial crisis (GFC) and great Tohoku earthquake, tsunami, and Fukushima disaster indicated that different scales of electricity users responded to distinct disruption stimuli [2]. The data show large energy users (such as industrial facilities) reduced electricity demand following the GFC, with a domestically driven reduction in monthly electricity demand following the disaster. This result is broadly consistent with a post-disaster energy analysis completed by Waikiyama et al. [3], who found statistically significant national reductions following the disasters. Other changes in demand have been studied by Murakoshi et al. [4], who identified that electricity demand in Japan ceased to correlate with temperature following the disaster, and Daggy et al. [5], who examined domestic energy reductions in the context of energy-saving reforms and supporting social structures.
If this domestic reduction was a response to the social upheaval and insecurity experienced following the disaster, then a similar reduction might be expected with the COVID-19 situation. In contrast, if this reduction was based on social pressure/expectation, a pragmatic need to avoid electricity shortages, and/or compliance with an authoritative request, then a repeat would not be expected for 2019/20. Reduction in electricity demand for larger (commercial and industrial scale) customers had a greater correlation with the GFC, indicating a reduction in production/demand, rather than a targeted and ongoing effort to increase efficiency. This pattern could be repeated with COVID-19 if the economic situation were sufficiently depressed.
Japan recorded its first case of COVID-19, the second confirmed case of the virus outside of Wuhan, China, on 16 January 2020 in a returned traveler [6]. An outbreak in the Hokkaido region was later traced to the annual snow festival at the end of January, which coincides with Lunar New Year and is frequented by overseas tourists. This led to a localized emergency declaration and a three-week lockdown from 28 February 2020. Hokkaido was excluded from the 7 April 2020 national lockdown, but later announced a second lockdown (from 14 April 2020) to counter the second wave of localized infections [7]. National attention was then largely initiated by the cruise ship the “Diamond Princess”, which was quarantined in Yokohama from February 3 until 14 July 2020, with over 700 confirmed COVID-19 cases on board [8].
Infections in Japan peaked initially in March/April 2020. The Japanese response to COVID-19 has been based on government requests to work and learn from home voluntarily, and for non-essential businesses to suspend or limit trading hours, but without significant penalties for non-compliance. Community education has been centered on avoiding the ‘Three Cs’ of closed spaces, crowded places, and close contact [8]. This voluntary observance is similar to that seen with electricity use following the Fukushima disaster, indicating a continuance of the Japanese social norm of compliance with government directives. The social impacts of the virus were further emphasized with the official postponement of the Tokyo 2020 Olympic Games announced on 24 March 2020 [9].
A six-week state of emergency in seven of the eight regions was declared in response to the first wave of infections on April 7, which included the major ‘golden week’ holiday period. Following relaxation of federal restrictions in late May, prevention and control measures were moved to a regionally specific management approach [8]. The second surge in disease in July/August 2020 was attributed to a younger demographic with transmission through ‘nightlife’ events, making contact tracing complex [10]. At the time of writing, COVID-19 infections are again increasing, with additional emergency management declarations in place from 25 April to 11 May 2021 for Tokyo, Kyoto, Hyogo, and Osaka (along with quasi-emergency restrictions in several other prefectures). Hard closures of bars, and 8pm curfews for restaurants are being enacted, along with requests for closures of larger, non-essential retail and leisure facilities [11].
Examination of electricity demand during this period provides further insights into the drivers for change in energy use, especially when considered in partnership with the previous study of the GFC and disaster-triggered impacts. The novelty of the work centers on the complexity of the wider sociotechnical context of the identified changes in electricity demand in Japan.

2. Background and Literature Review

Globally, a reduction in both electricity and total energy consumption has been recognized as a consequence of lockdown. Minor increases in domestic electricity demand have not compensated for the wider commercial and industrial reductions observed [12].
Impacts have been both direct net demand reduction and indirect reduction through lateral movement as the costs of alternative fuels (such as natural gas) reduce, compounded by delivery of a pipeline of renewable generation capacity. This has resulted in improvements in the emissions intensity of energy sectors over lockdown periods. For example, Ghenai and Bettayeb [13] documented a net electricity generation drop of 10% in the European Union (EU) in April 2020 compared to that of 2019, while CO2 reduced by 20% over the same time period.
First quarter 2019 (at the very beginning of the pandemic) saw global coal demand reduce by 8%, with oil demand dropping 5%. These trends are forecast to continue with little recovery for coal and with oil demand falling further, along with minor reductions in gas demand [1].
A growing body of work examines the technical and political complications of these trends. While reductions in net CO2 and improvements in metropolitan air-quality have been documented, the rise of more insular nationalistic management strategies and interruption of collaborative international efforts have also resulted. While the pandemic provides additional demonstration for the earth as a ‘closed system’ (which is critical for mitigation of the climate emergency), this opportunity has not been embraced by all participants [14].
As a primary utility and cornerstone of modern economic systems, security of demand underpins the management of electricity systems. The pandemic has provided an unexpected opportunity for systems to build resilience and flexibility into existing structures as they confront sudden and unexpected oversupply issues (and in many ways is a proxy for preparation to account for a growing renewable generation supply).
This is demonstrated by Zhong, et al. [15], who enumerate the technical challenges wrought by the COVID-19-triggered electricity disruption. Issues such as load balancing and voltage regulation appear analogous to arguments against renewable share increases, as are economic arguments and negative price events (where a power station must bid a negative spot price to maintain its base-loading in times of low demand). The opportunity for system innovation to capitalize on these changes and future-proof system operations was not discussed.
Multiple studies document reductions in electricity consumption with COVID-19 lockdowns and reflect on the resultant technical and political implications of changes in daily load profiles, energy markets, and pricing, for example. These complications generally arise from the avoided need for marginal and reserve generation (often at significantly higher cost), decreasing power prices in the short term, but potentially stressing the systems longer term if demand recovers and this capacity is no longer available. Technical challenges also involve load balancing between supply and demand, where established consumption patterns have been interrupted, and there are higher (proportional and absolute) administrative costs associated with these changes [16,17,18,19]. The electricity demand and load profile impacts of lockdown were also found to correlate with the severity of the lockdown [20].
Kuzemko, et al. [21] considered the future implications of these changes and specifically how they influence (and potentially accelerate) the burgeoning renewable energy transition. Issues of supply chain vulnerability, lower oil and gas investment returns, broader market interventions, and disruption of summits and other networking and multi-level governance opportunities are all addressed. The implications of interrupting established social processes and norms and an evolving recovery narrative are also relevant, as is a ‘window’ into alternative systems of working, learning, and commuting and the connections these systems have with the localized environment; all these changes have implications for longer term energy demand.
The other theme of COVID-19 electricity research covers a more egalitarian focus on energy sovereignty. The pandemic has highlighted and compounded issues of energy inequality for marginalized communities, where energy is managed as a consumable rather than essential service. For these authors, the COVID-19 pandemic provides an opportunity to reassess the socio-economic policy and to promote an energy transition that is both socially and environmentally ethical [22,23,24].

3. Materials and Methods

Data for this analysis were drawn from prefecture level demand data and generation data provided by the Japan Agency for Natural Resources and Energy (ANRE) within the Ministry of Economy, Trade, and Industry (METI) [25,26].
The ANRE dataset for Electricity Demand by Prefecture provides monthly electricity demand in MWh from April 2016 onwards for a limited number of user scales, (being low voltage, high voltage, and extra-high voltage usage) for 47 discrete Japanese Prefectures. This can be amalgamated into geographical Regions as necessary, for comparison to the existing dataset. Low voltage demand is provided as both ‘free’ and ‘specific’ cohorts. Demand increases and decreases, respectively, between these liberalized and traditional tariff arrangements, indicating that this reflects only lateral administrative movement of customers as liberalization of the electricity system continues to develop. Therefore, only a total of these two groups was analyzed.
The Power Generation Results record the MWh generated by individual system participants (both private and networked) differentiated by the generation source. Note that figures for biomass and waste (renewable generation) are also included in thermal generation totals.
The data were divided into pre- and post-COVID-29 cohorts, split between the 2019 and 2020 calendar years, which is consistent with the first documented COVID-19 case in Japan in January 2020.
All data were collected and organized using Microsoft Excel. Excel’s Forecasting Syntax suite was applied, and it is considered suitable given that the data were provided along a consistent timeline. These calculations apply error, trend, and pattern for triple exponential smoothing based on the established Holt–Winters method. A summary of the applied syntax is provided in the Appendix A (Table A1). Results were considered beyond the forecast if they sat beyond (plus or minus) the 95% confidence interval of the calculated value. This analysis approach was selected as a preliminary method of identifying early- and short-term changes in trends.
These calculations were performed for each prefecture individually, then amalgamated to Regional and Country level totals, rather than calculating a single value based on pre-combined demand data.
It should be noted that self-generation is common for users of larger scales, which may influence results. However, it is assumed for the purposes of this review that at a sectoral scale, owner-generated contributions would be materially consistent across the assessment period. Both network and private sources were included in the generation results.

4. Results

Changes to electricity use and generation can be considered separately, based on the data provided.

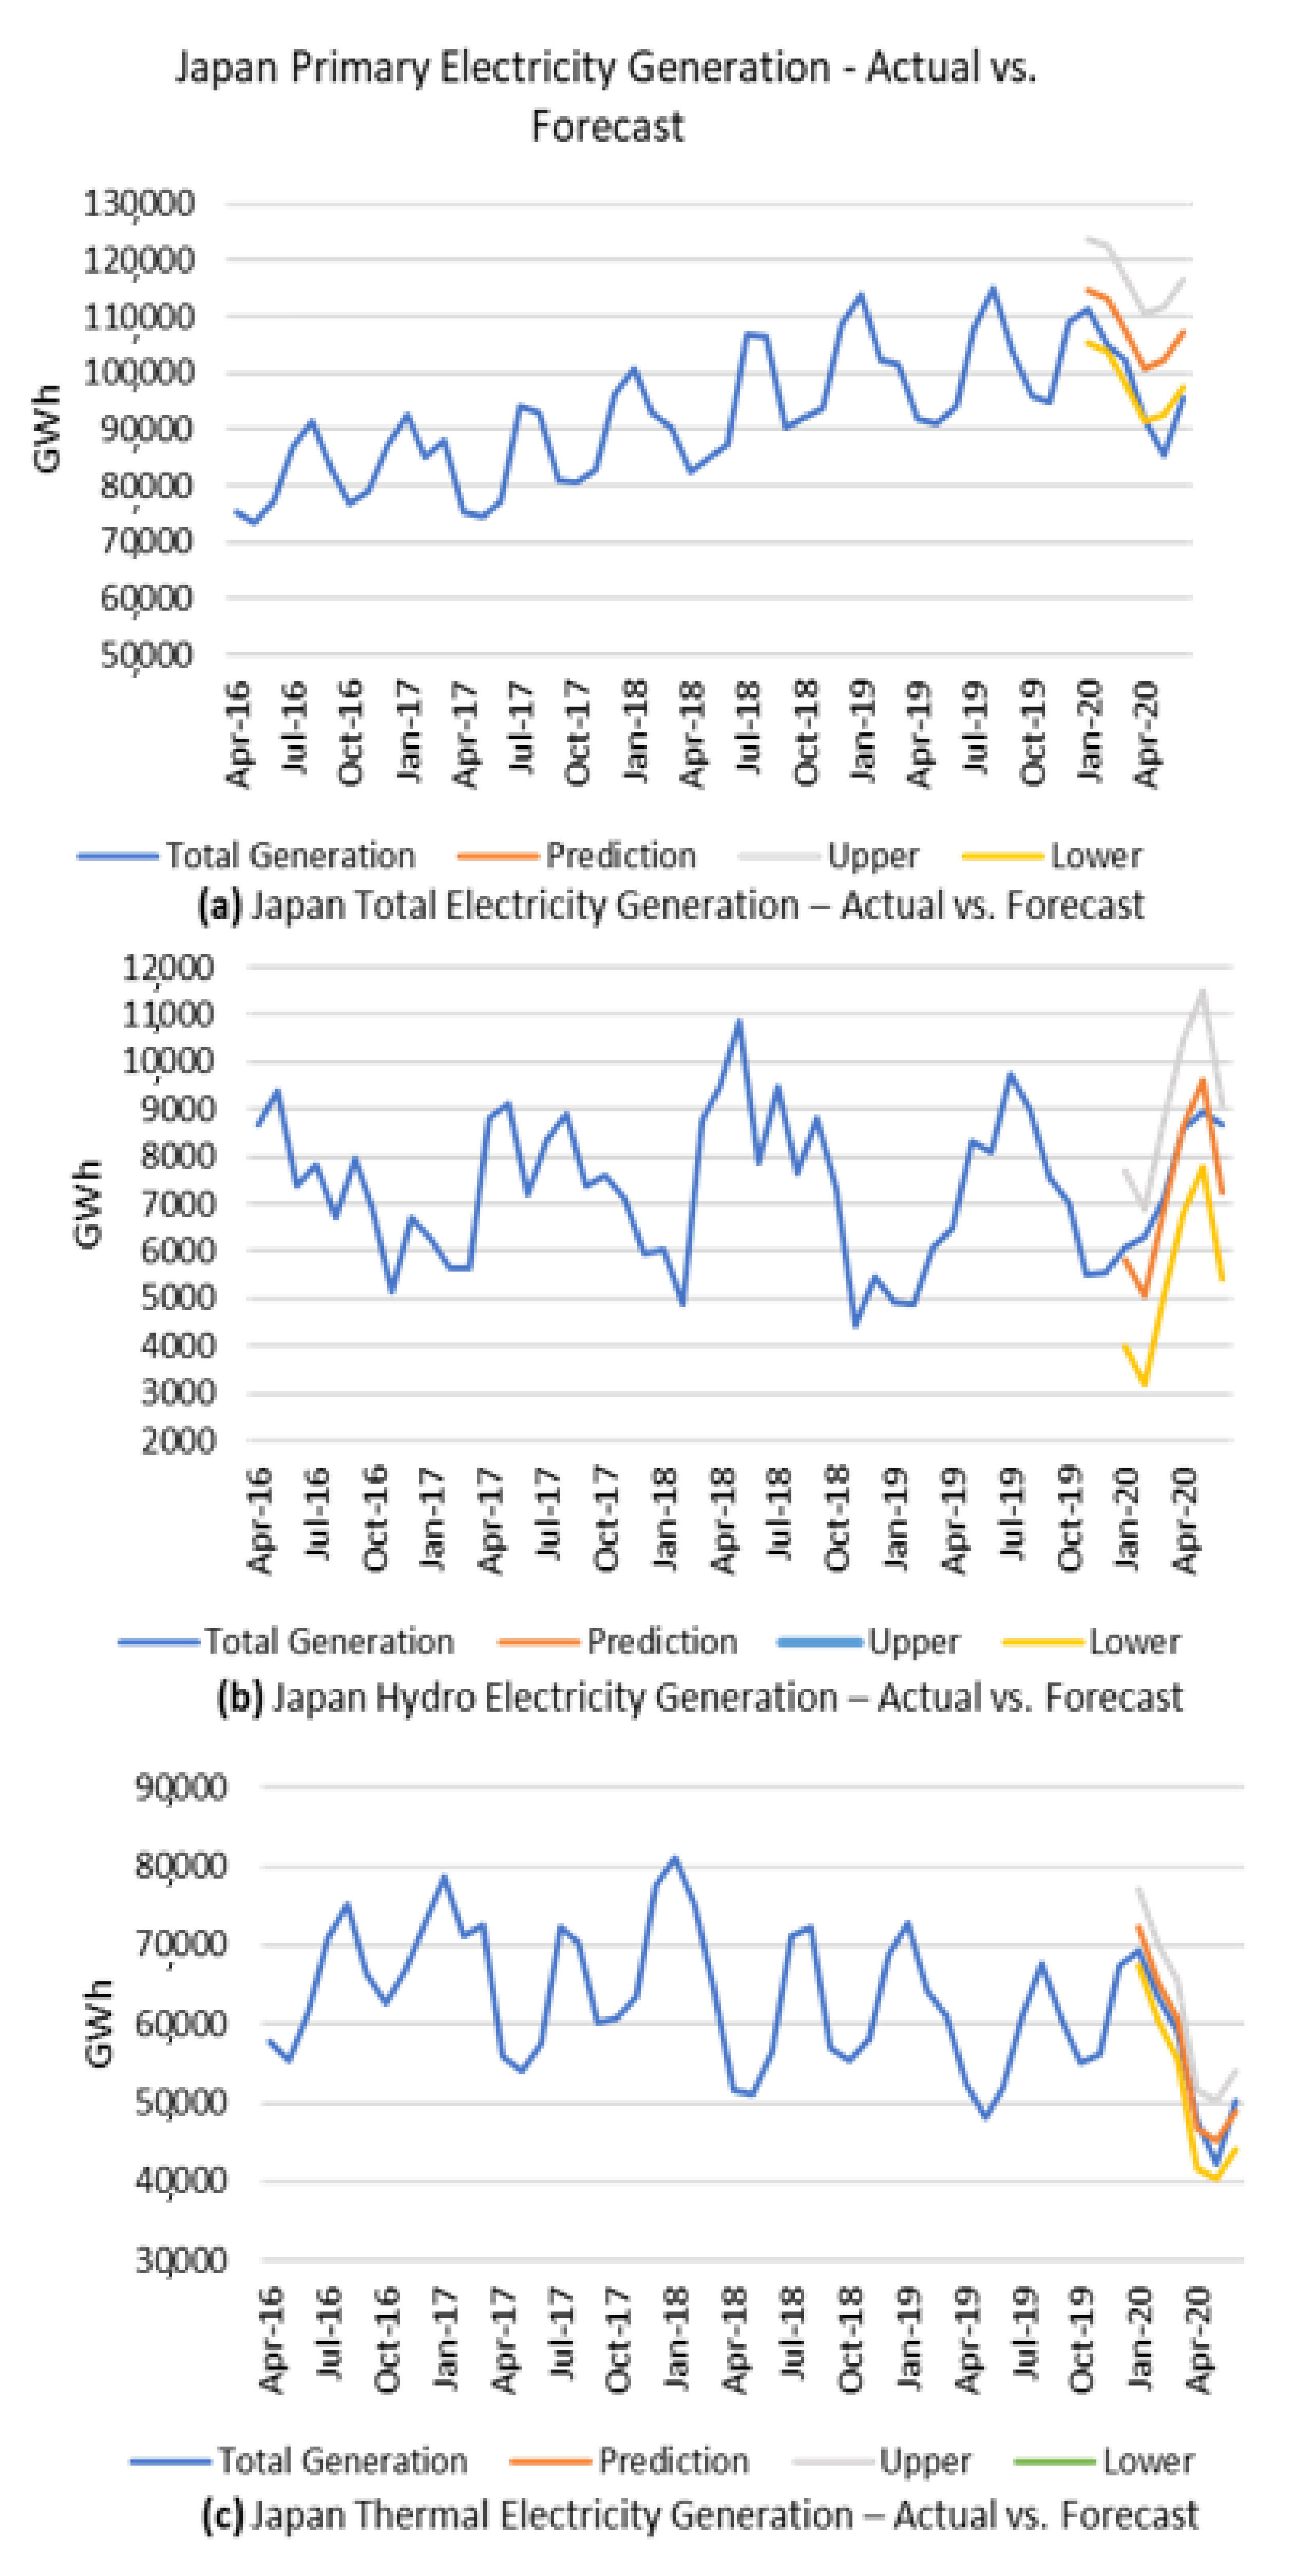
4.1. Electricity Generation Results

A statistical assessment of the total electricity generation (from both network and private providers) shows a significant decrease in power production (beyond the 95% confidence interval of the predicted value) for both May and June 2020. As indicated in Figure 1, no clear correlation for this result could be identified between the primary generation sources.
The nuclear generation results were out of the predicted range for much of the assessment period. The instability of these results is likely related to a larger political discourse rather than a direct consequence of the COVID-19 disruption [27,28].
Renewable results were higher than expected for April 2020, preceding the lockdown. As renewable generation output is generally not scheduled, this is likely the result of a general upward trend for the sector.
Data and statistics are summarized in the Appendix A (Table A2).

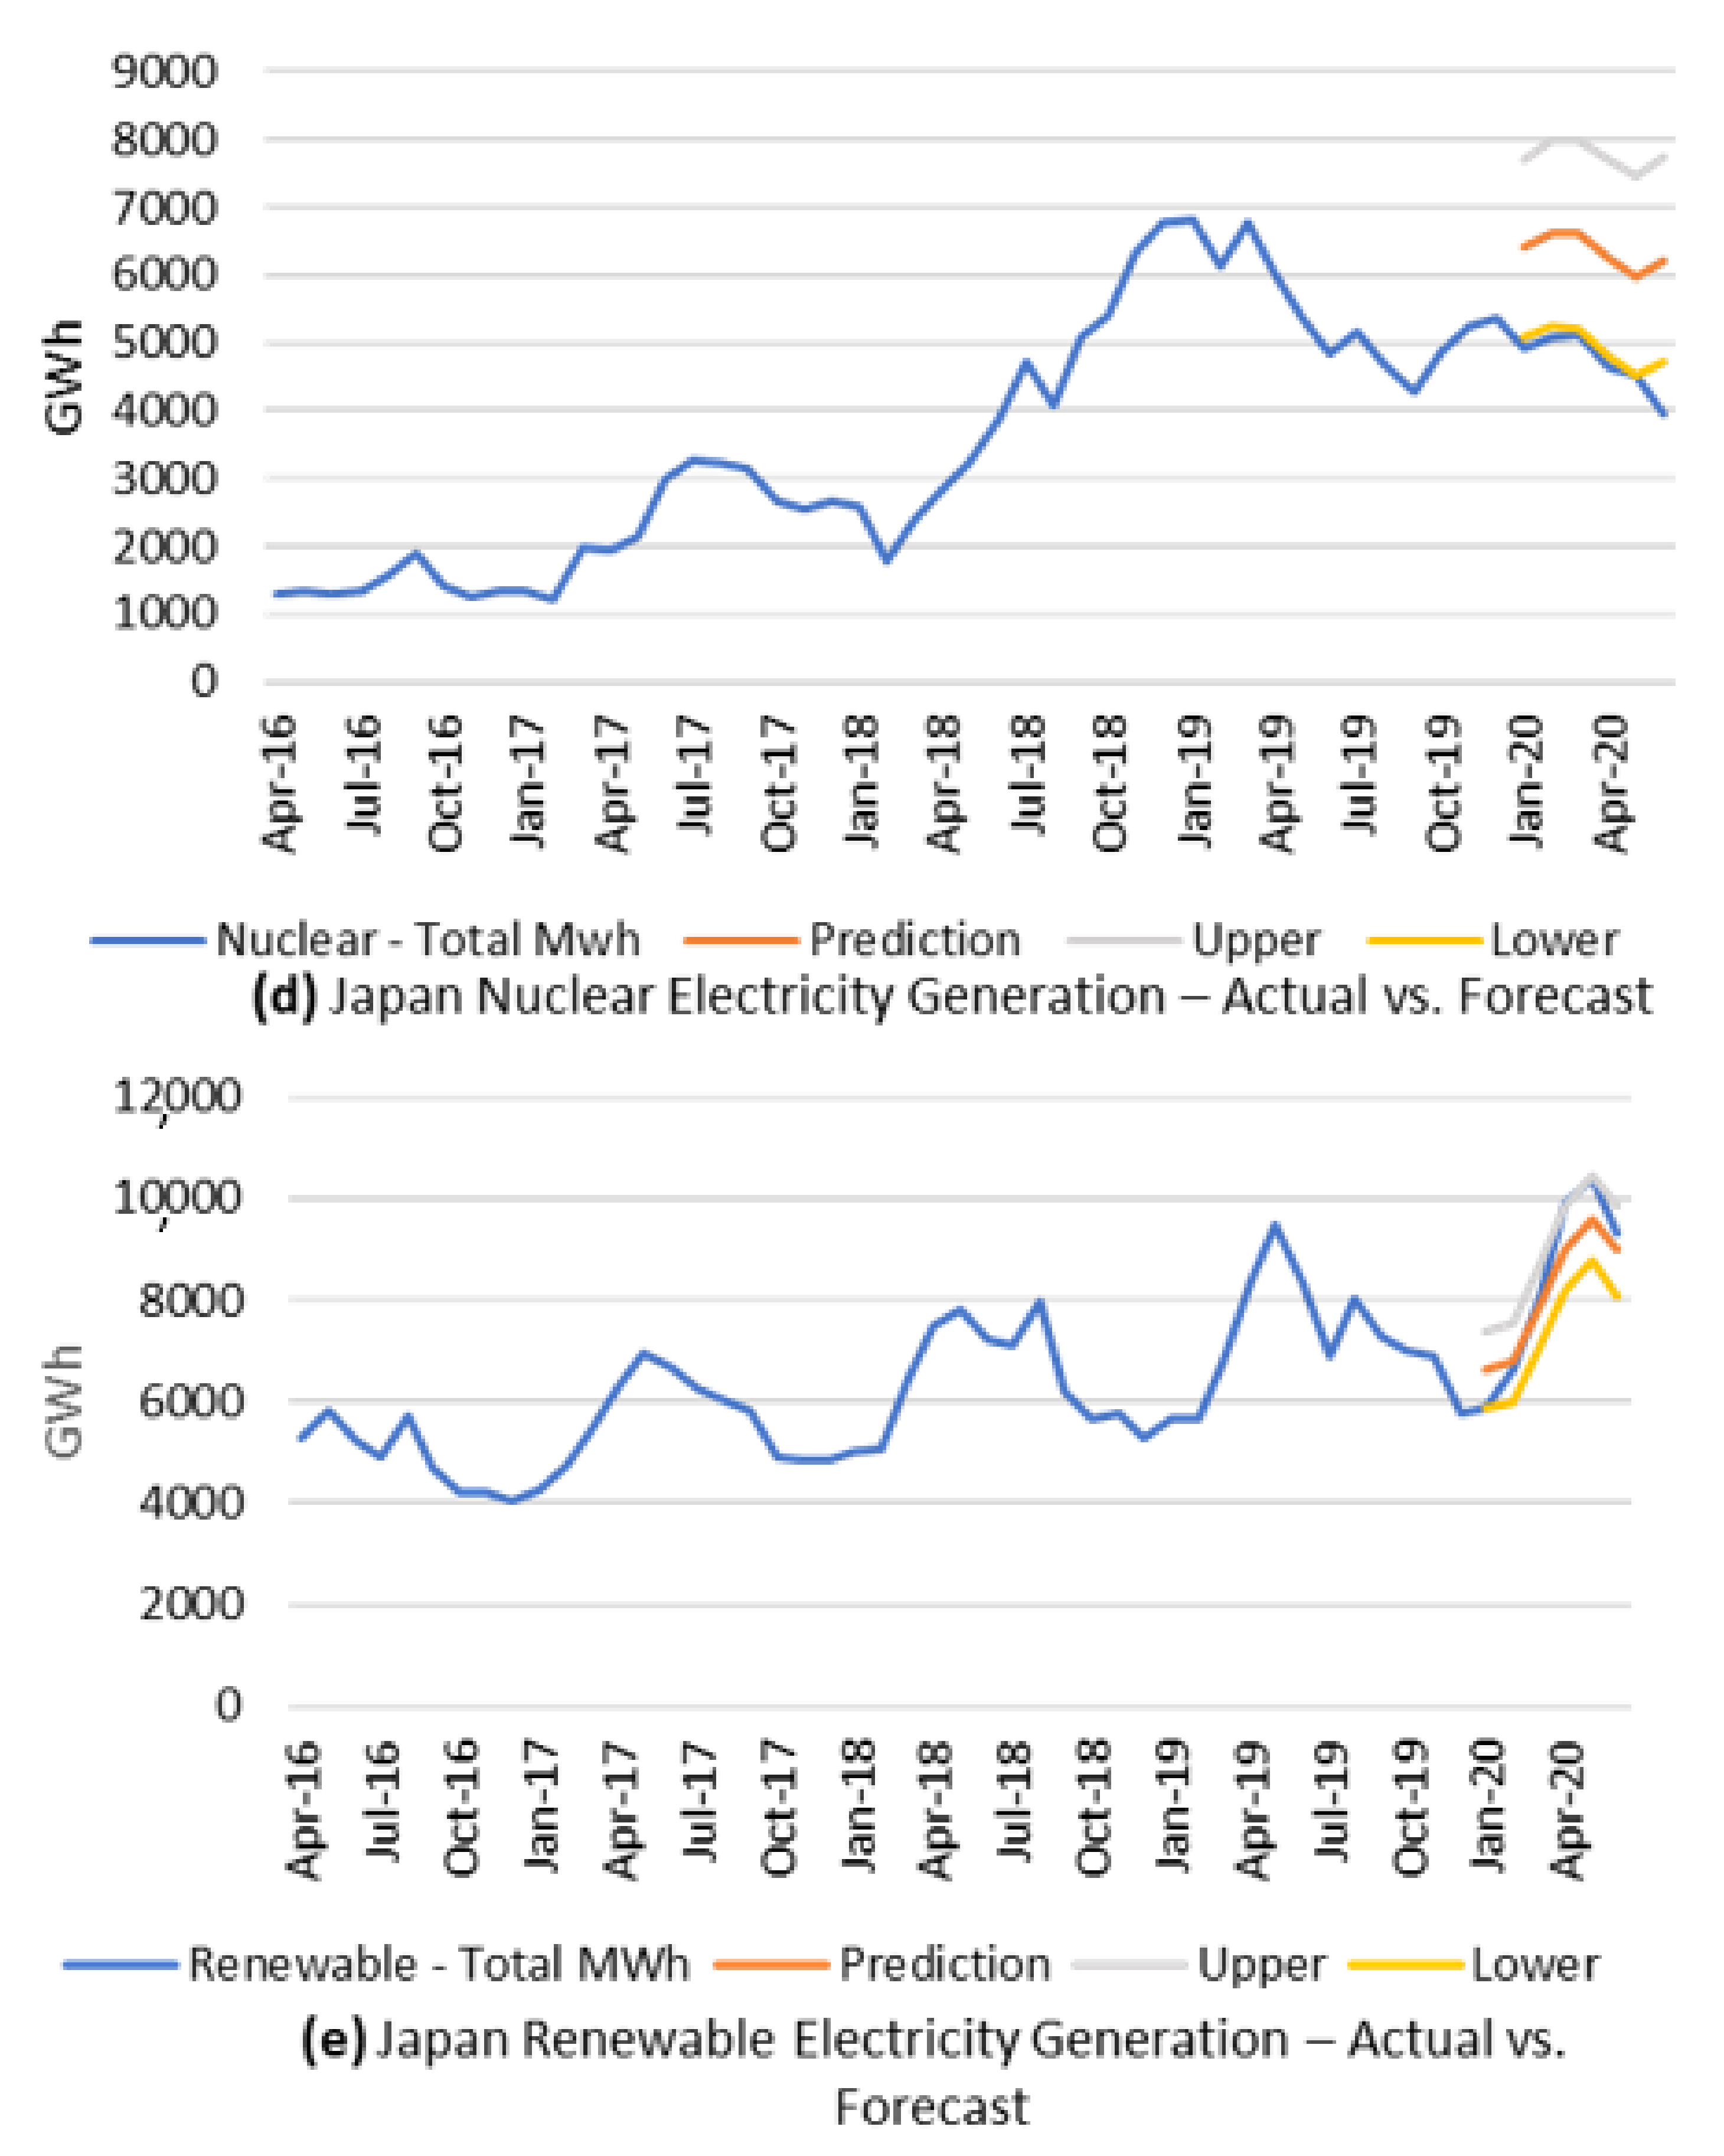
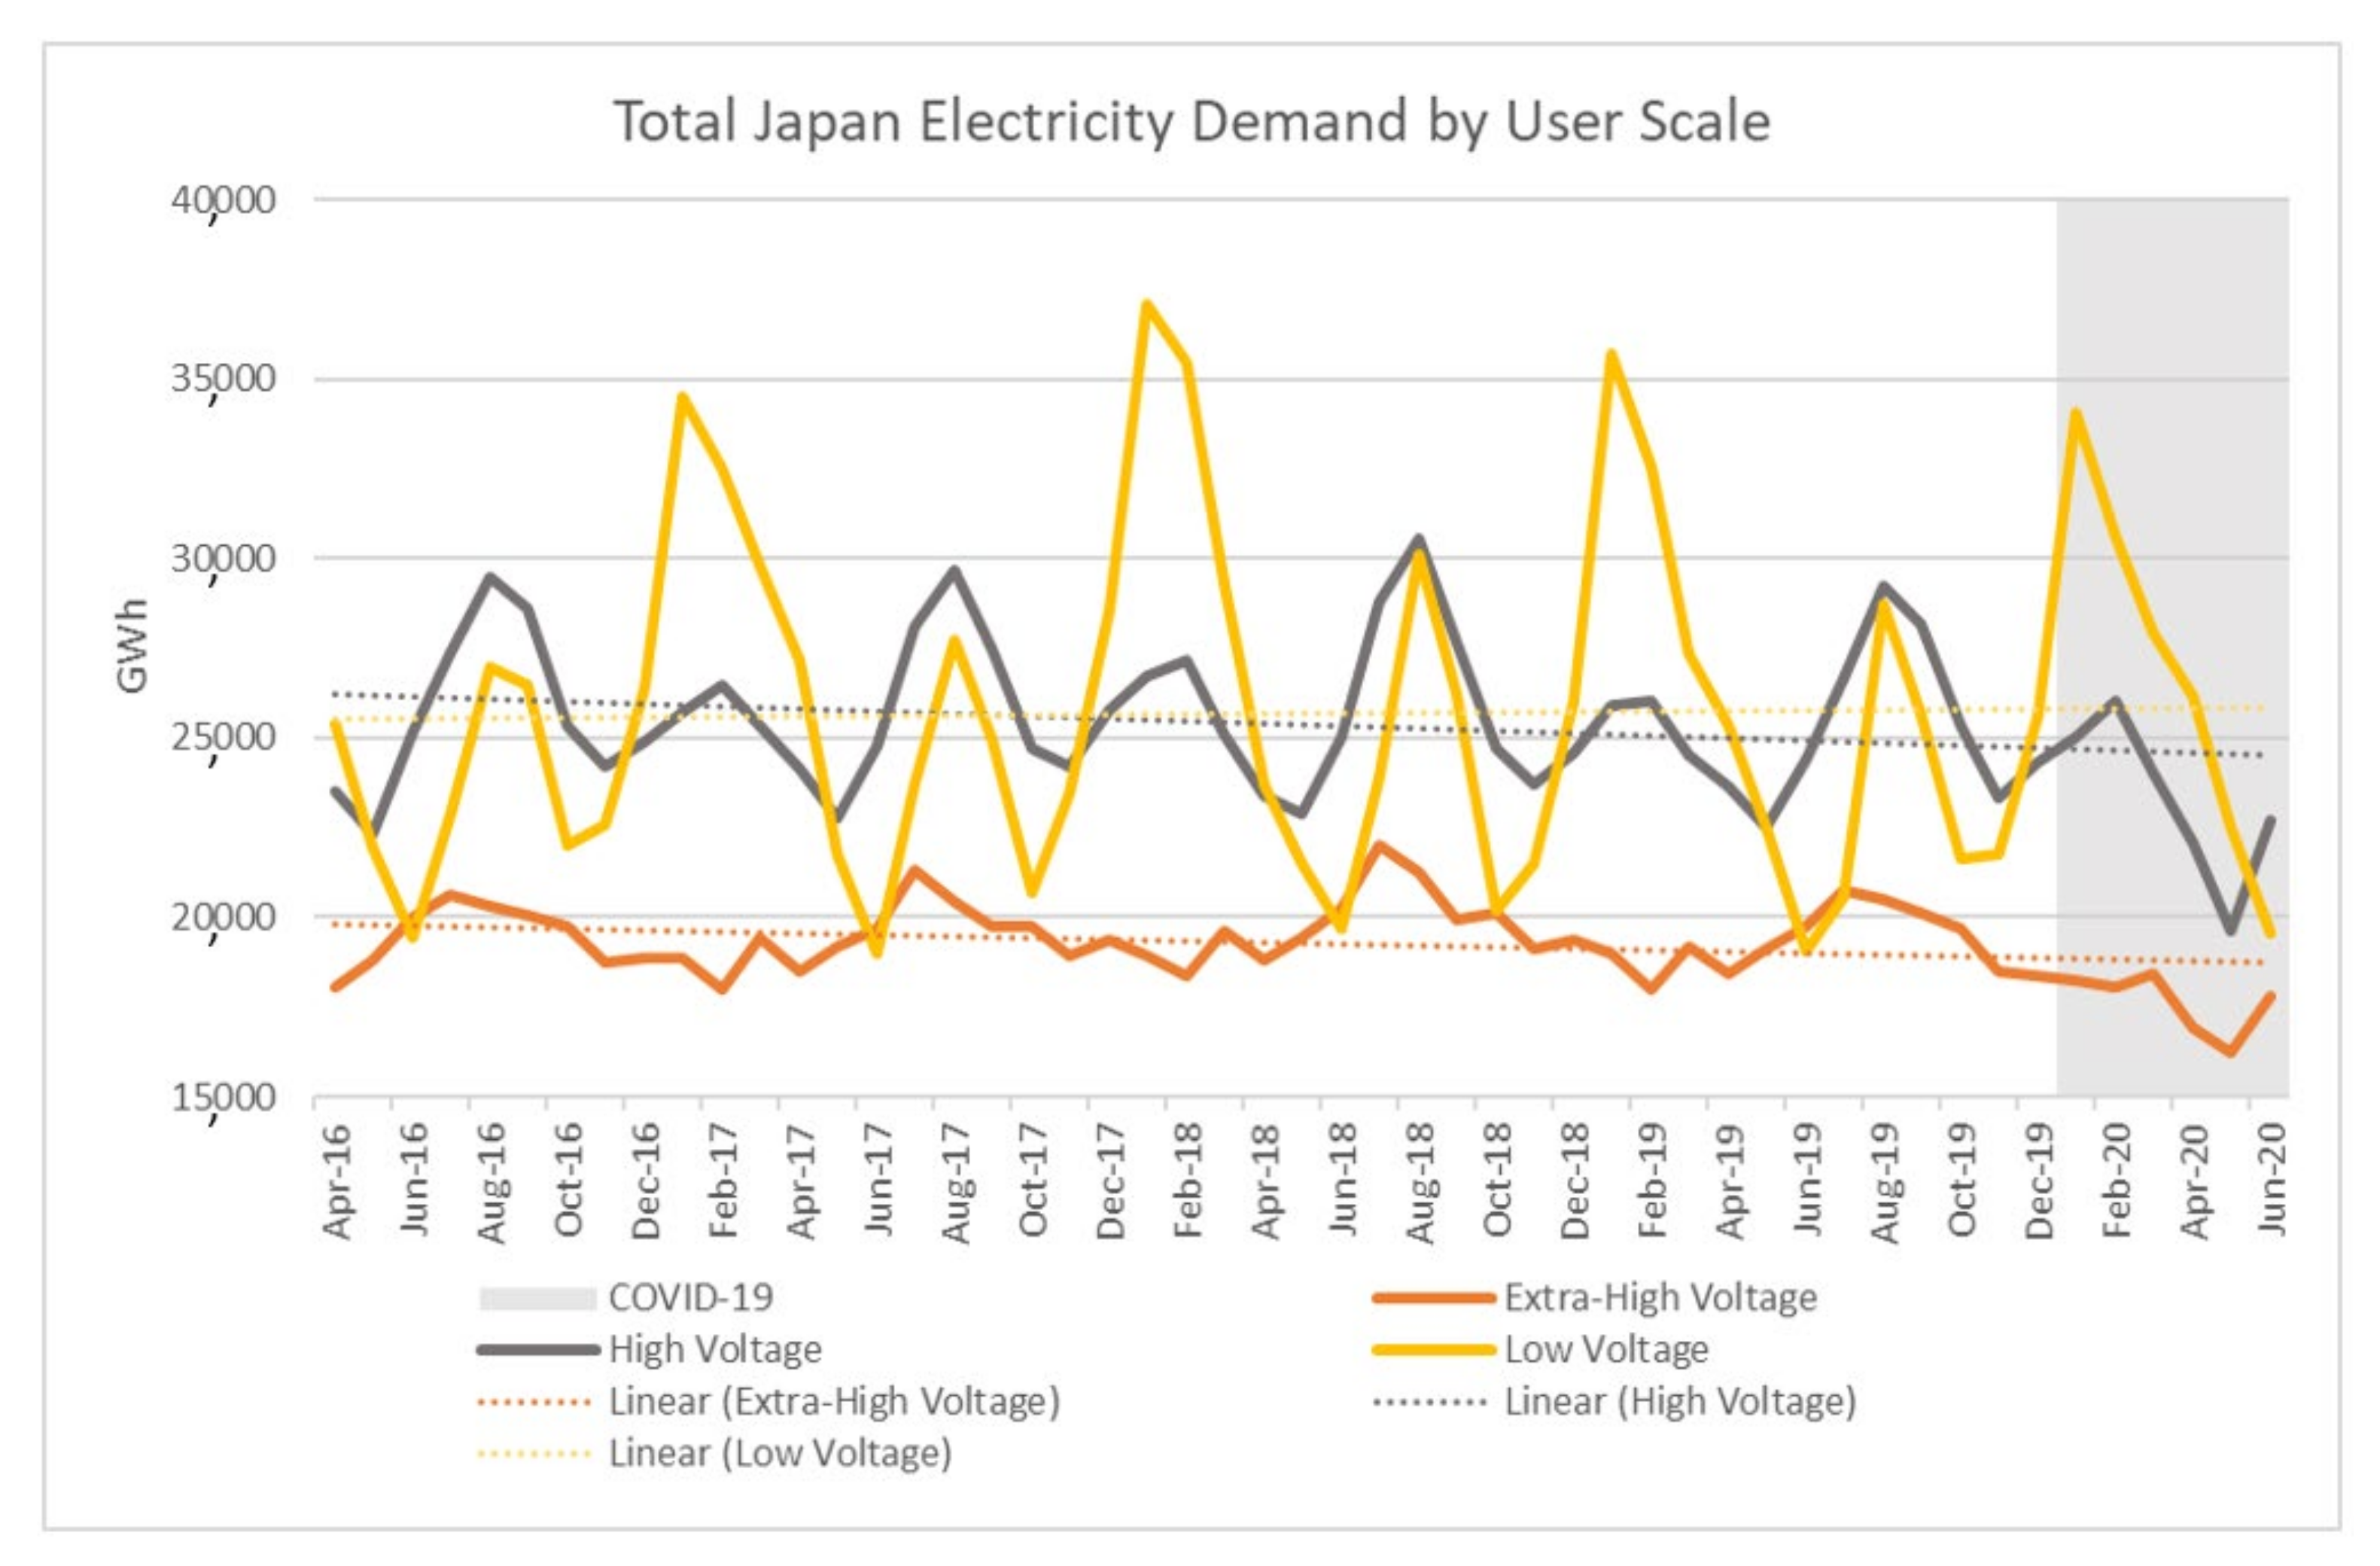
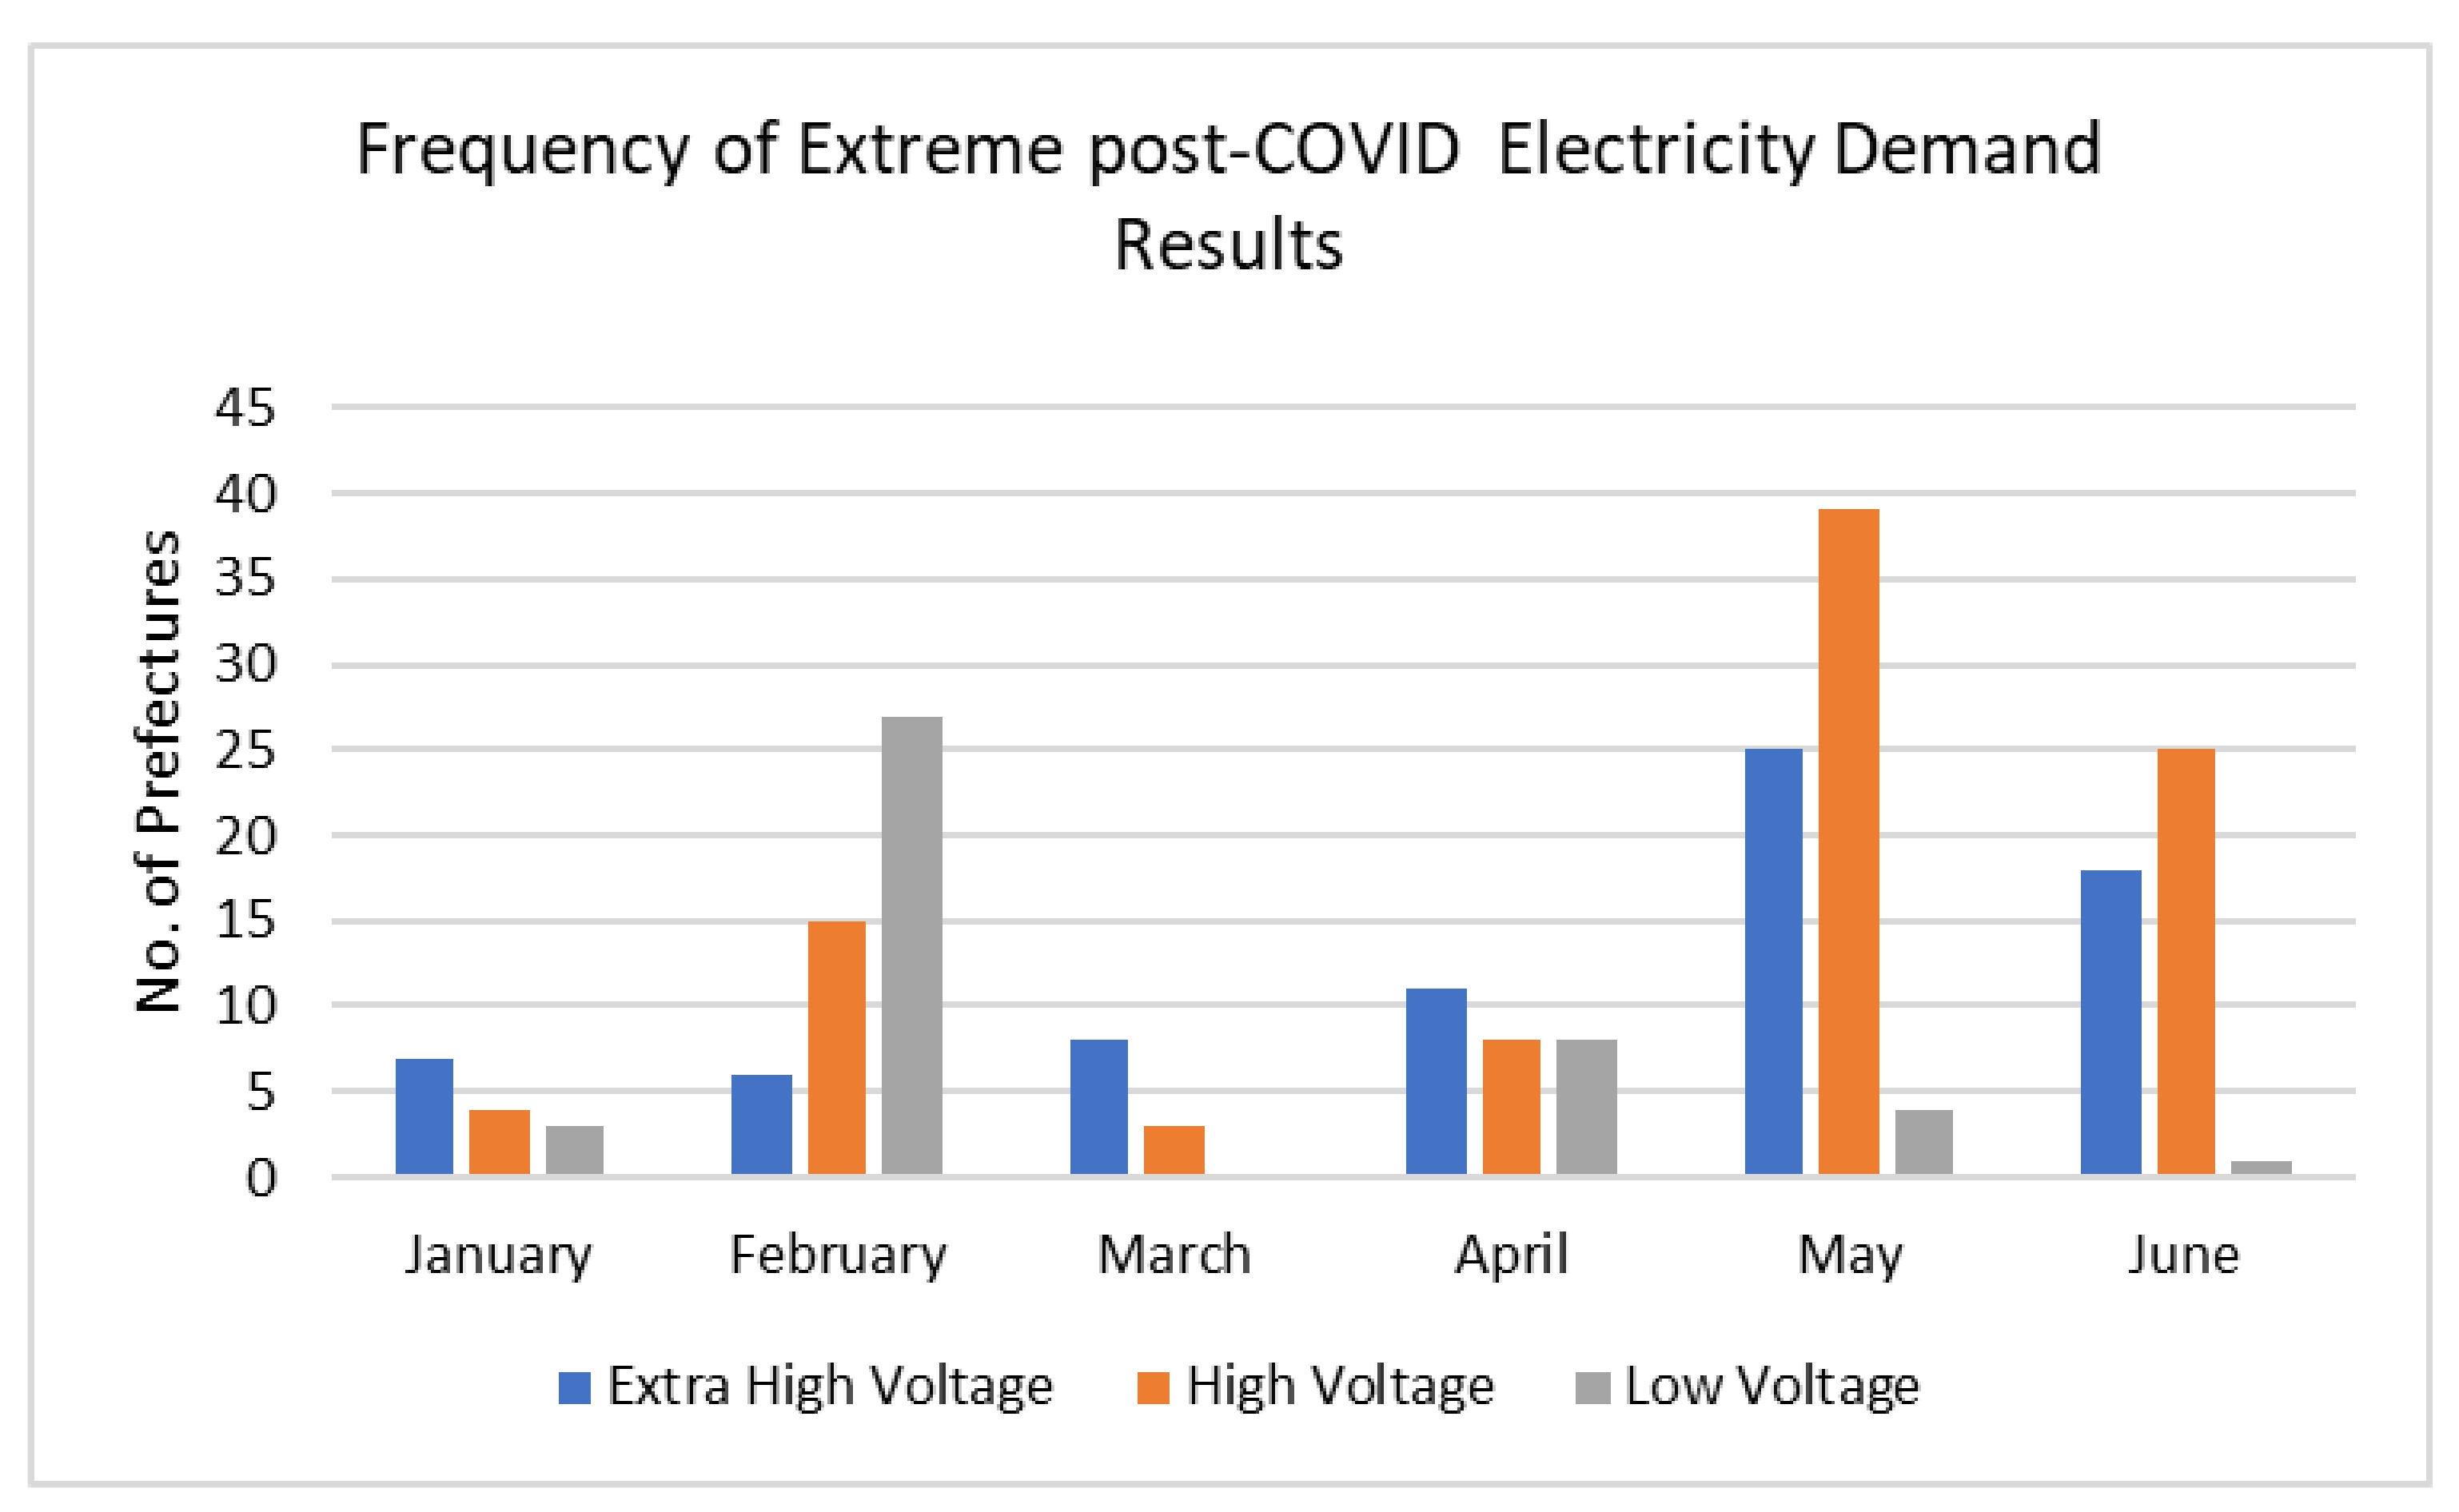
4.2. Electricity Demand Results

Review of total monthly electricity demand (Figure 2) for low voltage (50 kW draw for standard electricity needs), high voltage (500 kW or more), and extra-high voltage (2000 kW or more) shows strong seasonal trends with peaks in winter and summer. Smaller users show a primary January (winter) peak each year and a peak in August (summer) and an overall slight increasing trend. No deviation from the observed seasonal pattern was noticeable during the COVID-19 period.
This seasonal pattern is also seen in the high pressure (voltage draw of 500 kW or more) and to a lesser extent extra-high pressure (voltage draw of over 2000 kW) groups, typically for intensive manufacturing or industrial applications), with higher summer than winter peaks and slight downward trends in both cases. Visually, it appears that both the extra-high and high-pressure trends were impacted by COVID-19.
Charting these values against the forecast results (Figure 3) confirms these observations, with the total low voltage results being within the 95% forecast confidence interval. However, the high and extra-high voltage results are both below the lower threshold of the May forecast demand, with the high voltage result also exceeding the June prediction.
When assessed against their respective forecasts, individual prefecture results were consistent with these preliminary assessments (Figure 4). Both high and extra-high voltage monthly electricity demand trend towards an extreme (out of 95% confidence of the forecast result) in May and June, while the domestic demand shows outliers in February. Data are summarized in Table A6 of the Appendix A.
These incidents, however, remain in the minority. Of 282 potential events (six months over 47 prefectures), only 43 of the low voltage results were outside of the expected range. Observed results higher than forecast were seen in 13 (5%) events.
High voltage demand was below the expected value 33% of the time (94 times), and 75 (27%) of extra-high voltage events were beyond the confidence interval. Twelve of these events were higher than expected.
These occurrences are considered in greater detail in the following sections.

4.2.1. Low Voltage Results

Low voltage electricity demand in Japan between April 2016 and June 2020 constituted 37% of the total recorded demand for that period, making up the greatest demand sector. These users are typically domestic or small business clients.
The low voltage demand data were the most ordered and predictable of the three datasets, with all but one prefecture returning a 12-count seasonality result. Over the six months reviewed, a total of 43 results (15% of data points) were recorded outside of the predicted boundaries, 30% of which were higher than expected. This increase in demand occurred in Kanto in April and in the Hokkaido region in May. A decrease in demand was identified only in February, involving Chubu, Kansai, Chugoku, Shikoku, and Kyushu, which all draw from the 60 Hz grid. However, this reduction was not sufficient to produce a total net February result outside of the expected boundary.
Data are provided in Table A3 (Appendix A).

4.2.2. High Voltage Results

A roughly equal proportion of demand (36%) is made up of high-voltage clients, being those drawing above a typical 50 W draw but below extreme 2MW instantaneous electricity consumption. Users in this category typically include businesses and some commercial and moderate industrial applications.
For the high voltage electricity demand, the majority of prefectures demonstrated an annual seasonality, with a minority of areas (eleven) showing a biannual trend.
A third of results were outside of the predicted intervals, with only a single datapoint being larger than the expected. Of all the demand scale cohorts, the high voltage users presented the greatest number of individual results outside of the predicted intervals, with all events being smaller than the lower-predicted limit. The majority of these reductions were in May and April, producing national level reductions for those months. Data are provided as Table A4 in the Appendix A.

4.2.3. Extra-High Voltage Results

The extra-high voltage results are the most disordered and were produced by the smallest of the cohorts examined, making up 27% of total demand. Thirteen of the 47 prefectures reported having no identifiable seasonality, and another six showed a 13-month pattern. The remaining prefectures presented an expected 12- or 6-month seasonality. Extra-high voltage clients are typically intensive industrial applications, with relatively few individual users. This can inform the reactivity of the results, as each user has the potential to significantly alter trends and outcomes.
In comparison to the other demand-scales examined, 27% of individual prefecture monthly demand readings were outside of the equivalent forecast ranges, with increases seen in the earlier assessment months and clustering of decreases across regions seen in May and June (data provided as Table A5 in the Appendix A). This is both consistent with the high-voltage demand patterns and the overall disorder in the dataset.

4.3. Demand Total Results

Results from the amalgamation of the demand scales reflect the loss of granularity of data, with fewer results out of the predicted intervals (only 12%) and only two results above the expected upper boundary. While none of the months showed a statistically significant shift out of the expected bounds, there was instability seen in February, with some individual reductions in April and May 2020.

5. Discussion

Assessment of electricity demand over the GFC and March 2011 disasters indicated that there was a fundamental division between domestic and commercial/industrial scale users in their energy-use behaviors in response to disruption triggers. Whereas electricity use reduction for domestic users correlated with the disaster, larger scale clients appeared to reduce average monthly usage in response to the GFC. These clients may have focused more on self-generation and load ‘flattening’ (movement of operation to non-peak demand times), neither of which would be reflected in monthly consumption or offer long-term efficiency gains. Economic pressures and production decline may be more influential for this user group.
While the pathways of domestic electricity demand changes have been well researched, the underlying drivers or reasons for decision making remain uncertain. Correlations with requests for electricity conservation from government authorities indicates this is at least partially responsible (whether directly, or as a trigger for a more complex behavioral response). Given that some of the social cues for post-disaster energy savings were repeated for lockdown (such as the shutting down of electronic signage and closing of some businesses), the impact of these triggers on subconscious energy decision making is questionable.
These broader patterns of scalar electricity demand are re-enforced with the addition of the COVID-19 electricity data. Reductions to high and extra-high voltage demand are clustered in May and June of 2020, while domestic demand remained relatively stable, except for in February 2020 in the 60 Hz transmission zone. Regardless, the patterns and causes of any changes between the user groups were again identified as following different trends, again suggesting that different drivers and stimuli are relevant. Overall, the reduction in total generation was consistent with trends identified by the IEA for COVID-19 lockdown events [12].
The focus of higher-voltage demand reductions in May and June 2020 appears to be correlated with voluntary lockdown requests for the six-week period beginning 7 April and continuing into June. This persistence may be associated with depressed economic conditions or a slower wind-down/ramp-up model necessary for larger energy users with less flexible production timelines. Acceleration of this trend is likely with the more restrictive April/May 2021 lockdown for selected prefectures.
Interestingly, any increase in domestic electricity demand related to working from home was not statistically significant. The corresponding drop in mid-scale electricity demand would indicate an increased efficiency through telecommuting at a system level, consistent with results from similar research. These initiatives, therefore, hold value in mitigating electricity consumption, allowing capacity for high emissions-intense energy to be reduced. However, potential stresses on power grids from spatial changes in loading (especially in older or underdeveloped systems) must be taken into consideration [13].
The potential for energy savings from teleworking have been investigated in the past, showing mixed results; however, for Japan, it has been suggested that some 40% of jobs could be appropriate for teleworking and that modest energy reductions are feasible [29]. For these energy savings to be realized long term, work-from-home initiatives would need to be made permanent, so that offices could downsize and energy savings could be sustained [30]. At the global level, due to the pandemic, with a shift to teleworking initiatives and a reduction in overall mobility, a short-term reduction in CO2 emissions of 17% was realized; however, post COVID-19, even with the implementation of higher levels of work-from-home arrangements, this reduction is expected to drop to around 7% under optimistic estimates [31].

6. Conclusions

In summary, the study highlights the complexity of energy demand behavior and the importance of scalar and contextual trends in sociotechnical systems.
Overall, no evidence could be found to suggest significant changes in generation make-up were triggered by the COVID-19 disruption. Unlike other studies, which showed a reduction in fossil-based generation due to COVID-19 [32,33], this was not the case in Japan. The positioning of Japan within a wider energy transition narrative has potentially dominated these results. While there is some hope that the increased geopolitical pressure on fossil fuel imports to Japan, exacerbated by COVID-19, will lead to a push for higher levels of renewables in the economic rebuild, this is by no means guaranteed with various post-COVID-19 priorities around the globe [34,35].
The political context of and influence over the results cannot be discounted. It is possible that the ‘voluntary’ nature of the May 2020 lockdown in Japan resulted in slightly different changes to the energy demand profiles than seen in other studies. There is the potential, however, that the previous Japanese experience with the Fukushima disaster ‘primed’ residents to embed energy savings as either a crisis-response or normalized behavior, meaning domestic electricity demand did not show a statistically significant increase over the study period.
The variables of the studied disruption are unique. COVID-19 has challenged Japan’s sociotechnical systems in a different way than did the preceding disruptions. The GFC is recognized as an economic disruption, while the great Tōhoku earthquake and tsunami and subsequent Fukushima disaster may be framed as an environmental (or physical) disruption. The impacts of COVID-19 have been socially concentrated, with ‘lock down’ and social distancing interrupting traditional social networks and norms.
Previous electricity saving events have been the result of government direction and requests. Management of COVID-19 in Japan has to date relied largely on the same voluntary social conformity. These results both add to the growing scholarship on the potential for telework as a valid contributor to energy austerity and emissions reductions for climate mitigation. Perhaps more importantly, it also offers valuable commentary on transition dynamics.
The social disruption associated with the COVID-19 pandemic offers an opportunity to better understand the processes and influences of the changes in energy demand behavior in real time, both of which are critical components of system transition. While the arguments for transition as an economically and technically driven (protracted) event remain, examples such as the one documented here contradict this narrative, showing the powerful contributions of agency, social structures, and norms to these processes.

Author Contributions

Conceptualization, methodology, formal analysis, data curation, writing—original draft preparation, K.D.; writing—review and editing, A.C. and P.D. All authors have read and agreed to the published version of the manuscript.

Funding

This research was supported by an Australian Government Research Training Program (RTP) Scholarship.

Institutional Review Board Statement

Not applicable.

Informed Consent Statement

Not applicable.

Data Availability Statement

Data for this analysis were taken from publicly available datasets published by the Japan Agency for Natural Resources and Energy (ANRE) within the Ministry of Economy, Trade, and Industry (METI). These records are available from https://www.enecho.meti.go.jp/statistics/electric_power/ep002/results.html, accessed on 26 October 2020. The ANRE dataset for Electricity Demand by Prefecture is record 3-(2) in the series. The Power Generation Results is record 2-(1) in the series.

Conflicts of Interest

The authors declare no conflict of interest.

Appendix A

Table A1. Statistical assessment and function summary.
TestExplanationExcel Script/Function
SeasonalityData assessment to identify the length of any repetitive patterns within the historical data.FORECAST.ETS.SEASONALITY(Known Historical Values, Known Historical Timeline, No missing or unknown datapoints -0-)
Predicted Monthly DemandLikely future value based on an exponential smoothing algorithm.FORECAST.ETS(Forecast Month, Known Historical Values, Known Historical Timeline, Seasonality Result)
Confidence Interval of Predicted Monthly Demand95% of possible points are expected to fall within the range calculated.FORECAST.ETS.CONFINT(Forecast Month, Known Historical Values, Known Historical Timeline, 95% certainty, No missing or unknown datapoints -0-)
AssessmentAssesses if the actual value is inside or outside the range predicted by the forecast confidence interval.IF(AND(actual value<(predicted value + confidence interval),actual value>(predicted value-confidence interval)),”in range”, “out of range”)
Table A2. Actual and predicted electricity generation in Japan from January to June 2020.
Hydro GenerationThermal GenerationNuclear GenerationRenewable GenerationTotal Generation
Jan-20ActualGWh608469,22849235863111,171
PredictedGWh584072,24564076613114,506
Conf. Int.+/− GWh1841492513177529215
Feb-20ActualGWh629063,30450876653105,006
PredictedGWh504565,26666176781113,224
Conf. Int.+/− GWh1841492513587769289
Mar-20ActualGWh710659,08451328085102,449
PredictedGWh690360,69366077908107,419
Conf. Int.+/− GWh1841492513987999363
Apr-20ActualGWh857447,8894632989391,640
PredictedGWh863246,74962539014100,956
Conf. Int.+/− GWh1841492514378229439
May-20ActualGWh894642,152451810,38885,613
PredictedGWh963245,22859789605102,193
Conf. Int.+/− GWh1841492514768449514
Jun-20ActualGWh867550,3353941934195,739
PredictedGWh726849,02662168972107,067
Conf. Int.+/− GWh1841492515148659591
Table A3. Actual and predicted low voltage electricity demand in Japan from January to June 2020.
50 Hz60 HzTOTAL
HokkaidoTohokuKantoChubuKansaiChugokuShikokuKyushuOkinawa
Jan-20ActualGWh1646260810,2706152604122211194355235534,039
PredictedGWh1659249110,4626456614522631206368133834,702
Conf. Int.+/− GWh7020091548646514978321422725
Feb-20ActualGWh142422679858546651802041989307029630,592
PredictedGWh1368222010,3316043577322371112342930232,816
Conf. Int.+/− GWh7026792253846916485327422883
Mar-20ActualGWh129021558510505049141835975290229627,926
PredictedGWh129020758816516549421838978295028628,340
Conf. Int.+/− GWh7032092957947217792333423015
Apr-20ActualGWh112820358346475643471677855268330826,135
PredictedGWh108817627230450743411633818257330824,259
Conf. Int.+/− GWh7036593661547619099339423132
May-20ActualGWh108216876669410039971437797244331522,527
PredictedGWh99314456295365835931295734220830820,531
Conf. Int.+/− GWh70406943647479202104345423238
Jun-20ActualGWh75413766430332433021217658214437019,575
PredictedGWh74111745594308530601134612203236917,800
Conf. Int.+/− GWh70443951676483213110350423338
Table A4. Actual and predicted high voltage electricity demand in Japan from January to June 2020.
50 Hz60 HzTOTAL
HokkaidoTohokuKantoChubuKansaiChugokuShikokuKyushuOkinawa
Jan-20ActualGWh120121747445538240101536846230213825,034
PredictedGWh118822047611564341301571879238713025,743
Conf. Int.+/− GWh421184193242106639136131366
Feb-20ActualGWh183421537556550140771545820239713226,015
PredictedGWh116522547853585842681621829240012626,373
Conf. Int.+/− GWh421194403402126939146131419
Mar-20ActualGWh114220346973529039121483812225912724,031
PredictedGWh111621167229554440181525837226911724,770
Conf. Int.+/− GWh421204583532147239155131466
Apr-20ActualGWh94018486492483436311363738210113122,079
PredictedGWh105519406887517337561438750219513123,323
Conf. Int.+/− GWh421214753652167439164131508
May-20ActualGWh85116305714420632181209718197312119,641
PredictedGWh94718586658500236461352783213113822,515
Conf. Int.+/− GWh421224893762187639172131547
Jun-20ActualGWh91018006789489237221356849222514522,689
PredictedGWh93519597333541540021463846229915724,410
Conf. Int.+/− GWh421235033862207839180131583
Table A5. Actual and predicted extra-high voltage electricity demand in Japan from January to June 2020.
50 Hz60 HzTOTAL
HokkaidoTohokuKantoChubuKansaiChugokuShikokuKyushuOkinawa
Jan-20ActualGWh2561286549037103887146740716559718,255
PredictedGWh2471299559339504128148542314749018,688
Conf. Int.+/− GWh 31 101 412 383 274 171 36 130 7 1545
Feb-20ActualGWh2151265540438023943144540314709118,039
PredictedGWh2481265541939153967146340014078518,170
Conf. Int.+/− GWh 35 103 425 396 280 185 39 139 7 1609
Mar-20ActualGWh2961296558138263960142942615069618,415
PredictedGWh2481298569039324224150144714949018,923
Conf. Int.+/− GWh 39 105 437 407 286 198 41 148 7 1668
Apr-20ActualGWh2181209510133653749133540414559416,931
PredictedGWh2481276550939294032142943014449618,392
Conf. Int.+/− GWh 42 107 449 417 291 210 42 156 7 1722
May-20ActualGWh19611854935306336231235404146110416,206
PredictedGWh24813065826388441591468433150110818,933
Conf. Int.+/− GWh 45 109 460 427 297 221 44 164 7 1774
Jun-20ActualGWh21411895492347039661360432155111917,793
PredictedGWh24813195971400242691452442155111519,369
Conf. Int.+/− GWh 47 110 471 436 302 232 46 171 7 1823
Table A6. Actual and predicted total electricity demand in Japan from January to June 2020.
50 Hz60 HzTOTAL
HokkaidoTohokuKantoChubuKansaiChugokuShikokuKyushuOkinawa
Jan-20ActualGWh3103606823,20615,24413,93852242447750959077,328
PredictedGWh3104604222,84015,42513,85651652363730455676,655
Conf. Int.+/− GWh10029919269901140370198645515717
Feb-20ActualGWh3473568622,81914,76913,20050312213693752074,646
PredictedGWh2753568423,93515,52914,51452892448760751278,272
Conf. Int.+/− GWh100335206411351159385200664516094
Mar-20ActualGWh2728548421,06414,16512,78647472212666751870,372
PredictedGWh2671550322,57314,73513,65449332244699149173,794
Conf. Int.+/− GWh101364218012571175400203683516414
Apr-20ActualGWh2286509219,93812,95611,72743751998623953465,145
PredictedGWh2410496620,28813,25312,33244772049640053466,707
Conf. Int.+/− GWh102390228313641190413205701516699
May-20ActualGWh2129450317,31911,36910,83738811919587854058,374
PredictedGWh2207456019,70012,49111,76241961967604854963,479
Conf. Int.+/− GWh103414237814611203426207717516959
Jun-20ActualGWh1879436518,71111,68610,99039331939591963460,057
PredictedGWh1918436320,59612,64412,08142462006617463164,659
Conf. Int.+/− GWh104436246515501215438210733517201

References

  1. International Energy Agency. Global Energy Review 2020; IEA Publications: Paris, France, 2020; Available online: https://www.iea.org/reports/global-energy-review-2020 (accessed on 16 May 2021).
  2. D’Alessandro, K.; Dargusch, P.; Chapman, A. Disruption, Disaster and Transition: Analysis of Electricity Usage in Japan from 2005 to 2016. Int. J. Sustain. Energy Manag. 2021, 31, 143–160. [Google Scholar] [CrossRef]
  3. Wakiyama, T.; Zusman, E.; Monogan, J.E. Can a low-carbon-energy transition be sustained in post-Fukushima Japan? Assessing the varying impacts of exogenous shocks. Energy Policy 2014, 73, 654–666. [Google Scholar] [CrossRef]
  4. Murakoshi, C.; Nakagami, H.; Hirayama, S. Analysis of behaviour change due to electricity crisis: Japanese household electricity consumer behaviour since the earthquake. In ECEEE 2013 SUMMER STUDY: Rethink, Renew, Restart; Belambra Les Criques: Toulon, France; Hyères, France, 2013. [Google Scholar]
  5. Daggy, R.; Wakiyama, T.; Zusman, E.; Monogan, J.E. Analysing Drivers of Low Carbon Transitions in Post-Fukushima Japan: A Cross-City Comparison of Electricity Consumption. J. Comp. Asian Dev. 2015, 14, 137–170. [Google Scholar] [CrossRef]
  6. World Health Organization. Novel Coronavirus—Japan (ex-China). Available online: https://www.who.int/csr/don/16-january-2020-novel-coronavirus-japan-ex-china/en/ (accessed on 11 June 2020).
  7. Leonard, A.; Shibata, M.; Segawa, M. This Japanese Island Lifted Its Coronavirus Lockdown Too Soon and Became a Warning to the World. Time. 24 April 2020. Available online: https://time.com/5826918/hokkaido-coronavirus-lockdown/ (accessed on 8 June 2020).
  8. The Case of the Coronavirus 31 March 2020. Updates on COVID-19 in Japan. Available online: https://www.mhlw.go.jp/stf/seisakunitsuite/bunya/newpage_00032.html (accessed on 31 March 2020).
  9. The Tokyo Organising Committee of the Olympic and Paralympic Games. Olympic Games Postponed to 2021. Available online: https://tokyo2020.org/en/news/joint-statement-from-international-olympic-committee-and-tokyo2020#:~:text=In%20the%20present%20circumstances%20and,health%20of%20the%20athletes%2C%20everybody (accessed on 6 October 2020).
  10. Oshitani, H. The New Phase of Covid-19 Response in Japan (2020/7/13). 2020. Available online: https://www.mofa.go.jp/files/100074275.pdf (accessed on 28 September 2020).
  11. Nakamaru, R. State of Emergency Declared in Tokyo, Osaka Region as Virus Surges; Kyodo News: Minato City, Tokyo, 2021. [Google Scholar]
  12. International Energy Agency. Covid-19 Impact on Electricity; IEA: Paris, France, 2021. [Google Scholar]
  13. Ghenai, C.; Bettayeb, M. Data analysis of the electricity generation mix for clean energy transition during COVID-19 lockdowns. Energy Sources Part A Recover. Util. Environ. Eff. 2021, 1–21. [Google Scholar] [CrossRef]
  14. Chapman, A.; Tsuji, T. Impacts of COVID-19 on a Transitioning Energy System, Society, and International Cooperation. Sustainability 2020, 12, 8232. [Google Scholar] [CrossRef]
  15. Zhong, H.; Tan, Z.; He, Y.; Xie, L.; Kang, C. Implications of COVID-19 for the electricity industry: A comprehensive review. CSEE J. Power Energy Syst. 2020, 6, 489–495. [Google Scholar] [CrossRef]
  16. Ghiani, E.; Galici, M.; Mureddu, M.; Pilo, F. Impact on Electricity Consumption and Market Pricing of Energy and Ancillary Services during Pandemic of COVID-19 in Italy. Energies 2020, 13, 3357. [Google Scholar] [CrossRef]
  17. Carvalho, M.; Delgado, D.B.D.M.; De Lima, K.M.; Cancela, M.C.; Dos Siqueira, C.A.; De Souza, D.L.B. Effects of the COVID-19 pandemic on the Brazilian electricity consumption patterns. Int. J. Energy Res. 2020, 45, 3358–3364. [Google Scholar] [CrossRef]
  18. Ceylan, Z. The impact of COVID-19 on the electricity demand: A case study for Turkey. Int. J. Energy Res. 2021, 45, 13022–13039. [Google Scholar] [CrossRef] [PubMed]
  19. Jiang, P.; Van Fan, Y.; Klemeš, J.J. Impacts of COVID-19 on energy demand and consumption: Challenges, lessons and emerging opportunities. Appl. Energy 2021, 285, 116441. [Google Scholar] [CrossRef] [PubMed]
  20. Bahmanyar, A.; Estebsari, A.; Ernst, D. The impact of different COVID-19 containment measures on electricity consumption in Europe. Energy Res. Soc. Sci. 2020, 68, 101683. [Google Scholar] [CrossRef] [PubMed]
  21. Kuzemko, C.; Bradshaw, M.; Bridge, G.; Goldthau, A.; Jewell, J.; Overland, I.; Scholten, D.; Van de Graaf, T.; Westphal, K. Covid-19 and the politics of sustainable energy transitions. Energy Res. Soc. Sci. 2020, 68, 101685. [Google Scholar] [CrossRef] [PubMed]
  22. Brosemer, K.; Schelly, C.; Gagnon, V.; Arola, K.L.; Pearce, J.M.; Bessette, D.; Olabisi, L.S. The energy crises revealed by COVID: Intersections of Indigeneity, inequity, and health. Energy Res. Soc. Sci. 2020, 68, 101661. [Google Scholar] [CrossRef] [PubMed]
  23. Henry, M.S.; Bazilian, M.D.; Markuson, C. Just transitions: Histories and futures in a post-COVID world. Energy Res. Soc. Sci. 2020, 68, 101668. [Google Scholar] [CrossRef] [PubMed]
  24. Sovacool, B.K.; Del Rio, D.F.; Griffiths, S. Contextualizing the Covid-19 pandemic for a carbon-constrained world: Insights for sustainability transitions, energy justice, and research methodology. Energy Res. Soc. Sci. 2020, 68, 101701. [Google Scholar] [CrossRef] [PubMed]
  25. Agency for Natural Resources and Energy. Tōkei-hyō ichiran (List of Statistical Tables); 3-(2) Todōfuken betsu denryoku juyō jisseki (Actual Power Demand by Prefecture); 2020. Ministry of Economy, Trade and Industry: Tokyo, Japan. Available online: https://www.enecho.meti.go.jp/statistics/electric_power/ep002/results.html (accessed on 6 October 2020).
  26. Agency for Natural Resources and Energy. Tōkei-hyō ichiran (List of Statistical Tables); 2-(1) Hatsuden jisseki (Power Generation Results); 2020. Ministry of Economy, Trade and Industry: Tokyo, Japan. Available online: https://www.enecho.meti.go.jp/statistics/electric_power/ep002/index.html (accessed on 6 May 2021).
  27. Midford, P. The Politics of Nuclear Power Plant Restarts Versus Renewable Energy Promotion. In New Challenges and Solutions for Renewable Energy; International Political Economy Series; Midford, P., Moe, E., Eds.; Palgrave Macmillan: Cham, The Netherlands, 2021. [Google Scholar]
  28. Koppenborg, F. Nuclear Restart Politics: How the ‘Nuclear Village’ Lost Policy Implementation Power. Soc. Sci. Jpn. J. 2020, 24, 115–135. [Google Scholar] [CrossRef]
  29. Hook, A.; Court, V.; Sovacool, B.K.; Sorrell, S. A systematic review of the energy and climate impacts of teleworking. Environ. Res. Lett. 2020, 15, 093003. [Google Scholar] [CrossRef] [Green Version]
  30. Shimoda, Y.; Yamaguchi, Y.; Kawamoto, K.; Ueshige, J.; Iwai, Y.; Mizuno, M. Effect of telecommuting on energy consumption in residential and non-residential sectors. In Proceedings of the Building Simulation 2007, Beijing, China, 3–6 September 2007; Available online: https://www.aivc.org/sites/default/files/p653_final_0.pdf (accessed on 18 May 2021).
  31. Roston, E.; Rathi, A. Biggest Fall in Global Emissions Shows the Limits of Individual Action; Bloomberg Green: New York City, NY, USA, 2020; Available online: https://www.bloomberg.com/news/articles/2020-05-19/how-has-covid-19-affected-climate-change-co-emissions (accessed on 18 May 2021).
  32. Bashir, M.F.; Jiang, B.; Komal, B.; Bashir, M.A.; Farooq, T.H.; Iqbal, N.; Bashir, M. Correlation between environmental pollution indicators and COVID-19 pandemic: A brief study in Californian context. Environ. Res. 2020, 187, 109652. [Google Scholar] [CrossRef] [PubMed]
  33. Helm, D. The Environmental Impacts of the Coronavirus. Environ. Resour. Econ. 2020, 76, 21–38. [Google Scholar] [CrossRef] [PubMed]
  34. Rosenbloom, D.; Markard, J. A COVID-19 recovery for climate. Science 2020, 368, 447. [Google Scholar] [CrossRef] [PubMed]
  35. International Energy Agency. Put Clean Energy at the Heart of Stimulus Plans to Counter the Coronavirus Crisis. Available online: https://www.iea.org/commentaries/put-clean-energy-at-the-heart-of-stimulus-plans-to-counter-the-coronavirus-crisis (accessed on 13 May 2021).
Figure 1. Electricity generation in Japan from April 2016 to June 2020 by power source. Data from [26].
Sustainability 13 10836 g001aSustainability 13 10836 g001b
Figure 2. Electricity demand in Japan from April 2016 to June 2020 with annual trends. Electricity data from [25].
Sustainability 13 10836 g002
Figure 3. Actual and forecast post-COVID-19 monthly electricity demand in Japan by user scale. Electricity data from [25].
Sustainability 13 10836 g003
Figure 4. Instances of prefecture level electricity demand outside of the predicted range. Data from [25].
Sustainability 13 10836 g004
Publisher’s Note: MDPI stays neutral with regard to jurisdictional claims in published maps and institutional affiliations.

