Abstract
This study developed an integrated disaster risk assessment framework (IDRAF) to measure disaster risk at the local administrative boundaries in Malaysia. The proposed framework can enhance government effort for disaster risk reduction by implementing an integrated disaster risk framework and guiding decision makers to properly evaluate and analyze risk for mitigation, preparedness, and planning. The framework was developed, expanding from the multi-hazard spatial overlapping and Methods for the Improvement of Vulnerability Assessment in Europe (MOVE) theoretical framework. There are five significant phases to develop this framework: problem formulation, data collection, multi-hazard characterization, multi-dimensional vulnerability characterization, and weightage determination. The IDRAF proposed for Malaysia consists of eight hazards and six vulnerability dimensions, which consist of 16 factors (or vulnerability group) and 54 indicators. The multi-hazard characterization has two components: frequency of occurrence and spatial interaction. The multidimensional vulnerability characterization reduces vulnerability indicators using principal component analysis (PCA). Measuring integrated risk is an effective strategy at the local level or national level to assess the potential disaster impacts in detail and accurately. This study will offer explicit knowledge and boost community competency, creating techniques and tools to analyze various risk factors and vulnerability indicators for decision makers and practitioners.
1. Introduction
Malaysia is located in the Southeast Asian region, geographically outside the Pacific Rim of Fire. Therefore, it is not exposed to the ravages and devastation caused by severe natural severe disasters. However, the country is vulnerable to natural hazards such as floods, tsunami, landslides, storms, forest fires, seismic activity, and haze. According to the World Risk Report 2019, Malaysia is considered a high-risk country and ranked 71st among 180 countries in terms of the risks it faces [1]. In comparison, in a previous report from 2012, Malaysia was regarded as a medium-risk country and ranked 91st [2]. The change in Malaysia’s global risk classification is due to increased hazard exposure in Malaysia, especially over the last decade. In the previous 20 years, Malaysia has experienced 51 natural disaster events that have affected 3 million people and caused damage worth US$2 billion [3]. Given the increasing impact of natural disaster events, developing a national disaster risk assessment assists the understanding and identification of potential hazard threats that affect the vulnerability of the social system, the economy, and many institutions [4].
Currently, many countries have developed their own national disaster risk assessment. Disaster risk assessment is a strategy for disaster risk reduction that evaluates hazards and vulnerability. The importance of disaster risk assessment is its capacity to quantify and qualitatively determine the location of areas at risk [5]. The need for integrated risk assessment in Malaysia is growing due to the growing impact of extreme rainfall and monsoon floods [6], the increase of landslide occurrences due to rapid development [7], the rising numbers of forest fires due to drought, and stronger earthquake experiences [3]. These multiple types of disaster events have occurred more frequently in the last decade; consequently, there is a potential need for an integrated risk assessment tool that can be used by decision makers and that provides information for deciding mitigation and preparedness strategies [8].
This study intended to develop an integrated disaster risk assessment framework (IDRAF) for use at the local or national scale that focuses on the development of the framework. Malaysia is a developing, newly industrialized country. Many countries in Southeast Asia are similarly developing, so a local IDRAF is required. Each country needs to develop its own disaster risk assessment framework because its risk and vulnerability mitigation systems are intended to cater to localized disaster events, geographical locations, and regional conditions [9]. This paper’s central idea is to quantify risk using two components: multi-hazard and multi-vulnerability. Multi-hazard consists of the potential hazards to which a location is currently exposed or could be in the future, while multi-vulnerability consists of six dimensions of vulnerability: social, economic, physical, institutional, environmental, and cultural. IDRAF can be applied to assessing and identifying disaster high-risk areas [10], assisting land-use planning conducted by the authorities [11], and observing spatial relationships between different hazards [12]. This study provides clear guidelines and a methodology for developing a disaster risk assessment framework for use by stakeholders, government agencies, researchers, and decision makers.
1.1. Risk, Hazard, and Vulnerability Concept
Risk is defined as the possibility that illness, loss of life, or loss or harm to property will occur to a system, society, or population in a given period. It is also a calculated probability that is a function of danger, visibility, and capability [13]. Risk assessment begins with hazard assessment, accompanied by vulnerability estimations and values of the elements at risk (or exposure), all of which have led to the computation of risk as a function of hazard, vulnerability, and exposure [14]. Several frameworks have been developed to measure disaster risk. In 1979, the United Nations Disaster Relief Organization (UNDRO) and the United Nations Educational, Scientific and Cultural Organization (UNESCO) proposed combining risk, hazard, and vulnerability. The proposed framework described risk as encompassing three factors: risk, hazard, and vulnerability [15]. Cordona (1985) modified the UNDRO and UNESCO concept by defining risk as consisting of hazard and vulnerability, removing the exposure component. Thereafter, the concept of risk has expanded and evolved to incorporate hazard characteristics and newly emerging disciplines.
The main difference between the various disaster risk assessment concepts is the vulnerability component, which consists of different dimensions of interpretation. In comparison, the hazard component is quantified as either a single hazard or multi-hazard. In contrast, vulnerability components conceptualize various contexts such as public health, social sciences, ecology, economics, and other related fields. The two common IPCC approaches used in global disaster risk scales are the Index of Risk Management (INFORM) and the World Risk Index (WRI). There are three main risk components in the INFORM conceptual framework: hazards, vulnerability, and coping capacity [16]. Vulnerability in INFORM is categorized into two aspects: socio-economic features and vulnerable groups. However, in the WRI concept, vulnerability is extended to include coping capacity, which is defined as a social condition or system susceptible to hazard exposure and people’s ability to cope with and adapt to the adverse effects of hazards [2]. Several studies have adopted the WRI framework on far smaller levels (e.g., the national or local level) because the susceptibility, coping, and adaptive capacity components are practical, robust, and reliable for use in vulnerability assessment. However, Almeida et al. [17] reported several limitations due to data availability. The indicator used does not represent the complex reality of risk and limitation on local or micro-scales.
Malaysia’s disaster risk is accessible, and the flood hazard risk assessment is conducted by the Department of Irrigation and Drainage (DID). However, the framework focuses on damage assessment [18] instead of a multi-dimensional risk approach. Damage assessment measures direct and indirect losses after hazard events or creates future models, both of which support disaster risk management [19]. Several studies related to disaster damage assessment have been undertaken in Malaysia by Muhadi and Abdullah [20], Tam et al. [21], and Julien et al. [22]. In the last decade, the concept of disaster risk assessment has changed toward integrated disaster risk assessment (IDRA). The focus is shifting to analyzing the disaster risk faced by people, systems, and organizations through understanding concepts of susceptibility and capacity based on damage and loss assessment [23]. The newly integrated or multidimensional risk assessment could improve planning and emergency management [24]. As a result, integrated risk assessment aims to build a risk classification system that considers future conjoint and cascade effects [8].
Figure 1 shows the theoretical framework proposed in this study for a Malaysian IDRAF. It was adapted from the Methods for the Improvement of Vulnerability Assessment in Europe (MOVE). The MOVE framework aims to extend the disaster risk reduction viewpoint by adding new understanding to the interaction of coupling, adaptation, and resilience [25]. Several studies have adopted the MOVE framework because it highlights complex relationships of vulnerability and changes over time, and it is defined by non-linearity and location-specific influences [15]. This study proposes an integrated framework for assessing risk by associating multiple hazards and vulnerability dimensions. This proposed framework consists of two main components: multi-hazards and multi-dimensional vulnerability. The WRI approach described risk as overlapping of four components, exposure and vulnerability (susceptibility, adaptation, and coping component), while in this proposed framework is based on two components, hazard and vulnerability. However, in this study, exposure describes the geographical extents of the hazard event to society attributes including social, physical, cultural, environmental, institutional, and economic elements. Multi-hazards are multiple natural events threatening the same exposed elements over the same or different periods [26]. Meanwhile, the concept of multidimensional vulnerability refers to six dimensions: social, environmental, economic, physical, institutional, and cultural [27,28]. The following subsection explains the integrated risk terms involved in this framework.
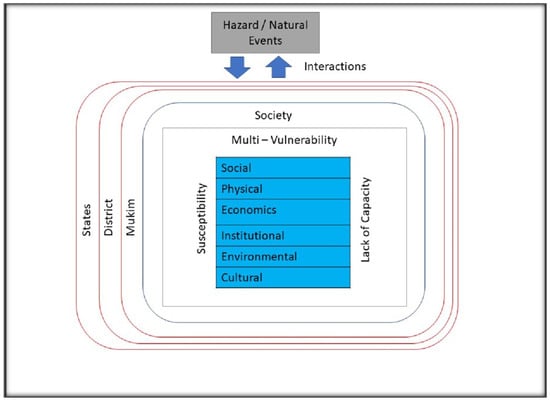
Figure 1.
Malaysia integrated disaster risk framework adapted from the MOVE framework [25].
1.1.1. Risk
Risk refers to a combination of multi-hazards and multidimensional vulnerability. Therefore, risk was defined as the elements that have probability to be affected, being fragile, and losses to potential risk due to hazards. Risk depends on the magnitude of hazards and their exposure to vulnerability dimension in the society.
1.1.2. Hazard
Hazard was defined as a possibility of occurrence of one or more hazards with or without interaction that could affect certain areas and might cause damage to social, physical, economic, institutional, environmental, and cultural aspects. The hazard was measured based on the frequency of hazard and spatial interaction.
1.1.3. Vulnerability
Vulnerability refers to a range of sensitivity aspects (social, economic, physical, institutional, environmental, and cultural) with the possibility of varying degrees of protection against diverse hazards. This includes susceptibility and capacity of elements to potential hazard situation. The six dimensions of vulnerability in this framework are described below.
- Social dimension. This refers to the human being, individual, or organization in the social system that is exposed to disaster. It includes those vulnerable or susceptible groups associated with the capacity to prevent, mitigate, and respond to the disaster.
- Economic dimension. Potential economic losses may be incurred by an individual or organization because of physical damage to assets and productive capacity. This dimension includes financial capacity, the individual and organization, financial planning and protection, and the local organization’s financial budget to prepare for and respond to future hazards.
- Physical dimension. Physical properties may be affected, such as built-up neighborhoods, utilities, and open spaces. The physical infrastructure may be prepared to adapt to and cope with potential hazards and have features such as communication and basic facilities.
- Institutional dimension. There is a risk of harm to governance structures, organizational structures, and the operation and direction of the formal legal process and informal customary laws. This dimension includes risk planning, health capacity, local institutional programs, and commitment capacity for disaster risk reduction.
- Environmental dimension. Both ecological and biophysical processes and their various roles are at risk of being harmed. It refers to the extent to which the ecosystem has degraded and environmental factors (pollution, land-use change) that could influence the affected area’s vulnerability.
- Cultural dimension. Intangible qualities, such as the meanings attached to objects, rituals, regular habits, and natural or urban environments, are at risk of being harmed. Therefore, it entails danger and risk awareness, vocabulary issues, and the impact of disaster management in instructional plans and services to foster a culture of protection and resilience.
1.1.4. Susceptibility
Susceptibility defines elements that are prone to harm and fragile when exposed to a hazard. In the MOVE framework, susceptibility and fragility were defined similarly with each element being independent of exposure [25].
1.1.5. Lack of capacity
This is defined as the limitation of elements exposed in terms of accessibility and utilization of the society resources in response to hazard events. It includes the community’s or organization’s ability to learn to adapt and increase resilience from past events for the future disaster events.
1.2. Disaster Management in Malaysia
Malaysia has been exposed to multiple types of hazards in recent years. There has been an increase in the number of affected areas due to extreme weather [4]. The National Disaster Management Agency (NADMA) is a federal agency that leads and coordinates disaster management via a Disaster Management and Relief Committee (DMRC) system [3]. This committee system was established in 2012, as documented in Directive No. 20, which outlined the policy and mechanisms for disaster management in Malaysia [29]. Ten agencies are part of this committee system: the Royal Malaysia Police (RMP), the Royal Malaysian Army, Local Authorities, the DID, the Public Works Department, the Social Welfare Department (SWD), NGOs, the Malaysia Civil Defense Force (MCDF), the Malaysian Meteorological Department, and international cooperation. According to Directive No. 20, disaster management is regulated according to three levels of disaster.
Level 1 disasters are handled by the District DMRC. The disasters managed at the district, mukim (sub-district), or village level are non-complex and under control. Level 2 disasters are handled by the State DMRC. The scale of such disasters involves two or more districts, and significant damage is caused to people and property. Meanwhile, Level 3 disasters are handled by the Federal DMRC when the complexity of the disaster is serious and affects a wide area. Directive No. 20 is an effective mechanism, but an improved, comprehensive, and integrated approach is required for hazard management (disaster reduction, assessment, and mitigation) [29].
Too few studies in Malaysia have investigated integrated disaster risk assessment in terms of risk assessment concepts, vulnerability, hazard assessment tools, and disaster risk reduction. In the last 7 years, there were 69 journal articles published in Scopus and Web of Science that were undertaken in relation to disaster risk assessment in Malaysia. Figure 2 shows the number of disaster risk assessments published from 2014 to 2020. Most studies focused mainly on a single risk component, either hazard or the vulnerability component. Only 14% of the studies considered both hazard and vulnerability. Overall, in terms of hazard type, floods have the most, with 45%, while the remaining studies referred to landslides (39%), earthquakes (3%), storms (4%), droughts (3%), coastal erosion (3%) and tsunamis (3%).
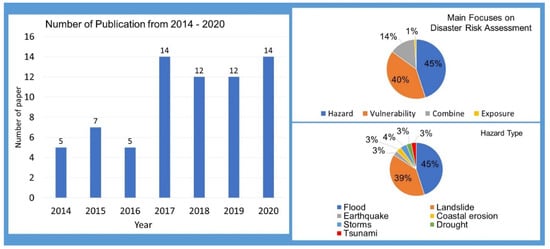
Figure 2.
Disaster risk assessment publication in Malaysia (excluding conference proceedings, guidelines, book chapters, non-peer-reviewed articles).
Malaysia has been affected by multiple types of hazards over the last two decades [3]. Disaster risk assessment provides information to urban planners and stakeholders in Malaysia so they can analyze the current effectiveness of planning and regulations. There is also a need for an IDRA that is applicable to multiple hazards at the local administrative levels in order to identify priority areas for disaster risk reduction (DRR) activities. In addition, vulnerability components involve an extensive number of indicators, which can be categorized into several dimensions: social, economic, physical, institutional, environmental, and cultural. Vulnerability assessment, based collectively on these dimensions, may provide further information for use in DRR strategies and action plans.
2. Materials and Methods
2.1. Study Area
The local scale or boundaries for the framework development consist of the Malaysian administrative boundaries. Malaysia comprises Peninsular Malaysia, Sabah, and Sarawak. Administration within Malaysia involves three main levels: State, District and Municipal (local authority), and Mukim (sub-district). There are 13 states in Malaysia and three federal territories (Kuala Lumpur, Putrajaya, and Labuan). The Chief Minister is the head of governance in each state. Each state consists of districts and municipalities, which have their own boundaries and functions. These are led by district officers at the district level, who serve as intermediaries for all government matters and programs.
Regarding disaster risk management at the district level, the district officer becomes the committee’s chief at this level, with the help of other government agencies, including the local authorities [30]. However, at the municipal level, the local authorities are responsible for management services, the treasury, development and landscape planning, and community and municipal services. In disaster risk management, the local authorities are involved in the post-disaster preparedness and response process. The Mukim is the minor administrative boundary, consisting of several villages or residential areas and led by the ‘Penghulu’ (the sub-district chief). The Penghulu is responsible for Mukim administrative matters, development, security, unity, religion, and welfare. They perform all duties as directed by the district officer and assistants.
2.2. Process for Developing an Integrated Disaster Risk Assessment Framework
Figure 3 illustrates the five-phase analysis approach used to develop a local IDRAF. For this study, the local scale refers to the Malaysia administrative boundary. Phase 1 started with the identification of risk components by identifying the natural hazard types in Malaysia, identifying vulnerability indicators based on six dimensions, and understanding the background of disaster risk management in Malaysia. Phase 2 consisted of data collection, achieved by distributing a questionnaire among Malaysia’s experts to identify and classify suitable vulnerability indicators. This involved gathering expert opinion on the interaction between one hazard and another. In phase 3, the multi-hazard characterization was conducted, in which historical event analysis determined the frequency of hazards and hazard interactions. Phase 4 involved multidimensional vulnerability characterization to identify the classification of the components and suitable vulnerability indicators, using Principal Component Analysis (PCA). The last phase, phase 5, identified the weightage for each vulnerability dimension, factor, and indicator.
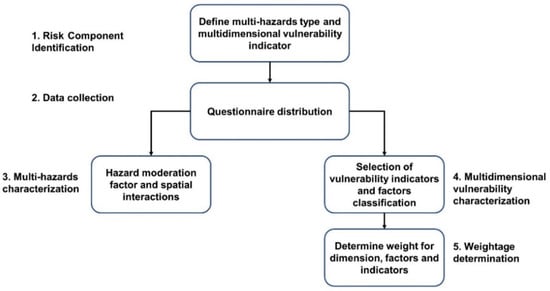
Figure 3.
Methodology for developing a local, integrated disaster risk assessment framework (IDRAF).
2.2.1. Risk Component Identification
This phase identified the relevant and critical indicators used in developing a local IDRA framework based on exposure to multiple natural disasters, vulnerability, and administrative boundaries. This phase involved the collection of information and data from relevant literature and insights from local experts working on risk evaluation and evaluating a local population’s needs and requirements. The research team classified the indicators based on a relevant dimension according to previous literature and experts’ opinions that were suitable to the country. The list of vulnerability indicators was identified based on various dimensions and evaluated by local experts.
2.2.2. Data Collection
In this phase, data collection was performed by distributing questionnaires to local experts, who, for this case study, were experts within Malaysia. The participatory-based method was used to consider expert opinions from various agencies involved in Malaysia’s disaster management. The purpose of the questionnaire was to obtain a level of agreement on the importance of each vulnerability indicator. Questionnaire surveys were distributed face-to-face or virtually to the respondents. A total of 64 respondents participated, belonging to different government agencies such as the Department of Irrigation and Drainage (DID), the National Disaster Management Agency (NADMA), and local authorities, as well as Non-Government Organizations (NGO).
The questionnaire consisted of two parts: the vulnerability assessment and the spatial interaction between hazards. Table 1 shows the questionnaire template (vulnerability), elaborating on the dimensions and indicators according to five agreement levels, with the highest score being 5 (strongly agree) and the lowest score being 1 (strongly disagree). In this part, the questionnaire survey focused on evaluating the critical indicators to include in the framework. More indicators were included in the questionnaire and are presented in Appendix A.

Table 1.
Questionnaire template for multi-vulnerability characterization.
In the first part, the expert answered by stating their level of agreement using a 5-point Likert scale, which would allow the importance of each dimension and indicator in this framework to be evaluated. The Likert scale was developed to calculate an ‘attitude’ that has been scientifically agreed upon and validated [31]. An attitude is characterized as a preferential way of behaving or reacting when a situation occurs that is based on a reasonably long-lasting arrangement of beliefs and ideas (centered on an entity, a topic, or a concept) acquired through social experiences [32]. The selection of indicators in each dimension was based on the relevance, representativeness, and the importance of the indicators according to Malaysia’s attribute situation. Eighty-seven indicators were chosen for expert judgment during the questionnaire (Appendix A). The indicators were included based on the existing literature and data available from the Malaysian government agencies.
In the second part, the experts determined the spatial interaction between one hazard and another. Table 2 shows the spatial interaction matrix, which considers the potential synergies between hazards. The interaction weight for experts to assign was on a scale of 0 to 1, with 0 meaning no interaction and 1 referring to maximum interaction. This method was adapted from Barrantes (2018), who defined each interaction by categorizing them into their particular value to retain the scale’s progressive logic and indicate the degree of spatial interaction [33]. The scale of classes for the spatial hazard interactions was as follows.
Table 2.
Questionnaire template for hazard spatial interactions.
- No spatial interaction (0): Hazard events unrelated in general, despite being in the same spatial location.
- The total negative effect (0–0.3): Hazard events have temporal links, but the total effects do not surpass their impacts.
- Transfer of energy from one event to another (0.3–0.6): One hazard event is transformed into another hazard event. For example, if drought occurs, this could cause the transfer of energy into a forest fire.
- Triggered (0.6–0.9): One hazard can trigger another hazard; for instance, a tsunami can cause a flood, or an earthquake could trigger a landslide.
- Conditional effect (0.9–0.1): The occurrence of one hazard is dependent on another, such as liquefaction, which depends on an earthquake.
2.2.3. Phase 3—Multi-Hazard Characterization
In phase 3, the hazard characterization was based on the hazard frequency and the spatial interaction between hazards. The hazard frequency was used to classify hazard types based on how frequently they occurred. Each hazard type was classified into one of three categories: high, medium, and low risk. The classification of hazard frequency was based on historical data provided by the Emergency Database (EM-DAT) [34]. Then, each category was assigned a moderation factor based on the hazard frequency. Another important dimension in the hazard assessment was the spatial interaction between hazards. This interaction depended on the experts’ knowledge and judgment. Therefore, all eight hazard types were analyzed by their frequency of occurrence in Malaysia and the spatial interaction between hazards.
2.2.4. Phase 4—Multidimensional Vulnerability Characterization
An essential aspect of the IDRAF was to determine suitable indicators based on expert opinion using PCA. A combination of dimensional reduction techniques, such as PCA and expert knowledge, could avoid indicators overlapping in the framework [35]. Vulnerability characterization was based on six different dimensions, with each dimension having its indicator. This study used principal component analysis (PCA) to reduce the number of indicators and classify how they are interrelated in each dimension. This study’s selection of vulnerability indicators was based on expert opinions and responses, in addition to analysis using the PCA method. Combining PCA and expert knowledge to reduce the number of indicators by classifying the indicators into a similar factor group was an appropriate way to describe vulnerability [36]. Figure 4 illustrates the five principal steps used in selecting the most suitable vulnerability indicators. The process started with a reliability test, moving to the use of descriptive statistics or frequency analysis, the selection of a rotation method, deciding the number of factors in each vulnerability dimension, and interpreting the results. All the processes involved in the vulnerability characterization were conducted using the statistical package SPSS software.
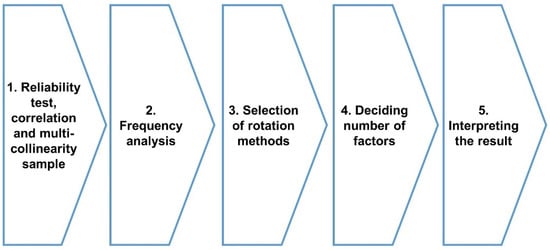
Figure 4.
Major steps for PCA.
The steps used in conducting PCA included determining the reliability and correlation, performing multicollinearity testing on the sample, selecting the rotation method, deciding on the number of factors based on the indicators, and exporting and interpreting the results. A reliability test is an important statistical tool used to determine the quality of the sample collected [37]. The reliability test for this study used Cronbach’s α (alpha). The acceptable value for a sample was above a 0.7 threshold [38]. The sample in this study was higher than this, with a value of 0.958, proving the reliability of the sample’s scale. The Kaiser–Meyer–Olkin (KMO) measure of sampling adequacy was used to check whether the sample size was sufficient and the research could continue with PCA. A sample is considered sufficient when the KMO is higher than 0.5 [39,40].
For the sample of expert judgment vulnerability indicators, the KMO equaled 0.72, which was acceptable. Finally, Bartlett’s test of sphericity was used to test the correlation among the sample’s capacities. If a test results in a value lower than 0.05, no patterned relationships existed among the vulnerability samples. For our expert opinion sample, the value of Bartlett’s test of sphericity was estimated to be at a low level of satisfaction as it was equal to 0.000. Multicollinearity was tested by determining the correlation matrix, which was estimated at 0.000022, proving that multicollinearity was not an issue within the sample.
Frequency analysis is a descriptive statistical approach that displays the number of occurrences selected by the expert respondents in this study [41]. In order to identify the significant level of the indicators, the mean value was calculated. The data from the expert survey were further analyzed using the average index model as the type of frequency analysis. A similar classification using rating approaches was proposed by Majid and McCaffer (1997) [42] and used for work performance assessments and green highway development. An indicator with a mean value of ≥3.50 would be selected to undergo the principal component analysis.
The next step was to conduct the rotation process. The rotation for the PCA solution used varimax rotation to simplify the relationships between the indicators [43]. The cumulative percentage of variance in each vulnerability dimension was then used to determine the number of factors in each dimension. The percentage of variance should be between 60% and 70%. After that, the indicators selected in each factor should have a rotation matrix of at least 0.6 load to correlate the factors. Factor loading is a correlation coefficient value between the indicators in the smaller group of factors [44].
2.2.5. Phase 5—Weightage Determination
Two common approaches for weightage determination are equal-weighted and unequal-weighted. Equal-weighted is more commonly used [45,46]. However, for this IDRAF development, the researcher proposed the use of different weight coefficient values for each vulnerability dimension, factor, and indicator. Thus, weighting the dimensions, factors, and indicators enabled the important dimensions, factors, and indicators to be quantified against one another [47]. The first task was to determine the weights for the six dimensions: social, economic, physical, institutional, environmental, and cultural. Equation (1) indicates how the weight was computed for each dimension. The scoring was based on the expert opinion scores identified in phase 2—data collection (Section 2.2.2).
where , and are the number of scores selected by the experts. The values 1 to 5 refer to the score or the agreement level with one (1) being strongly disagrees, and five (5) being strongly agrees (as in Table 1).
The weights’ calculation for the vulnerability factors and indicators was based on the mean and factor loading extracted during the PCA process. Equation (2) shows the formula used to calculate the indicators’ weights, while Equation (4) shows the formula used to calculate the factors’ weights.
is a weight of indicator value for an indicator and n is the total number of indicators where is a factor score value for an indicator , is the mean calculated using frequency analysis for the indicator , and is the factor loading calculated from the PCA process for an indicator , where is a correlation coefficient value between the indicators.
where is the weight of factor value for factor , is the sum value for factor score in factor , and is the number of factors.
3. Results
This section presents the results of the analysis using the methodology in Section 2. As stated in Section 2.2.2, the data collection was conducted through interviews with disaster management experts. Seventy-five questionnaires were distributed among the experts, but only 64 experts participated in this study. Table 3 shows the distribution of the experts based on their respective agencies. The highest participation came from those in the NADMA, which was the lead agency, with 17.2% of the total participation. Meanwhile, 12.5% came from both the DID and NGO agencies. The DID is the primary agency for flood management in Malaysia, while the NGOs involved in this study are all active in Malaysia disaster relief.
Table 3.
Type of agency contributing to data collection.
The RMP and district offices provided 10.9% each, while the local authorities and MCDF comprised 9.4% each. The district offices and local authorities are responsible for managing a disaster at the district and sub-district levels. The remaining 17.3%, or 11 respondents, came from other agencies such as the Selangor Disaster Management Unit (SDMU), Fire and Rescue Department Malaysia (FRDM), SWD, and Department of Mineral and Geoscience Malaysia (DMGM). The study’s use of various respondents from different agencies indicated that the data provided results that were significant, reliable, and practical to apply. This is because all the respondents were directly involved in the different stages of disaster risk management. Additionally, this use of respondents from different agencies was also important in contributing varying viewpoints, which enhanced the output of the questionnaire.
3.1. Multi-Hazard Framework
The multi-hazard component is based on the analysis from the methodology used in phase 2 and phase 3. This multi-hazard framework was adapted from the study by Barrantes (2018) but modified to suit Malaysian disaster conditions. The proposed model combines the standardized individual hazards in the areas, based on the spatial overlapping method. The mathematical formula for this model is presented in Equation (6).
where is the multi-hazard value is the standardized individual hazard value (0–1) of hazard , is the moderation factor hazard of hazard, according to the frequency of hazard occurrence, is the spatial interaction between hazard and , and max is the highest individual value natural hazard per pixel. The values of the individual hazards, are normalized in the range from 0 to 1 before they are combined with the spatial overlapping between hazards, .
Based on Equation (4), hazard assessment consisted of two components: the moderation factor for each hazard, , based on the frequency of occurrences in Malaysia, and the spatial interaction between hazards, . Each hazard, , was assigned a moderation factor, , according to the frequency of occurrence, based on Malaysia conditions. However, before each hazard was assigned a moderation factor, each hazard needed to be standardized based on the level of intensity. The highest intensity was 1, while areas with no disaster events were referred to as 0. Eight hazard types have historically occurred in Malaysia over the past 80 years. These hazards were all classified into three types: high, medium, and low frequency. The moderation factor was calculated according to the possibility of a hazard occurring in the last 80 years. The high-frequency class had a possibility of occurrence of once in 20 years and medium class events occurred once in 40 years, while low-frequency class occurrence was once in 80 years. The results for the hazard frequency classification and moderation factor are shown in Table 4.
Table 4.
Moderation factor assigned to each hazard class.
The possibility of spatial interaction between hazards was another factor that needed to be considered in the multi-hazard assessment. Therefore, in this study, the spatial interaction between hazards was determined based on expert judgment. The experts considered the potential occurrence of interaction between hazards in Malaysia, as discussed in Section 2.2. These interactions were classified from values of 0 to 1, with a 0 value meaning no interaction between hazards, even though they might occur in the same location. A value of 1 meant the occurrence of a particular hazard depended on another hazard. Based on expert judgment, six types of spatial hazard interactions existed between the eight types of disasters in Malaysia. Landslides could be triggered by earthquake hazards or the transfer of energy to floods. Meanwhile, flooding could occur because of a tsunami but a flood event does not depend on the occurrence of a tsunami. However, a tsunami occurs only with the occurrence of a large earthquake under the ocean floor. Another interaction involves long-term drought, which could trigger a forest fire, while a long-lasting fire could trigger haze in the surrounding area. The interaction HW was calculated only when spatial interactions occurred between two or more hazards. If a hazard occurred in different spatial areas, no relationship between hazards was listed. Experts gave the weight for possible spatial hazard interactions, as shown in Table 5.
Table 5.
The matrix with the weight of possible interaction between hazards.
3.2. Multidimensional Vulnerability Frameworks
3.2.1. Selection of Indicators
The multidimensional vulnerability framework developed in this study was expanded from the MOVE theoretical framework, as mentioned in Section 2. Six dimensions were included in this multidimensional vulnerability framework, with each dimension consisting of several indicators, classified into representative factors based on the PCA (refer to Table 6). The PCA process allowed a reduction in the number of indicators by combining them into factors. This demonstrates a statistical approach to visualizing each vulnerability indicator from a complex reality and to better understand the vulnerability indicators.
Table 6.
The composition of variance percentage principal factor in each dimension.
As stated previously, an initial total of 87 indicators were classified into six dimensions. The number of vulnerability indicators was then reduced based on expert judgment and the PCA process. Indicators with a frequency analysis mean value of more than 3.5 (the average index method used expert judgment; see Appendix A) were selected for use, leaving only 71 indicators to undergo the PCA process. In PCA, the numbers of indicators and factors were selected based on the composition of factors with eigenvalues greater than 1 or a minimum cumulative variance of at least 60% [48]. Factors with only one indicator were not included in the framework.
Therefore, every dimension contains a different number of factors, based on eigenvalues and cumulative variance percentage. All the factors selected in each dimension had eigenvalues of more than 1. The social, economic, physical, and institutional dimensions consisted of three factors, with 74.4%, 67.7%, 73.4%, and 78.7% of the cumulative variance, respectively. Meanwhile, the environmental and cultural dimensions consisted of two factors, with 68% and 74.9% of the cumulative variance, respectively. Table 6 shows the eigenvalues and variance percentage composition factors for each dimension. The next stage was to determine the selection of indicators for each factor in the vulnerability dimension. The criteria for selecting indicators were that only indicators with factor loading >0.6 were deemed usable and strong, while those with a factor loading of 0.3 to 0.49 were considered weak [49]. Overall, the number of indicators remaining in the study was 54, with each dimension having a different number of indicators.
Table 7 illustrates the list of vulnerability indicators identified in each dimension. From the 54 indicators, the social dimension consisted of nine indicators, followed by economic (10), physical (9), institutional (13), environmental (8), and cultural (7). The indicator loading indicates the correlation among the indicators that formed the factors. The indicator loading selection was based on loading >0.6, but if the indicators were available in more than one factor, the highest loading was selected. The PCA allowed a reduction in the number of indicators by combining them into factors. Moreover, a statistical approach was demonstrated, which visualized each vulnerability indicator from the complex reality to better understand this topic. After the classification of each indicator, the factors were named based on the type of indicator in the factor. Overall, 16 factors were produced, consisting of 54 indicators. The combination of factor loading was used to name the vulnerability indicators to express the vulnerability dimension factors [37]. In naming each factor, the research team attempted to incorporate the ideas within all the factors that correlated to indicators. For example, factor 1 in the social dimension was combined with a vulnerable group, while factor 1 in the physical dimension expressed the telecommunication indicator. An overview of the suggested factor names is shown in Figure 5.
Table 7.
Indicators with factor loadings >0.6 of the PCA analysis.
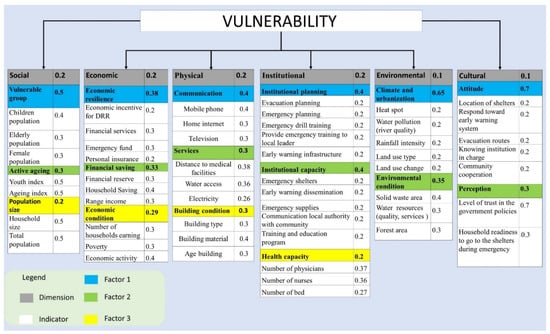
Figure 5.
The structure of vulnerability dimension with factor and indicators with the assigned weighted coefficient.
3.2.2. Weighted Indicators
The selected indicators created different effects on the vulnerability assessment in disaster risk assessment. Therefore, it was necessary to provide the weighting coefficient for each dimension, component, and indicator. In this study, the approach used for the dimension weighted coefficient involved the total score for a particular dimension set against the aggregated total dimension score. For the factor and indicators, the weighted coefficient determined the factor loadings since the area of each factor represented the proportion of the total unit variance in the indicators that was explained by the factors. The detailed equation used in the weighted coefficient calculation was discussed in Section 2.2.5. The weight for each vulnerability dimension was obtained by first computing the total score, which was the number of participants who chose the level of effects multiplied by its corresponding rating score. Then, the weight was computed by taking the total score of a particular dimension over the aggregated total score for all the dimensions. Determining the indicator weight was based on a multiplication of factor loading and mean to determine the factor score. Then, the weighted indicator was computed from the particular indicator factor score over the aggregated total factor score for all the indicators in the particular factor. Thus, for the weighted factor, the coefficient values were determined from the total indicator factor score for each particular factor over the aggregated total factor score in the dimension.
Figure 6 shows the results from the computation of the weighted coefficient for each factor, resulting from the expert opinion score and factor loading weighted score calculation. The weighted coefficient value ranged between 0 and 1. For the vulnerability dimension, four dimensions (social, economic, institutional, and physical) had value 0.2 weighted coefficients, with value 0.1 for the cultural and environmental dimensions. In each dimension, the first factor had the highest weighted coefficient compared to other factors because of the higher variance and number of indicators. If the number of indicators was more than two, there were multiple correlations between the indicators. A factor with only two indicators had a bilateral correlation.
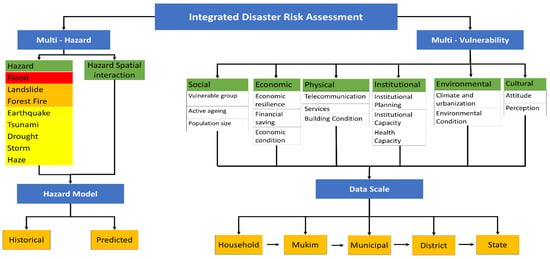
Figure 6.
IDRAF designed for different hazards’ models and administrative boundary scale.
Next, in the social dimension, the vulnerable group factor had the highest weighted coefficient value, 0.4, consisting of three indicators with differently weighted coefficient values. Meanwhile, the other two factors had the same value, 0.3, the same number of indicators, and the same indicators’ weighted coefficient. The attitude factors in the cultural dimension had the highest weighted coefficient compared to the other factors, but the cultural dimension weighted coefficient was lower than those for the social, institutional, physical, and economic dimensions. In this study, the weighted coefficient approach assigned the indicator weighted for every single indicator. The weight for each indicator demonstrates its importance to the vulnerability assessment. The different weighted values could result in an increase or decrease in the vulnerability assessment of the study area. The detailed dimensions, factors, and indicator weighted coefficient values computed are shown in Figure 5.
3.3. Integrated Disaster Risk Assessment Framework at the Local Level
Multi–hazards and multi–vulnerability components are essential in explaining and identifying the disaster risk in certain areas. A vital part of conducting an IDRA is data availability. Some data from government agencies were not available for specific indicators. Indicators, such as those for the cultural dimension, were often hard to obtain. In addition, some data were only available at a specific data scale. For example, economic incentive data might only be available according to district boundaries, instead of on a more localized administrative boundary scale. The development of an IDRA may be presented and visualized in map form. Therefore, data acquisition and analysis in disaster risk assessment requires geospatial data to provide better accuracy and detail. Localized and high-resolution spatial-scale mapping of risk assessment is important for screening risk areas and offering accessible output to decision makers, planners, and government agencies so that risk can be evaluated [10]. Figure 6 shows the IDRA framework, incorporating the multi-hazard and multidimensional vulnerability at the administrative boundary scale.
As stated earlier in the paper, the two main elements of the IDRAF are multi-hazards and multi-vulnerability. The two main components of multi-hazards are hazards and hazards’ spatial interaction. The hazard data for the hazard model were determined either from historical data or predicted models. In Malaysia, related government agencies provide data on a specific hazard, such as flood inundation maps. Records are produced and recorded by the Department of Irrigation and Drainage, while landslide data and records are produced and managed by the Department of Mineral and Geoscience (DMG). NADMA, as a leading agency in disaster risk management, plays a vital role in combining all the data in a multi-hazard assessment.
The multidimensional vulnerability assessment produced in this study contained six dimensions, with each dimension comprising indicators classified into several factors. At the local administration level in Malaysia, the data for vulnerability are available at different administrative boundary scales. There are five different scales: household, mukim, municipal, district, and state, with the smallest scale being household and the largest being state level. Data based on the household scale could offer a detailed multidimensional vulnerability assessment. However, the data scale preference depends on the availability of the data. For example, social and economic indicators are accessible at the Department of Statistics Malaysia, but data are provided only according to state or district levels. Information such as building conditions (a factor within the physical vulnerability dimension) and the cultural vulnerability dimension indicators are often not readily available. Therefore, alternative sources would be beneficial, such as the use of satellite and land-use data to evaluate and quantify building condition indicators. Such data may be obtained for Malaysia from government agencies, such as the Department of Survey Malaysia and Plan Malaysia. In addition, data sharing between government agencies is vital to making this framework effective.
Cultural dimension indicators are currently unavailable from the government, although they are needed in local research, as they could provide information about people’s behaviors and attitudes towards disaster risk reduction programs and policies [50]. The government should consider conducting vulnerability assessments on attitudes to and perceptions of risk, based on a household survey (as used in the Census survey). An alternative is to extract data from sources such as social media, newspapers, and search engines. Risk perception, especially in multi-hazard conditions, is a more effective reflection of a vulnerability assessment [51]. Although the framework presented in this study currently has limitations in terms of data scale, it undoubtedly benefits and improves local level planning and disaster management. Risk assessment and reducing vulnerability are effective measures to ensure disaster resilience and form part of the strategies planned for the local level [52]. An integrated risk approach could lead to greater effectiveness of risk mitigation and management methods, improved identification of action priorities, and reductions in costs and multi-risk losses [24].
4. Conclusions
The development of the IDRAF idea was driven by two main components, multi-hazards and multi-vulnerability, which were used to explain and interpret the definition of risk. Eight hazards with different spatial interactions were included to complete the framework based on historical disaster event data and expert judgment. A multi-hazard assessment is appropriate for areas exposed to multiple types of hazards. The components were expanded from the MOVE theoretical framework for multidimensional vulnerability assessment and analyzed through expert judgment and PCA. From the multidimensional vulnerability characterization, 54 indicators were selected from a total of 86 and placed into six dimensions. The PCA reduced the indicators by dividing them into several factors for each dimension. Overall, each dimension, factor, and scale was assigned a weighted coefficient value. The development of this IDRA for risk reduction was designed for local assessment and conditions in Malaysia.
A basic limitation of this IDRAF involved the data for determining historical disaster events in Malaysia because it allocates significant or major events for inclusion in the database. Meanwhile, differences might be found between disaster management in Peninsular Malaysia compared with Sabah and Sarawak, because the latter states have greater autonomy than the states in Peninsular Malaysia. Another limitation is the data availability, in terms of readiness and scale, for use in multidimensional vulnerability assessment. The choice of data scale was based on the availability of data, with some available at the household level and some potentially available at the state level. However, if the data at multiple scales are available in the long term, detailed assessment could be conducted at a multi-level scale with more authentic situations. Furthermore, this approach requires a higher degree of cooperation between governmental agencies, especially those involved in disaster risk management.
The development of this framework is essential for the local government to use in constructing disaster risk reduction strategies and policies, which should consider multiple hazards with different dimensions of vulnerability. Mainstreaming the integrated assessment framework could be difficult but it would contribute to all aspects of the disaster management cycle. Despite the limitations of this framework approach, having integrated risk information means the authorities from the local to national levels could implement their disaster management programs for mitigation, preparedness, response, and recovery. As an overall conclusion, it is hoped that this framework will provide inputs to the government and assist in developing a more comprehensive approach for multi-disaster risk management in Malaysia.
Author Contributions
M.W.A.R. and N.E.A. were in charge of the research with respect to conceptualization, literature review, and methodology. H.M.Y., Z.Y. and S.M.T. contributed to writing, reviewing, and editing the questionnaire design and data collection. Z.Y. and N.E.A. were in charge of the project administration. All authors have read and agreed to the published version of the manuscript.
Funding
The authors would like to state their appreciation for the funding received from the Malaysian Ministry of Education under the Fundamental Research Grant (FRGS) (FRGS/1/2018/WAB05/UTM/02/6) [R.J130000.7851.5F032], UTM Fundamental Research Grant [Q.J130000.2551.20H75], Malaysia Research University Network Grant [R.J130000.7851.4L897], the special MJIIT grant [R.J130000.7722.4J282], and the Malaysian Ministry of Education for GUP 2018 grant [QJ130000.2522.19H68].
Institutional Review Board Statement
Not applicable.
Informed Consent Statement
Not applicable.
Data Availability Statement
Provided on Appendix and result produce showing in the manuscript.
Acknowledgments
The authors would like to acknowledge the support from UTM ZAMALAH for the scholarship. The authors would also like to thank all government agencies and NGOs for participating in this study.
Conflicts of Interest
The authors declare no conflict of interest. The funding organization had no role in the design of the study or in the collection, analyses, or interpretation of data. The funding organization was not involved in drafting the manuscript or in the decision to publish the results.
Appendix A
Table A1.
List of indicators with Mean values.
Table A1.
List of indicators with Mean values.
| Indicator | Mean | Indicator | Mean |
|---|---|---|---|
| Social Indicator | Institutional | ||
| Female population | 4.53 | Early warning infrastructure | 4.50 |
| Children population | 4.69 | Emergency planning | 4.37 |
| Older population | 4.71 | Evacuation planning | 4.35 |
| Youth index | 3.56 | Emergency drill training | 4.39 |
| Ageing index | 3.58 | Provide emergency planning to community leader | 4.08 |
| Total population | 4.53 | Training and education programs | 4.35 |
| Average household size | 3.90 | Early warning dissemination | 4.42 |
| Density | 4.81 | Emergency supplies | 4.52 |
| Person with disability | 4.35 | Emergency shelters | 4.47 |
| Male population | 4.16 | Regular communication by local government with community | 4.37 |
| Middle age population | 4.19 | Number of physicians | 4.71 |
| Population growth | 3.02 | Number of nurses | 4.58 |
| Education level | 3.02 | Number of hospital beds | 3.71 |
| Literacy rate | 3.16 | Critical infrastructure protection measure | 3.71 |
| Rate of birth | 3.16 | DRR in land use planning policies | 3.63 |
| Rate of death | 3.08 | Adequate staff during emergencies | 3.71 |
| Foreign population | 3.16 | Local authority involvement in DRR planning | 3.47 |
| Economic | DRR in environmental planning policies | 3.45 | |
| Local authority emergency fund | 3.95 | Local authority knowledge in DRR | 3.95 |
| Financial provided by DRR | 3.87 | Physical | |
| The economic incentive for DRR | 3.94 | Pay television channel | 4.13 |
| Saving | 4.35 | Internet service | 4.13 |
| Range income | 4.53 | Mobile phone communication | 4.40 |
| Financial reserve (federal government to local authorities) | 4.56 | Electricity access | 4.23 |
| Economic activity | 4.26 | Water access | 4.35 |
| Percentage of households below the poverty level | 4.02 | Distance to medical facilities | 4.50 |
| Number of earning members in the household | 4.11 | The average age of the house | 4.08 |
| Properties’ insurance | 4.26 | Building materials | 3.94 |
| Unemployment rate | 4.35 | Building type | 3.76 |
| GINI coefficient | 3.26 | Road damage | 4.5 |
| GDP income | 2.76 | Damage based on land use | 4.35 |
| Personal insurance | 4.31 | Number of schools | 4.32 |
| Environmental | Distance to evacuation centres | 4.6 | |
| Land-use change | 4.05 | Government building | 4.35 |
| Rainfall intensity | 4.23 | Access to sanitization | 3,26 |
| Land use | 4.63 | Cultural | |
| River quality pollution | 4.27 | Respond towards early warning system | 4.63 |
| Forest area | 4.00 | Location of shelters | 4.69 |
| Water resources’ quality | 4.26 | Evacuation routes | 4.65 |
| Solid waste area | 4.19 | Knowing the institutions in charge of the emergency management | 4.42 |
| Air quality | 3.72 | Community cooperation when facing disaster | 4.39 |
| Environmental sensitivity | 3.45 | Level of trust in DRR programs and policies | 4.21 |
| Humidity | 3.06 | Households not willing to go to a shelter | 4.23 |
| Soil type | 2.86 | Disaster experience | 4.65 |
| Heat spot | 4.35 | Cultural conservation area | 3.45 |
| - | Believe in indigenous knowledge | 3.26 | |
References
- Radtke, K.; Day, J.; Forster, T.; Himmelsbach, J.; Korte, L.; Mucke, P. World Risk Report 2019 Focus: Water Supply. 2019. Available online: https://reliefweb.int/sites/reliefweb.int/files/resources/WorldRiskReport-2019_Online_english.pdf (accessed on 15 March 2020).
- Alliance Development Works. World Risk Report: Environmental Degradation and Disaster. 2012. Available online: https://www.droughtmanagement.info/literature/UNU_world_risk_report_2012_2012.pdf (accessed on 15 March 2020).
- CEDMHA. Malaysia Disaster Management Reference Handbook. Center for Excellence in Disaster & Humanitarian Assistance. 2019. Available online: http://reliefweb.int/map/chile/chilelocation-map-2013. (accessed on 2 April 2020).
- OECD. The Changing Face of Strategic Crisis Management. OECD Reviews of Risk Management Policies. 2015. Available online: https://www.oecd-ilibrary.org/governance/the-changing-face-of-strategic-crisis-management_9789264249127-en (accessed on 10 July 2019).
- Smith, K. Environmental Hazards: Assessing Risk and Reducing Disaster, 5th ed.; Routledge: London, UK; Taylor & Francis Group: Oxford, UK, 2013; pp. 1–478. [Google Scholar]
- Ziarh, G.F.; Asaduzzaman, M.; Dewan, A.; Nashwan, M.S.; Shahid, S. Integration of catastrophe and entropy theories for flood risk mapping in peninsular Malaysia. J. Flood Risk Manag. 2020, e12686. [Google Scholar] [CrossRef]
- Abdullah, C.H. Landslide risk management in Malaysia. Disaster Manag. Hum. Health Risk III 2013, 133, 255–265. [Google Scholar]
- Komendantova, N.; Mrzyglocki, R.; Mignan, A.; Khazai, B.; Wenzel, F.; Patt, A.; Fleming, K. Multi-hazard and multi-risk decision-support tools as a part of participatory risk governance: Feedback from civil protection stakeholders. Int. J. Disaster Risk Reduct. 2014, 8, 50–67. [Google Scholar] [CrossRef] [Green Version]
- Nguyen, K.A.; Liou, Y.A.; Terry, J.P. Vulnerability of Vietnam to typhoons: A spatial assessment based on hazards, exposure and adaptive capacity. Sci. Total Environ. 2019, 682, 31–46. [Google Scholar] [CrossRef] [PubMed]
- Tate, E.; Cutter, S.L.; Berry, M. Integrated multihazard mapping. Environ. Plan B Plan Des. 2010, 37, 646–663. [Google Scholar] [CrossRef] [Green Version]
- Sharma, A.; Miyazaki, H. Multi-hazard risk assessment in urban planning and development using AHP. Int. Arch. Photogramm. Remote Sens. Spat. Inf. Sci.-ISPRS Arch. 2019, 42, 363–371. [Google Scholar] [CrossRef] [Green Version]
- Gallina, V.; Torresan, S.; Critto, A.; Sperotto, A.; Glade, T.; Marcomini, A. A review of multi-risk methodologies for natural hazards: Consequences and challenges for a climate change impact assessment. J. Environ. Manag. 2016, 168, 123–132. Available online: https://www.sciencedirect.com/science/article/pii/S0301479715303650 (accessed on 6 April 2019). [CrossRef] [PubMed]
- UNISDR. National Disaster Risk Assessment: Governance System, Methodologies, and Use of Results. Consultati; Safaie, S., Ed.; United Nation Office for Disaster Risk Reduction (UNISDR): Geneva, Switzerland, 2017; pp. 1–81. [Google Scholar]
- UNISDR. 2009 UNISDR Terminology on Disaster Risk Reduction; United Nation Office for Disaster Risk Reduction (UNISDR): Geneva, Switzerland, 2017; pp. 1–35. Available online: https://www.unisdr.org/we/inform/terminology (accessed on 20 December 2018).
- Hernández, M.L.; Carreño, M.L.; Castillo, L. Methodologies and tools of risk management: Hurricane risk index (HRi). Int. J. Disaster Risk Reduct. 2018, 31, 926–937. [Google Scholar] [CrossRef]
- INFORM. INFORM Report 2019. Available online: https://reliefweb.int/sites/reliefweb.int/files/resources/Inform%202019%20WEB%20spreads.pdf (accessed on 6 April 2021).
- Almeida, L.Q.; de Araujo, A.M.S.; de Welle, T.; Birkmann, J. DRIB Index 2020: Validating and enhancing disaster risk indicators in Brazil. Int. J. Disaster Risk Reduct. 2020, 42, 101346. [Google Scholar] [CrossRef]
- Department of Irrigation and Drainage Malaysia. Flood Damage Assessment of 26 April 2001 Flooding Affecting the Klang Valley and the Generalised Procedure and Guidelines for Assessment of Flood Damages; Department of Irrigation and Drainage: Kuala Lumpur, Malaysia, 2003; Volume 2. [Google Scholar]
- Wu, Z.; Lv, H.; Meng, Y.; Guan, X.; Zang, Y. The determination of flood damage curve in areas lacking disaster data based on the optimization principle of variation coefficient and beta distribution. Sci. Total Environ. 2021, 750, 142277. [Google Scholar] [CrossRef]
- Muhadi, N.A.; Abdullah, A.F.; Vojinovic, Z. Estimating Agricultural Losses using Flood Modeling for Rural Area. MATEC Web Conf. 2017, 103, 04009. [Google Scholar] [CrossRef] [Green Version]
- Tam, T.H.; Ibramhin, A.L.; Rahman, M.Z.A.; Mazura, Z. Flood loss assessment in the Kota Tinggi. In IOP Conference Series: Earth and Environmental Science; IOP: London, UK, 2014. [Google Scholar]
- Julien, P.Y.; Ghani, A.A.; Zakaria, N.A.; Abdullah, R.; Chang, C.K. Case Study: Flood Mitigation of the Muda River, Malaysia. J. Hydraul. Eng. 2010, 136, 251–261. [Google Scholar] [CrossRef] [Green Version]
- Strunz, G.; Post, J.; Zosseder, K.; Wegscheider, S.; Mück, M.; Riedlinger, T.; Mehl, H.; Dech, S.; Baumert, N.; Harjono, H.; et al. Tsunami risk assessment in Indonesia. Nat. Hazards Earth Syst. Sci. 2011, 11, 67–82. [Google Scholar] [CrossRef] [Green Version]
- Anna, S.; Nadejda, K.; Arnaud, M. Mainstreaming Multi-Risk Approaches into Policy. Geosciences 2017, 7, 129. Available online: http://www.mdpi.com/2076-3263/7/4/129 (accessed on 10 July 2021).
- Birkmann, J.; Cardona, O.D.; Carreño, M.L.; Barbat, A.H.; Pelling, M.; Schneiderbauer, S.; Kienberger, S.; Keiler, M.; Alexander, D.; Zeil, P.; et al. Theoretical and Conceptual Framework for the Assessment of Vulnerability to Natural Hazards and Climate Change in Europe: The MOVE Framework. Assessment of Vulnerability to Natural Hazards: A European Perspective; Elsevier: Amsterdam, The Netherlands, 2014; pp. 1–19. [Google Scholar] [CrossRef]
- Carpignano, A.; Golia, E.; Di Mauro, C.; Bouchon, S.; Nordvik, J. A methodological approach for the definition of multi-risk maps at regional level: First application. J. Risk Res. 2009, 12, 513–534. Available online: http://www.tandfonline.com/doi/abs/10.1080/13669870903050269 (accessed on 6 April 2019). [CrossRef]
- Birkmann, J.; Cardona, O.D.; Carreño, M.L.; Barbat, A.H.; Pelling, M.; Schneiderbauer, S.; Kienberger, S.; Keiler, M.; Alexander, D.; Zeil, P.; et al. Framing vulnerability, risk and societal responses: The MOVE framework. Nat. Hazards 2013, 67, 193–211. [Google Scholar] [CrossRef]
- Wilches-Chaux, G.; La Vulnerabilidad Global. En Los Desastres no Son Naturales, Maskrey A, Compilador. Perú: Red de Estudios Sociales en Prevención de Desastres en América Latina—LA RED. 1993. Available online: http://www.desenredando.org/public/libros/1993/ldnsn/LosDesastresNoSonNaturales-1.0.0.pdf (accessed on 10 July 2019).
- Badruddin, A.R. Issues of Disaster Management Preparedness: A Case Study of Directive 20 of National Security Council Malaysia. Int. J. Bus. Soc. Sci. 2012, 3, 85–92. [Google Scholar]
- Council, N.S. Dasar dan Mekanisme Pengurusan Bencana Negara: Arahan 20; National Security Council, Prime Minister Department: Putrajaya, Malaysia, 2012; Volume 20, pp. 1–44. Available online: http://www.ump.edu.my/doc/arahan-mkn-no.20-semakan-semula-09_02_2013.pdf (accessed on 10 July 2019).
- Shaw, E. 12th Conference on Historical Analysis & Research in Marketing (CHARM) Abstracts: “The Future of Marketing’s Past”. J. Macromarket. 2005, 25, 254–261. [Google Scholar]
- Joshi, A.; Kale, S.; Chandel, S.; Pal, D. Likert Scale: Explored and Explained. Br. J. Appl. Sci. Technol. 2015, 7, 396–403. [Google Scholar] [CrossRef]
- Barrantes, G. Multi-hazard model for developing countries. Nat. Hazards 2018, 92, 1081–1095. [Google Scholar] [CrossRef]
- EM-DAT. The International Disaster Database. 2018. Available online: https://www.emdat.be/database (accessed on 7 April 2019).
- Anowar, F.; Sadaoui, S.; Bassant, S. Conceptual and empirical comparisons of dimensionality reduction algorithms (PCA, KPCA, LDA, MDS, SVD, LLE, ISOMAP, L.E.; ICA, T-SNE). Comput. Sci. Rev. 2021, 40, 100378. [Google Scholar]
- Moreira, L.L.; de Brito, M.M.; Kobiyama, M. Review article: A systematic review and future prospects of flood vulnerability indices. Nat. Hazards Earth Syst. Sci. 2021, 21, 1513–1530. [Google Scholar] [CrossRef]
- Zaki, R.; Bulgiba, A.; Nordin, N.; Ismail, N.A. A Systematic Review of Statistical Methods Used to Test for Reliability of Medical Instruments Measuring Continuous Variables. Iran. J. Basic Med. Sci. 2013, 16, 803. Available online: /pmc/articles/PMC3758037/ (accessed on 12 July 2021).
- Field, A. Discovering Statistics wth IBM and SPSS; Sage: Thousand Oaks, CA, USA, 2012; Volume 66, pp. 37–39. [Google Scholar]
- Karytsas, S.; Choropanitis, I. Barriers against and actions towards renewable energy technologies diffusion: A Principal Component Analysis for residential ground source heat pump (GSHP) systems. Renew. Sustain. Energy Rev. 2017, 78, 252–271. [Google Scholar] [CrossRef]
- Spyridaki, N.A.; Kleanthis, N.; Tzani, D.; Matosović, M.D.; Flamos, A. A city capability assessment framework focusing on planning, financing, and implementing sustainable energy projects. Sustainability 2020, 12, 8447. [Google Scholar] [CrossRef]
- ITS. IBM SPSS Statistics 23; Information Technology Services: Los Angeles, CA, USA, 2016; pp. 1–12. [Google Scholar]
- Majid, M.Z.A.; McCaffer, R. Assessment of Work Performance of Maintenance Contractors in Saudi Arabia. J. Manag. Eng. 1997, 13, 91. [Google Scholar] [CrossRef]
- Medina, N.; Abebe, Y.A.; Sanchez, A.; Vojinovic, Z. Assessing socioeconomic vulnerability after a hurricane: A combined use of an index-based approach and principal components analysis. Sustainability 2020, 12, 1452. [Google Scholar] [CrossRef] [Green Version]
- Salkind, N.J. Encyclopedia of Research Design; SAGE: Thousand Oaks, CA, USA, 2010; 776p. [Google Scholar]
- Tate, E. Social vulnerability indices: A comparative assessment using uncertainty and sensitivity analysis. Nat. Hazards 2012, 63, 325–347. [Google Scholar] [CrossRef]
- Robielos, R.A.C.; Lin, C.J.; Senoro, D.B.; Ney, F.P. Development of vulnerability assessment framework for disaster risk reduction at three levels of geopolitical units in the Philippines. Sustainability 2020, 12, 8815. [Google Scholar] [CrossRef]
- Papathoma-köhle, M.; Cristofari, G.; Wenk, M.; Fuchs, S. The importance of indicator weights for vulnerability indices and implications for decision making in disaster management. Int. J. Disaster Risk Reduct. 2019, 36, 101103. [Google Scholar] [CrossRef]
- Husson, F.; Le, S.; Pages, J. Exploratory Multivariate Analysis by Example Using R. J. Stat. Softwar. 2011, 40, 240. [Google Scholar]
- Rojas-Valverde, D.; Pino-Ortega, J.; Gómez-Carmona, C.D.; Rico-González, M. A systematic review of methods and criteria standard proposal for the use of principal component analysis in team’s sports science. Int. J. Environ. Res. Public Health 2020, 17, 8712. [Google Scholar] [CrossRef]
- Ayeb-Karlsson, S.; Kniveton, D.; Cannon, T.; van der Geest, K.; Ahmed, I.; Derrington, E.M.; Florano, E.; Opondo, D.O. I will not go, I cannot go: Cultural and social limitations of disaster preparedness in Asia, Africa, and Oceania. Disasters 2019, 43, 752–770. [Google Scholar] [CrossRef] [PubMed] [Green Version]
- Sullivan-Wiley, K.A.; Short Gianotti, A.G. Risk Perception in a Multi-Hazard Environment. World Dev. 2017, 97, 138–152. [Google Scholar] [CrossRef]
- Khailani, D.K.; Perera, R. Mainstreaming disaster resilience attributes in local development plans for the adaptation to climate change induced flooding: A study based on the local plan of Shah Alam City, Malaysia. Land Use Policy 2013, 30, 615–627. [Google Scholar] [CrossRef]
Publisher’s Note: MDPI stays neutral with regard to jurisdictional claims in published maps and institutional affiliations. |
© 2021 by the authors. Licensee MDPI, Basel, Switzerland. This article is an open access article distributed under the terms and conditions of the Creative Commons Attribution (CC BY) license (https://creativecommons.org/licenses/by/4.0/).