Article

Valorification of Ulva rigida Algae in Pulp and Paper Industry for Improved Paper Characteristics and Wastewater Heavy Metal Filtration

by
Florina-Cristiana Caprita
1,2,3,
Antoaneta Ene
3,* and
Alina Cantaragiu Ceoromila
3,4
1
Doctoral School of Mechanical and Industrial Engineering, Dunarea de Jos University of Galati, 47 Domneasca Street, 800008 Galati, Romania
2
Ceprohart SA Braila, 3 Blvd. Al. I. Cuza, 810019 Braila, Romania
3
Department of Chemistry, Physics and Environment, Faculty of Sciences and Environment, INPOLDE Research Center, Dunarea de Jos University of Galati, 47 Domneasca Street, 800008 Galati, Romania
4
Cross-Border Faculty, Dunarea de Jos University of Galati, 47 Domneasca Street, 800008 Galati, Romania
*
Author to whom correspondence should be addressed.
Sustainability 2021, 13(19), 10763; https://doi.org/10.3390/su131910763
Submission received: 25 August 2021 / Revised: 21 September 2021 / Accepted: 24 September 2021 / Published: 28 September 2021
(This article belongs to the Collection Advances in Biomass Waste Valorization)

Abstract

:
This paper presents preliminary results on the possibility of incorporating stranded macroalgae into the papermaking process; analyses of the physical-mechanical properties of filter paper, with the addition of stranded macrophytic marine algae from Ulva rigida species obtained previously; results of SEM–EDX analyses of filter paper samples; and results obtained from the filtration of a wastewater from the metallurgical industry, using the improved filter paper samples. In the filter paper recipe, stranded macrophytic seaweed of the species Ulva rigida was added at different percentages of 0.5%, 1%, 2%, 4% and 8%, and the addition was calculated in relation to the absolute dry material. The physicomechanical properties analyzed are grammage, thickness, density, moisture, ash content, breaking load, breaking length, tear resistance, bursting resistance, folding endurance, porosity, smoothness, water absorption and Cobb60 index. Additional information related to the homogeneity of the distribution of elements in the paper mass was obtained by scanning electron microscopy with energy-dispersive X-ray analysis (SEM–EDX). The addition of macroalgae to the paper mass improved the strength characteristics of the paper, such as breaking load, breaking length, tearing resistance, folding endurance and water absorption. Following industrial wastewater filtration using filter paper with added seaweed, positive results were obtained in terms of reduction of total Cr, Cu, total Fe and Zn concentrations.

1. Introduction

When we discuss algae, we discuss a number of reasons why they are indispensable and essential not only to the aquatic environment but also to the global environment; it is worth mentioning that, in addition to producing oxygen, they consume carbon dioxide, form the basis of the aquatic food chain, stabilize sediments and remove pollutants from water sources [1]. The fundamental characteristic of algae is that they are able to carry out the process of photosynthesis, converting solar energy into chemical energy, and, as a result of this process, algae form the majority of the oxygen in the water breathed by aquatic life. Moreover, thanks to them, the primary photosynthetic productivity increases by up to 50% [2].
Algae are used in various industries, such as food, pharmaceuticals, cosmetics and biofuels industries. They are mainly used in the food industry, with various species of red and brown algae, from which are extracted alginates, agar and carrageenan [3,4], as well as food additives, stabilizers and gelling agents. In the cosmetics industry, extracts from seaweed are especially used to improve product properties and to provide longer-lasting skin moisturization [5]. Exploitation technologies in the food industry using seaweed are advanced and well developed, with no major improvements needed, but the speed at which society is developing has pushed researchers into other areas of seaweed exploitation. Other sectors are developing, seeking to exploit the earth’s resources as wisely as possible.
Macrophytic marine algae are considered to have a potential as resources in the energy-producing industry [6,7]. They possess high carbohydrate and low lignin content [8,9,10], making them very different from terrestrial plants in this aspect. Macroalgae and microalgae are considered third-generation biofuels, from which alcohols and gaseous fuels can be synthesized.
In addition to their confirmed and already exploited potential, numerous researches in the field also support the possibility of using algae in wastewater treatment, due to their strong adsorption capacity of heavy metals from aqueous solutions [11,12,13,14,15]. Because of the large volumes of pollutants and their complexity, currently used techniques such as precipitation, coagulation and membrane filtration become redundant [16]; that is why it is necessary to discover and implement efficient, cheap and environmentally friendly technologies for wastewater treatment. Adsorption is a promising method currently, using activated carbon as adsorbent, but it has a high production cost [17]. Biosorption, on the other hand, is defined as the natural ability of living or dead biomass to adsorb dissolved components, including heavy metals, from aqueous solutions [18]. This technique has become a widely studied wastewater treatment process due to its positive results in reducing concentrations of metal pollutants, as well as other advantages, such as the low cost of biosorbents, being environmentally friendly and being able to reduce a larger number of pollutants simultaneously [19]. This technique can use diverse biomass, from food-industry waste to fungi, bacteria and algae [20]. Fruit peel waste and agricultural waste can also be used as adsorbents, due to their high availability and porous structure [21]. Macrophytic marine algae have the advantage that they are highly tolerant to metals [22], can grow under stress conditions and can accumulate impressive concentrations of toxic metals throughout their time of development [23]. Marine macroalgae can be used as bioindicators, providing qualitative information on the degree of contamination with which the quality of marine ecosystems can be assessed [24]. Algal metal biosorption capacity depends on cellular components, such as the polysaccharides found in them which contain chitin, glycans and cellulose, and which help in metal binding to cell walls but also to S-, O-, P- and N- functional groups [25]. Another advantage of using biomass as an adsorbent in the biosorption technique is the possibility of performing the desorption and regeneration of the material [26]. Using the freshwater macrophyte Lemna minor, the adsorption capacity of Bisphenol A (BPA), a compound used in the production of polycarbonate plastic, epoxy resins and for surface coatings of thermal papers, was demonstrated [27].
All of these methods of exploiting seaweed use living algal material, freshly harvested from growing and development farms, and, in some cases, controlled culture farms are employed, where the species are precisely known, pure material is required and there does not occur any other harmful species that may simultaneously develop. However, the problematic of accelerated algal blooms due to natural and anthropogenic eutrophication, and which detach from the substrate and wash ashore on shorelines, is not fully studied, debated and for which there is no ideal application for valorization or removal. There are little data on the total amount of beach wrack, and in some countries, we can talk about an absence of beach management or poorly administered beach management. No official data exist on the quantities of stranded seaweed on the shores of the Black Sea coast in Romania, but mass media reports suggest that more than 9000 tons are going to the landfill, because there is no legal framework, and cannot be recycled.
This article presents the research carried out in the context of finding a solution for two different problems: the first one is related to the valorification of stranded seaweed from the Romanian Black Sea coast, and the second is related to the reduction of concentrations of some heavy metals found in wastewater from different industries. Over several research studies, it has been concluded that seaweed and seaweed waste can be valorized as a resource in different industries [28] and used as a fertilizer or soil conditioner after aerobic or anaerobic processing in composting or fermentation facilities [29], thus contributing to sustainable development. Based on these data, we investigated the possibility of using Ulva rigida stranded seaweed in the field of papermaking by adding in the mass of the filter paper recipe the algal material, with as few preparation interventions as possible, in order to reduce, as much as possible, the additional costs related to sample processing.
Over the years, other raw materials, such as various agricultural residues, e.g., corn stalks, sorghum stalks and cotton stalks, have also been investigated in the pulp and paper industry. Agricultural residues are used in a percentage of 8% in the pulp and paper industry, and 92% of the world’s pulp and paper production is based on the traditional resource, wood. In order to use the residues from different biomasses in paper and board production, they must be available in abundant quantities; they must be in constant and continuous supply; and they must, above all, be cheap, easy to collect and able to be stored without damage [30]. Cellulose obtained from residual plants from olive crops has an ash content of 1.36%, sorghum stalks have 4.85%, wheat straw has 6.49%, sunflower stalks have 7.9% and rice straw has 15.39% [31].
A different approach with successful results was to blend cellulose from recycled paper with cellulose from rice stalks. Pulp made from recycled paperboard or newsprint fibers has different characteristics compared to virgin fiber pulp and to improve strength characteristics, the technique of mixing the two types of pulp in different proportions is used. The proportions were selected according to the desired end product [32]. Perennials plants have also attracted the attention of researchers in the pulp and paper industry, who have confirmed the papermaking potential of Arundo donax L. reed. After obtaining cellulose from different parts of the stem of A. donax, it was observed that not only the length and width of the fibers differed for cellulose obtained from nodes, internodes and the whole length of the stem, but also that they had different values for the burst index, tear index and tensile index [33]. The use of recycled pulps and pulps obtained from agricultural waste has economic and ecological advantages, but a possible disadvantage is that of fungal and mould degradation, which can lead to the manufacture of a paper with up to 50% less strength and a lower whiteness degree [34,35]. The yeast Cyberlindnera jadinii develops on the surface of woody biomass, wastes and residues resulting from the manufacture of wood products and pulp industry [36,37], thus preferring cellulose-rich substrates, such as paper. It is not desirable to grow on products such as paper, but it is also a very good example of biotechnology when grown on woody or pulp substrates deliberately for industrial purposes, thus contributing to sustainable development, being a green technology.
The importance of paper lies at the root of the progress of development of important cultures. It has been a means of accelerating societies. Paper rapidly found many uses, and the technology of manufacturing it developed in parallel with consumption and thanks to its spread [38]. Even today, paper plays an important role, being used in many different activities, thanks to the multitude of paper varieties developed [39]. The apparent consumption of paper and cardboard increased from 1991 to 2019 by 24.6%, from 60,102 × 103 to 74,891 × 103 tons [40].
As the consumption of paper and board products increases, so do the environmental problems caused by the increased use of wood, which is why technological efforts are being made to partially replace the traditional material used with a more environmentally friendly material from non-wood or residual sources. Consumers are becoming increasingly aware of the need to protect forests and have become interested in the use of clean-technology paper products [31]. In order to ensure current consumption, new sources of raw material are being sought [32]. In previous applications, it has been found that cellulose can be extracted from the residual biomass of Ulva sp. These mainly contain α-cellulose, using low amounts of soda and hydrogen peroxide. An addition of 50% cellulose extracted from Ulva sp. mixed with unbleached pine kraft pulp (PKP) to obtain laboratory papers with a basis weight of 60 g/m2 leads to improved mechanical characteristics of the paper, which makes it an alternative source of fibers in the pulp, paper and board industry [41]. Invasive alien species (IAS) of macrophytic marine algae can be such a resource, as they cause a number of negative environmental consequences by reducing community biodiversity, tolerate and thrive in different environmental conditions, adapt very easily, show a high growth and development rate, and do not have natural feeders [42].
By exploiting invasive algae species in the pulp and paper industry by manufacturing a product to reduce concentrations of certain heavy metals, the amount of primary raw material is also reduced, which is also very important in minimizing deforestation.

2. Materials and Methods

2.1. Material

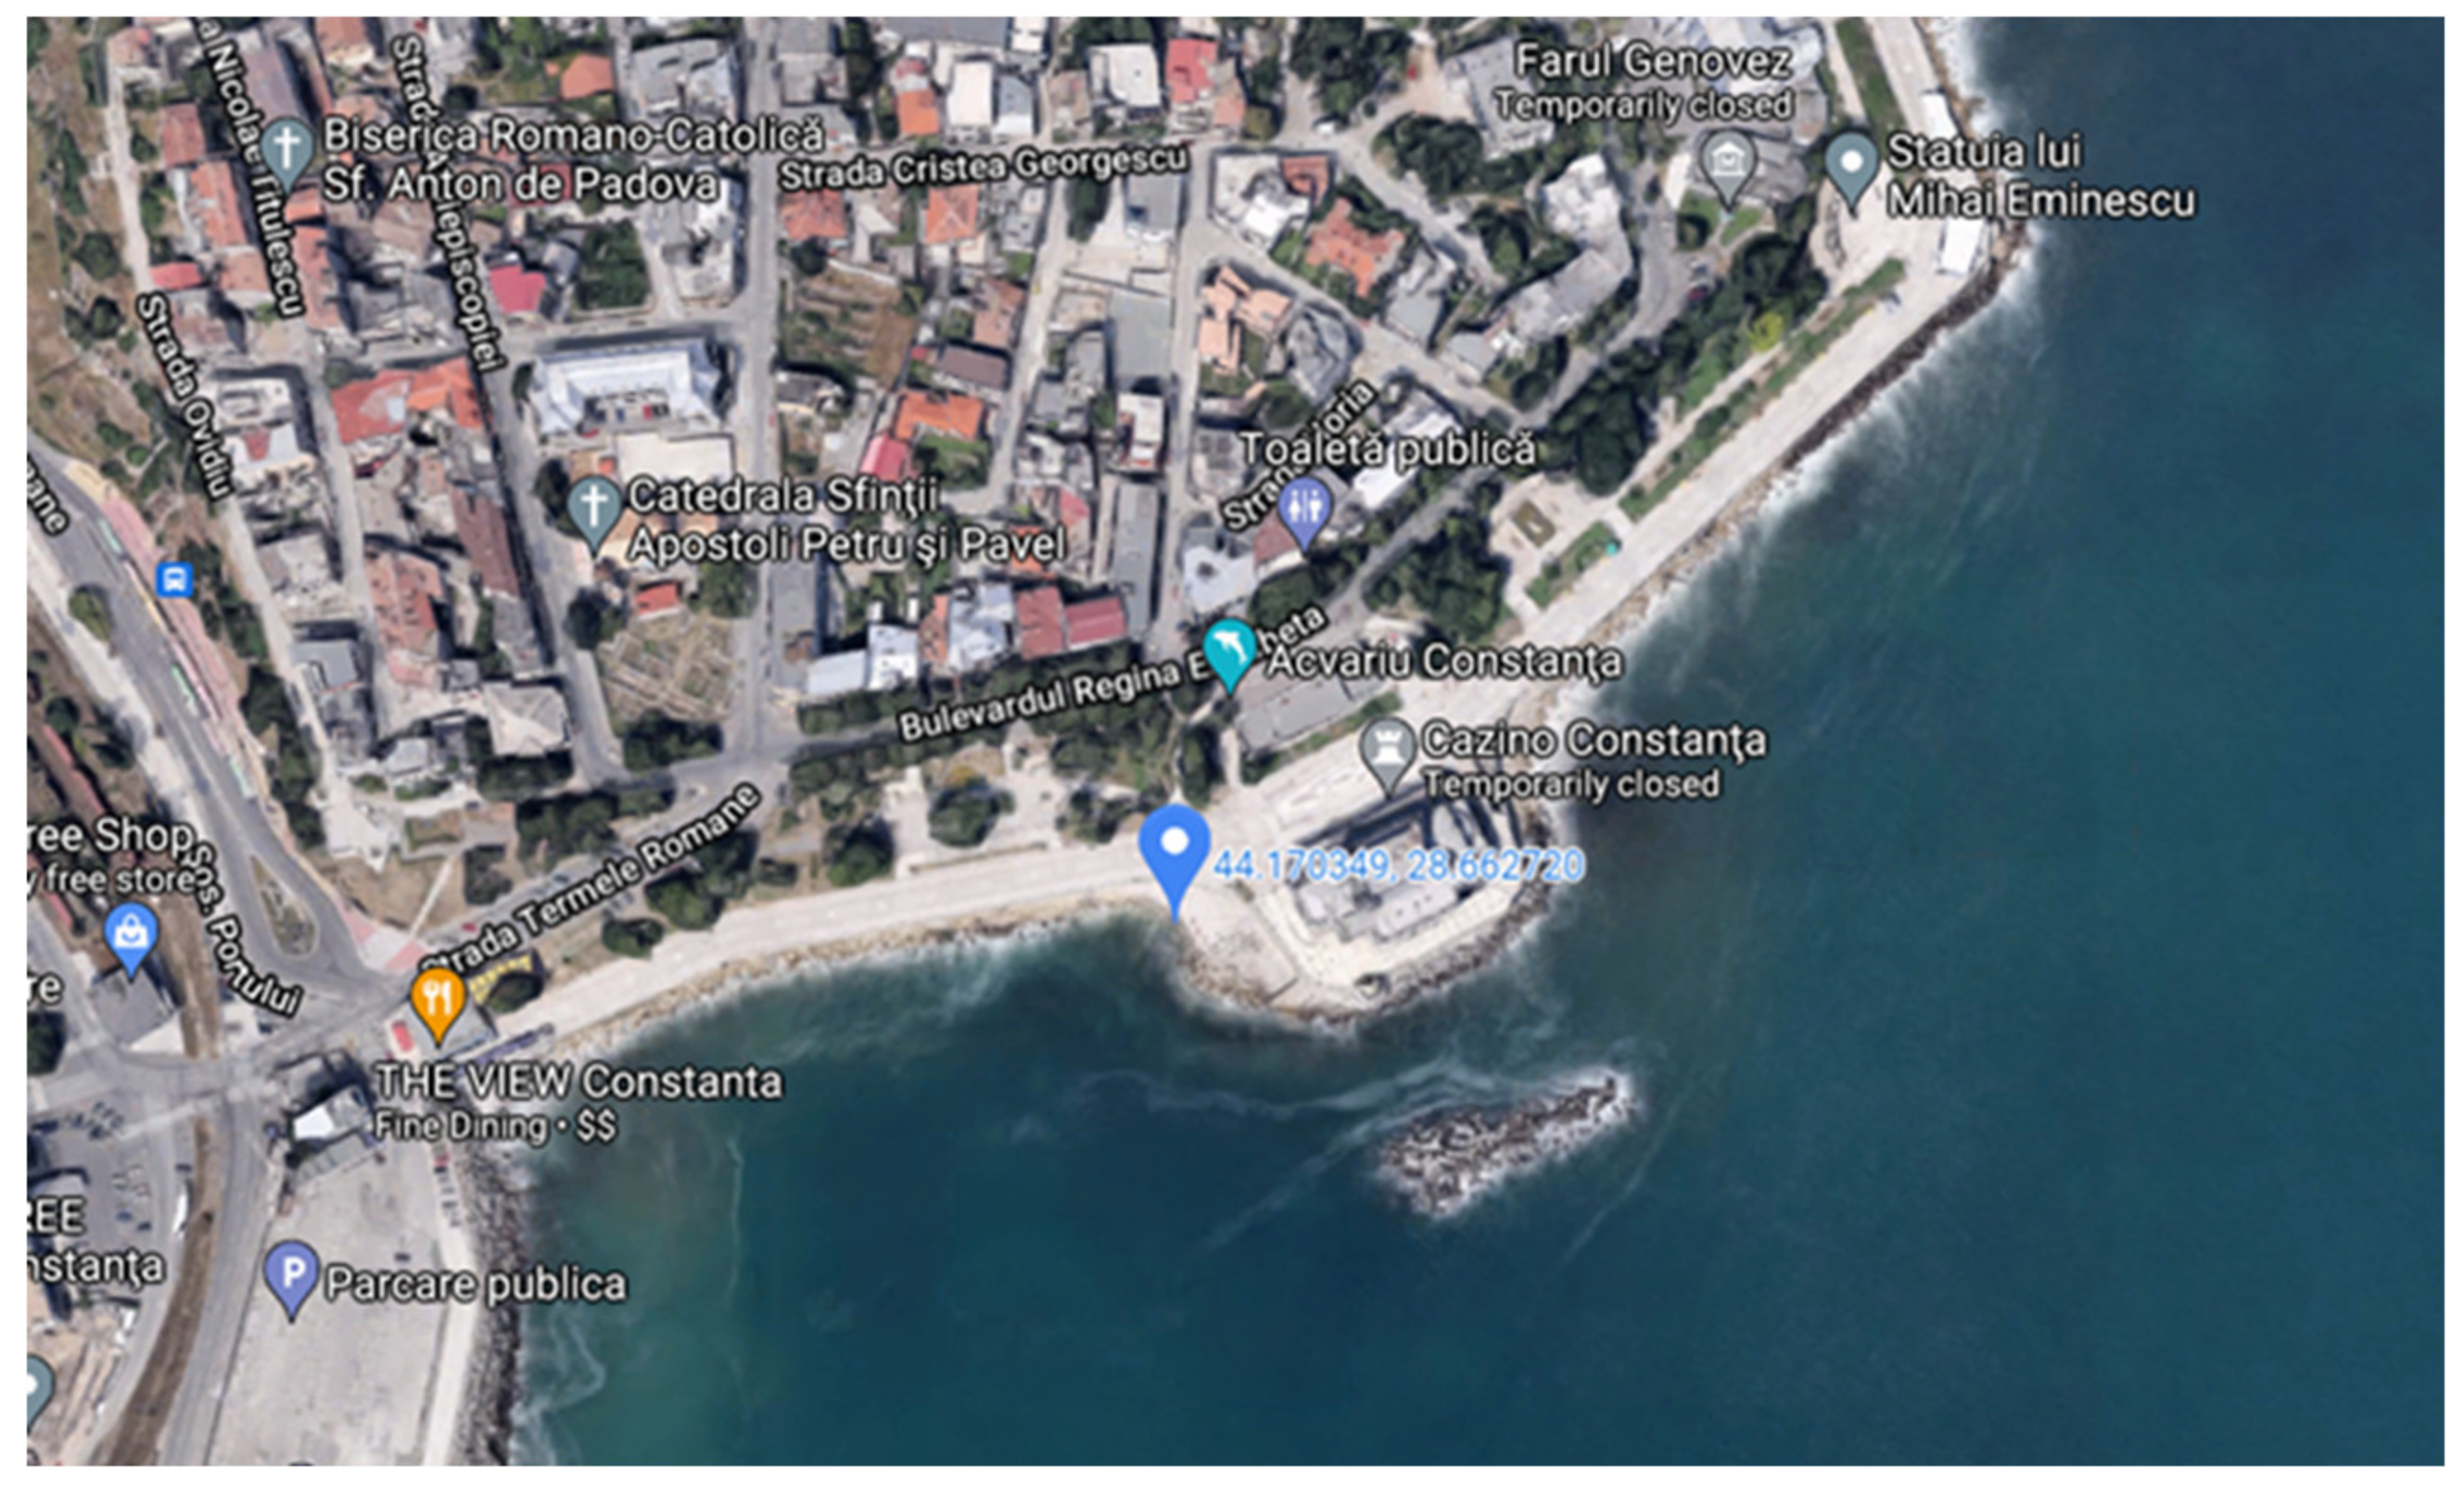
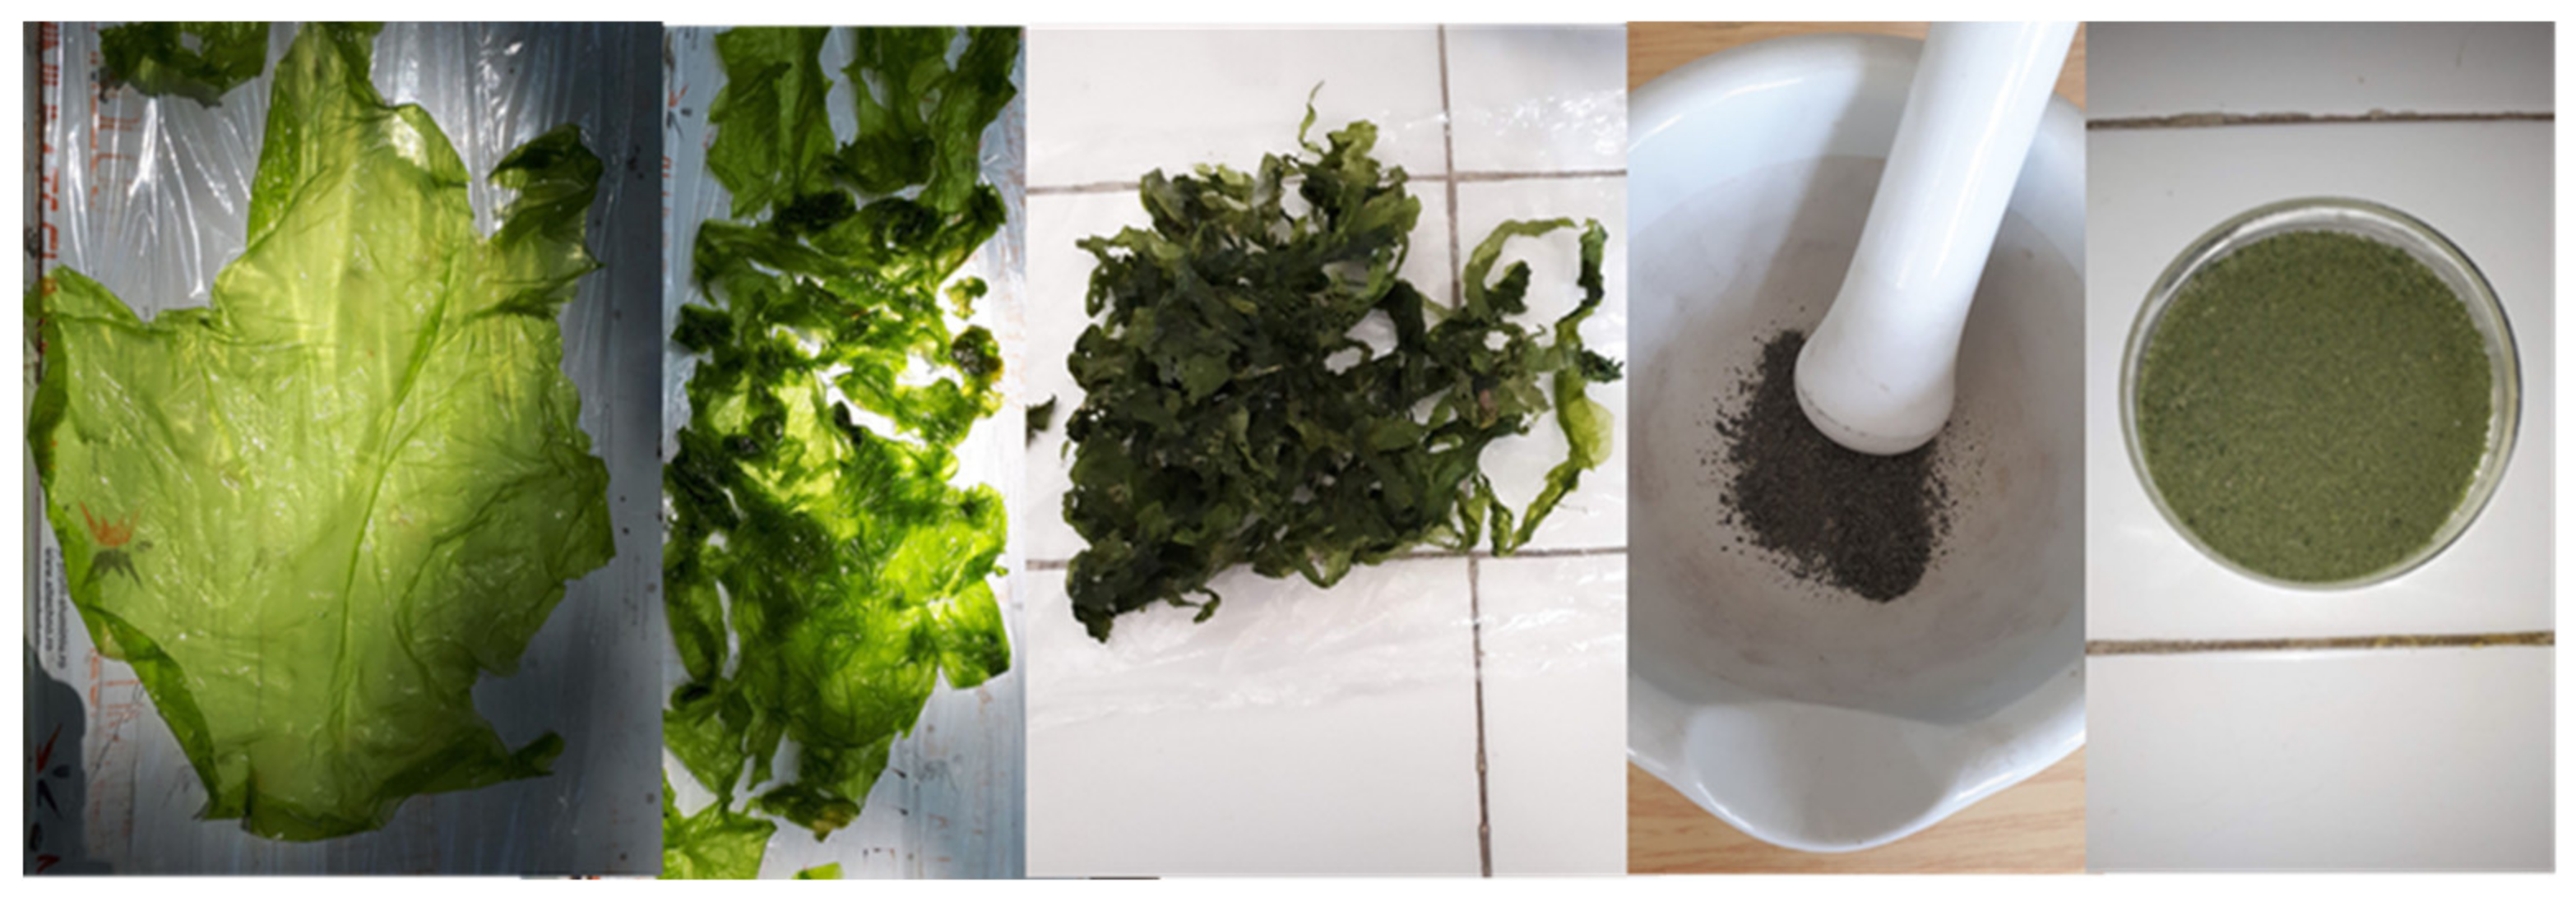
2.1.1. Stranded Macrophytes Comprising the Species Ulva rigida

Samples of algae were collected on 27 June 2020 from the Black Sea coast, SE Romania, Constanta municipality, Casino area (Figure 1). The selected species of stranded macrophytes was Ulva rigida, because it presents an opportunistic character, grows up to 30 cm in size, adapts easily to environmental conditions and is one of the most common species in the Romanian littoral (Supplementary Materials Figure S1a,b).
The processing of the material consisted of washing the samples with seawater first; then washing with drinking water and demineralized water to remove sand, epiphytic organisms and other debris; and then drying in the open air, at a temperature of 28 °C, for 6 h. After that, they were grinded by using a mortar and pestle, and then the powder was sorted on a sieving system (Figure 2), using the resulting powder with a particle size of 500 µ for a high surface-to-volume ratio. The processed material was then introduced into the papermaking process, at the laboratory level, at Ceprohart SA Braila, Romania, with the chosen grade being filter paper.

2.1.2. Cellulosic Fibers from Softwoods and Hardwoods

Cellulose was supplied in sheet form, with size of 65 × 80 cm for softwood (long fibers, Figure 3a) and 59 × 83 cm for hardwood (short fibers, Figure 3b), and a number of steps were required in order to obtain laboratory sheets of filter paper with mass added algae.

2.1.3. Wastewater from the Metallurgical Industry

The wastewater came from a company that produced tinplate products. It is known that the settling plant was not efficient for the removal of pollutants, which is why it could not strictly comply with the technical regulations setting limits for pollutant loading of industrial wastewater when discharged into natural receptors or the sewerage system. The water sample collected is turbid and shows solid suspensions of a size visible to the naked eye (Supplementary Material Figure S2).

2.2. Methods

2.2.1. Technical Steps and Equipment Used for Papermaking

In order to obtain filter papers with added seaweed in the mass, a number of steps were completed. The sample preparation was carried out at Ceprohart SA Braila, Romania, at “Laboratory for stock preparation and chemical additive dosages”, and the physical-mechanical tests were performed in the “Laboratory for physical and mechanical testing of pulp, paper and board”, accredited by Romanian Accreditation Association (RENAR).
The method of pulp beating at the laboratory level was performed, using Valley Hollander, because it can reproduce, at the laboratory scale, the industrial process of beating cellulose and allows two pulp preparation operations to be carried out consecutively, i.e., the further disintegration and pulp beating. We determined the moisture content and performed the disintegration stage in accordance with the SR ISO 5264-1:1997 [44] standard. After this step, the bleached hardwood kraft pulp was beaten for 5 min, and the bleached softwood kraft pulp was for 40 min. During the process of cellulose beating, at short intervals, samples were taken to determine the beating degree.
The SR EN ISO 5267-1:2002 [45] standard establishes the method for determining the beating degree as an index called the Schopper–Riegler (SR) degree of an aqueous cellulose suspension and aims to measure the known volume of filtrate from the aqueous cellulose suspension.
The value of the beating degree of cellulose used for this research is different for each type: for bleached softwood kraft pulp (BSK), the value of the beating degree was 19o SR (Figure 4a), and for bleached hardwood kraft pulp (BHK), the value of the beating degree was 17° SR (Figure 4b).
After the cellulose beating and establishing the working recipe of 80% BHK and 20% BSK, the homogenizer is used for dosing the two types of cellulose, and the agent for wet strength, in a dose of 2%. It was observed that it is not beneficial to add the algae directly in the homogenizer, because, after stopping the paddles for stirring, the tendency is to settle and maintaining agitation affects the homogeneity of the last two samples (algae particles being thrown on the walls of the homogenizer). This is why it is necessary for a better incorporation, given the limitation of the mechanical homogenizer to the production of 10 sheets, to weigh the samples separately to obtain 10 laboratory sheets for each addition, and to manually homogenize for 10 s the sample in suspension (Supplementary Materials Figure S3) before introducing into the RAPID-KÖTHEN former. At industrial level, the stirring can be adjusted and being a continuous process would not be an impediment, as it appears at the laboratory level.
In each of the samples previously prepared, a percentage of algae corresponding to each set dose was added, and then the sheets were formed and dried. Forming and drying the filter paper sheets in the laboratory is performed by using the RAPID-KÖTHEN Sheet Former, Type RK-2AKöthen fast sheet dehydration and sheet former (Supplementary Materials Figure S4). This installation forms paper sheets for simulation/verification of experimental and/or application of new additives or technologies at pilot and industrial level (Supplementary Materials Figure S5).
Before performing the test, they were conditioned, in accordance with SR EN 20187:1996 [46], at (23 ± 1) °C and (50 ± 2)% relative humidity. All the analyses carried out are in accordance with the corresponding standards in force for each method. The results represent an average of 10 determinations for each test.
Figure 5 shows a laboratory sheet of filter paper with 8% Ulva rigida algae addition (Figure 5a), the filter paper surface (Figure 5b) and the images of seaweed embedding in the paper structure and sequestration of seaweed particles by cellulose fibers, obtained by using the ZEISS Axiostar Plus Binocular Microscope (50× magnitude) for fiber composition determinations (Figure 5c).

2.2.2. Determination of the Structural Characteristics of Filter Paper with Added Macrophytic Marine Algae

  • Determination of grammage
Grammage is a property that can be controlled by the amount of cellulose/dry materials added within the paper. It was chosen to manufacture the support sheets at a grammage of 80 g/m2. According to the standard SR EN ISO 536:2020 [47], the grammage is calculated by using the following equation:
g = m A × 10 6
where m is the mass of the sample, in grams; and A is the sample area, in square millimeters.
  • Determination of thickness
According to the standard SR EN ISO 534:2012 [48], the thickness of a single sheet of paper is the distance between one side of the paper and the other, determined under static load under standardized conditions and expressed in μ. The measurement shall be made at a position of at least 20 mm from any edge of the sample. The measurements were performed by using a micrometer.
  • Determination of apparent specific volume of the sample
The standard SR EN ISO 534:2012 [48] is used to determine the sample density or the specific volume that represents the ratio between the weight and the thickness of the sample, as follows:
V s = δ S g
where   δ s is the average thickness (µm), and g is the grammage (g/ m 2 ).
  • Determination of air permeance, Gurley method
The Gurley Air Resistance represents the average time, in seconds, required to pass 100 mL of air through the sample under the ISO 5636-5:2013 [49] standard specified conditions.
  • Determination of smoothness, Bekk method
Determining the Bekk smoothness consists of determining the time required to inhale a certain amount of air, at atmospheric pressure, between the surface of a specimen and a ring-shaped plane, at a certain well-established pressure difference. It is expressed in seconds and is performed by using the Bekk-type smoothness tester and according to the specifications of the standard ISO 5627:1995/Cor 1:2002 [50].
  • Determination of residue (ash content)
Determination of ash or residue content is the determination of inorganic material content by calcination at 900 °C, in an electric furnace, for 2 h, according to the ISO 2144:2019 [51] standard. The determination of the ash content is the ratio between the mass of the ash and the mass of the sample absolutely dry.
  • SEM–EDX determinations
In order to characterize the materials (algae and filter paper) used in these experiments, the scanning electron microscopy (SEM) method was used to complete the information about the morphology of the samples, coupled with the energy-dispersive X-ray analysis (EDX) for the acquisition and mapping of the elemental concentration of tested samples. SEM images (500 µm scale bar) were taken by using a FEI QUANTA 200 scanning electron microscope at Dunarea de Jos University of Galati (UDJG), Romania. For all the investigations, a beam accelerating voltage of 20 kV and a secondary electron (SE) signal were used in order to excite as many elements as possible. All synthesized samples were mounted on aluminum stub through the conductive carbon adhesive tape and thereafter sputtered with a thin gold layer, using an SPI Sputter Coater Module equipment (SPI Supplies, West Chester, PA 19380-4512, USA). Determination of the elemental distribution was carried out by EDX microanalysis technique developed by the authors at INPOLDE research center of UDJG [52,53], using a solid-state Si (Li) detector coupled to SEM. The ZAF matrix correction algorithm (Z = atomic number, A = absorption and F = fluorescence) was used to convert the apparent concentrations (raw spectral line intensity) into (semi-quantitative) concentrations corrected for inter-element effects [52].
The obtained SEM–EDX results have a local character, being analyzed a micro-surface of about 1 mm2.

2.2.3. Determination of the Mechanical Strength Characteristics of Filter Paper with Added Macrophyte Marine Algae

  • Determination of Breaking Load
The breaking load is the force required to pull a strip of product of a certain width suspended at one end by traction. The reference standard is SR EN ISO 1924-2:2009 [54] for dry materials and ISO 3781:2011 [55] for materials after immersion in water. This determination was performed by using the INSTRON 4411 dynamometer.
  • Determination of Breaking Length
The same standards were used as in the determination of breaking load. The breaking length is the calculated limit length at which a test tube suspended at one end breaks under its own mass. The breaking length, expressed in kilometers, is calculated by using the equation:
l B = 1 9.81 × S g × 10 3
where lB is the breaking length, in km; S is the tensile resistance in kN per meter; and g is the grammage, in grams per square meter.
  • Determination of tearing resistance, Elmendorf method
For this determination, the SR EN ISO 1974:2012 [56] standard was used, which specifies that the resistance to priming tearing is the average force required to continue the tearing started by a cut in the test piece. The work performed in tearing the test piece is measured as the loss in energy of the pendulum. Using the following formula, the tearing resistance (in milinewtons) is as follows:
F = A ¯ p n
where A ¯ is the mean scale reading, p is the pendulum factor and n is the number of sheets in each test piece.
  • Determination of bursting strength
The bursting strength represents the maximum pressure developed by the hydraulic system in forcing an elastic diaphragm through a circular area of the paper, when the pressure is applied under the test conditions. For this test, we used the machine for testing the bursting resistance Frank-Bursting Strength Tester 18530 F000, and the determinations were performed according to the standard SR EN ISO 2758:2015 [57].
  • Determination of folding endurance
The folding endurance is represented by the double bending of the sample and expressed by the average number of bends that the paper specimen resists before breaking. This consists in the complete oscillation of the test piece, during which it is bent in one direction, then in the other around the same axis. The method for determining the folding endurance with the Schopper-type equipment is presented in SR ISO 5626:1996 [58].

2.2.4. Determination of the Absorption Characteristics of Filter Paper with Added Macrophyte Marine Algae

  • Determination of water absorptiveness, Cobb method
Water absorptiveness (Cobb Index) represent the mass of water absorbed by 1 m2 of paper or cardboard within the time span and under specified conditions. The area of the tested surface is normally 100 cm2. For this test, we used the COBB OS device. For this method, the SR EN ISO 535:2014 [59] standard was used.
  • Determination of the moisture
Moisture is the amount of water contained in the paper. In practice, it is the ratio between the mass loss of a sample after drying under standardized conditions and its mass at the time of sampling; it is usually expressed as a percentage. For these determinations, it was used the SR EN ISO 638:2010 [60] standard.

2.2.5. Determination of the Filtration Capacity of Heavy Metals, TDS and TSS from the Wastewater

  • Determination of heavy metals
The Hach DR 2800 Spectrophotometer was used to determine Cr total, Cu, Fe total and Zn concentrations and TSS. In order to highlight the retention capacity of these metals by filter papers with different seaweed additions, the water sample was analyzed before and after filtration. We used Total Suspended Solids (TSSs) to determine all particles larger than 2 microns found in the water source. Anything smaller than 2 microns (average filter size) is considered a dissolved solid.
To determine the total chromium concentration, the 8024 Powder Pillows (0.01 to 0.70 mg/L), Alkaline Hypobromite Oxidation Method was used.
To perform this method, the following steps were followed. A 25 mL sample cell was filled with 25 mL of sample, and then the content of a Chromium 1 reagent powder pillow was added and swirled to mix. The sample was placed into a boiling water bath for 5 min, then removed and cooled to 25 °C, using tap water. After this step, the content of a Chromium 2 Reagent Powder Pillow was added and inverted to mix. Then the content of an Acid Reagent Powder Pillow was added and swirled to mix, and then the content of a ChromaVer 3 Chromium Reagent Powder Pillow was added and swirled to mix. A 5-min reaction began, and during this time, 10 mL was transferred to a sample cell. After the time expired, another sample cell was filled with 10 mL for the blank sample, using deionized water. The equipment was calibrated with the blank sample, and then the sample of interest was read.
To determine the copper concentration, the 8506 Powder Pillows Bicinchoninate Method (0.04 to 5.00 mg/L) was followed. The water sample was previously digested by following several steps. For EPA mild digestion, 5 mL of concentrated Nitric Acid have been added for 1l of the water sample at the time of the collection. A well-mixed sample of 100 mL was moved into a flask; 5 mL of distilled 1:1 Hydrochloric Acid was added into the flask; and then the sample was subjected to a steam bath, without being boiled, until the sample was reduced to 20 mL. The sample was filtered by using filter paper. The pH was adjusted to pH 4 with 5.0 N Sodium Hydroxide Standard Solution then deionized water was added to fill the flask to 100 mL mark. The Blank was prepared with demineralized water, following the same steps. By following the method 8506 steps, the pH was adjusted to 4 by using 8 N Potassium Hydroxide; we filled a sample cell with 25 mL of the digested sample and added a CuVer 2 Copper Reagent Pillow; and then a 2 min reaction period started. A 25 mL sample cell was filled with the blank. The equipment was calibrated by using the blank sample, and then the copper concentration of the sample was determined.
To determine the iron concentration, the steps of the Method 8008 FerroVer Method Powder Pillows (0.02 to 3.00 mg/L) were followed. Previous it was required a digestion step and it was performed a EPA mild digestion as previously described, the pH was adjusted to 5 with 5.0 N Sodium Hydroxide Standard Solution then it was filled a sample cell with 10 mL of the sample, added the content of FerroVer Iron Reagent Powder Pillow to the sample and swirled to mix, after a 3 min reaction period, it was filled another sample cell with the blank with deionized water, the equipment was calibrated by using the blank sample, and then the sample to be analyzed was read. Because the result exceeded the measuring range, a 1:4 dilution was performed, using deionized water.
In order to determine the zinc concentration, the steps of method 8009 Powder Pillows Zincon (0.01 to 3.00 mg/L) were carried out. Digestion was previously carried out, and because, at the time of the collection, a 5 mL of concentrated Nitric Acid was added, as a step of the digestion process, another 3 mL of nitric acid was added to the sample after the sample arrived to the laboratory. We transferred 100 mL of the sample to a flask, added 5 mL of 1:1 6.0 N Hydrochloric Acid and heated on a hot plate for 15 min at 95. In order to perform the method 8009 Powder Pillows Zincon, 100 mL of the sample was transferred into a 250 mL flask. A total of 5 mL of 1:1 Hydrochloric Acid 6.0 N was added, and then the sample was heated on a hot plate, at 95 °C, for about 15 min, without being boiled.
We cooled the sample with tap water and filtered it through a membrane filter. Then the volume was adjusted to 100 mL with deionized water. The pH was adjusted to 4.7 with 5.0 N Sodium Hydroxide. Then a 25 mL graduated cylinder was filled with 20 mL of the prepared sample, we added a ZincoVer 5 Reagent Powder Pillow and inverted several times to dissolve the powder completely.
From the 20 mL of the sample, 10 mL of the solution was poured into another sample cell, as the blank sample. Into the remaining sample, using a plastic dropper, we added 0.5 mL of cyclohexanone, and for a 30 s reaction period, the cylinder was vigorously shaken; then, after another 3 min reaction period, the sample was poured into a sample cell. Then the equipment was calibrated by using the blank sample then the sample to be analyzed was read. All the test kits were from Hach Company.
The water samples used for filtering on filter paper (control sample and samples consisting of filter paper with added algae) were not digested, because they were desired to highlight that they also filter solid particles.
  • Determination of TDS and TSS
TDS (Total dissolved solids) is a measure of the combined dissolved content of all inorganic and organic substances present in a liquid in suspended form was determined by using a Hach CO 158 conductivity meter and TSS (Total Suspended Solids) was also determined by using the Hach DR 2800 Spectrophotometer equipment. The determination method used for TSS is the 8006 Photometric Method (5 to 750 mg/L), with the following steps. A total of 500 mL of sample was agitated at 1000 rpm for 2 min, poured into a 1000 beaker and stirred; and immediately, 10 mL of the sample was poured into a sample cell. The blank consisted of 10 mL of deionized water. The equipment was calibrated by using the blank sample, and then the sample was swirled, the bubble gases were removed and the sample was read. Because the sample was loaded with particles and the reading range was exceeded, the sample was diluted 1:10.
  • Wastewater filtration
For filtration of wastewater samples, using filter paper samples, general filtration was used; this is the simplest form of filtration, as it uses gravity to filter wastewater samples (Supplementary Materials Figure S6).

3. Results

Table 1 presents comparatively the average values (n = 10 determinations) of the physical–mechanical characteristics considered important for defining the quality of the filter paper with and without the addition of Ulva rigida dry algal biomass (reference sample/test sample). Algae were added in a dose of 0.5%, 1%, 2%, 4% and 8% to the absolutely dry material in the composition of a filter paper with a grammage of 80 g/m2. The purpose of these tests is to determine the possibility of embedding macroalgal wrack in the mass of the paper and to assess how they influence the physical and mechanical characteristics of the paper.

3.1. Determination of the Structural Characteristics of Filter Paper with Added Macrophytic Marine Algae

  • Determination of grammage
The grammage of the samples is close in value (Table 1 and Supplementary Materials Figure S7), the seaweed wrack introduced into the paper mass did not contribute to the mass change by absorbing water from the air. Accuracy of grammage to the second decimal point is difficult to obtain industrially at times, but since the samples are obtained in the laboratory conditions, small differences in results are not noticeable. The average of all values is 80.59 g/m2, with a standard deviation of 0.17 g/m2.
  • Determination of thickness
This property is closely related to the grammage of the sample and can be modified depending on the end use, from the paper recipe, at the industrial level the technological parameters of the paper machine, the linear pressure at the wet presses and the value of the vacuum at the suction boxes can be modified.
It can be seen that the results of determining the thickness of the filter papers correspond to the results of the grammages. The difference between the minimum and maximum value is only of 3 µ (Table 1 and Supplementary Materials Figure S8). Depending on the specifics of the application, the grammage and therefore the thickness of the filter paper may differ. From the analysis of products already on the market, the thickness ranges from 0.1 to 0.5 mm, according to the characteristics declared by the manufacturers.
  • Determination of sample apparent specific volume
Since filter paper is used to separate fine solid particles from liquids or gases, it should provide a semi-permeable barrier. As apparent specific volume is a characteristic resulting from the correlation between grammage and thickness, it can easily be obtained according to requirements by adjusting the grammage or, at industrial level, by adjusting the linear pressure on the machine’s wet presses. From the data provided by the manufacturers, we see that the apparent specific volumes of the market products have values between 0.34 and 0.55 g/cm3. The results obtained are uniform and are not influenced by the addition of algae (Table 1 and Supplementary Materials Figure S9).
  • Determination of air permeance, Gurley method
Porosity determinations show increasing values, parallel to the increase of the addition. By comparing the reference sample, which has no algae content with the test samples containing different algae additions, we can notice how this characteristic improved from the minimum value of 1.9 s for the control sample, to 2.5 respectively 2.3 s for the sample with 0.5% seaweed addition, to 3.2 respectively 3.1 s for the sample with 8% seaweed addition. From the data obtained on the porosity determination for both sides of the filter paper sheets, it can be seen that there are no noticeable differences (Table 1 and Supplementary Materials Figure S10). Taking into account the average values obtained for the two sides of the paper and comparing them with P0, we observe that P1 improved the characteristic by 26.32%, P2 by 34.21%, P3 shows the same percentage of improvement as P2, P4 by 47.37% and the highest increase was found in the case of the sample P5, 65.79%.
  • Determination of smoothness, Bekk method
Values with insignificant influence were obtained for the Bekk Smoothness determination where, as can be seen from Table 1 and Supplementary Materials Figure S11, all samples show values of 6 s. The addition of seaweed does not affect the smoothness property of the paper. The addition of seaweed does not damage the test value, but it also does not improve this characteristic. It appears that the small particles did not cover the gaps between the fibers, allowing air to pass between them.
  • Determination of residue (ash content)
The ash content increases in relation to the addition of biomass, and the algae content consists of minerals. From the analysis of the values (Table 1 and Supplementary Materials Figure S12), we can notice that, compared to P0, P1 increases the ash content by 5%, P2 by 10%, P3 by 22.5%, P4 by 67.5% and P5 by 132.5%. The values of the increases do not show perfect exponential values, but they depend mostly on the mineral content of the algae.

3.2. Determination of the Mechanical Strength Characteristics of Filter Paper with Added Macrophyte Marine Algae

  • Determination of breaking load
From the comparative analysis on the dry breaking load results (Table 1 and Supplementary Materials Figure S13), it can be observed that compared to the control sample P0, P1 shows an increase of 1.01%, P2 presents an increase of 2.04%, P3 an increasing of 8.28%, P4 is indicating an increase of 9.04% and P5 shows lower values compared to P0, with a percentage of 2.14%, the reason for which we conclude that an addition of 8% seaweed in the paper mass, affects the structure of the fiber network, thus weakening the bonds formed. The optimum addition for this determination is that of sample P4.
For the determination of the wet breaking load (Table 1 and Supplementary Materials Figure S13), values are slightly improved compared to the control sample: for samples P1, by 4.42%; to 1.19% for P2; by 14.92% for P3; with 5.8% for P4; and with P5 showing a decrease of 35.08%. It can be seen that, in the wet state, the P4 and P5 samples tested show the lowest values. In the case of sample P5, the same phenomenon occurs as in the case of the determination of breaking loads in the dry state, that is, the weakening of the fiber bonds due to the addition of 8% algae.
  • Determination of Breaking Length
In the case of dry breakage length determination, comparing the results with P0, we see that P1 shows an increase by 1.37%, P2 by 1.61%, P3 by 8.27% and P4 by 9%; and P5 shows an increase of 1.96%, but a decrease compared to P3 and P4 (Table 1; Supplementary Materials Figure S14). Analyzing the results of wet breaking length determination, compared to P0, P1 shows an increase by 4.92%, P2 by 11.15%, P3 by 15.08% and P4 by 5.57%; and P5 shows a decrease by 34.75% (Table 1 and Supplementary Materials Figure S14). Breaking length determination is closely related to breaking load determination and sample weight. The addition of 8% seaweed seems to harm this test as well but the other additions slightly improve this determination. The addition of 4% algae had a positive influence on the breaking load strength; meanwhile, in the case of the sample with the addition of 8%, the influence was negative, because the algae particles interfered with the bonds between the fibers, weakening them, so that the results of this test were also lower compared to the control sample
  • Determination of tearing resistance, Elmendorf method
For the determination of tearing resistance, P1 shows no change in value compared to P0, P2 shows an increase of 3.57%, P3 increases by 10.71%, P4 shows an improvement of 7.14% and P5 shows a decrease of 3.57%. The addition of only 2% seaweed improves the tearing resistance of the material, and the addition of 8% decreases the quality of this characteristic of the paper (Table 1 and Supplementary Materials Figure S15).
  • Determination of bursting strength
The results of the test determinations for the bursting strength show unchanged results for P1, an increase of 2.8% for P2 compared to P0, a decrease of 1.4% for P3 and P4 and a decrease of 11.2% for P5. The addition of 1% improves the strength of this characteristic of the paper and the addition of 8% seaweed in the mass of the paper decreases the result for this property (Table 1 and Supplementary Materials Figure S16).
  • Determination of folding endurance
This paper shows a slight increase compared to P0 for P1, P2, P3 and P4, respectively; by 7.7% compared to P0 for P1; and 15.38% for P2, P3 and P4; and P5 shows a decrease of 15.38% compared to P0 (Table 1 and Supplementary Material Figure S17).

3.3. Determination of the Absorption Characteristics of Filter Paper with Added Marine Macrophyte Algae

  • Determination of water absorptiveness, Cobb method
Increasing the addition of algae in the paper mass favors the improvement of this characteristic by 3.02% for P1, by 6.8% for P2, by 7.21% for P3, by 11.9% for P4 and by 8.31% for P5 (Table 1 and Supplementary Materials Figure S18). A paper made from 100% hardwood pulp with a grammage of 70 g/m2 has a water absorptiveness Cobb60 of 150 g/m2, and one made from 100% softwood pulp with the same grammage has a Cobb60 of 120 g/m2 [61].
  • Determination of the moisture
When analyzing the moisture characteristic of P1 sample, we see an increase of 1.82%, P2 by 3.84%, P3 with 5.66%, P4 by 10.1% and P5 by 6.46% (Table 1 and Supplementary Materials Figure S19).

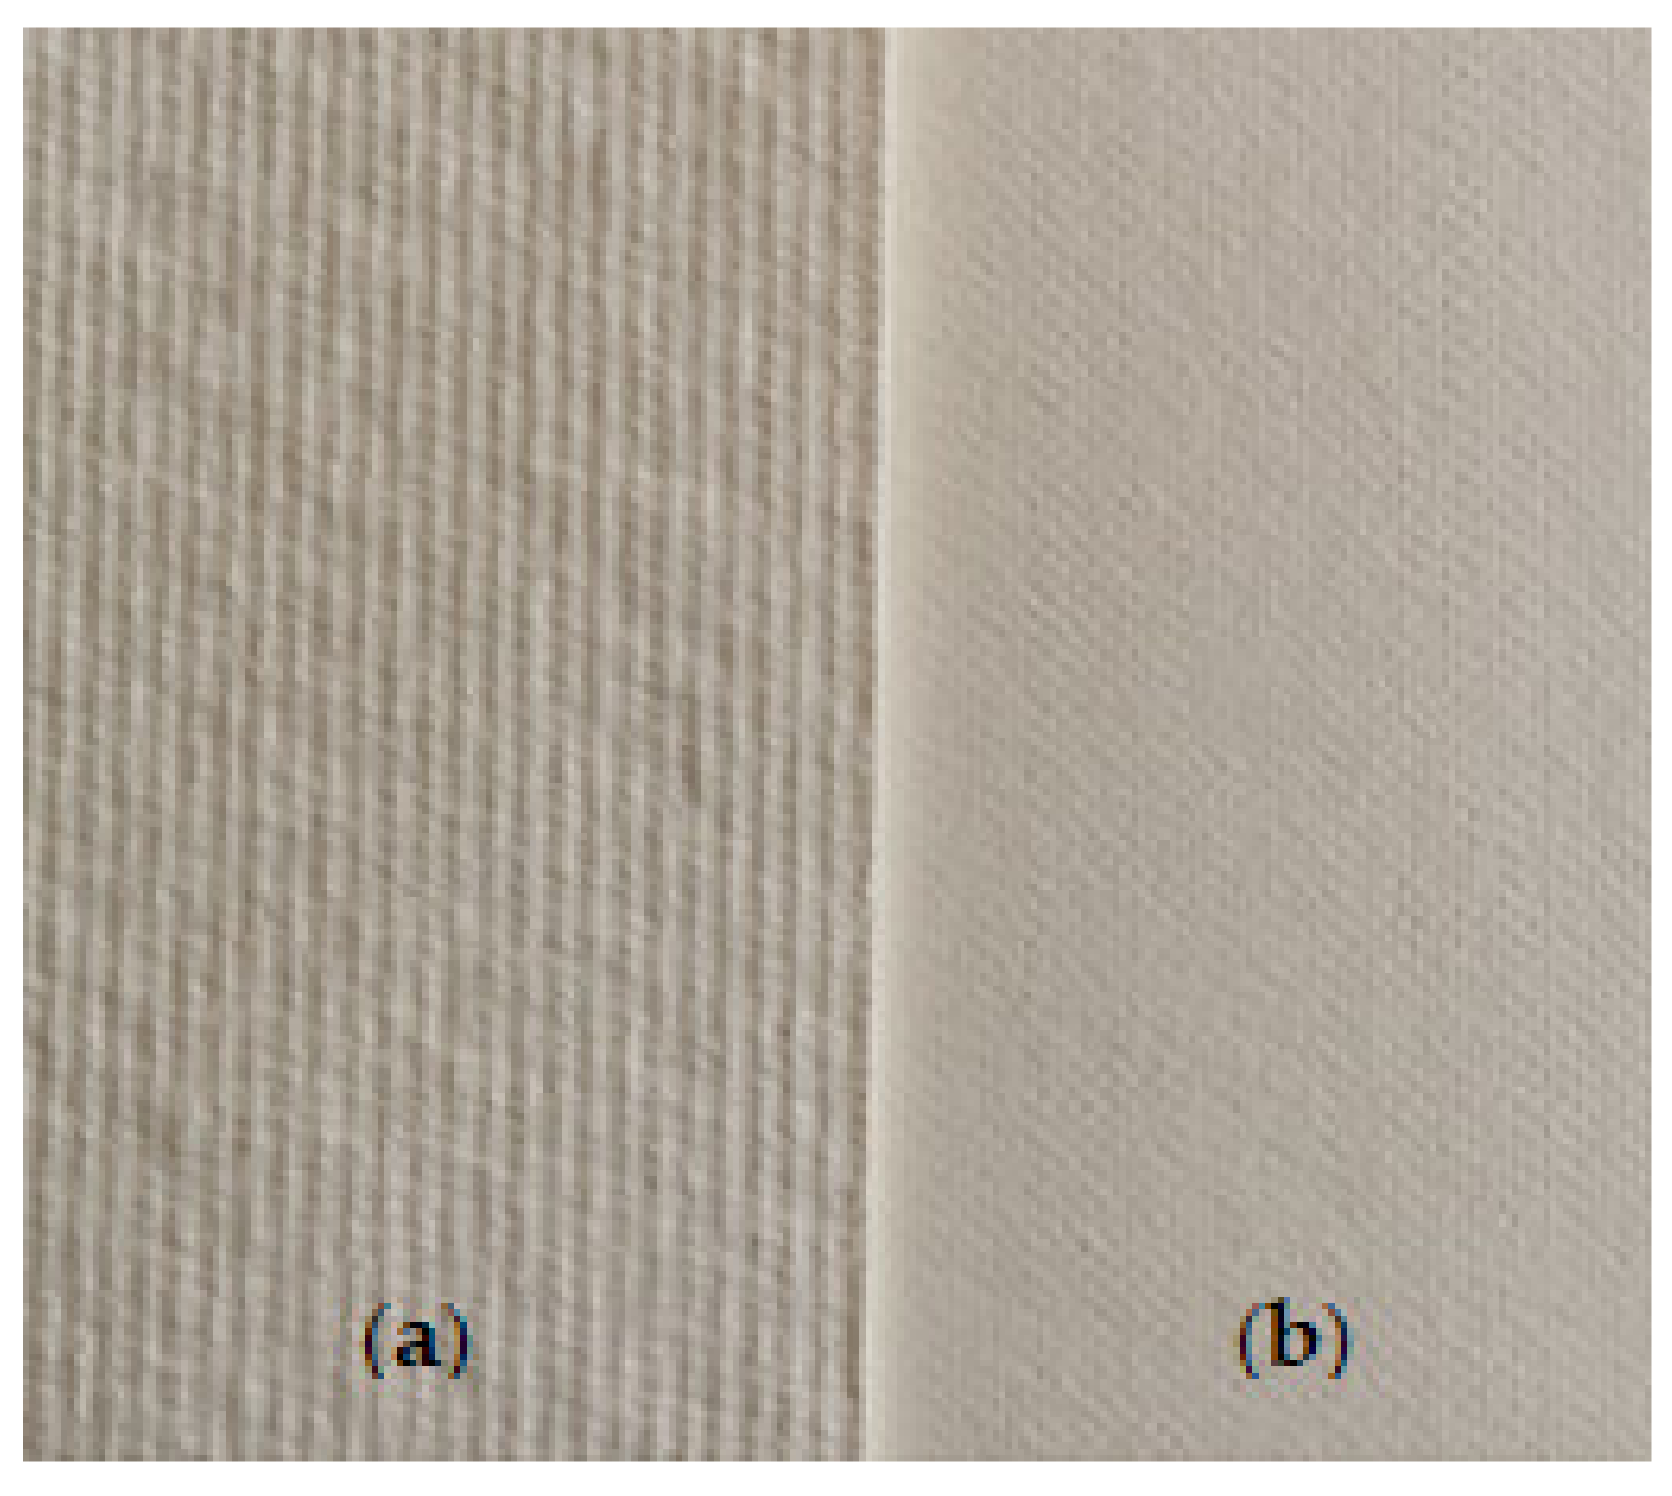
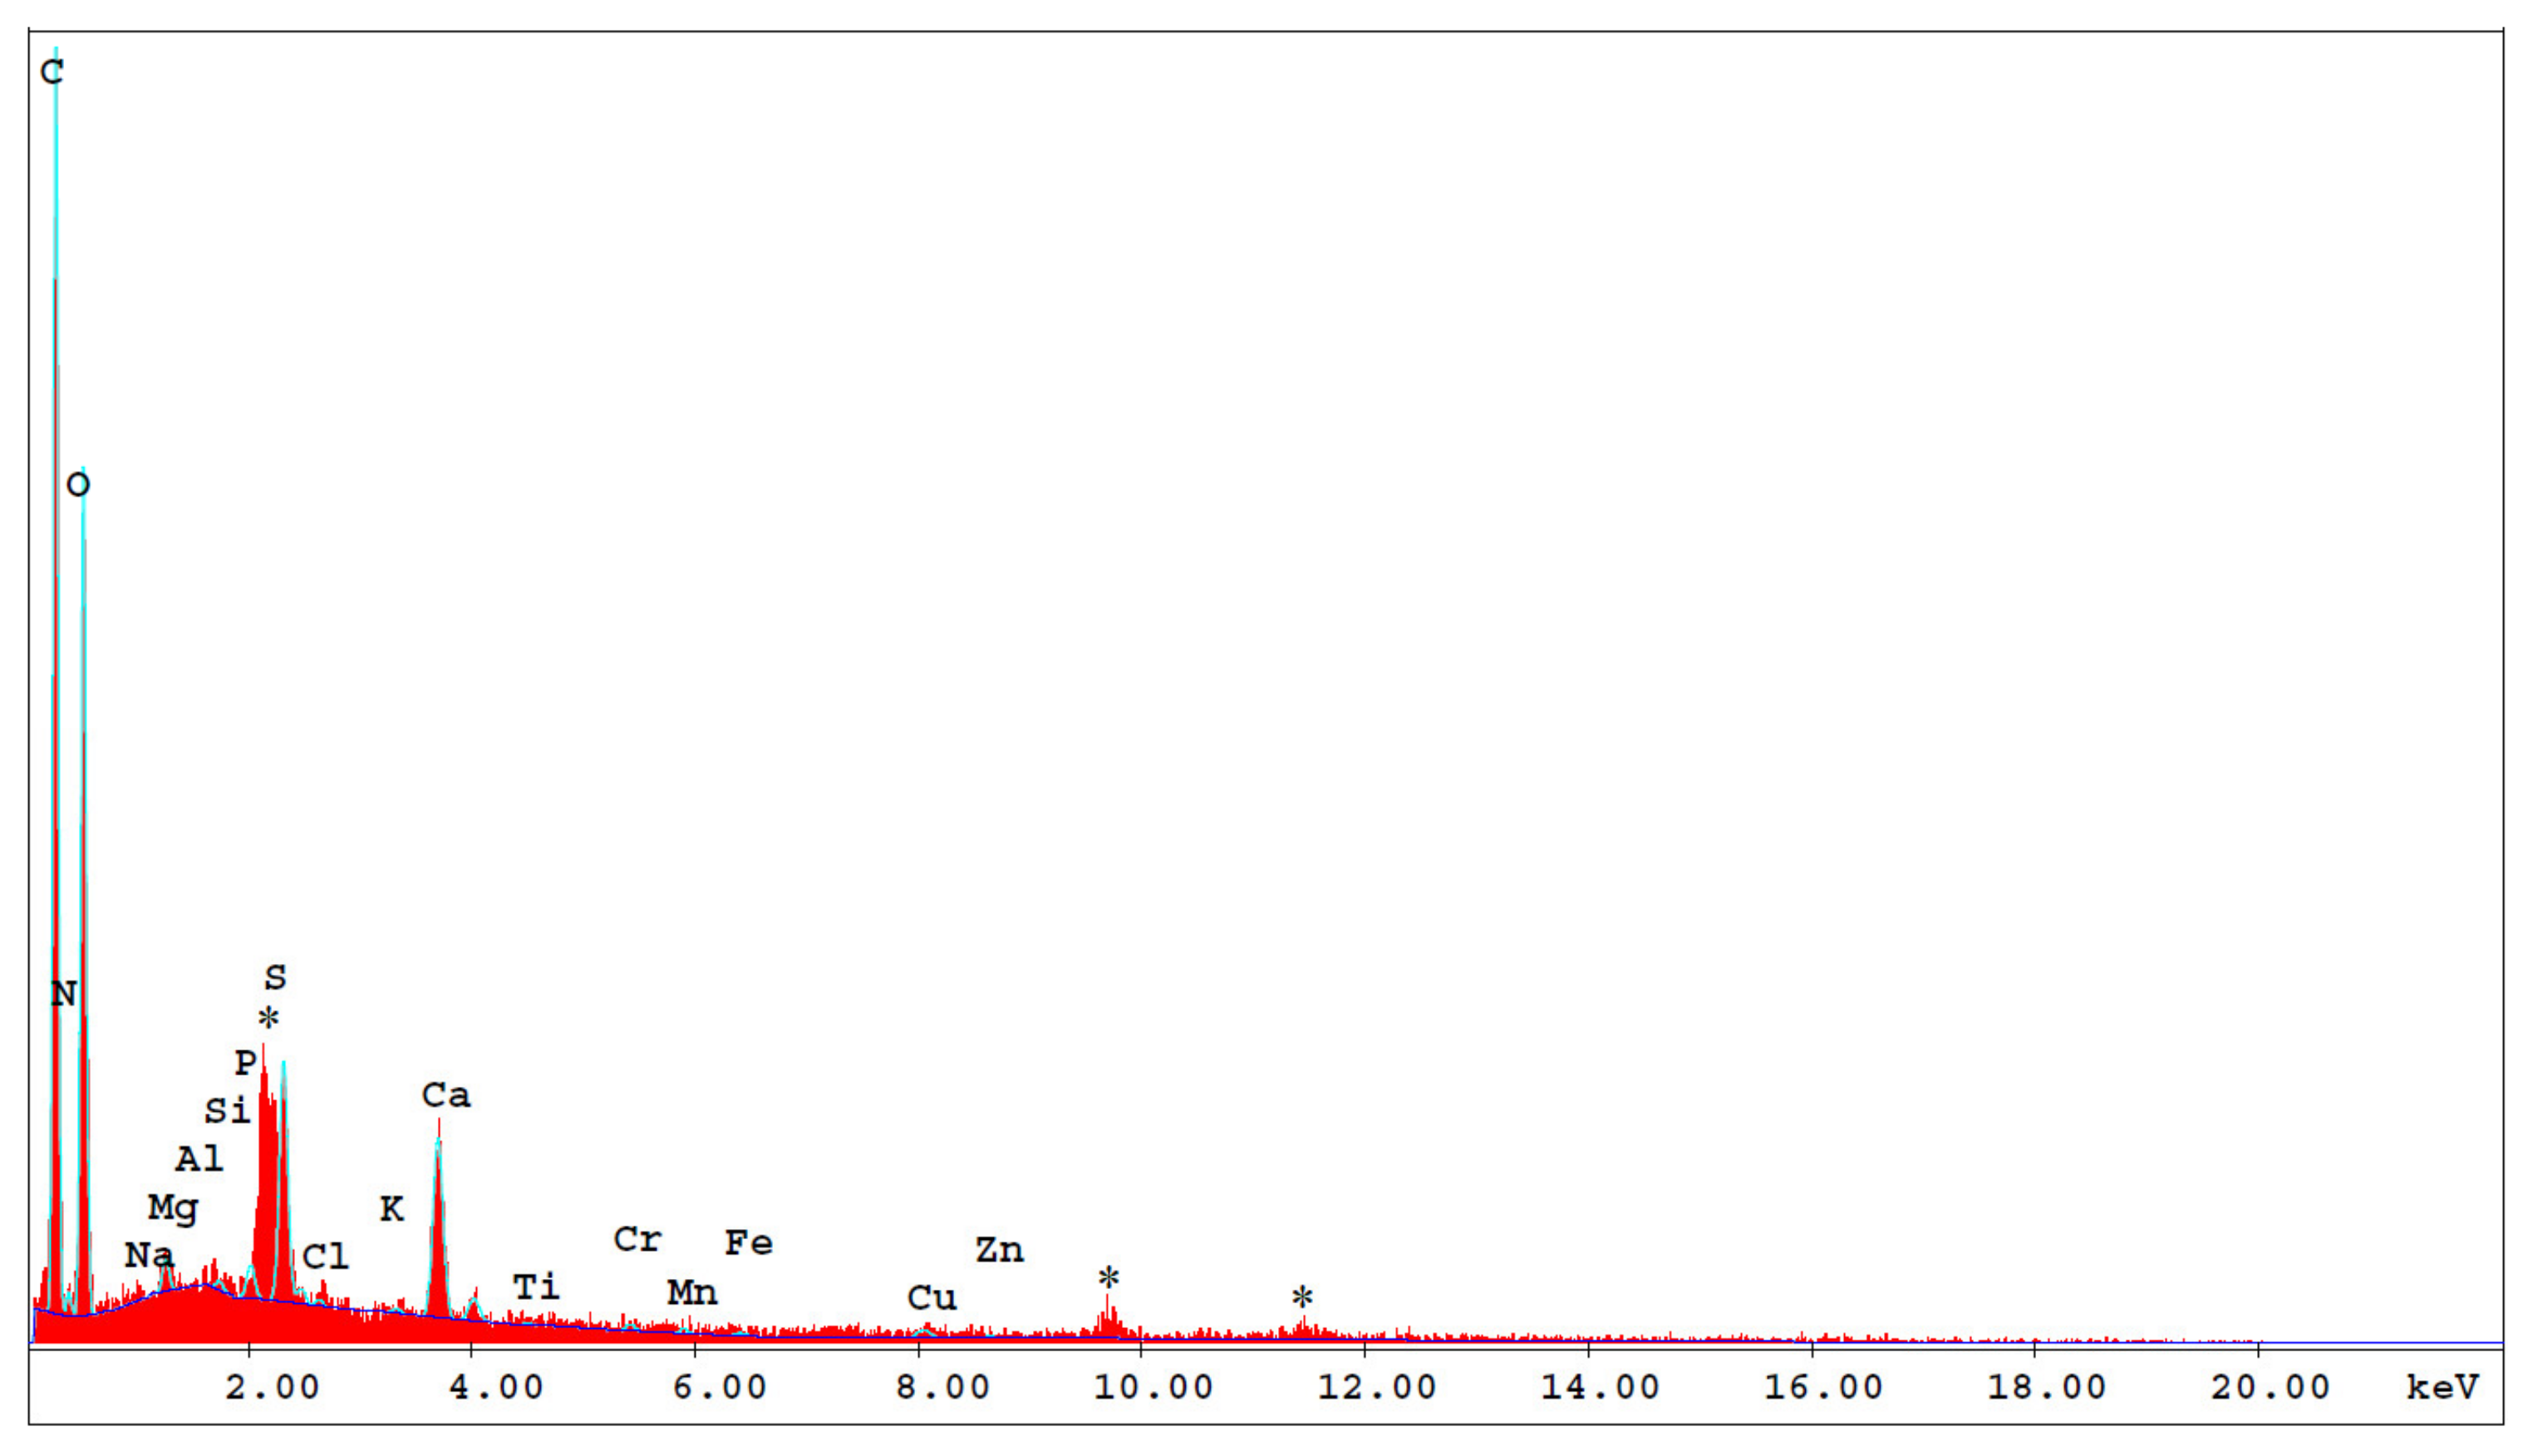
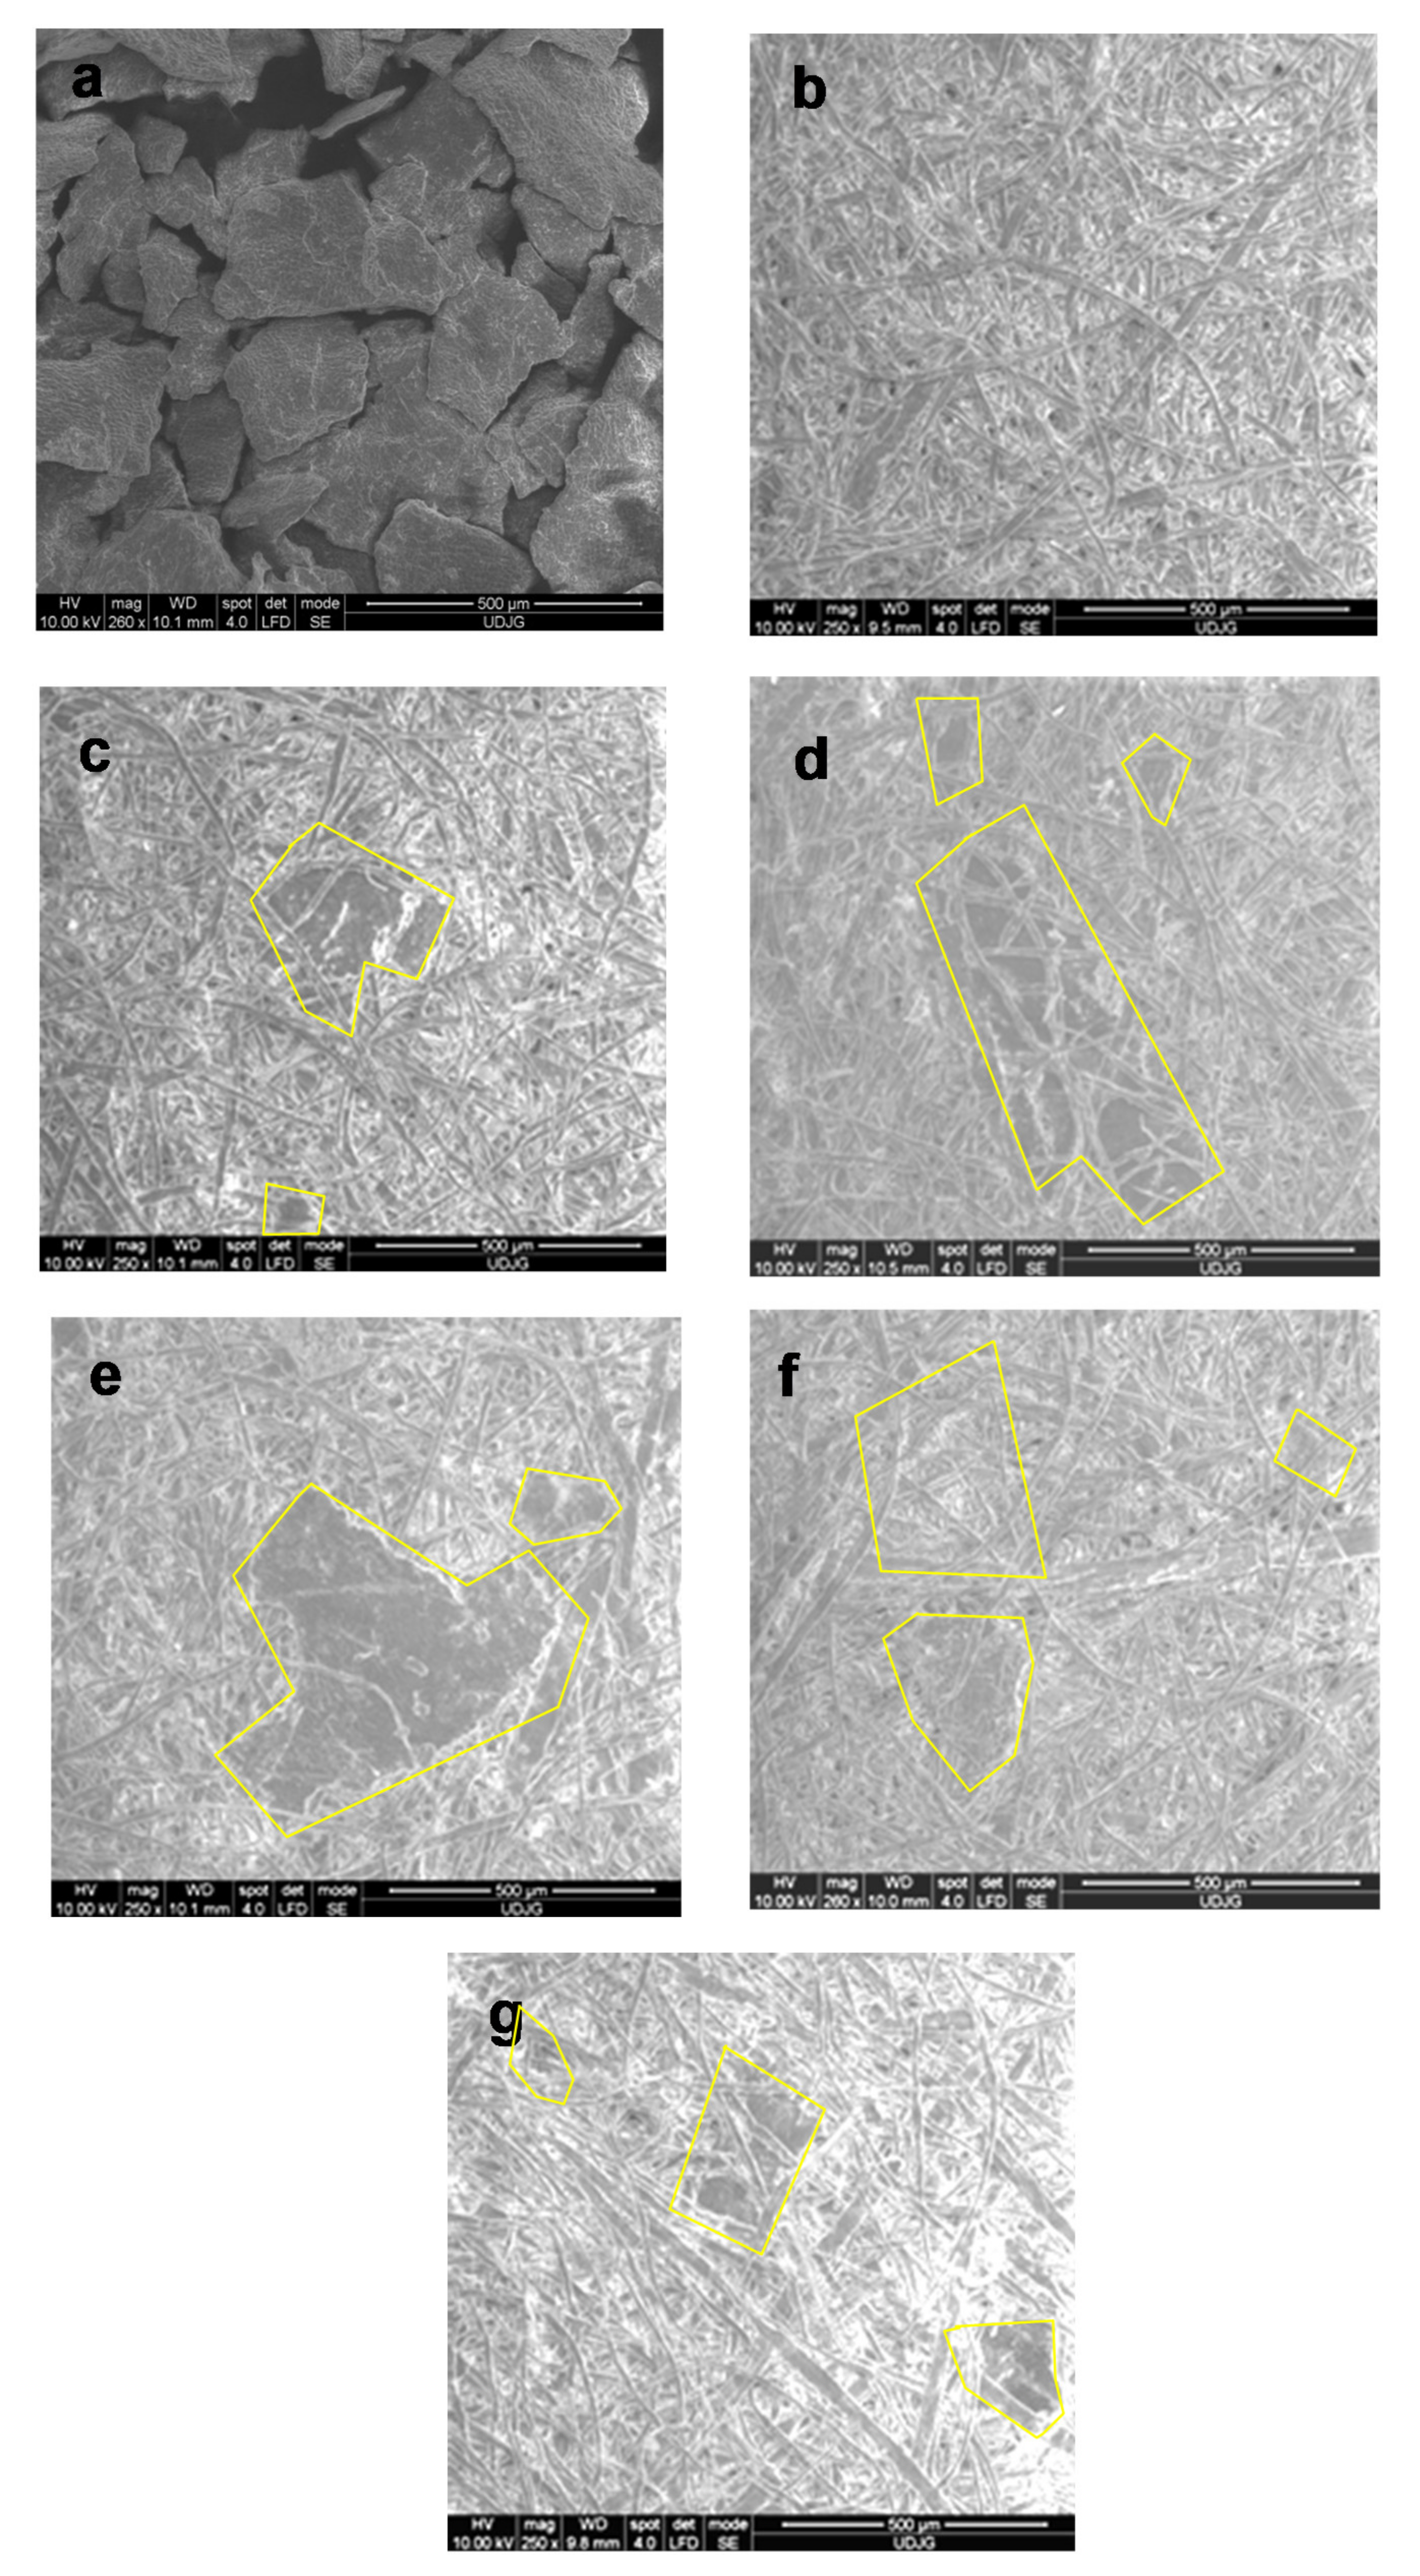
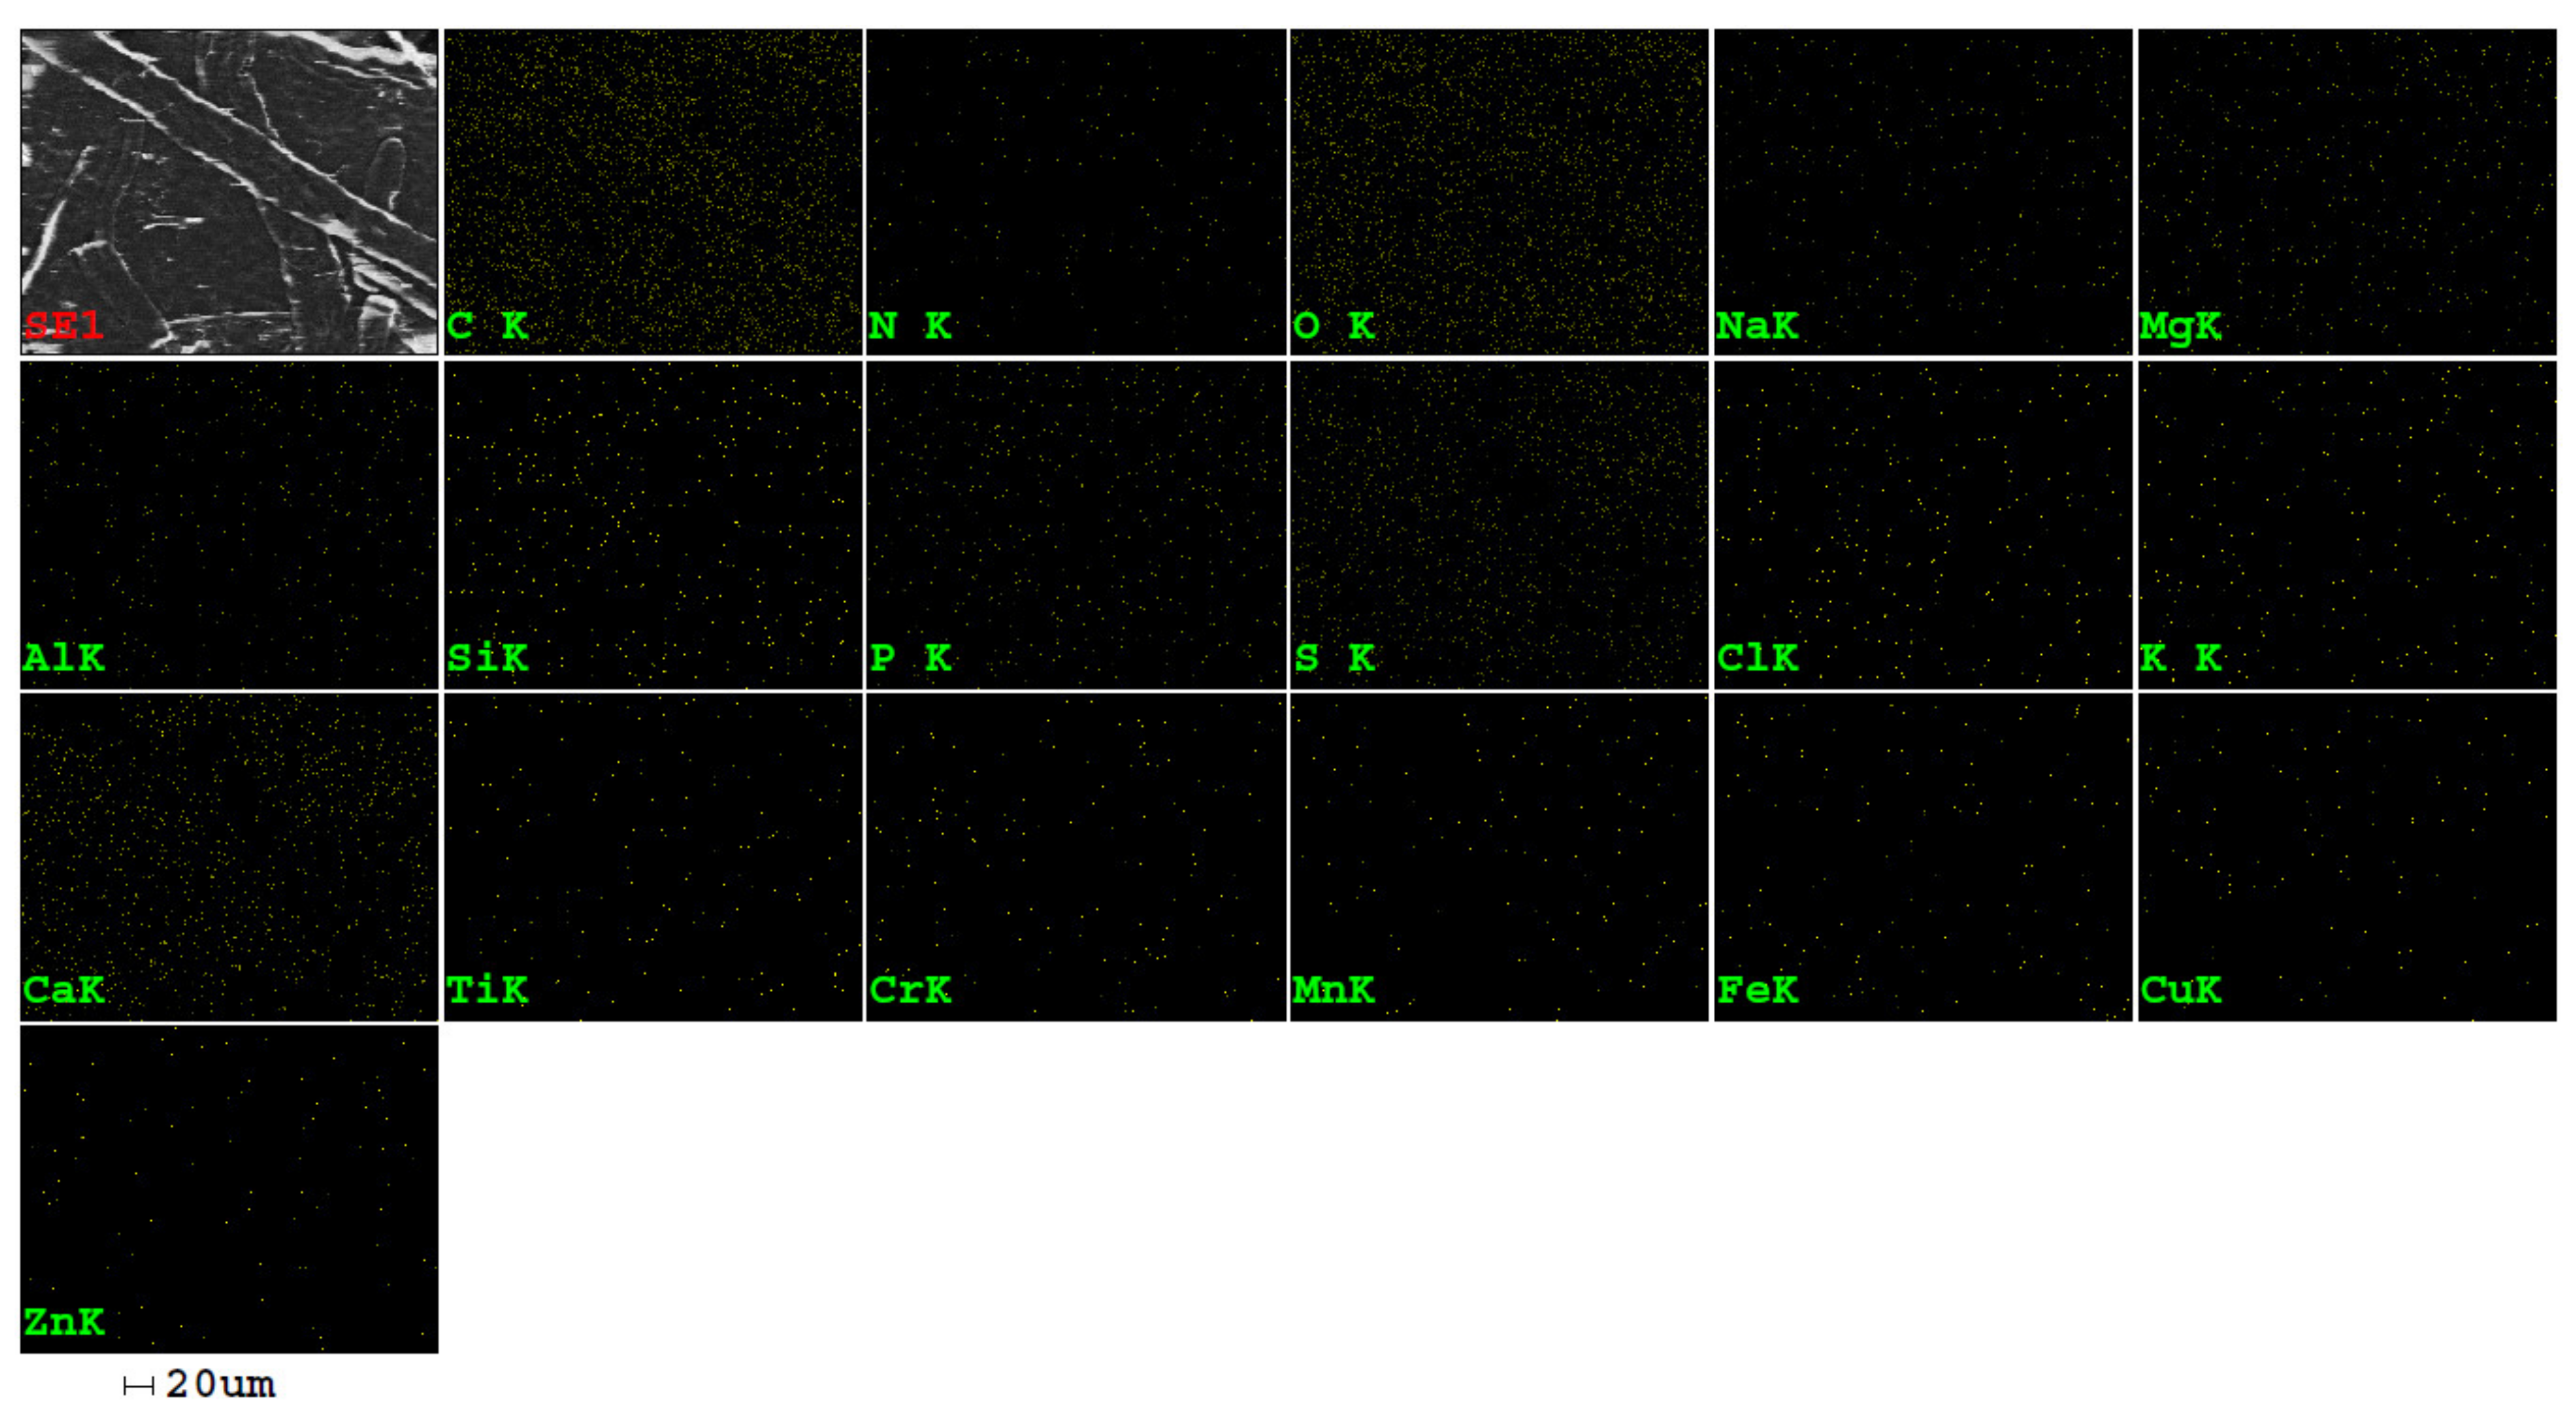
3.4. SEM–EDX Morphological and Elemental Characterization of Filter Paper with Added Macrophyte Marine Algae

The incorporation of Ulva rigida as marine algae species in filter paper was assessed with SEM technique in order to evaluate the microstructural modifications during the homogenization process. Imagistic results (Figure 6a–g) highlighted an optimum absorption level according to the algae content added into the paper substrate.
Firstly, the algae powdery was subjected to imagistic evaluation after dehydration process. The microscopic view presents the Ulva rigida particles’ flake-like structure and surface with irregular polygonal shape (mean size about 500 µm) (Figure 6a). A regular cellular arrangement with oval-shaped cells was observed on each particle’s surface. These cells are densely packed having a similar microstructure with the industrial foams.
The SEM image of the control sample (Figure 6b) revealed randomly cellulose fibers forming a dense network, which it proves a high mechanical strength, and some microporosity, as a result of production of successive 10 sheets of paper.
Afterwards, during the synthesis process, the increase of algae content will modify the distribution of the fibrillar network structure. For the next SEM micrographs (Figure 6c–g), along with increasing the macroalgae content in the paper matrix from 0.5% to 8% concentration, different arrangement of paper fibers was presented, and how much space the algal regions gradually take up. The algae particles’ incorporation was visible as dark gray polygonal plates (small pieces or aggregates) among fibers and delimited through yellow lines on each image.
As SEM images revealed, the tested materials showed an optimum incorporation level of macrophytes related to their concentration, and a micro-heterogeneity surface, also. Thus, the particles are uniform distributed on the paper network, indicating high efficiency of the homogenization process. Moreover, increased particles amount (i.e., 4% and 8%) led to the formation of large algal regions, similar to aggregations (Figure 6f,g).
Another important aspect is related to the different interaction stages between algae particles and paper fibers. Whereas, for 8% algae amount, a successful incorporation will not improve the mechanical strength characteristics of synthesized material according with the above results presented in Supplementary Materials Figure S15 (Averages of the results of the determination of tearing resistance), Figure S16 (Average Results of bursting strength tests) and Figure S17 (The average results of the folding endurance determinations),. This behavior might indicate the repulsive effect of algae and paper, leading to the weakening the fibrillar network. Microstructural images confirmed the absence of synergy between two phases.
Algae addition increased the absorption capacity of the filter paper (cellulose-algae composite), aspect that can also be seen from the (Supplementary Materials Figure S18, Average results for Cobb60 water absorptiveness), the water absorption capacity of dried and ground algae is higher than that of cellulose fibers. The algae particles behave as a filler, compacting the paper structure.
The chemical micro-analysis of synthesized materials was performed by EDX method and the quantitative results are given in Table 2 A typical EDX spectrum of a filter paper with algae addition is presented in Figure 7, 18 elements being detected at different level of variation. Figure 8 shows the elemental mapping in a micro-area of the paper material.
Quantitative analysis of paper-algae system indicated, in addition to C and O (H cannot be identified) as based elements from paper, the presence of other major components namely minerals and metals. Therefore, the amount of inorganic constituents was determined hereunder: macro-elements (viz N, P, K), meso-elements (viz Ca, Mg and S) and micro-elements (viz Na, Si, Al, Cl and Ti). Firstly, N (2.41–3.05 wt.%) was observed at higher level, and S (1.89–2.58 wt.%) at medium level. The presence of N- and P-like nutrients proposes the Ulva rigida as factor for algae biomass production. Secondly, Na (0.13–0.29 wt.%), Si (0.07–0.21 wt.%) and Al (0.00–0.14 wt.%) can be bio-accumulated by Ulva rigida at trace level.
The amount of each cation (K, Na, Mg and Ca) showed the same tendency of variation related to the added algal content. For all samples, Ca concentration was higher than Mg. Obtained data show a difference between elements concentration among increasing the algae content, confirmed by ash content results (Supplementary Materials Figure S12, Average Results of ash content determination).
Moreover, phosphate, nitrogenous, nitrites compounds can be identify being essential for photosynthesis, and silicon oxides from siliceous skeleton of diatoms. By bioaccumulation as spontaneous process occurred into saline water, some metallic elements were found, such as Zn (0.27–0.79 wt.%), Cu (0.00–0.79 wt.%), Fe (0.13–0.44 wt.%), Mn (0.00–0.27 wt.%) and Cr (0.00–0.14 wt.%), in descending sequence of their concentration. This fact can demonstrate an optimum integration process of metal ions through the cellular network of biomass. Ulva rigida enhanced with Zn and Cu ions (maximum content of 0.79 wt.%) has indicated their distribution as aggregation on the macroalgae surface. Reduction of Ca, Na and K ions concentration induced the metal ions exchange with Zn and Cu during biosorption process.

3.5. Determination of the Paper Filtration Capacity of Heavy Metals, TDS and TSS from the Wastewater

Table 3 presents the results obtained for initial and post-filtration heavy metals concentrations, TDS and TSS, using filter paper with different stranded seaweed additions, compared to national technical regulations NTPA-001 [62] and NTPA-002 [63]. NTPA-001 establishes pollutant limits for industrial and municipal wastewater discharges to natural receptors; NTPA-002 defines the conditions for the discharge of wastewater into the sewerage networks of municipalities and directly into treatment plants.
It can be seen from Table 3 that the initial concentrations for Cu, Fe total, Zn, and TSS exceed the maximum allowable limits imposed by NTPA 001 and NTPA 002.
Marine algae introduced into the paper, dislocate part of the fibers, conferring the advantages of improving the filtration and strength properties of the paper, and can be bleached with H2O2.
  • Determination of total Cr concentrations from the wastewater and after filtration test
From the data presented on total Cr filtration, and comparing the samples with the results obtained after water filtration using P0, we can see that P1 shows an improvement in pollutant reduction by 40%, P2 improves by 46.7%, P3 reduces by 40%, while P4 and P5 improve by 53.3%. All the values resulting from filtration using the 6 filter paper samples show values below the maximum permissible limit imposed by legislation. Analyzing the results according to the initial concentrations of the wastewater sample, we observe that the filter paper samples reduced the pollutant concentrations by a minimum of 59.46% by P0 and a maximum of 81.08% using P4 and P5 (Table 3 and Supplementary Materials Figure S20).
  • Determination of Cu concentrations from the wastewater and after filtration test
From the presented diagram we can conclude that all filter paper samples are effective in reducing the Cu pollutant concentrations from the wastewater. Compared to P0, P1 does not bring any qualitative contribution in reducing the concentration, P2 shows a decrease by 5%, P3 is more efficient with 10%, P4 with 25% and P5 with 45% and analyzing by comparison with the initial concentration of Cu in the wastewater sample, we observe that P0 and P1 have an efficiency of 88.88%, P3 of 88.33%, P4 of 90% and P5 shows the best efficiency in reducing the pollutant, 91.67% (Table 3 and Supplementary Materials Figure S21).
  • Determination of total Fe concentrations from the wastewater and after filtration test
Comparing the efficiency of the mass-added algae filter paper samples with P0 control sample, we observe that P1 shows an efficiency of 42.86% in reducing the concentration of total Fe, P2 with 28.57%, and samples P3, P4 and P5 show an improvement in Cu2+ concentration reduction capacity of 57.14%. Comparing the reduction capacity with the initial wastewater pollutant concentration, P0 shows a 98.86% yield, p1 99.3%, P2 99.19% and samples P3, P4 and P5 99.51%. All 6 samples can reduce total Fe concentrations by more than 98% (Table 3 and Supplementary Materials Figure S22).
  • Determination of Zn concentrations from the wastewater and after filtration test
In reducing the concentration of Zn, sample P1 shows an efficiency of 22.73% compared to P0, P2 of 54.55%, P3 of 50%, P4 with 63.64% and P5 of 59.1%, and compared to the initial concentration of the wastewater sample, P0 reduced the concentration of the pollutant by 88.54%, P1 with 91.15%, P2 of 94.79%, P3 by 94.27%, P4 with 95.83% and P5 with 95.31%. A better retention capacity is observed for the seaweed filter paper samples, above 91% for all 5 samples (Table 3 and Supplementary Materials Figure S23).
  • Determination of TDS concentrations from the wastewater and after filtration test
In determining the TDS retention improvement, we observe small changes, P1 shows an efficiency of 0.46% compared to P0, P2 and P3 of 3.21%, P4 of 3.9% and P5 of 3.67%. Compared to the original wastewater data, P0 shows a 6.84% efficiency of TDS retention improvement, P1 a 7.26% efficiency, P2 and P3 a 10.47% efficiency and P5 a 10.26% improvement (Table 3 and Supplementary Materials Figure S24).
  • Determination of TSS concentrations from the wastewater and after filtration test
From the data obtained, it is concluded that P0 reduces TSS concentrations by 99.8%, P1 by 99.91% and P2 by 99.87%; and the last samples, P3, P4 and P5, show an efficiency of 100%. Comparing the samples of interest with P0, P1 shows a high efficiency of 60%; P2 of 40%; and P3, P4 and P5 of 100% (Table 3 and Supplementary Materials Figure S20).
It should be mentioned that the filter papers that are used in analytical chemistry are made of pure or modified cellulose fibers, and the contained acid functional groups, carbonyl groups and hydroxyl groups act as adsorbents of metal ions [64,65]; therefore, the results obtained are similar in values. Nevertheless, it can be observed that marine algae material added to the paper mass improves the retention capacity of the studied metal ions, depending on the concentration in which they are found in wastewater.

4. Conclusions

The aim of these filter papers with mass addition of marine algae is not to be used as a complementary material to metal ion removal studies for biomass separation, as they are known to cause systematic errors in the overall process [66]; instead, they can be used as an alternative for the removal of the studied metal ions. Environmental pollution is currently a global concern, and solutions are constantly being sought to improve the environmental factors that are affected by the irresponsible actions of the world’s population. All environmental factors are closely interrelated, but their balance has been disturbed by industrial development, domestic activities and transport. Water is a vital resource for sustaining the health and life of all organisms, and heavy metal contamination is a concern among many others. The pollution of natural waters is becoming increasingly advanced, and current methods for removing pollutants are becoming less effective. Moreover, some sewage treatment plants are already facing problems relating to under-dimensioning, and the treatment methods currently used need to be improved. Heavy metal pollutants are present in industrial wastewater discharged into effluent without proper treatment, which is why a biological treatment method should be considered.
Stranded seaweed is considered a waste, but it can be exploited as an adsorbent to remove elements from contaminated water. On an experimental level, it was possible to incorporate seaweed into the paper mass. It was observed that the addition of seaweed does not influence the grammage, thickness and apparent specific volume of the paper; it does not absorb a large volume of water from the air.
Strength characteristics, such as breaking load, breaking length, tearing resistance, folding endurance and water absorption, were slightly improved by an optimum addition of 4% stranded seaweed to the filter paper mass. The addition of 8% stranded seaweed weakens the strength of the fiber network, thus lowering the strength characteristics of the filter paper. All samples of filter paper with seaweed mass addition show a high yield for the removal of total Cr, Cu, total Fe, Zn, and of TDS and TSS from the metallurgical industry wastewater.
Such an application, after multiple tests to validate the laboratory results at pilot and then industrial level, can be used to obtain an effective product for the removal of pollutants, such as heavy metals, found in polluted water, as the algae have adsorbent properties and are able to adsorb impressive quantities of pollutants.

Supplementary Materials

The following are available online at https://www.mdpi.com/article/10.3390/su131910763/s1. Figures S1: (a) Macrophytes developed at shallow depths; (b) Macroalgae wrack collected from Romanian coast, Casino Constanta area, Figure S2: Wastewater sample from the metallurgical industry used in the filtration experiment, Figure S3: Manual homogenization of the material, Figure S4: Rapid Köthen–sheet former, Figure S5: Laboratory sheets of filter paper with added algae, before drying and after drying, Figure S6: (a) Samples of filter paper with added seaweed mass subjected to the filtration process; (b) Residues following filtration, Figure S7: Average grammage determination results, Figure S8: Average thickness determination results, Figure S9: Apparent specific volume determination results, Figure S10: Average permeance determination results, Figure S11: Average smoothness determination results, Figure S12: Average results of ash content determination, Figure S13: The average results of determining the breaking load, Figure S14: The results of determining the breaking length, Figure S15: Averages of the results of the determination of tearing resistance, Figure S16: Average Results of bursting strength tests, Figure S17: The average results of the folding endurance determinations, Figure S18: Average results for Cobb60 water absorptiveness, Figure S19: Average moisture determination results, Figure S20: Graphical representation showing the results of Cr total concentrations obtained after wastewater filtration using filter papers with different mass additions of Ulva rigida algae, Figure S21: Graphical representation of the efficiency of Cu filtration from wastewater using filter papers with different mass additions of seaweed Ulva rigida, Figure S22: Diagram of the efficiency of filtering Fe total from wastewater from the metallurgical industry, testing filter papers with seaweed mass addition, Figure S23: Diagram of the efficiency of filtering Zn from wastewater from the metallurgical industry, testing filter papers with seaweed mass addition, Figure S24: Graphical representation showing the results of TDS concentrations obtained after wastewater filtration using filter papers with different mass additions of Ulva rigida algae, Figure S25: Graphical representation showing the results of TSS concentrations obtained after wastewater filtration using filter papers with different mass additions of Ulva rigida algae.

Author Contributions

Conceptualization, F.-C.C. and A.E.; funding acquisition, A.E.; investigation, F.-C.C., A.E. and A.C.C.; methodology, F.-C.C., A.E. and A.C.C.; supervision, A.E.; validation, F.-C.C. and A.C.C.; visualization, A.E.; writing—original draft, F.-C.C. and A.C.C.; writing—review and editing, A.E. All authors have read and agreed to the published version of the manuscript.

Funding

The APC is funded by “Dunarea de Jos” University of Galati, Romania.

Institutional Review Board Statement

Not applicable.

Informed Consent Statement

Not applicable.

Data Availability Statement

The data that support the findings of this study are available from the first (F.-C.C.) and corresponding (A.E.) authors, upon reasonable request.

Acknowledgments

Caprita Florina Cristiana’s work was supported by the project “ANTREPRENORDOC”, Contract no. 36355/23.05.019, financed by The Human Capital Operational Programme 2014-2020 (POCU), Romania. This research was partially funded by the Joint Operational Programme Black Sea Basin 2014–2020 through the project with code BSB27 (MONITOX). The authors acknowledge the infrastructure and support of INPOLDE research center of Dunarea de Jos University of Galati and Ceprohart SA Braila, Romania.

Conflicts of Interest

The authors declare no conflict of interest.

References

  1. Lembi, C.A. 24-Control of nuisance algae. In Freshwater Algae of North America; Wehr, J.D., Sheath, R.G., Eds.; Academic Press: Burlington, NJ, USA, 2003; pp. 805–834. [Google Scholar] [CrossRef]
  2. Chapman, R.L. Algae: The world’s most important “plants”—An introduction. Mitig. Adapt. Strateg. Glob. Chang. 2013, 18, 5–12. [Google Scholar] [CrossRef] [Green Version]
  3. Alba, K.; Kontogiorgos, V. Seaweed Polysaccharides (Agar, Alginate Carrageenan). In Encyclopedia of Food Chemistry; Melton, L., Shahidi, F., Varelis, P., Eds.; Academic Press: Oxford, UK, 2019; pp. 240–250. [Google Scholar] [CrossRef]
  4. Caprita, F.; Ene, A. Valorification directions for marine algae. Ann. Univ. Dunarea De Jos Galati Fasc. II Math. Phys. Mec. Theor. 2019, 42, 10–18. [Google Scholar] [CrossRef]
  5. McHugh, D.J. Introduction to commercial seaweeds. In A Guide to the Seaweed Industry; Food & Agriculture Organization of the United Nations (FAO): Rome, Italy, 2003; Volume 441, pp. 1–6. [Google Scholar]
  6. Balina, K.; Romagnoli, F.; Pastare, L.; Blumberga, D. Use of macroalgae for bioenergy producíon in Latvia: Review on potential availability of marine coastline species. Energy Procedia 2017, 113, 403–410. [Google Scholar] [CrossRef]
  7. Aitken, D.; Bulboa, C.; Godoy-Faundez, A.; Turrion-Gomez, J.L.; Antizar-Ladislao, B. Life cycle assessment of macroalgae cultivation and processing for biofuel production. J. Clean. Prod. 2014, 75, 45–56. [Google Scholar] [CrossRef]
  8. Bruton, T.; Lyons, H.; Lerat, Y.; Stanley, M.; Rasmussen, M.B. A Review of the Potential of Marine Algae as a Source of Biofuel in Ireland; Sustainable Energy Ireland: Dublin, Ireland, 2009; pp. 1–88. Available online: https://cdn.technologynetworks.com/TN/Resources/PDF/algae%20report%2004%202009.pdf (accessed on 7 February 2021).
  9. Bayu, A.; Handayani, T. High-value chemicals from marine macroalgae: Opportunities and challenges for marine-based bioenergy development. IOP Conf. Ser. Earth Environ. Sci. 2018, 209, 12046. [Google Scholar] [CrossRef]
  10. Chen, H.; Zhou, D.; Luo, G.; Zhang, S.; Chen, J. Macroalgae for biofuels production: Progreess and perspectives. Renew. Sustain. Energy Rev. 2015, 47, 427–437. [Google Scholar] [CrossRef]
  11. Bilal, M.; Rasheed, T.; Sosa Hernández, J.E.; Raza, A.; Nabeel, F.; Iqbal, H. Biosorption: An Interplay between Marine Algae and Potentially Toxic Elements—A Review. Mar. Drugs 2018, 16, 65. [Google Scholar] [CrossRef] [Green Version]
  12. Romera, E.; González, F.; Ballester, A.; Blázquez, M.L.; Muñoz, J.A. Biosorption With Algae: A Statistical Review. Crit. Rev. Biotechnol. 2006, 26, 223–235. [Google Scholar] [CrossRef] [PubMed]
  13. Romera, E.; González, F.; Ballester, A.; Blázquez, M.L.; Muñoz, J.A. Comparative study of biosorption of heavy metals using different types of algae. Bioresour. Technol. 2007, 98, 3344–3353. [Google Scholar] [CrossRef] [PubMed]
  14. Beni, A.A.; Esmaeili, A. Biosorption, an efficient method for removing heavy metals from industrial effluents: A Review. Environ. Technol. Innov. 2020, 17, 100503. [Google Scholar] [CrossRef]
  15. Caprita, F.; Ene, A. Biosorption of heavy metals from the metallurgical industry wastewater by macroalgae. AIP Conf. Proc. 2020, 2218, 030011. [Google Scholar] [CrossRef]
  16. He, J.; Chen, J.P. A comprehensive review on biosorption of heavy metals by algal biomass: Materials, performances, chemistry, and modeling simulation tools. Bioresour. Technol. 2014, 160, 67–78. [Google Scholar] [CrossRef]
  17. Santhi, T.; Manonmani, S.; Smitha, T. Removal of malachite green from aqueous solution by activated carbon prepared from the epicarp of Ricinuscommunis by adsorption. J. Hazard. Mater. 2010, 179, 178–186. [Google Scholar] [CrossRef]
  18. Gonçalves, A.C., Jr.; Schwantes, D.; Campagnolo, M.A.; Dragunski, D.C.; Tarley, C.R.T.; Silva, A.K.D.S. Removal of toxic metals using endocarp of açaí berry as biosorbent. Water Sci. Technol. 2018, 77, 1547–1557. [Google Scholar] [CrossRef] [PubMed] [Green Version]
  19. Pereira de Sá, C.H.; da Silva, M.G.C.; Gurgel Adeodato, V.M. Biosorption of aluminum ions from aqueous solutions using non-conventional low-cost materials: A review. J. Water Process. Eng. 2021, 40, 101925. [Google Scholar] [CrossRef]
  20. Saif, S.; Tahir, A.; Chen, Y. Green Synthesis of Iron Nanoparticles and Their Environmental Applications and Implications. Nanomaterials 2016, 6, 209. [Google Scholar] [CrossRef] [Green Version]
  21. Bhatnagar, A.; Minocha, A.K. Biosorption optimization of nickel removal from water using Punica granatum peel waste. Colloids Surf. B 2010, 76, 544–548. [Google Scholar] [CrossRef]
  22. Areco, M.M.; Salomone, V.N.; María dos Santos, A. Ulva lactuca: A bioindicator for anthropogenic contamination and its environmental remediation capacity. Mar. Environ. Res. 2021, 171, 105468. [Google Scholar] [CrossRef]
  23. Conti, M.E.; Cecchetti, G. A biomonitoring study: Trace metals in algae and molluscs from Tyrrhenian coastal areas. Environ. Res. 2003, 93, 99–112. [Google Scholar] [CrossRef]
  24. Doshi, H.; Seth, C.; Ray, A.; Kothari, I.L. Bioaccumulation of heavy metals by green algae. Curr. Microbiol. 2008, 56, 246–255. [Google Scholar] [CrossRef]
  25. Wang, J.; Chen, C. Biosorbents for heavy metals removal and their future. Biotechnol. Adv. 2009, 27, 195–226. [Google Scholar] [CrossRef]
  26. Kordialik-Bogacka, E.; Smolińska, B.; Cedzyńska, K.; Ambroziak, W. Regeneration of biomass used in the biosorption of cadmium. New Biotechnol. 2009, 25, S375. [Google Scholar] [CrossRef]
  27. Pop, C.-E.; Draga, S.; Măciucă, R.; Niță, R.; Crăciun, N.; Wolff, R. Bisphenol A Effects in Aqueous Environment on Lemna minor. Processes 2021, 9, 1512. [Google Scholar] [CrossRef]
  28. Kuncoro, E.; Soedarti, T.; Putranto, T.; Darmokoesoemo, H.; Abadi, N.; Kusuma, H. Characterization of a mixture of algae waste-bentonite used as adsorbent for the removal of Pb2+ from aqueous solution. Data Brief 2017, 16, 908–913. [Google Scholar] [CrossRef] [PubMed]
  29. Mossbauer, M.; Haller, I.; Dahlke, S.; Schernewski, G. Management of stranded eelgrass and macroalgae along the German Baltic coastline. Ocean Coast Manag. 2012, 57, 1–9. [Google Scholar] [CrossRef]
  30. Fahmy, Y.; Fahmy, T.; Mobarak, F.; El-Sakhawy, M.; Fadl, M.H. Agricultural Residues (Wastes) for Manufacture of Paper, Board, and Miscellaneous Products: Background Overview and Future Prospects. Int. J. Chemtech Res. 2017, 10, 424–448. [Google Scholar] [CrossRef]
  31. Jiménez, L.; Rodríguez, A.; Pérez, P.; Moral, A.; Serrano, L. Alternative raw materials and pulping process using clean technologies. Ind. Crop. Prod. 2008, 28, 11–16. [Google Scholar] [CrossRef]
  32. Nassar, M.; Rahman, H.M.E.; El Sahkawy, M. An optimum mixture of virgin rice straw pulp and recycled old newsprint (ONP) pulp and their antimicrobial activity. Indian J. Biotechnol. 2015, 11, 63–71. [Google Scholar] [CrossRef]
  33. Shatalov, A.A.; Pereira, H. Influence of stem morphology on pulp and paper properties of Arundo donax L. reed. Ind. Crops Prod. 2002, 15, 77–83. [Google Scholar] [CrossRef]
  34. Cabalova, I.; Kačík, F.; Geffert, A.; Kačíková, D. The Effects of Paper Recycling and its Environmental Impact. In Environmental Management in Practice; Broniewicze, E., Ed.; IntechOpen: London, UK, 2011; Available online: https://www.intechopen.com/chapters/16296 (accessed on 10 August 2021)ISBN 978-953-307-358-3. [CrossRef] [Green Version]
  35. Jerusik, R.J. Fungi and paper manufacture. Fungal Biol. Rev. 2010, 24, 68–72. [Google Scholar] [CrossRef]
  36. Sousa-Silva, M.; Vieira, D.; Soares, P.; Casal, M.; Soares-Silva, I. Expanding the Knowledge on the Skillful Yeast Cyberlindnera jadinii. J. Fungi 2021, 7, 36. [Google Scholar] [CrossRef] [PubMed]
  37. Buerth, C.; Tielker, D.; Ernst, J.F. Candida utilis and Cyberlindnera (Pichia) jadinii: Yeast relatives with expanding applications. Appl. Microbiol. Biotechnol. 2016, 100, 6981–6990. [Google Scholar] [CrossRef] [PubMed]
  38. AbuBakr, S.; Thompson, J.R. PAPERMAKING The History of Paper and Papermaking. In Encyclopedia of Forest Sciences; Burley, J., Ed.; Elsevier: Oxford, UK, 2004; pp. 691–694. [Google Scholar] [CrossRef]
  39. Bhojvaid, P.P.; Rai, A.K. PAPERMAKING Paper Raw Materials and Technology. In Encyclopedia of Forest Sciences; Burley, J., Ed.; Elsevier: Oxford, UK, 2004; pp. 701–707. [Google Scholar] [CrossRef]
  40. Confederation of European Paper Industries. Cepi Statistics, KEY STATISTICS 2019 European Pulp & Paper Industry. Available online: https://www.cepi.org/wp-content/uploads/2020/07/Final-Key-Statistics-2019.pdf (accessed on 22 March 2021).
  41. Moral, A.; Aguado, R.; Castelló, R.; Tijero, A.; Ballesteros, M. Potential use of green alga Ulva sp. for papermaking. BioResources 2019, 14, 6851–6862. [Google Scholar] [CrossRef]
  42. González Pereira, A.; Corral, M.; García Oliveira, P.; Lourenço-Lopes, C.; Rodríguez, M.; Prieto Lage, M.; Simal-Gandara, J. The Use of Invasive Algae Species as a Source of Secondary Metabolites and Biological Activities: Spain as Case-Study. Mar. Drugs 2021, 19, 178. [Google Scholar] [CrossRef]
  43. Google Maps. Available online: https://www.google.com/maps/@44.170343,28.662744,74m/data=!3m1!1e3?hl=en-US (accessed on 3 February 2021).
  44. SR ISO 5264-1:1997, Pulps, Laboratory Beating—Part 1: Valley Beater Method, ICS 85.040. Available online: https://www.sis.se/en/produkter/paper-technology/pulps/iso52641/ (accessed on 22 March 2021).
  45. SR EN ISO 5267-1:2002, Pulps, Determination of Drainability—Part 1: Schopper-Riegler method, ICS 85.040. Available online: https://standards.iteh.ai/catalog/standards/sist/03c80711-1a02-4ef7-9d40-da56def91cc9/sist-iso-5267-1-2002 (accessed on 22 March 2021).
  46. SR EN 20187:1996, Pulp, Paper and Board, Standard Atmosphere for Conditioning and Testing and Procedure for Monitoring the Atmosphere and Conditioning Samples, ICS 85.040, ICS 85.060. Available online: https://www.iso.org/standard/4037.html (accessed on 13 March 2021).
  47. SR EN ISO 536:2020, Paper and Board, Determination of Grammage, ICS85.060. Available online: https://www.en-standard.eu/bs-en-iso-536-2020-paper-and-board-determination-of-grammage/ (accessed on 13 March 2021).
  48. SR EN ISO 534:2012, Paper and Board, Determination of Thickness, Density and Specific Volume, ICS 85.060. Available online: https://www.en-standard.eu/une-en-iso-534-2012-paper-and-board-determination-of-thickness-density-and-specific-volume-iso-534-2011/ (accessed on 23 March 2021).
  49. ISO 5636-5:2013, Paper and Board, Determination of Air Permeance (Medium Range)—Part 5: Gurley Method ICS 85.060. Available online: https://www.iso.org/standard/53062.html (accessed on 24 March 2021).
  50. ISO 5627:1995/COR 1:2002, Paper and Board, Determination of Smoothness (Bekk Method)—Technical Corrigendum 1 ICS 85.060. Available online: https://www.iso.org/standard/36977.html (accessed on 24 March 2021).
  51. ISO 2144:2019, Paper, Board, Pulps and Cellulose Nanomaterials, Determination of Residue (ASH content) on Ignition at 900 °C, ICS 85.060. Available online: https://www.iso.org/standard/73415.html (accessed on 24 March 2021).
  52. Ene, A.; Gheorghies, C.; Frontasyeva, M.V. X-ray based techniques used in materials analysis and control. In Proceedings of the 17th International conference New Technologies and Products in Machine Manufacturing Technologies-Tehnomus XVII, Suceava, Romania, 17–18 May 2013; Volume 1, pp. 193–196. Available online: http://www.tehnomusjournal.fim.usv.ro/en/pagini/journal2013/files/33.pdf (accessed on 28 July 2021).
  53. Ignatenko, O.V.; Komar, V.A.; Leonchik, S.V.; Shempel, N.A.; Ene, A.; Cantaragiu, A.; Frontasyeva, M.V.; Shvetsov, V.N. Changes of nitrides characteristics in Li-N system synthesized at different pressures. J. Alloys Compd. 2013, 581, 23–27. [Google Scholar] [CrossRef]
  54. SR EN ISO 1924-2:2009, Paper and Board, Determination of Tensile Properties—Part 2: Constant Rate of Elongation Method (20 mm/min), ICS 85.060. Available online: https://www.en-standard.eu/une-en-iso-1924-2-2009-paper-and-board-determination-of-tensile-properties-part-2-constant-rate-of-elongation-method-20-mm-min-iso-1924-2-2008/ (accessed on 24 March 2021).
  55. ISO 3781:2011, Paper and Board, Determination of Tensile Strength after Immersion in Water, ICS 85.060. Available online: https://www.iso.org/standard/56090.html (accessed on 24 March 2021).
  56. SR EN ISO 1974:2012, Paper, Determination of Tearing Resistance—Elmendorf Method, ICS 85.060. Available online: https://www.iso.org/standard/52430.html (accessed on 24 March 2021).
  57. SR EN ISO 2758:2015, Paper, Determination of Bursting Strength, ICS 85.060. Available online: https://www.iso.org/standard/61487.html (accessed on 24 March 2021).
  58. SR ISO 5626: 1996, Paper, Determination of Folding Endurance, ICS 85.060. Available online: https://www.iso.org/standard/11700.html (accessed on 24 March 2021).
  59. SR EN ISO 535:2014, Paper and Board, Determination of Water Absorptiveness—Cobb Method, ICS 85.060. Available online: https://www.iso.org/obp/ui/#iso:std:iso:535:ed-3:v1:en (accessed on 24 March 2021).
  60. SR EN ISO 638:2010, Paper, Board and Pulps, Determination of Dry Matter Content, Oven-Drying Method (ISO 638:2008), ICS 85.040, 85.060. Available online: https://global.ihs.com/doc_detail.cfm?document_name=ISO%20638&item_s_key=00041539 (accessed on 24 March 2021).
  61. Todorova, D.A.; Lasheva, V.G. Investigation of the influence of chitosan on the properties of bleached cellulose papers. In Proceedings of the 5th International Conference on Chemical Engineering, Iași, Romania, 28–30 October 2020. [Google Scholar]
  62. HG 188/2002-ANEXA 3, Guvernul României, Normativ privind stabilirea limitelor de încărcare cu poluanţi a apelor uzate industrial şi orăşeneşti la evacuarea în receptorii naturali, NTPA-001/2002. Available online: http://legislatie.just.ro/Public/DetaliiDocumentAfis/98311 (accessed on 14 March 2021).
  63. HG 188/2002–ANEXA 2, Guvernul României, Normativ privind conditiile de evacuare a apelor uzate in retelele de canalizare ale localitatilor si direct in statiile de epurare, NTPA-002/2002. Available online: http://legislatie.just.ro/Public/DetaliiDocumentAfis/98310 (accessed on 14 March 2021).
  64. Bilal, A.; Mehmet, H.A. Equilibrium Studies on Adsorption of Cu(II) from Aqueous Solution onto Cellulose. J. Colloid Interface Sci. 2001, 243, 81–84. [Google Scholar] [CrossRef]
  65. Annadurai, G.; Juang, R.S.; Lee, D.J. Use of cellulose-based wastes for adsorption of dyes from aqueous solutions. J. Hazard. Mater. 2002, 92, 263–274. [Google Scholar] [CrossRef]
  66. Engin, M.; Uyanik, A.; Çay, S.; Icbudak, H. Effect of the Adsorptive Character of Filter Papers on the Concentrations Determined in Studies Involving Heavy Metal Ions. Adsorpt. Sci. Technol. 2010, 28, 837–846. [Google Scholar] [CrossRef]
Figure 1. Sampling point location, Romanian Black Sea coast, Casino Constanta area. Coordinates: 44°17′03.49″ N 28°66′27.40″ E [43].
Sustainability 13 10763 g001
Figure 2. Stages of processing the stranded algal material.
Sustainability 13 10763 g002
Figure 3. (a) Sheets of cellulose from softwoods (long fiber), bleached softwood kraft pulp (BSK); and (b) from hardwoods (short fiber), bleached hardwood kraft pulp (BHK).
Sustainability 13 10763 g003
Figure 4. (a) BSK, long fibers with 19° SR beating degree; (b) BHK, short fibers with 17° SR beating degree.
Sustainability 13 10763 g004
Figure 5. (a) Laboratory sheet of filter paper with the addition of 8% algae of the species Ulva rigida, 20 cm Ø; (b) 8% filter paper surface, zoomed image. (c) Embedding of seaweed in the paper structure and sequestration of seaweed particles by cellulose fibers. Images obtained by using the ZEISS Axiostar Plus Binocular Microscope, 50× magnitude.
Sustainability 13 10763 g005
Figure 6. SEM images of Ulva rigida algae (a), filter paper (P0) (b), filter paper + 0.5% algae (P1) (c), filter paper + 1% algae (P2) (d), filter paper + 2% algae (P3) (e), filter paper + 4% algae (P4) (f) and filter paper + 8% algae (P5) (g).
Sustainability 13 10763 g006
Figure 7. Typical EDX spectra of a filter paper with algae addition. Peaks (*) correspond to the characteristic energies of Au from coating process.
Sustainability 13 10763 g007
Figure 8. Mapping of chemical elements in the filter paper sample with included algae.
Sustainability 13 10763 g008
Table 1. Centralized data of analysis results (average of 10 determinations for each parameter).
Sample CodingAdditionGrammageThicknessApparent Specific VolumePorositySmoothnessAsh ContentBreaking LoadBreaking LengthTearingBursting ResistanceFolding EnduranceWater Absorptiveness Cobb 60 IndexMoisture
% Algaeg/m2µg/cm3ss%NmmNkPaNo.g/m2%
Front SideBack SideDryWetDryWet
P0080.621440.561.91.960.440.63.62342230556014313165.384.95
P10.580.331420.572.52.360.4241.013.78347032056014314170.385.04
P2180.811450.562.62.560.4441.344.025347633858014715176.635.14
P3280.631430.562.62.560.4943.964.16370535162014115177.315.23
P4480.661440.562.82.860.6744.273.82372932260014115185.065.45
P5880.471420.573.23.160.9339.732.35335519854012711179.125.27
Table 2. SEM–EDX quantitative results for the chemical composition of synthesized materials based on filter paper and marine algae.
ElementConcentration (wt.%)
AlgaeP0P1P2P3P4P5
C48.8660.4255.8156.3457.0356.8054.62
N5.76 2.503.052.412.633.01
O37.6839.5832.4332.9835.0434.6533.40
Na0.32 0.130.180.170.290.13
Mg1.34 0.630.630.380.500.60
Al0.08 0.000.120.120.140.08
Si0.52 0.100.210.070.080.15
P0.04 0.310.250.130.240.32
S2.67 2.582.432.181.892.50
Cl0.03 0.060.150.000.000.10
K0.17 0.000.000.000.000.19
Ca1.84 3.232.652.071.672.71
Ti0.10 0.120.000.000.000.12
Cr0.06 0.140.000.000.000.11
Mn0.09 0.230.000.000.000.27
Fe0.26 0.400.130.130.160.44
Cu0.18 0.790.360.000.520.47
Zn0.00 0.560.540.270.420.79
Table 3. Initial and post-filtration heavy metals concentrations, using filter paper with different stranded seaweed additions, compared to national technical regulations NTPA-001 [62] and NTPA-002 [63], mg/dm3.
MetalInitial WastewaterNTPA 001NTPA 002P0P1P2P3P4P5
Cr total0.371.01.50.150.090.080.090.070.07
Cu1.80.10.20.20.20.210.180.150.11
Fe total6.145.0-0.070.040.050.030.030.03
Zn1.920.51.00.220.170.100.110.080.09
TDS468--436434422422419420
TSS2495-350523000
Publisher’s Note: MDPI stays neutral with regard to jurisdictional claims in published maps and institutional affiliations.

