Article

Energy Costs of Reducing Industrial Sulfur Dioxide Emissions in China

1
Center for Quantitative Economics of Jilin University, Faculty of Social Sciences, Jilin University, Changchun 130012, China
2
School of Business, Faculty of Social Sciences, Jilin University, Changchun 130012, China
*
Author to whom correspondence should be addressed.
Sustainability 2021, 13(19), 10726; https://doi.org/10.3390/su131910726
Submission received: 23 July 2021 / Revised: 15 September 2021 / Accepted: 21 September 2021 / Published: 27 September 2021

Abstract

:
With increasing environmental pollution, China has instituted corresponding environmental regulations to address environmental challenges. Estimating the costs of such environmental regulations can help governments to formulate rational environmental policies. This review estimates the costs of environmental regulations based on a novel perspective of energy consumption. Using panel data for Chinese provincial regions in 2006–2015, we developed a non-parametric directional distance function and estimated different optimal energy inputs based on data envelopment analysis under two scenarios, namely, those with and without emission reduction constraints. The gap between the two groups of optimal energy inputs facilitated the estimation of the energy costs associated with reducing SO2 (sulfur dioxide) emissions in China’s industrial sectors. The results suggest that approximately 13.40 tons of standard coal were required to reduce SO2 emissions by 1 ton, highlighting the discrepancy between energy savings and emission reduction. The energy costs of SO2 emission reduction were the highest in West China (18.63), followed by those in Central and Northeast China; meanwhile, those in East China were the lowest (9.91). The large differences between the energy costs of emission reduction in different regions indicated that economically underdeveloped areas have scope for improvement with respect to energy structures and innovation in the green technology field.

1. Introduction

Over the past 40 years of reform and development of the Chinese economy, the country has made remarkable advancements; however, the rapid development of the economy has been at the expense of ecosystem health and sustainability due to high energy consumption and high pollution. China accounts for 26.1% of the global primary energy consumption and 57.4% of the energy consumption in the Asia Pacific region. The energy consumption in 2020 was 2.1% higher than that in 2019, with a growth rate of 3.8% per annum from 2009 to 2019 [1]. The primary energy source is fossil fuels; their consumption leads to the release of pollutants, such as waste gases and dust. The contradiction between high-speed economic growth and environmental pollution is increasingly discernible. The economic losses associated with environmental pollution are estimated to be CNY 511.8 billion (approximately USD 79.94 billion), accounting for 3.05% of the annual GDP [2], which highlights the significant costs of environmental pollution. To address the emerging environmental problems and achieve sustainable development, the Chinese government stipulates via the “14th Five-Year Plan” that the energy consumption per CNY 10,000 of GDP will be reduced by 13.5% in 2025 compared with that in 2020, and that the total emissions of major pollutants will continue to decline [3].
To achieve the above goals, the Chinese Government has proposed several related environmental regulation policies, which increases the cost of controlling pollutant emissions by enterprises. The costs incurred in the process of controlling pollution are known as environmental regulation costs, which are an important issue that the government must consider in ensuring that the environmental regulation policies formulated are reasonable and feasible. Environmental regulation costs associated with enterprises can be evaluated from different perspectives. Studies have assessed such costs from an economic perspective using the Pigou tax approach [4,5,6], with the premise that the government levies taxes on enterprises that produce pollutants in the market. The amount of tax should be equivalent to the gap between the cost to the enterprise and the social cost. Conversely, the government subsidizes enterprises that do not pollute; consequently, their costs are reduced to be equivalent to the social cost. Other studies have measured the cost of such environmental regulations to enterprises based on an output perspective, that is, the relative output reductions caused by environmental regulations [7,8,9,10]. The perspective of opportunity costs (output losses) can be divided into two categories. Some studies have adopted the weak disposability of an unfavorable output approach, which considers the variability in output (under strong and weak output disposability) as the cost of environmental regulation [11,12,13,14]. In addition, some scholars refer to the reduction in output under emission reduction constraints as the shadow price of pollutants [15,16,17,18,19,20,21], which can be interpreted as the desirable (favorable) output given up by reducing an additional unit of undesirable (unfavorable) output.
This study proposes a novel concept based on an energy cost perspective that is different from the economic cost or opportunity cost perspectives adopted in current literature. In the presented energy cost concept, the costs of environmental regulations are evaluated by estimating the energy consumption associated with reducing pollutant emissions. For example, SO2 (sulfur dioxide) production is mainly reduced by using desulfurization processes. The installed capacity of desulfurization units in thermal power plants increased from 82.6% in 2010 to 96% in 2015. (The data are from http://news.bjx.com.cn/html/20160113/700672.shtml, accessed on 12 September 2021. This is a Chinese web page. Readers can access the website address through Google Chrome and translate the content into English by right clicking and selecting the “translate to English” option.) The SO2 removal rates are increasing annually, which implies increased energy consumption associated with the desulfurization process. Consequently, the simultaneous achievement of “energy saving” and “emission reduction” goals, especially in low-energy-efficiency regions (the energy efficiency in this paper is based on the concept of input–output efficiency, which can be defined as the ratio of GDP to energy input (the reciprocal of the energy intensity defined as the energy consumption per unit of GDP)), is a challenge. During the “Eleventh Five-Year Plan” period, China’s energy consumption decreased by 19.1%, and the goal of achieving a 20% reduction in energy consumption was not achieved. The above insights highlight the challenge of simultaneously achieving energy conservation and emission reduction.
Therefore, in this study, we estimated the costs of environmental regulations based on an energy consumption perspective and investigated whether SO2 emission reduction incurs high energy costs. From 2006 to 2015, industrial SO2 emissions accounted for 87.1% of China’s total SO2 emissions on average; therefore, we focused on industrial SO2 here. Determining the energy cost of reducing SO2 emission could enhance our understanding of the interaction between “energy savings” and “emission reduction” and facilitate the formulation of rational and sustainable energy conservation and emission reduction targets. Furthermore, the findings of such studies could prompt jurisdictions with high emission reduction costs to improve their energy structures and promote green technology innovations.
The key contributions of the proposed study are as follows: first, it proposes a novel perspective for estimating the costs of environmental regulations. We developed directional distance functions based on an environmental production model to estimate optimal energy inputs with and without environmental constraints, which allowed us to explore the costs of SO2 emission reductions from an energy consumption perspective. Second, we compared the energy costs of SO2 removal across 30 provinces in and across four major economic zones to investigate the degree of discrepancy between energy savings and emission reductions among different economic zones and analyzed the reasons for the differences. Finally, we present specific recommendations for improving energy efficiency in underdeveloped areas.

2. Materials and Methods

2.1. Theoretical Analysis Framework

Figure 1 shows the trend of China’s SO2 emission and energy consumption from 2006 to 2015. In Figure 1, the x-axis represents the year and the y-axis represents the industrial SO2 emission and energy consumption. Theoretically, a reduction in industrial SO2 emission requires energy consumption, which leads to a conflict between energy conservation and emission reduction. However, according to the data in Figure 1 (the data are from the 2007–2016 China Energy Statistical Yearbook and Wind database. Wind Information Technology Co., Ltd. (shortened as Wind) is a financial data and analysis tool service provider (https://www.wind.com.cn/en/default.html, accessed on 12 September 2021) [22]. Users can obtain financial data through the terminal tools it developed. The total energy consumption is obtained by adding the energy consumption in each region, with data from Tables 4–14 (total energy consumption by regions) in the China Energy Statistical Yearbook. The industrial sulfur dioxide emissions data come from the Wind database.), energy consumption has increased annually, despite either increases or decreases in national industrial SO2 emissions in 2006–2015. The reason for the opposite trend is that, regardless of the existence of emission reduction constraints, economic growth would undoubtedly be accompanied by increased energy consumption. When emission reduction constraints exist, energy consumption rises further, making it virtually impossible to estimate the energy consumed in SO2 emission reduction efforts directly from statistics. Consequently, we must formulate approaches that eliminate the energy inputs of production activities and simply measure the energy consumed in emission reduction activities.
Based on this, we estimate the optimal energy input with and without environmental constraints using a directional distance function approach. When the emission reduction constraints are applied, the energy input is used not only to achieve the given output but also to reduce SO2 emissions; therefore, the optimal energy input would be higher than the optimal energy input without emission reduction constraints. By comparing the difference between the two optimal energy inputs, we can obtain the energy consumption requirements for emission reduction. Consequently, measuring the two types of optimal energy inputs and then estimating the energy costs of industrial SO2 emission reduction were the focus of this study. Consequently, we introduce several concepts, including environmental production technology, the directional distance function, and the energy costs of SO2 emission reduction.

2.2. Environmental Production Technology

Traditional production technology considers only inputs and outputs. In fact, while industrial production produces desirable outputs, it has some by-products, such as wastewater and waste gas. A technology that incorporates undesirable outputs into the production framework is called an environmental production technology [23]. Non-energy inputs are denoted by x = x 1 , , x N + N , energy inputs are denoted by e = e 1 , , e Q + Q , desirable outputs are denoted by y = y 1 , , y M + M , and undesirable outputs are denoted by b = b 1 , , b J + J . Therefore, environmental production technology can be expressed as follows:
P = x , e , y , b : x , e   can   produce   y , b .
Incorporating unfavorable outputs into production technology implies the use of an environmental theorem to constrain the traditional production set. Considering the definition of environmental production technology [24,25] coupled with the requirements of the analytical framework of this paper, along with the characteristics of the compact set and convex set possessed by the traditional production set, the environmental production potential set must satisfy the three environmental theorems:
I .   I f   x , e , y , b P   and   x > x , e > e , y < y ,   t h e n   x , e , y , b P II .   I f   x , e , y , b P   and   0 < θ < 1 ,   t h e n   x , e , θ y , θ b P III .   I f   x , e , y , b P   and   b = 0 ,   t h e n   y = 0
Theorem I assumes the energy and non-energy inputs and desirable outputs as strongly disposable. It also indicates that, given the desirable outputs, there can be differences between the energy inputs of decision-making units (DMUs), which lead to relative differences in efficiency among them.
Theorem II shows that the favorable outputs and unfavorable outputs are jointly weakly disposable; that is, favorable outputs and unfavorable outputs are reduced by similar proportions [23], which indicates a tradeoff between reducing pollution and achieving favorable outputs.
Theorem III assumes null-jointness [25]; that is, when there is no undesirable output, the desirable output will then also be zero. This indicates that zero emissions can be achieved only when production is halted.
A production set P that satisfies the above three environmental theorems can be expressed as:
P = k = 1 K z k y k , m y k , m m = 1 , , M k = 1 K z k e k , q e k , q q = 1 , , Q k = 1 K z k x k , n x k , n n = 1 , , N k = 1 K z k b k , j = b k , j j = 1 , , J k = 1 K z k 0 k = 1 , , K

2.3. Directional Distance Function

The directional distance function can compress and expand by similar proportions in both inputs and outputs [26]. It measures the relative distance of the DMU from the production frontier. The directional distance function is essentially another form of the environmental production set; therefore, it inherits the characteristics of the production set P and satisfies the environmental theorem. This paper focuses on energy input; therefore, we assume that other inputs are unchanged and compress the energy input only. Such a directional distance function can be expressed as follows:
D 0 x , e , y , e = M a x β :   e 1 β P
Equation (3) compresses the energy input only and does not consider the undesirable outputs. If the reduction in the emissions of the pollutants is considered, the directional distance function can be expressed as follows:
D 0 x , e , y , e , b = M a x β :   e 1 β , b 1 β P
In Equation (4), the energy input and pollutants are compressed by a similar proportion β. The difference between Equations (4) and (3) is that (4) also compresses the undesirable outputs, reflecting the restrictions on pollutant emissions, which, in this study, represent the reduction in industrial SO2.
A data envelopment analysis model that is only compressed in the direction of energy input can be expressed as follows:
D 0 x , e , y , e   = M a x β 1 s . t k = 1 K z k y k , m   y k , m     m = 1 , , M k = 1 K z k e k , q 1 β 1   e k , q     q = 1 , , Q k = 1 K z k x k , n   x k , n     n = 1 , , N k = 1 K z k   0     k = 1 , , K
In the case of emission reduction constraints, the energy input and unfavorable outputs are simultaneously compressed by a similar proportion β, and the specific formula for estimating the distance function is as follows:
D 0 x , e , y , e , b = M a x β 2 s . t k = 1 K z k y k , m   y k , m     m = 1 , , M k = 1 K z k e k , q 1 β 1   e k , q     q = 1 , , Q k = 1 K z k x k , n   x k , n     n = 1 , , N k = 1 K z k b k , j = 1 β 2   b k , j     j = 1 , , J k = 1 K z k   0     k = 1 , , K
The directional distance function represents the relative distance of the DMU from the frontier. When the distance is zero, β = 0. The larger the β, the farther the decision-making unit is from the frontier and the farther the actual energy input is from the optimal energy input. The value of (1 − β) also represents the ratio of the optimal energy input to actual energy input, that is, the energy (input) efficiency.

2.4. Energy Costs for Reducing Sulfur Dioxide Emissions

According to the linear programming models in Equations (5) and (6), β1 and β2 represent the maximum compressible proportions of energy input. With the values of β1 and β2, we can calculate the optimal energy inputs under two scenarios separately and therefore determine the energy costs of reducing SO2 emissions. The optimal energy input without emission reduction constraints, Eo, is expressed as follows:
E o = 1 D 0 x , e , y , e × E a = 1 β 1 × E a
The optimal energy input with emission reduction constraints, CEo, is expressed as follows:
C E o = 1 D 0 x , e , y , b , e , b × E a = 1 β 2 × E a
The Ea in Equations (7) and (8) is the observed actual energy input of a DMU. Due to the constraints of emission reduction, extra energy is consumed to remove SO2. Consequently, when reaching the established output, the optimal energy input would be higher than that without emission reduction constraints, and the ratio to the actual energy input is higher ( β 1 > β 2 ). For example, to achieve the established output, the actual energy consumption of a DMU is 10 million tons of standard coal; β 1 is 0.4, and β 2 is 0.2. The result shows that, when there is no emission reduction constraint, the minimum energy consumption for a given output is 6 million tons of standard coal; when there are emission reduction constraints, the minimum energy consumption is 8 million tons, 2 million tons of which is energy input used for emission reduction. Therefore, the difference between CEo and Eo (CEoEo) is the total energy consumption (energy costs) for SO2 emission reduction.
Next, we define the energy cost per unit of SO2 emission reduction (ECSR) as follows:
E C S R = C E o E o E m i s s i o n s   r e d u c t i o n   o f   S O 2
In Equation (9), the numerator represents the total energy consumption for SO2 emission reduction. The denominator is the quantity of SO2 emission reduction, and ECSR is the energy consumed per unit of the SO2 emission reduction.

2.5. Variable Selection

Our data consist of annual observations from the industrial sector in 30 provincial regions of China from 2006 to 2015. The 30 regions comprise 22 provinces, four autonomous territories (excluding Tibet), and four municipalities in mainland China. The input variables consist of labor, capital, and energy inputs. The value of the labor force is the average industrial employment at the beginning of the year and the end of the previous year. The number of industrial employees has been rising with economic development, with an annual average growth rate of 3.05% from 2006 to 2015. The capital index adopts the net value of industrial fixed assets. With 2000 as the base period, we use the price index for investment in fixed assets to perform deflation treatment on the net value of fixed assets. The net value of industrial fixed assets has maintained an upward trend and a high growth rate. The annual average growth rate of the net value of fixed assets was 15.61%. We converted coal, oil, and natural gas into standard coal according to their corresponding standard coal conversion factors. We considered the sums of the three standard coal values as energy input variables. Shanxi’s oil consumption data were missing. We replaced the oil consumption data for Shanxi province with the data for the consumption of petroleum products, such as diesel, gasoline, and kerosene. Energy consumption was on the rise, although the growth rate was slowing down. The average annual growth rate in 2006–2010 was 7.78%; it was 1.58% in 2011–2015. The labor force, net value of industrial fixed assets, and price index for investment in fixed assets data were obtained from the 2007–2016 China Industrial Statistics Yearbook. The coal, oil, natural gas, and other energy input data were obtained from the 2007–2016 China Energy Statistics Yearbook.
The output variables include desirable and undesirable outputs. We selected industrial GDP as the desirable output and industrial SO2 emissions as the undesirable output. The industrial GDP also had 2000 as the base period, while using the Producer Price Indices for Industrial Products for deflation and eliminating the impact of price changes. The industrial GDP reached CNY 22.88 trillion in 2015. Compared to 2006, the total growth rate reached 153.32%, with an average annual growth rate of 10.94%. Although industrial GDP has been growing, the growth rate had slowed down from 13.69% in 2006–2010 to only 7.49% in 2011–2015.
In addition, industrial SO2 emissions decreased annually. The average annual decline was 3.8%, with the most significant decline being observed in 2015 (a 10.5% reduction compared to that in 2014). From 2006 to 2015, the industrial SO2 emission reductions increased annually, with an average annual increase of 15.12%. Since the industrial SO2 emission reduction data were used in the ECSR calculation, we have also listed the indicator in the descriptive statistics of variables (Table 1). The industrial SO2 emission reduction was calculated by subtracting the volume of industrial SO2 emissions from the volume of industrial SO2 production. The China National Bureau of Statistics no longer releases the data on the amount of SO2 produced by each provincial region from 2016, which makes it impossible for us to calculate the ECSR after 2015. Therefore, our sample years could only be up to 2015. There is no official explanation for why the data are no longer released. A possible reason may be that almost all the SO2 control indicator requirements in China are for SO2 emissions; therefore, it is no longer necessary to record the produced amount of SO2. The industrial GDP data were collected from the 2007–2016 China Industrial Statistics Yearbook. With 2000 as the base period, we used the producer price index (PPI) deflation treatment on the net value of industrial GDP. The produced amount of SO2 and SO2 emission data were obtained from the Wind Database. Descriptive statistics of the input–output variables are listed in Table 1.

3. Results and Discussion

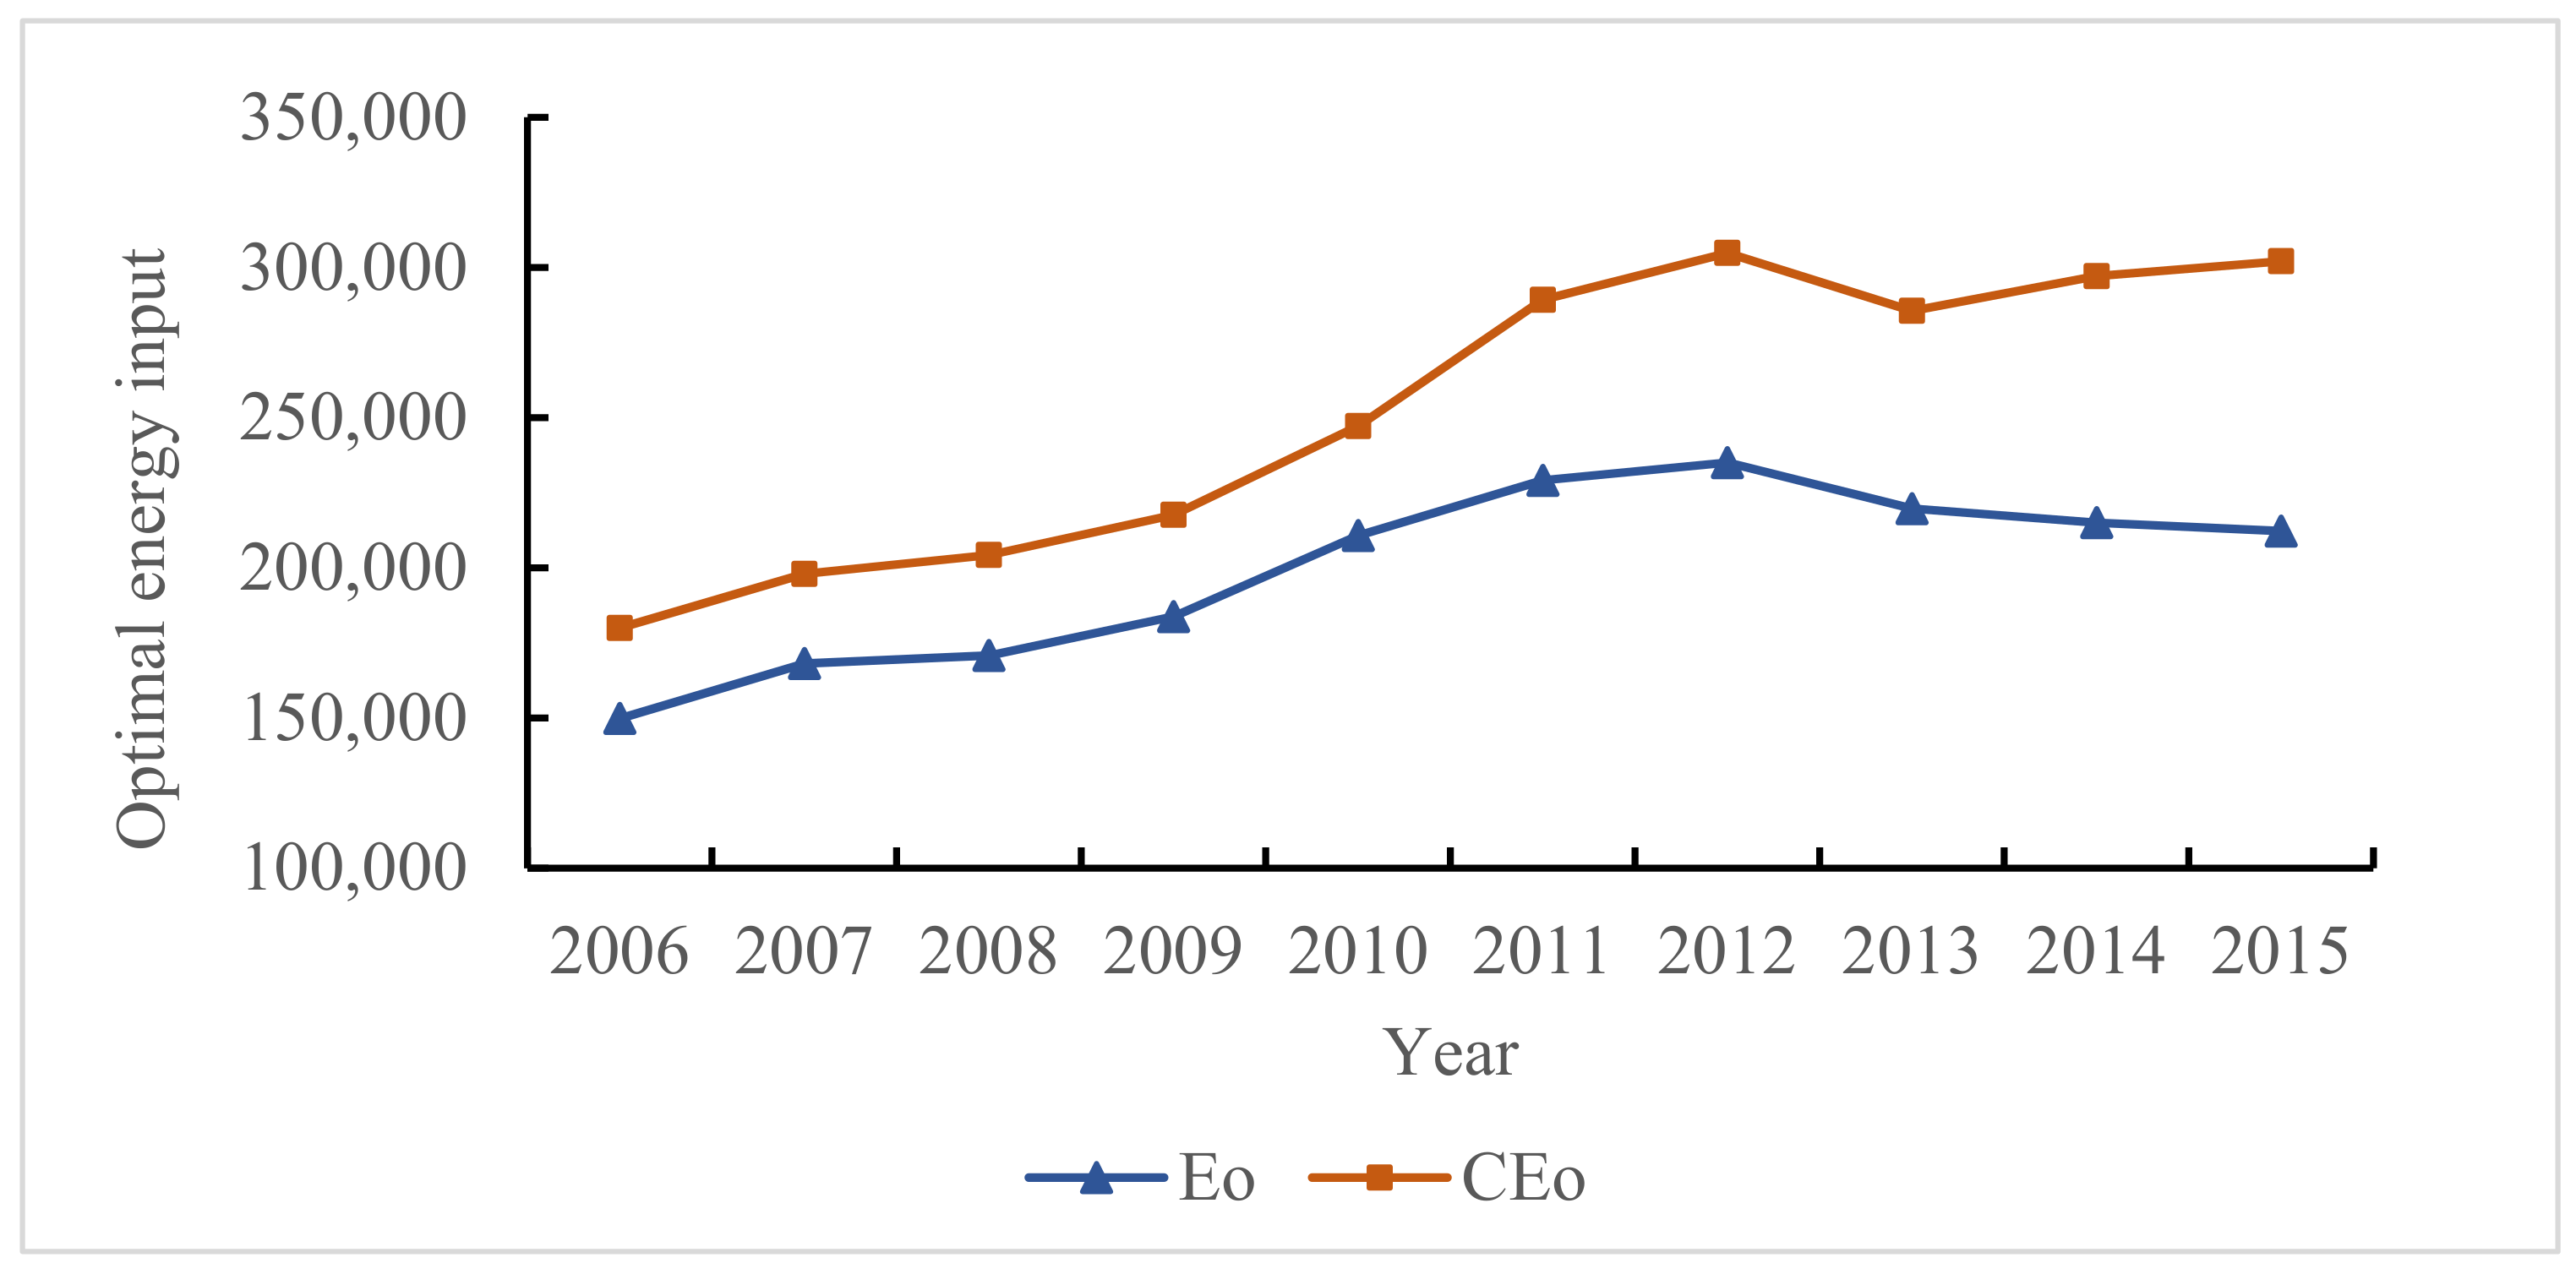
Based on Equations (7) and (8), we calculated the two sets of optimal energy inputs, Eo and CEo, in China’s 30 provincial regions from 2006 to 2015. The Eo and CEo trends are illustrated in Figure 2. The x-axis represents the year, and the y-axis represents the optimal energy input, where Eo represents the optimal energy input without emission reduction constraints and CEo represents the optimal energy input with emission reduction constraints. According to Figure 2, CEo was significantly higher than Eo in 2006–2015, revealing that high energy amounts are consumed in the SO2 removal process. In addition, according to Figure 2, the gap between CEo and Eo was increasing gradually, which is consistent with the actual status in China. In 2005, China began to give more importance to environmental issues and put forward clear emission reduction requirements in the “11th and 12th Five-Year Plans”. With an increase in emission reduction, highly polluting enterprises have gradually appreciated the importance of green production and started to adopt or develop tail gas treatment technologies, resulting in the gradual increase in energy consumption for emission reduction activities.
The energy costs for industrial SO2 emission reduction are listed in Table 2. The annual average emission reduction for SO2 in 2006–2015 was 39.82 million tons, and the average yearly energy consumption for SO2 emission reduction was 532.43 million tons of standard coal. Overall, the energy consumption for emission reduction increased markedly from 301.29 million tons in 2006 to 903.1330 million tons in 2015, with an average annual growth rate of 14.59%. Similarly, the amount of SO2 emission reduction also increased from 16.53 million tons in 2006 to 56.23 million tons in 2015. Based on the ECSR, 13.40 tons of standard coal would be consumed to reduce SO2 emissions by 1 ton. Similarly, the removal of 1 ton of SO2 “crowds out” the energy-saving space of 13.40 tons of standard coal. In addition to the absolute amount of energy consumed to reduce emissions increasing annually (excluding 2007), the proportion of energy consumed to reduce emissions from the total energy input exhibited an upward trend. In 2011–2015, on average, 16.89% of the energy input was used to reduce emissions; this value was significantly higher than that observed in 2006–2010 (9.67%).
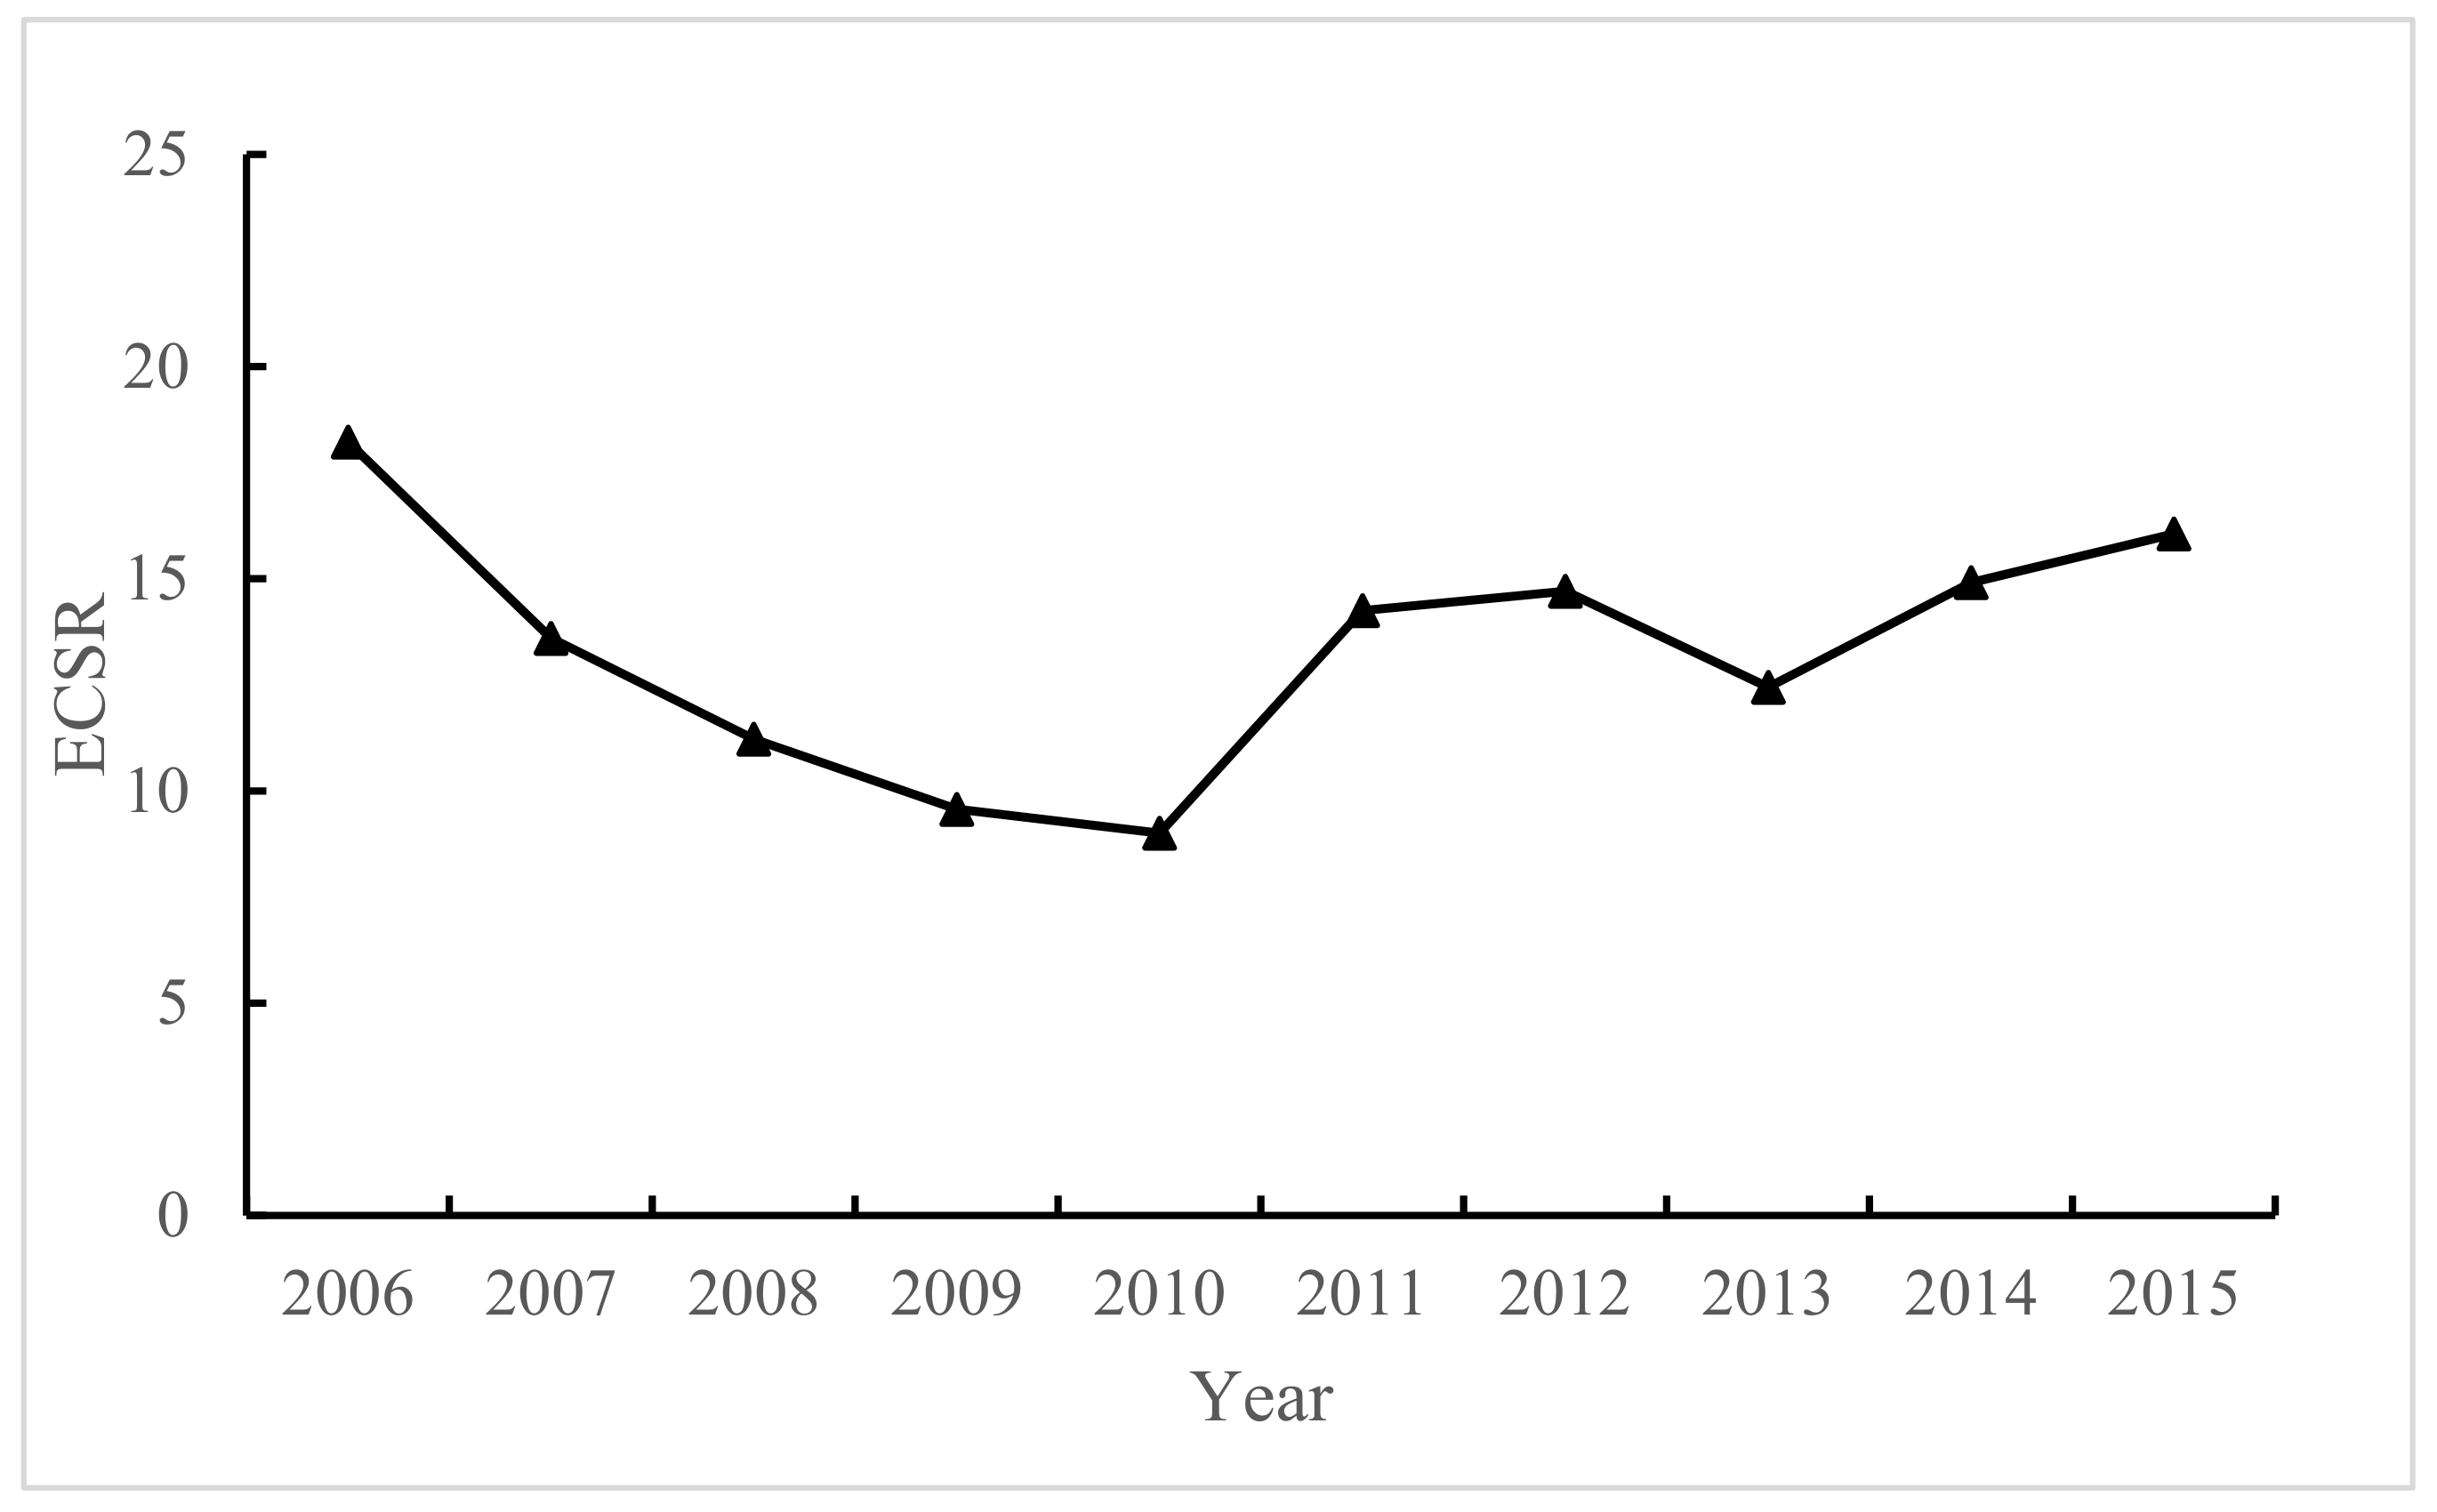
In Figure 3, the x-axis represents the year and the y-axis represents the energy cost per unit of SO2 emission reduction (ECSR). Figure 3 shows the trend of ECSR from 2006 to 2015, which can be divided into two stages. The first stage represents the 2006–2010 period. The average energy consumed to reduce SO2 emissions in the five years was 326.77 million tons, accounting for 9.65% of the total energy input. ECSR exhibited a noticeable decline from 2006 to 2010, with an average of 12.33, indicating that, in the five years, 12.33 tons of standard coal was required to reduce SO2 emissions by a ton on average. ECSR had a downward trend in 2006–2010, which is mainly attributed to the strict environmental regulations in the period. The environmental protection indicators defined under the 10th Five-Year Plan (2000–2005) were not achieved adequately. The total emissions of SO2 and industrial SO2 did not decline but rebounded. According to statistics from the Ministry of Ecology and Environment of the People’s Republic of China, in 2005, the national SO2 emissions increased by 27% compared to the emissions in 2000 (Data were obtained from http://www.mee.gov.cn/home/ztbd/gzhy/hbdh/hjbhdh/xgbd/200604/t20060419_75928.shtml, accessed on 12 September 2021) [27]. Therefore, during the “11th Five-Year Plan” period (2006–2010), the central government proposed a 10% reduction of the total amount of pollutants discharged as a binding indicator. To achieve this goal, on the premise that desulfurization facilities would be installed in new coal-fired power plants during the 11th Five-Year Plan period, 4.9 million tons of SO2 in active thermal power units would be reduced through engineering measures so that the installed desulfurization capacity of existing thermal power units would reach 213 million kW. The desulfurization capacity of steel sintering machine flue gas desulfurization projects would be 300,000 tons (Circular of the State Council on printing and distributing the 11th Five Year Plan for national environmental protection. http://www.mee.gov.cn/zcwj/gwywj/201811/t20181129_676435.shtml, accessed on 12 September 2021) [28]. The accountability system and the “one-vote veto system” were also implemented, (In 2007, the State Council approved and transmitted the implementation plan and method for the statistical monitoring and assessment of energy conservation and emission reduction formulated by the national development and Reform Commission, the National Bureau of Statistics and the General Administration of Environmental Protection. The plan and method include two parts: the energy consumption per unit of GDP and total emission reduction for major pollutants. In the plan and method, if energy conservation and emission reduction fail to pass the assessment, the leaders of local governments and important enterprises will face accountability and “one vote veto”) reinforcing the environmental regulations.
To achieve the emission reduction standards, industrial enterprises need to develop and improve desulfurization technologies. Desulfurization technologies are generally divided into fuel desulfurization, combustion desulfurization, and flue gas desulfurization technologies, corresponding to prior desulfurization, mid-desulfurization, and post-desulfurization treatments, respectively. In the beginning, most industrial enterprises adopted flue gas desulfurization, which implies the desulfurization of the flue gas produced after coal combustion. The flue gas desulfurization technology is divided into a dry method and a wet method. The dry method mainly involves placing limestone and dolomite in high-temperature furnaces, which react with SO2 to produce solid sulfur. Conversely, the wet method consists of washing the flue gas with an alkaline slurry, thereby removing the SO2 from the flue gas [29]. The two methods have some limitations. The dry method has low absorption efficiency, and the long-term use of the wet method leads to equipment corrosion and deformation [29]. To address the challenges, various equipment manufacturers have developed second- and third-generation limestone desulfurization technologies. In addition, many manufacturers have developed absorption and regeneration techniques that process the liquid that has absorbed SO2 into sulfuric acid and other products and removed SO2 for recycling [30]. Combustion desulfurization is similar to flue gas desulfurization, and it is gradually being improved with the reinforcement of environmental regulations. Fuel desulfurization is used to transform coal with a higher sulfur elimination of 50 million kW of small thermal content into clean energy using sulfur-fixation methods before combustion. Sulfur-fixation methods are divided into physical, chemical, and biological methods. The physical method has been applied extensively in China; however, the physical method has major limitations and cannot remove organic sulfur from coal. Conversely, the chemical method requires complex equipment and consumes high energy amounts; therefore, its use is currently impractical. In contrast, the biological method is associated with mild reaction conditions, simple equipment requirements, and low cost. Today, many equipment manufacturers in China are developing and researching equipment for the biological method [31]. Overall, desulfurization technology is continuously improving; according to statistics from the Ministry of Environmental Protection, technological progress facilitated up to 66% SO2 emission reductions during the “11th Five-Year Plan” [Data were obtained from “http://www.chinanews.com/ny/2011/06-22/3129223.shtml, accessed on 12 September 2021”] [32]. With the developments and advancements in methods and equipment for desulfurization tail gas treatment, the energy consumed in SO2 emission reduction activities has decreased along with the ECSR.
The second stage of the ECSR estimation represents the 2011–2015 period. As illustrated in Figure 2, the gap between Eo and CEo was slightly larger, which implies that more energy was invested toward reducing SO2. The average amount of energy consumed to reduce emissions in the five years was 738.09 million tons (Table 2), accounting for 16.93% of the total energy input and being 2.26-fold that of the previous five years. The average ECSR (14.48) was also higher than that of the first phase, showing that the average ECSR increased. Considering the technological advancements that have taken place over the study period, such findings are not promising.
A potential explanation for the ECSR rebound in the second phase is a slowdown in the shutdown plan for China’s small thermal power units. The power generation industry has always produced high SO2 emissions. In 2005, the power generation industry emitted 11.67 million tons of SO2, accounting for 58.935% of the total emissions of 39 industrial industries (19.805 million tons) [Data from “2006 China Statistical Yearbook”]. Therefore, the power generation industry bears most of the brunt of China’s SO2 emission reduction efforts. In addition to relying on the advancements in desulfurization technologies to reduce SO2 emissions, the government has taken steps to shut down small thermal power units. Small thermal power units are mainly found in small thermal power plants, whose owners are unwilling to install desulfurization equipment due to a lack of funds or limited production scales. Consequently, their SO2 emissions exceed the national standards.
For the sustainable development of China’s industry, the government required the power units during the 11th Five-Year Plan period (2005–2010). The goal was surpassed, as 76.83 million kW of small thermal power units were eventually taken off the grid during the 11th Five-Year Plan period (Data from “http://www.bjnews.com.cn/finance/2011/10/25/159896.html, accessed on 12 September 2021”) [33]. However, the rapid and arbitrary shutdown of small power plants has introduced numerous challenges, such as the employment of many laid-off employees and corporate debt problems [34]. Consequently, the shutdown of small thermal power units slowed down gradually during the 12th Five-Year Plan period.
The “12th Five-Year Plan for Energy Conservation and Emission Reduction” targeted the elimination of small thermal power units that produced a total of 20 million kW in 2010–2015 [Data from “http://www.chinanews.com/ny/2012/08-28/4138090.shtml, accessed on 12 September 2021”] [35]. The target represented only a quarter of the number of shutdowns during the “11th Five-Year Plan” period. Under such a policy environment, many small thermal power units were shut down during the 11th Five-Year Plan period, which reduced SO2 emissions without energy consumption. Therefore, although small thermal power units continued to shut down over the 12th Five-Year Plan period, the shutdown rate was reduced because many shutdowns had occurred during the 11th Five-Year Plan period. Therefore, the reduction in SO2 emissions due to the shutting down of small thermal power units decreased, while the proportion of SO2 emissions was reduced when the use of desulfurization equipment increased under augmented energy consumption, resulting in a rebound in ECSR.
To further explore the energy consumption of emission reduction efforts in various areas, we divided mainland China into Northeast, East, Central, and West zones [The Northeast includes Liaoning Province, Jilin Province and Heilongjiang Province; the East includes Beijing, Tianjin, Hebei Province, Shanghai, Jiangsu Province, Zhejiang Province, Fujian Province, Shandong Province, Guangdong Province and Hainan Province; the Central includes Shanxi Province, Anhui Province, Jiangxi Province, Henan Province, Hubei Province and Hunan Province; the West includes the Inner Mongolia Autonomous Region, the Guangxi Zhuang Autonomous Region, Chongqing, Sichuan Province, Guizhou Province, Yunnan Province, Shaanxi Province, Gansu Province, Qinghai Province, the Ningxia Hui Autonomous Region and the Xinjiang Uygur Autonomous Region]. According to the Eo, CEo, and energy inputs in the provincial regions, we first calculated the energy costs of SO2 emission reduction in each province-level region. We then used the average values as the energy costs of SO2 emission reductions in the separate zones.
Table 3 lists the ECSRs in four zones in China. The eastern region had the lowest ECSR, with an average value of 9.91. Meanwhile, the western region had the highest ECSR, with an average value of 18.63. The ECSRs in the northeast and central regions were relatively close at 10.41 and 10.70, respectively. The energy costs of reducing SO2 emissions were the lowest in the eastern regions because the economies of the eastern regions are relatively developed and can introduce and upgrade desulfurization units. Therefore, the eastern regions have a high desulfurization efficiency, implying that more SO2 can be removed per unit of energy consumed (Data were obtained from https://www.cec.org.cn/detail/index.html?3-138643; https://www.cec.org.cn/detail/index.html?3-151148, accessed on 12 September 2021) [36]. The reason that the western region exhibits the highest ECSR is that, due to the high terrain, long freezing periods, and severe drought in that region, desulfurization methods that do not require much water are adopted as much as possible and anti-freeze measures are required following wet desulfurization. Therefore, the western region is more suitable for applying the dry desulfurization method [37,38]. Although the dry desulfurization method does not require water, and the process is relatively simple, desulfurization itself is not efficient. When a high amount of desulfurization is required, more energy is consumed; therefore, the highest energy costs for emission reduction are observed in the western region. The northeast and central regions adopt combinations of dry and wet desulfurization methods, which is not considerably different from the desulfurization technology adopted in the east. Therefore, the energy costs of emission reduction in the northeast and central regions are only slightly higher than those in the east.
The energy costs of SO2 emission reductions reflect the inconsistency between energy conservation and emission reduction, and the differences in ECSR among different regions reflect the different degrees of inconsistency. The findings could guide government policy formulation activities for rational environmental policies in different regions.
Table 4 lists the Eo, CEo, and ECSR across the different provinces. Among them, ECSR = 0 in Tianjin and Guangzhou indicates that the energy costs of removing SO2 were very low [For ECSR = 0, here, we do not understand it as a mathematical zero. Since DEA calculates the relative efficiency based on the input–output of each decision-making unit, the zero here can be understood as the energy costs of pollution reduction in these two regions being lower than those for other regions]. The provinces with ECSR values <5 are Hebei, Jiangsu, Zhejiang, Anhui, Fujian, and Hubei; most of these are located in eastern China and are at the forefront of economic development in China. Conversely, Jilin, Guangxi, Hainan, Guizhou, and Shaanxi had high ECSRs (>20), which indicated that the local desulfurization technologies are relatively outdated and consume high amounts of energy when processing SO2. In addition to the difference in desulfurization technology, another reason for the large variations in ECSR could be that the energy structures of the areas are diverse. According to the Bureau of Statistics, China’s electricity consumption accounts for an average of 14.32% of the total energy consumption. Zhejiang’s electricity consumption accounts for the highest proportion (20.86%). China’s coal consumption accounts for an average of 65.74% of the total energy consumption, and Beijing’s coal consumption accounts for the lowest proportion (25.35%). There are only six provinces in China with coal consumption accounting for less than 50% of the total energy consumption in the province, namely, Beijing, Tianjin, Shanghai, Zhejiang, Guangdong, and Fujian (with an average of 40.40%). Provinces and cities with superior energy structures (a high proportion of electricity consumption and a low proportion of coal consumption) are largely concentrated in the eastern region. In the two provinces with the lowest ECSRs (Tianjin and Guangdong), electricity consumption accounted for 18.11% and 19.61% of the total energy consumption, respectively, while coal consumption accounted for 49.38% and 42.03% of the energy consumption, respectively. Conversely, in the three provinces with the highest ECSRs (Shaanxi, Guizhou, and Guangxi), the electricity consumption accounted for 8.42%, 11.19%, and 12.58% of the total energy consumption, respectively, while coal consumption accounted for 79.10%, 69.55%, and 64.34%, respectively [Coal and electricity consumption data for each region were obtained from https://data.stats.gov.cn/easyquery.htm?cn=E0103, accessed on 12 September 2021. We converted the electricity consumption into standard coal according to the conversion coefficient for electricity (0.1229 kg of standard coal/kWh)] [39]. Provinces and cities with superior energy structures exhibit lower ECSRs (and vice versa) because, under high coal consumption, SO2 emissions are relatively high. Therefore, to meet the environmental standards set by the government, the energy consumed in emission reduction efforts is higher, which leads to higher ECSRs.

4. Conclusions

Previous studies on the costs of SO2 emission reduction have mainly focused on economic cost or opportunity cost perspectives, for example, accounting for the shadow price of SO2 or relative output reductions caused by sulfur dioxide emission reduction constraints. In fact, environmental regulations often include the dual goals of energy conservation and emission reduction, and there is an internal inconsistency between the goals. However, there are a few studies in this field. Differently from previous studies, we developed directional distance functions to explore the energy costs of SO2 emission reduction. This is a new perspective for not only estimating the costs of environmental regulations, but also exploring the extent of inconsistency between emission reduction and energy saving, which has not been pointed out in previous studies.
An analytical framework is proposed herein for evaluating the energy costs of reducing SO2 emissions in China’s provincial regions from 2006 to 2015 by developing non-parametric directional distance functions, with and without emission reduction constraints. The input variables are employment, capital, and standard coal consumption. The desirable output is the industrial GDP, and the undesirable output is the industrial SO2 emissions. The empirical results are provided below.
The annual average emission reduction for SO2 was 39.82 million tons. The average yearly energy consumption for emission reduction was 532.43 million tons of standard coal (ECSR = 13.40), which implies that reducing SO2 emissions by 1 ton would consume 13.40 tons of standard coal. From 2006 to 2015, the energy consumption and emission reduction for SO2 increased, while the ECSR decreased from 2006 to 2010 and then exhibited an upward trend from 2011 to 2015.
In terms of economic zones, the energy cost per unit of SO2 removed was the highest in West China (an average of 18.63), while that in eastern China was the lowest (9.91). This shows that a more developed economy with a considerable number of technology-intensive industrial enterprises will show an augmented upgradation rate for technologies, a higher efficiency for SO2 treatment, and reduced energy costs for SO2 removal.
In each provincial region, there was a considerable gap in ECSR among different regions. In some areas, especially the economically developed eastern regions such as Jiangsu and Zhejiang, the energy costs of SO2 emission reduction were relatively low. In Tianjin and Guangdong, ECSR = 0, which indicated that using advanced desulfurization technologies or cleaner production technologies could reduce SO2 emissions or eliminate them from the source. Therefore, the energy consumption of SO2 removal could be reduced to very low amounts, indicating that energy conservation can be achieved simultaneously with emission reduction. However, numerous regions (especially economically underdeveloped provinces and cities in Northeast, Central, and Western China) with high ECSRs indicated that the energy consumed for emission reductions in the areas was high, and the discrepancy between energy conservation and emission reduction was more prominent. Overall, China’s cost for managing pollutants still has a lot of room for improvement.

5. Suggested Policy Implications

Based on our findings, we put forward the following recommendations:
  • Improving energy structure and reducing the proportion of coal consumed:
Fossil energy sources (coal and oil) produce SO2. However, due to the relatively low price of coal in China, many industries prefer using coal. Although the central and western regions are resource-rich, they lag with respect to development. The proportions of coal consumption in total energy consumption are higher than those in other parts of the country. Such factors lead to high SO2 emissions and high energy consumption. However, the eastern region shows contrasting trends. Shanghai, Beijing, and Guangdong mainly exploit electricity in their energy mix so that the energy consumed in emission reduction is also lower. Therefore, accelerating the transformation of energy structures in the northeast, central, and western regions is a fundamental strategy for reducing the energy consumed in emission reduction.
2.
Sharing green technologies to improve energy efficiency and reduce regional differences:
The economies of the eastern coastal areas are relatively developed, and both the production and emission reduction technologies are advanced compared to those of other regions. If such technologies were introduced in the northeast, central, and western regions, their energy efficiency would improve, and the advantages associated with such technologies would spread. In turn, the differences in the energy consumed in emission reduction among regions would be reduced.
3.
Green technological innovation and minimization of the inconsistency between energy conservation and emission reduction should be promoted:
Currently, the main SO2 emission reduction technology is flue gas desulfurization, an after-the-fact emission reduction technology (also called end-of-pipe technology) that does not completely remove SO2 and has high energy consumption levels. Besides the continuous upgrading of flue gas desulfurization technology equipment and processes to increase desulfurization efficiency and reduce energy consumption, fuel desulfurization technologies that can transform unclean fuels into clean fuels through desulfurization processes before using fossil fuels should be developed; this could reduce the generation of SO2 at the source. Alternatively, combustion desulfurization technologies, namely, clean production technologies, should be designed to reduce pollution emissions in production processes to minimize post-treatment energy costs. The promotion of green technological innovations, which could “desulfurize” fossil energy beforehand or during processes with low-energy consumption levels, would reduce energy consumption while achieving emission reductions.

Author Contributions

H.L.: conceptualization, methodology, supervision, funding acquisition, formal analysis, and writing—review and editing. Y.Z.: data collection, methodology, writing—original draft, and writing—review and editing. C.Z.: conceptualization, methodology, data analysis, writing—original draft, and writing—review and editing. All authors have read and agreed to the published version of the manuscript.

Funding

This research was funded by the Major Projects of National Social Science Foundation of China [grant no. 21ZDA006] and the National Social Science Foundation of China (grant no. 20BGY102).

Institutional Review Board Statement

Not applicable.

Informed Consent Statement

Not applicable.

Data Availability Statement

The datasets generated during and/or analyzed during the current study are available from the corresponding author on reasonable request.

Conflicts of Interest

The authors have no conflicts of interest to declare that are relevant to the content of this article.

Abbreviations

tce: tons of standard coal equivalent; DMUS, decision-making units; Eo, optimal energy input without emission reduction constraints; CEo, optimal energy input with emission reduction constraints; Ea, actual energy input; ECSR, energy cost per unit of SO2 emission reduction; SO2, sulfur dioxide.

References

  1. Statistical Review of World Energy. 70th Edition. 2021. Available online: https://www.bp.com/content/dam/bp/business-sites/en/global/corporate/pdfs/energy-economics/statistical-review/bp-stats-review-2021-full-report.pdf (accessed on 20 July 2021).
  2. 2004 China Green National Economic Accounting Research Report. Available online: https://max.book118.com/html/2017/0719/122921239.shtm (accessed on 20 July 2021).
  3. The 14th Five Year Plan for National Economic and Social Development of the People’s Republic of China and the Outline of the Long Term Goals for 2035. Available online: http://www.gov.cn/xinwen/2021-03/13/content_5592681.htm (accessed on 12 September 2021).
  4. Coase, R.H. The problem of social cost. J. Law Econ. 1960, 3, 1–44. [Google Scholar] [CrossRef]
  5. Demsetz, H. The problem of social cost: What problem? A critique of the reasoning of A.C. Pigou and R.H. Coase. J. Law Econ. 2001, 7, 1–13. [Google Scholar]
  6. Pigou, C.A. The Economics of Welfare; McMillan & Co.: London, UK, 1920. [Google Scholar]
  7. Murty, M.N.; Kumar, S.; Paul, M. Environmental regulation, productive efficiency and cost of pollution abatement: A case study of the sugar industry in India. J. Environ. Manag. 2006, 79, 1–9. [Google Scholar] [CrossRef] [PubMed]
  8. Kaneko, S.; Fujii, H.; Sawazu, N.; Fujikura, R. Financial allocation strategy for the regional pollution abatement cost of reducing sulfur dioxide emissions in the thermal power sector in China. Energy Policy 2010, 38, 2131–2141. [Google Scholar] [CrossRef]
  9. Tang, K.; Yang, L.; Zhang, J.W. Estimating the regional total factor efficiency and pollutants’ marginal abatement costs in China: A parametric approach. Appl. Energy 2016, 184, 230–240. [Google Scholar] [CrossRef]
  10. Shimizu, M. The relationship between pollution abatement costs and environmental regulation: Evidence from the Chinese industrial sector. Rev. Dev. Econ. 2020, 24, 668–690. [Google Scholar] [CrossRef]
  11. Färe, R.; Grosskopf, S. Measuring output efficiency. Eur. J. Oper. Res. 1983, 13, 173–179. [Google Scholar] [CrossRef]
  12. Pasurka, C.A., Jr. Technical change and measuring pollution abatement costs: An activity analysis framework. Environ. Resour. Econ. 2001, 18, 61–85. [Google Scholar] [CrossRef]
  13. Färe, R.; Grosskopf, S.; Pasurka, C. Tradable permits and unrealized gains from trade. Energy Econ. 2013, 40, 416–424. [Google Scholar] [CrossRef]
  14. Lim, S.H. Accounting for environmental pollution in production function. Manag. Environ. Qual. 2014, 25, 679–695. [Google Scholar]
  15. Hailu, A.; Veeman, T.S. Environmentally sensitive productivity analysis of the Canadian pulp and paper industry, 1959–1994: An input distance function approach. J. Environ. Econ. Manag. 2000, 40, 251–274. [Google Scholar] [CrossRef] [Green Version]
  16. Lee, M. The shadow price of substitutable sulfur in the US electric power plant: A distance function approach. J. Environ. Manag. 2005, 77, 104–110. [Google Scholar] [CrossRef]
  17. Choi, Y.; Zhang, N.; Zhou, P. Efficiency and abatement costs of energy-related CO2 emissions in China: A slacks-based efficiency measure. Appl. Energy 2012, 98, 198–208. [Google Scholar] [CrossRef]
  18. Leleu, H. Shadow pricing of undesirable outputs in non-parametric analysis. Eur. J. Oper. Res. 2013, 231, 474–480. [Google Scholar] [CrossRef]
  19. Bellver-Domingo, A.; Fuentes, R.; Hernández-Sancho, F. Shadow prices of emerging pollutants in wastewater treatment plants: Quantification of environmental externalities. J. Environ. Manag. 2017, 230, 439–447. [Google Scholar] [CrossRef] [PubMed]
  20. Coggins, J.S.; Swinton, J.R. The price of pollution: A dual approach to valuing SO2 allowances. J. Environ. Econ. Manag. 1996, 30, 58–72. [Google Scholar] [CrossRef] [Green Version]
  21. Färe, R.; Grosskopf, S.; Weber, W.L. Shadow prices of Missouri public conservation land. Public Financ. Rev. 2001, 29, 444–460. [Google Scholar] [CrossRef]
  22. Wind. Available online: https://www.wind.com.cn/en/default.html (accessed on 12 September 2021).
  23. Färe, R.; Grosskopf, S.; Noh, D.; William, W. Characteristics of a polluting technology: Theory and practice. J. Econ. 2005, 126, 469–492. [Google Scholar] [CrossRef]
  24. Shephard, R.W. Theory of Cost and Production Functions; Princeton University Press: Princeton, NJ, USA, 1970. [Google Scholar]
  25. Shephard, R.W.; Färe, R. The law of diminishing returns. Z. Für Natl. 1974, 34, 69–90. [Google Scholar]
  26. Chung, Y. Directional Distance Functions and Undesirable Outputs; Southern Illinois University: Carbondale, IL, USA, 1996. [Google Scholar]
  27. Ministry of Ecology and Environment of the People’s Republic of China. Available online: http://www.mee.gov.cn/home/ztbd/gzhy/hbdh/hjbhdh/xgbd/200604/t20060419_75928.shtml (accessed on 12 September 2021).
  28. Circular of the State Council on Printing and Distributing the 11th Five Year Plan for National Environmental Protection. Available online: http://www.mee.gov.cn/zcwj/gwywj/201811/t20181129_676435.shtml (accessed on 12 September 2021).
  29. Li, Y.Z. The treatment of sulfur dioxide waste gas. Sci. Technol. Info. 2013, 18, 147–148. (In Chinese) [Google Scholar]
  30. Du, P.; Wang, Y.X. Purification and utilization of sulfur dioxide. W. China Dev. 2009, 11, 63. (In Chinese) [Google Scholar]
  31. Xu, H. Analysis on the application situation and prospects of desulfurization technology before coal burning. Value Eng. 2011, 14, 38–39. (In Chinese) [Google Scholar]
  32. Chinanews. Available online: http://www.chinanews.com/ny/2011/06-22/3129223.shtml (accessed on 12 September 2021).
  33. Bjnews. Available online: http://www.bjnews.com.cn/finance/2011/10/25/159896.html (accessed on 12 September 2021).
  34. Cheng, Y.S. Problems and countermeasures of small thermal power units shutdown. Technol. Econ. Market 2009, 5, 108–109. (In Chinese) [Google Scholar]
  35. China News Network. Available online: http://www.chinanews.com/ny/2012/08-28/4138090.shtml (accessed on 12 September 2021).
  36. China Electricity Council. Available online: https://www.cec.org.cn/detail/index.html?3-138643;12https://www.cec.org.cn/detail/index.html?3-151148 (accessed on 12 September 2021).
  37. Wang, Y.; Cheng, H.Z.; Ma, J.; Ren, S.J. Coal washing and desulfurization in western China in accordance with local conditions. Coal Process. Compr. Util. 1999, 4, 3–5. (In Chinese) [Google Scholar]
  38. Liang, J.G.; Yue, X.P.; Cheng, H.Z. Advanced coal desulfurization technology and its application prospect in Western China. Coal Proc. Technol. 2003, 1, 4–7. (In Chinese) [Google Scholar]
  39. National Bureau of Statistics. Available online: https://data.stats.gov.cn/easyquery.htm?cn=E0103 (accessed on 12 September 2021).
Figure 1. Industrial sulfur dioxide emissions and energy consumption in China from 2006 to 2015.
Sustainability 13 10726 g001
Figure 2. Average Eo and CEo (the optimal energy input without and with emission reduction constraints) in 2006–2015 (Eo and CEo were calculated using Equations (7) and (8) in Section 2.4).
Sustainability 13 10726 g002
Figure 3. 2006–2015 ECSR (energy cost per unit of SO2 emission reduction) trend chart (The ECSR was calculated using Equation (9) in Section 2.4).
Sustainability 13 10726 g003
Table 1. Descriptive statistics of variables. [The labor force, net value of industrial fixed assets, and industrial GDP data were obtained from the 2007–2016 China Industrial Statistics Yearbook. The standard coal data were obtained from the 2007–2016 China Energy Statis-tics Yearbook. The industrial SO2 (sulfur dioxide) emission data were obtained from the Wind Database].
VariableMeanS.D.MaxMin
Labor force (10,000 people)585.160159.00999,711.21011.640
Net value of fixed assets (CNY 100 million)5079.4384417.21625,080.09560.695
Standard coal (10,000 tce)12,914.1208059.82138,899.000920.000
Industrial GDP (CNY 100 million)5101.2785240.93530,425.072172.503
Industrial SO2 emissions (10,000 tons)61.79238.844168.6820.078
Industrial SO2 emission reduction (10,000 tons)132.739118.679616.5970.000
Note: tce: tons of standard coal equivalent.
Table 2. 2006–2015 energy costs of industrial sulfur dioxide emission reduction (1 − β1 and 1 − β2 in Table 2 were calculated using Equations (5) and (6) in Section 2.3, and the data of actual energy input were obtained from the 2007–2016 China Energy Statistics Yearbook. The energy consumption for emission reduction was calculated using the formulae (7) and (8).The industrial SO2 emission reduction data were obtained from the Wind Database).
Year1 − β11 − β2Actual Energy Input Ea (10,000 tce)Energy Consumption for Emission Reduction (CEoEo) (10,000 tce)SO2 Emission Reduction (10,000 tons)ECSR
20060.51580.6195290,537.00030,128.6871653.02418.226
20070.52710.6207318,974.00029,536.9922171.50013.602
20080.50580.6049337,703.00033,466.3672981.39011.225
20090.51450.6093357,238.00034,223.4003574.8619.573
20100.54110.6346389,511.00036,029.7683999.2979.009
20110.54260.6850422,305.00060,558.5374248.44914.254
20120.53030.6878443,216.00069,806.5204746.18214.708
20130.51400.6680427,490.00065,833.4605290.12012.445
20140.48880.6754439,945.00082,533.6825533.91514.914
20150.47450.6754447,317.00090,313.3025622.84916.062
Average0.51590.6487387,423.60053,243.0723982.15813.402
Note: The value of ECSR was slightly different from the quoted average energy costs and SO2 emission reduction, which was 13.3704.
Table 3. Energy cost per unit of SO2 emission reduction (ECSR) in four zones of China (The energy costs per unit of sulfur dioxide emission reduction (ECSR) in four zones in China were obtained by calculating the average ECSR in each province-level region calculated using Equations (5)–(9) in Section 2.3 and Section 2.4).
YearNortheast RegionCentral RegionEast RegionWest Region
20062.424111.168310.233935.6172
20074.810910.887915.654415.4476
20084.24948.922312.103914.6404
20095.61208.78459.898910.9317
20103.47158.19469.283210.0057
201115.421914.29749.532717.7670
201213.513611.86938.895621.2819
201315.520910.22627.585117.8697
201419.117711.49717.738322.2188
201519.938011.19998.196120.4783
Average10.408010.70479.912218.6258
Table 4. Energy costs of sulfur dioxide emission reduction (ECSR) in provinces and cities examined in China (The Eo and CEo were calculated using Equations (7) and (8) in Section 2.4. The SO2 emission reduction data were obtained from the Wind Database).
ProvinceEo
(10,000 tons)
CEo
(10,000 tons)
SO2 Emission Reduction (10,000 tons)ECSR
BeiJing3799.4256592.083298.5239.355
TianJin6660.1676660.16796.2750.000
HeBei9010.2709818.959340.4232.376
ShanXi3021.0384068.341192.4225.443
Inner Mongolia Autonomous12,746.12416,068.750219.84315.114
LiaoNing7941.5929133.642116.59810.224
JiLin4347.2344809.56919.29423.962
HeiLongjiang3105.8303180.98612.8195.863
ShangHai8675.38710,490.762148.58012.218
JiangSu21,057.31122,034.114204.3344.780
ZheJiang13,977.95914,521.091119.0834.561
AnHei5424.3426197.856183.8134.208
FuJian8921.4499006.44744.4251.913
JiangXi3499.3125855.609159.36014.786
ShanDong19,325.62621,104.076330.6715.378
HeNan9890.20412,235.488159.44314.709
HuBei7039.7647366.346119.8572.725
HuNan5898.0326562.39997.4016.821
GuangDong26,019.16726,019.167158.7980.000
GuangXi3270.9886075.63096.14029.173
HaiNan732.074906.1907.44023.404
ChongQing6562.3227538.83376.99012.684
SiChuan7566.9928707.22292.27912.356
GuiZhou1486.7345402.338149.59826.174
YunNan2834.7244134.516160.0568.121
ShaanXi4041.8147644.50790.40739.850
GanSu1187.4092313.945177.1276.360
QingHai620.271688.2505.93511.453
NingXia556.3871396.05956.93314.748
XinJiang1510.4841928.10247.2938.830
Publisher’s Note: MDPI stays neutral with regard to jurisdictional claims in published maps and institutional affiliations.

