Article

Identification of Promising Smart Farm Technologies and Development of Technology Roadmap Using Patent Map Analysis

1
Department of Industrial and Management Engineering, Korea University, 145 Anam-ro, Seongbuk, Seoul 02841, Korea
2
Department of Transportation and Logistics, Gyeonggi Research Institute, Jangan-gu, Suwon-si, 1150, Korea
*
Author to whom correspondence should be addressed.
Sustainability 2021, 13(19), 10709; https://doi.org/10.3390/su131910709
Submission received: 5 August 2021 / Revised: 20 September 2021 / Accepted: 21 September 2021 / Published: 27 September 2021
(This article belongs to the Collection Technological Innovation and Economic Growth)

Abstract

:
In this study, we suggest methodologies for identifying promising and vacant technologies on smart farms by analyzing patent information. Additionally, a technology roadmap for smart farms is suggested using network analysis. The database of patents related to smart farms was extracted from the United States Patent and Trademark Office (USPTO) by keyword search, and valid patents data was selected and clustered using the Latent Dirichlet Allocation (LDA) algorithm. We also conducted the technical importance analysis and trend analysis to identify promising technology topics. By developing a patent map based on a self-organizing map (SOM), we were able to identify vacant technologies among smart farm technology groups. In order to develop vacant technologies, we presented a stepwise technology roadmap by analyzing the relationship between technology elements using network analysis. The proposed procedure and analysis method provides useful insights in establishing research and development (R&D) strategies for the development of smart farm technology roadmaps.

1. Introduction

Agriculture is one of the oldest industries in the world. Food is one of three major survival factors of human, along with cloths and shelter. Thus, agriculture should be the most important industry for mankind. The production of foods has so far increased based on scientific and technological advances such as chemistry, mechanization, and automation. However, the risk of undersupply due to population growth and climate change still remains, particularly in underdeveloped or harsh climate areas.
Smart farms are one of many very important agricultural technologies that have an impact on long-term sustainable food supply as well as the improvement of local and global environments. The UN has designed 17 goals for achieving global sustainable development, and smart farms are related with 4 goals directly and indirectly. Developments in smart farm technologies and applications in the world could increase the supply of foods to starved areas, help to secure clean water and lands from pollution, and promote the spreading of ICT (information and communication technology) infrastructures.
Vertical farms, which are a type of smart farm technology, have the advantage of not being affected by climatic conditions such as temperature, precipitation, humidity, and sunlight, and cultivate far more harvests per unit area than open farmland. Such technology has already been applied to harsh climate areas such as deserts and polar areas. They provide fresh foods to people and helps to decrease pollution caused by transportations and storage.
According to the research and investigation on farmers in Italy, farmers with higher levels of education are interested in using smart farm technologies for increasing productivities. Based on this, it is assumed that farmers with higher levels of education in developed countries would be early adapters of smart farm technologies. Smart farms then would spread to less educated farmers in developing countries. The education which would have an impact on understanding smart farms and their costs would be either the drivers or barriers of smart farms [1,2].
A smart farm represents the agricultural application of ICT technologies. Such technologies optimize and increase the efficiency of farm management by using information systems. Technologies of precise positioning, image processing, and measurement make it possible to locate objects and collect exact data of crops or livestock, which allows farmers to monitor their live assets everywhere anytime. Collected data through networks connected sensors can be used for monitoring, automatic controlling, and data processing of artificial intelligence. Robots, drones, robot arms, and autonomous vehicles are the technologies which will replace manual work and make it possible to operate farms without human interference. Therefore, smart farm technologies can optimize farming production and management, improve efficiency, and realize unmanned production management by combining cutting-edge technologies related to automation, sensors, IoT, drones, big data, and artificial intelligence technologies [3,4].
How a smart farm works begins with information acquisition and analysis. Information of farm environments and the status of crops or livestock are acquired by various network connected sensors such as temperature, humidity, flow, chemical, or image sensors. The originally transferred data to servers are raw data which should be processed into meaningful information for various purposes such as immediate automatic control or big data analysis. Broadband data communication technology gradually introduced into the agriculture and livestock industry make it possible to process large amounts of data, especially data generated by image sensors and/or large numbers of IoT sensors. While smart farms work on live objects, data processing of smart farm systems must transcend time and space [5]. Big data processing technology finds meaningful and essential information from a tremendous amount of collected data. Big data processing and artificial intelligence technologies would contribute to faster responses of status control and increase efficiencies by enriching and replacing human experiences. The controlled technology implements systems to automatically adjust and maintain state values such as temperature and humidity based on the information obtained from the sensors. This technology is used not only for cultivation and environment control but also for autonomous navigating robots such as agriculture drones and un-manned tractors [6].
In order to implement smart farms, various types of technologies must be fused and developed. For example, if pests or diseases occur, leaf images should be taken by image sensors, image processing such as filtering or edge detection should be applied to figure out objects, big data analysis should be performed to identify of the type of pests, chemical synthesizing recipe and technologies would be used to mix pesticides, and then autonomous ground robots or drones should be followed to spray them. Technologies of image capture, image processing, big data analysis, drug combinations, autonomous driving, and spray control of fluids are needed for the singular purpose of pest and disease control. However, if the levels of these technologies are different, it would be difficult to realize applied technologies (in this example, for pests and disease control). Therefore, to develop the applied technologies, it is necessary to analyze individual technologies and identify technologies with low levels (i.e., vacant technologies) and then provide development management to improve levels [7]. In addition, an integrated development management of applied technology with a scheduled development roadmap is needed to combine individual technologies.
ICT technologies useful for smart farm are developed universally. Therefore, additional development of such technologies tailored to agricultural purposes would be necessary. Then the development of combined technologies for agricultural centric application should be followed afterwards. Therefore, implementing technologies into agricultural applications would require selective development to bridge the gap of different development levels, and thus the planning would be required for interconnection and integration of individually developed technologies. For the management of systematic research and development, a technology development roadmap is used. The technology development roadmap is an important tool for R&D management since it finds the technologies needed to be developed based on the development goal, sets the development direction, and enables integrated management among different technologies [8].
Building the technology development roadmap is usually conducted using methods such as AHP (analytic hierarchy process) with technology related information and interviews with experts of research institutes and industry leading companies. Interviews with experts need many interviewees to get balanced outcome, and the result of AHP may possibly influenced by the intention of AHP designer [9,10,11].
Patents are used as one of the main information sources of technologies due to its nature of reflecting the most recent technology and opened to public [12]. Patent information is often used to search for vacant technologies or to find the possibility of patent infringement of existing technologies rather than to set the direction for technology development (due to the large numbers of documents to be analyzed, which requires a long time for analysis) [7]. If big data analysis technology, which is developing recently and rapidly, is applied for patent analysis, patents information can be used to identify R&D trends, direction setting, and finding vacant technologies which would enable one to fill the gaps among major technologies. This study is designed to draw detailed technology development trends for smart farm implementation and identify vacant technologies to be developed in the future by applying big data analysis techniques to smart farm patents information. In addition, based on identified vacant technologies, we would like to suggest the technology development roadmap of smart farm for future developments.

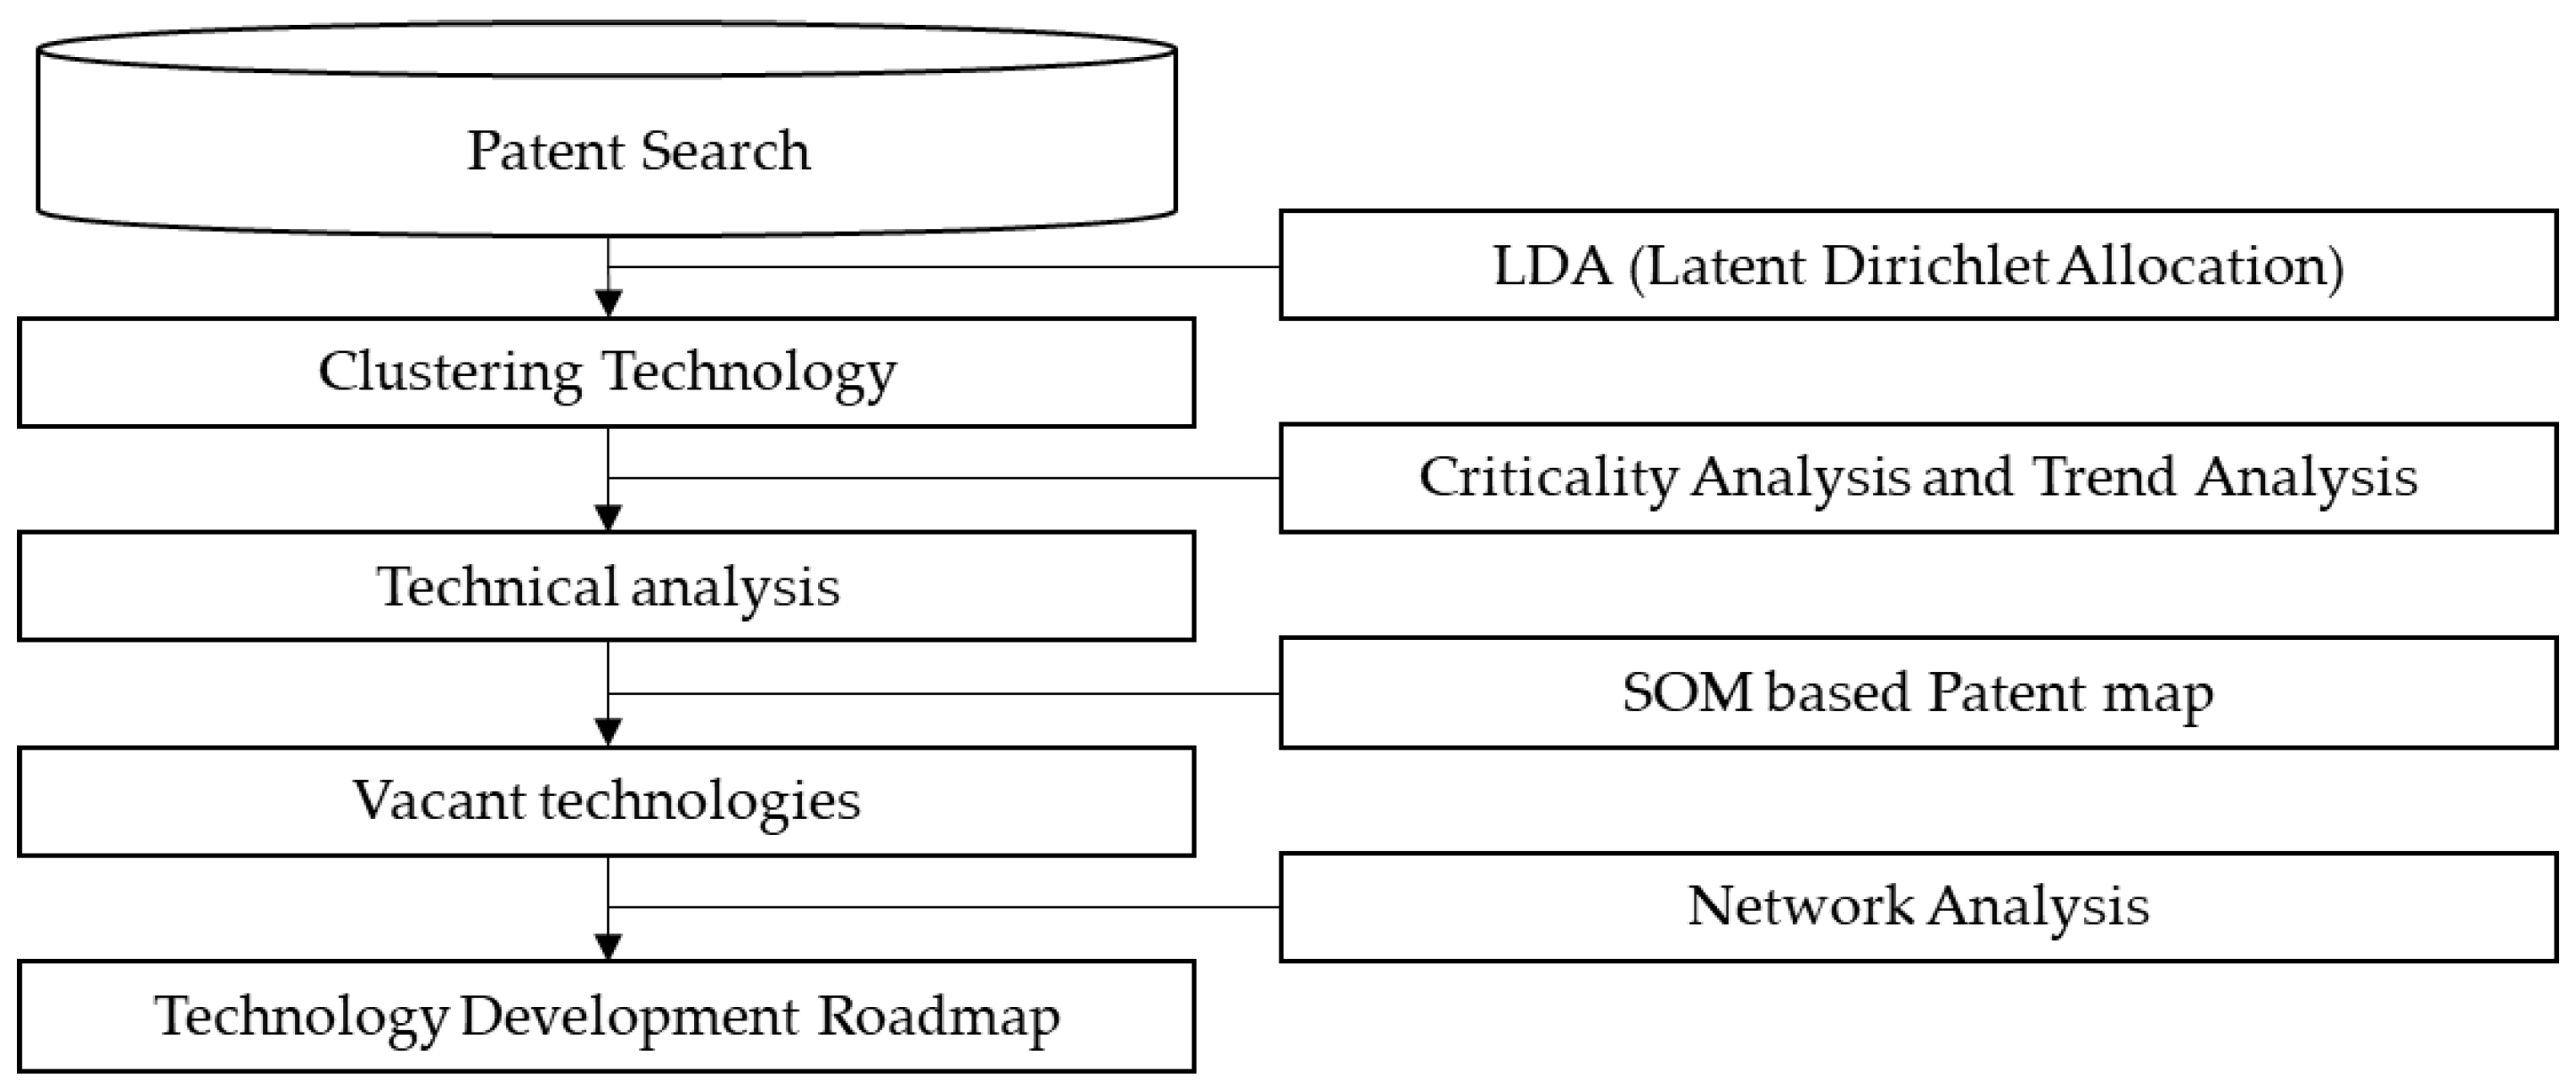
2. Materials and Methods

The overall process of our proposed approach consists of the following five steps: patent search, clustering technology, technical analysis, vacant technologies, and technology development roadmap. Each step consists of substeps to achieve each particular goal, as shown in Figure 1 [7,13,14].
The first step is to collect the abstract of the patent document. Since there are various types of smart farm technologies, it is necessary to subdivide them and develop a technology roadmap for each field. Thus, we segmented the smart farm technology using Latent Dirichlet Allocation (LDA). Then, we analyzed with technical analysis and derived priorities for technological development. For the technology development priority derivation, we applied criticality both analysis and trend analysis. The criticality analysis aimed to evaluate the current technological level based on the number of patent applications and the number of patent citations. Trend analysis aimed to confirm future technology prospects based on the number of past patent applications. In the next step, we developed a SOM-based patent map that identifies the vacant technology fields. The vacant technology field is a space where patents do not exist in a two-dimensional map compared to other areas based on patent documents. The final step is to derive a technology development strategy and a roadmap for vacant technologies using the network analysis. A detailed description of the process is provided below.

2.1. Patent Search and Data Preprocessing

This study begins with collecting of patent documents. Patent documents are used for development of future technologies [12]. The patent documents contain various information such as abstract, title, and IPC (International Patent Classification) code which is a classification code for specific technical fields. A patent is a document that meets the technical and legal requirements for originality and technological validity [15]. Therefore, patent analysis is used as one of very important tools of R&D management [16]. Due to such characteristics, patent applications are used as a very important indicator for companies and are also used to determine the level of technology [17]. Therefore, it is good to derive a technology development strategy by applying various analysis methods through patent data which contains various information about the technology.
Patent documents can be collected from different patent institutions. It is effective to use the United States Patent and Trademark Office (USPTO) to collect various reliable patents [18]. In this study, patents related to smart farm system technology were extracted from the US Patent and Trademark Office (USPTO) database. Keywords required for the patent search formula were selected based on previous research and reports, and research related to smart farm system technology. In collecting the patent data, the formula to select patents was set for the period from 1974 to 2021 and chose China, USA, Korea, and Europe as the countries of inquiry. The formula consisted of agriculture related keywords “agriculture”, “greenhouse”, “aquaculture” to relate the target industry which is agriculture. “Autonomous “, “Navigation”, “Recognition”, “Tactile”, “Harvesting”, “Monitoring”, “Nursery”, “Picking”, “Spray” are the keywords used to reflect methods and objects. For technology terms, “IoT”, “Big data”, “Sensor”, “Cloud”, “Wireless” are used for the formula. As a result, 1608 patents data were collected. In order to increase the reliability of technology analysis, the process of selecting valid patents from all collected patents is required. In this research, several experts of agriculture, smart technologies, and big data from academic institutes and government agency supported to select valid patents. A total of 436 valid patents were selected as the result of selection process. In this study, we used the title of patent information and abstract. This information, which is text-based unstructured data, required data pre-processing for data utilization [19].
Data preprocessing aims to convert unstructured data to structured data. Finally, we generated a data set (i.e., a patent-keywords matrix). Text data contains punctuation marks, ab-abbreviations, and unnecessary words. Thus, stopwords must be removed for reliable result derivation [20,21,22,23]. Then, we selected the essential words applying the term frequency-inverse document frequency (TF-IDF) algorithm [24]. It is a method of extracting significant keywords by analyzing the frequency and TF-IDF weights of individual documents. The TF-IDF algorithm selects significant keywords in a way that considering the frequency of word usage and the frequency of use of document-specific words [25]. TF-IDF consists of a weighted value of terms that appear certain documents as shown in Equation (1) and weighted value of the document that certain terms Equation (2). The influence of a terms is calculated as Equation (3). TF-IDF is one of major methods to extract main keywords and is applied to this study.
TF ( t ) = n u m b e r   o f   t i m e s   t e r m   t   a p p e a r s   i n   a   d o c u m n e t t o t a l   n u m b e r   o f   w o r d s   i n   t h e   d o c u m e n t
IDF ( t ) = log ( t o t a l   n u m b e r   o f   d o c u m n e t s n u m b e r   o f   d o c u m n e t s   c o n t a i n i n g   t e r m   t )
TF IDF ( t ) = TF ( t ) × IDF ( t )
We selected significant keywords using the TF-IDF algorithm and developed a patent-keyword matrix. This study used abstracts and titles to develop a patent-keywords matrix. After tokenization through stemming to extract stems and stopword processing, essential keywords were extracted by using TF-IDF based on word frequency and specific word frequency for each document. In the keyword extraction process, words not related to the smart farm system were deleted as stopwords and major keywords were selected. Finally, the top 200 key keywords were driven. This meant that the patent-keyword matrix was represented by a 436 × 200 matrix, and if that keyword was included, each patent document was reflected in one, as shown in Table 1.

2.2. Clustering Technology

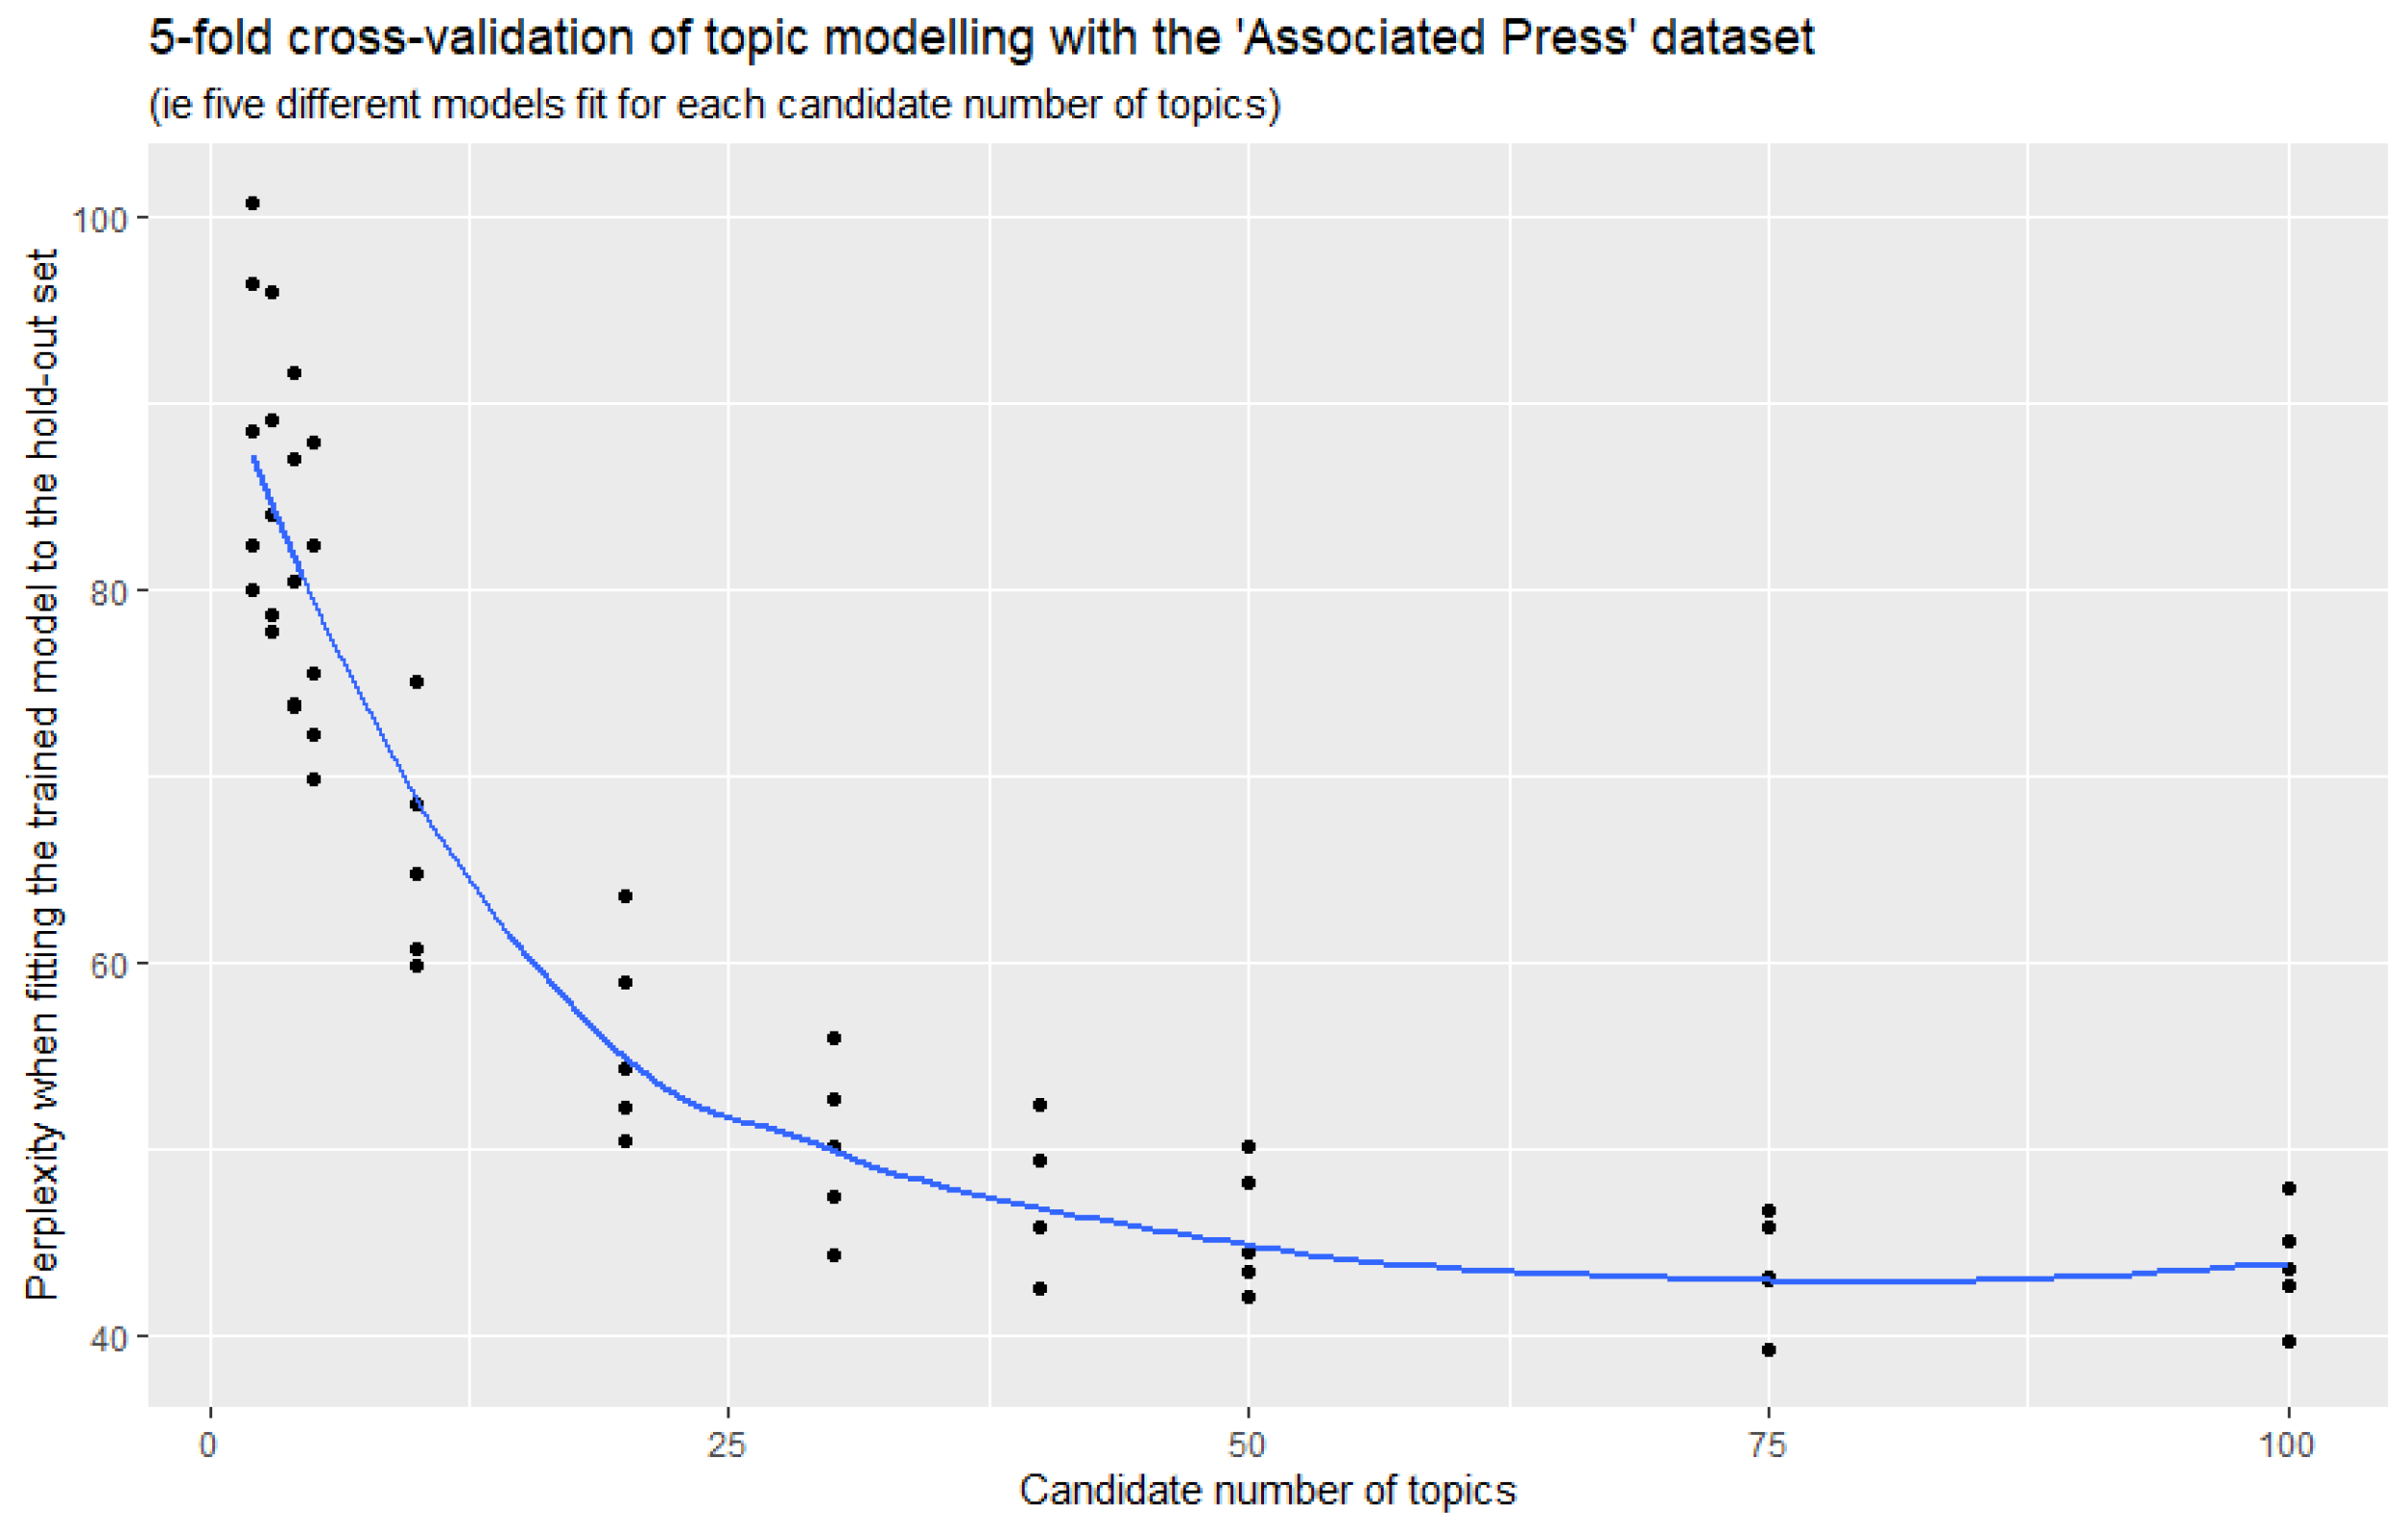
2.2.1. LDA (Latent Dirichlet Allocation)

The Latent Dirichlet Allocation (LDA) algorithm, which is a topic modeling technique, is applied to subdivide the technical field. The LDA algorithm is the process of finding a topic from a set of documents [26]. Patent documents consist of articles on various topics. The LDA algorithm reversely tracks the process by which the document was generated, assuming that the topic generates words based on a probability distribution [27]. The LDA algorithm is an effective algorithm for classifying topics in documents.

2.2.2. Clustering

The LDA algorithm can be topic-crowded and must determine the number of clusters (K). The number of clusters (K) is determined by K-cross validation. Since K-cross validation evaluates the complexity of a language model, optimal K derivation is possible [28]. In general, the smaller the complexity value, the better the topic model reflects the results of the actual literature. However, since overfitting can occur, K is changed and determined based on a qualitative evaluation. After the technology clustering is performed based on the LDA algorithm, the topic is defined based on the words distributed by topic.

2.3. Technical Analysis

For practical technological development, it is necessary to grasp technological trends and characteristics and derive fields with potential for technological development [7,17,29]. To identify trends of technologies and their characteristics, we applied criticality analysis and trend analysis as technology analysis. Criticality analysis analyzes the level of current technology based on quantitative and qualitative index and trend analysis aims to analyze the future trend of technology. By applying these analyses, it is possible to identify technology areas with high levels as well as having future potentials where we are interested to find. Therefore, we perform criticality analysis through a technology level map that evaluates the current technology level and trend analysis through time series analysis that predicts the prospects to derive the priority of technology development by topic.

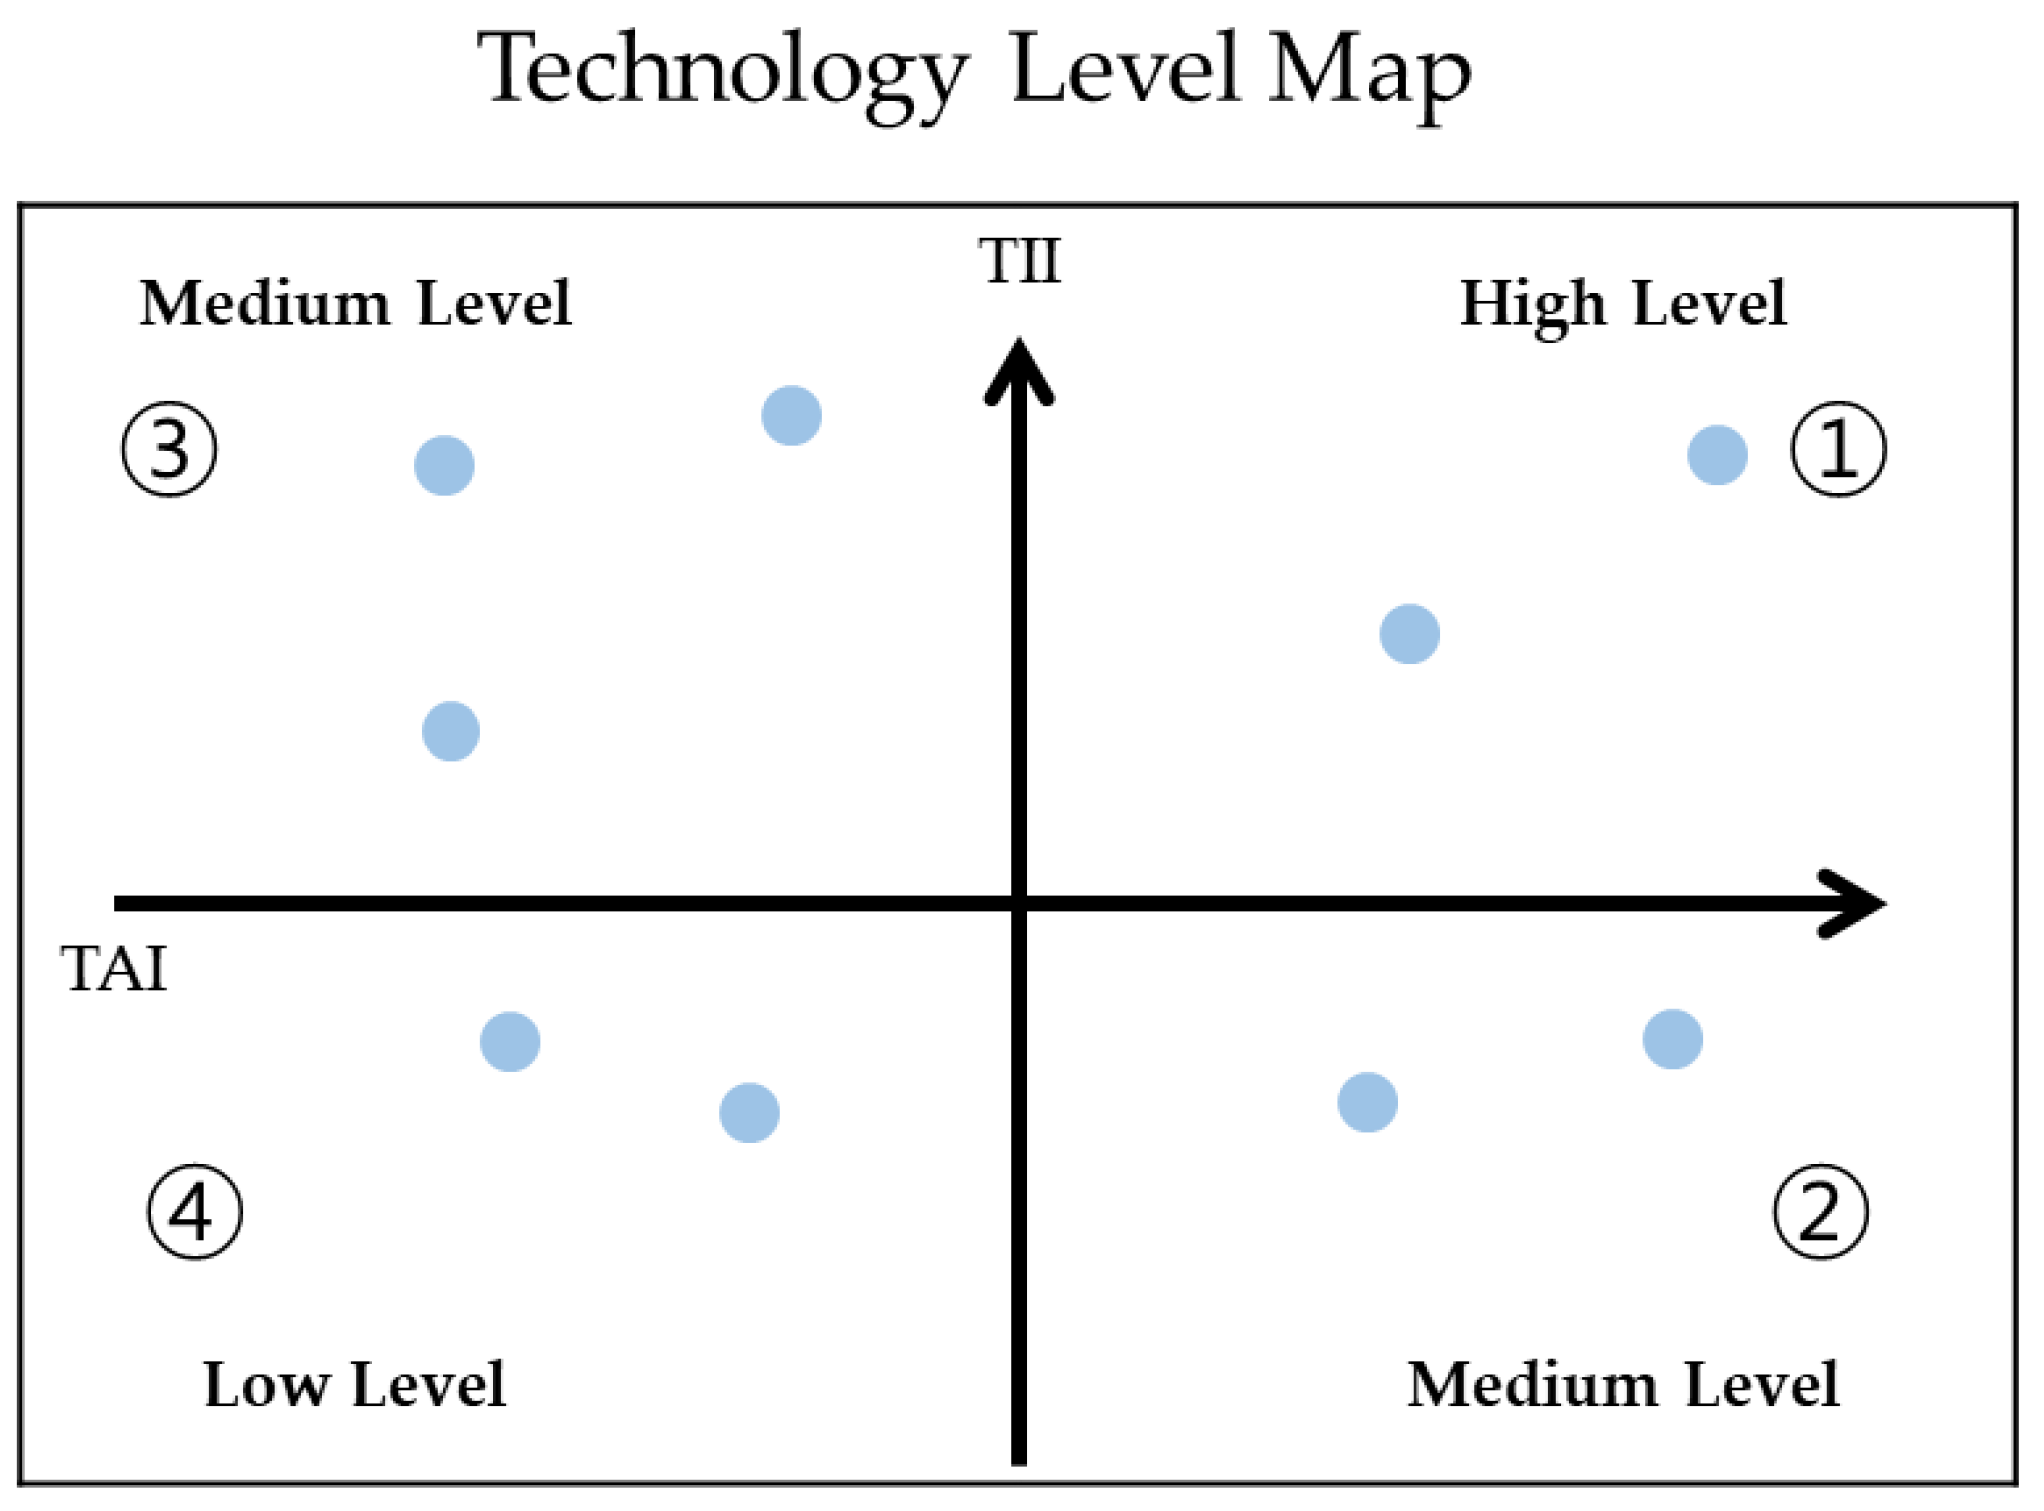
2.3.1. Criticality Analysis

The criticality analysis aims to evaluate the current technology level. This analysis uses a technology level map that evaluates the relative level of technology. This analysis applies the technology level map which relative levels of technologies are assessed in two-dimensional map using quantitative and qualitative indexes as shown in Figure 2. The technology level map reflects assessments of quantitative and qualitative index, and it is possible to identify technologies of high growth potentials and effectiveness. The TAI (technology activity index) is applied to x-axis to assess relative and quantitative levels of technologies. TAI refers to the numbers of patents filed, and it is possible to analyze the relative growth of technologies. Therefore, it is considered that higher the TAI index the faster the technology develops [30]. Y-axis is TII (technology impact index) which is defined as the numbers of patents citations. The citations of patents connected with other patents have economic and technological importance and are suitable to assess technological influences. Highly cited patents are usually grounds for another new developments and are considered advanced technologies [31]. Therefore, a criticality analysis is performed using a technical level map to assess the current level of the vacant technology area. The technical fields through the technical level map can be located in the one, two, three, and four quadrants. The one quadrant is defined at the high level where both the TAI and TII indicators are high, and the two and three quadrants are defined at the medium level where either the TAI or TII index is high. Finally, the four quadrants are defined at the low level where all indicators are low [7,13,14,32].

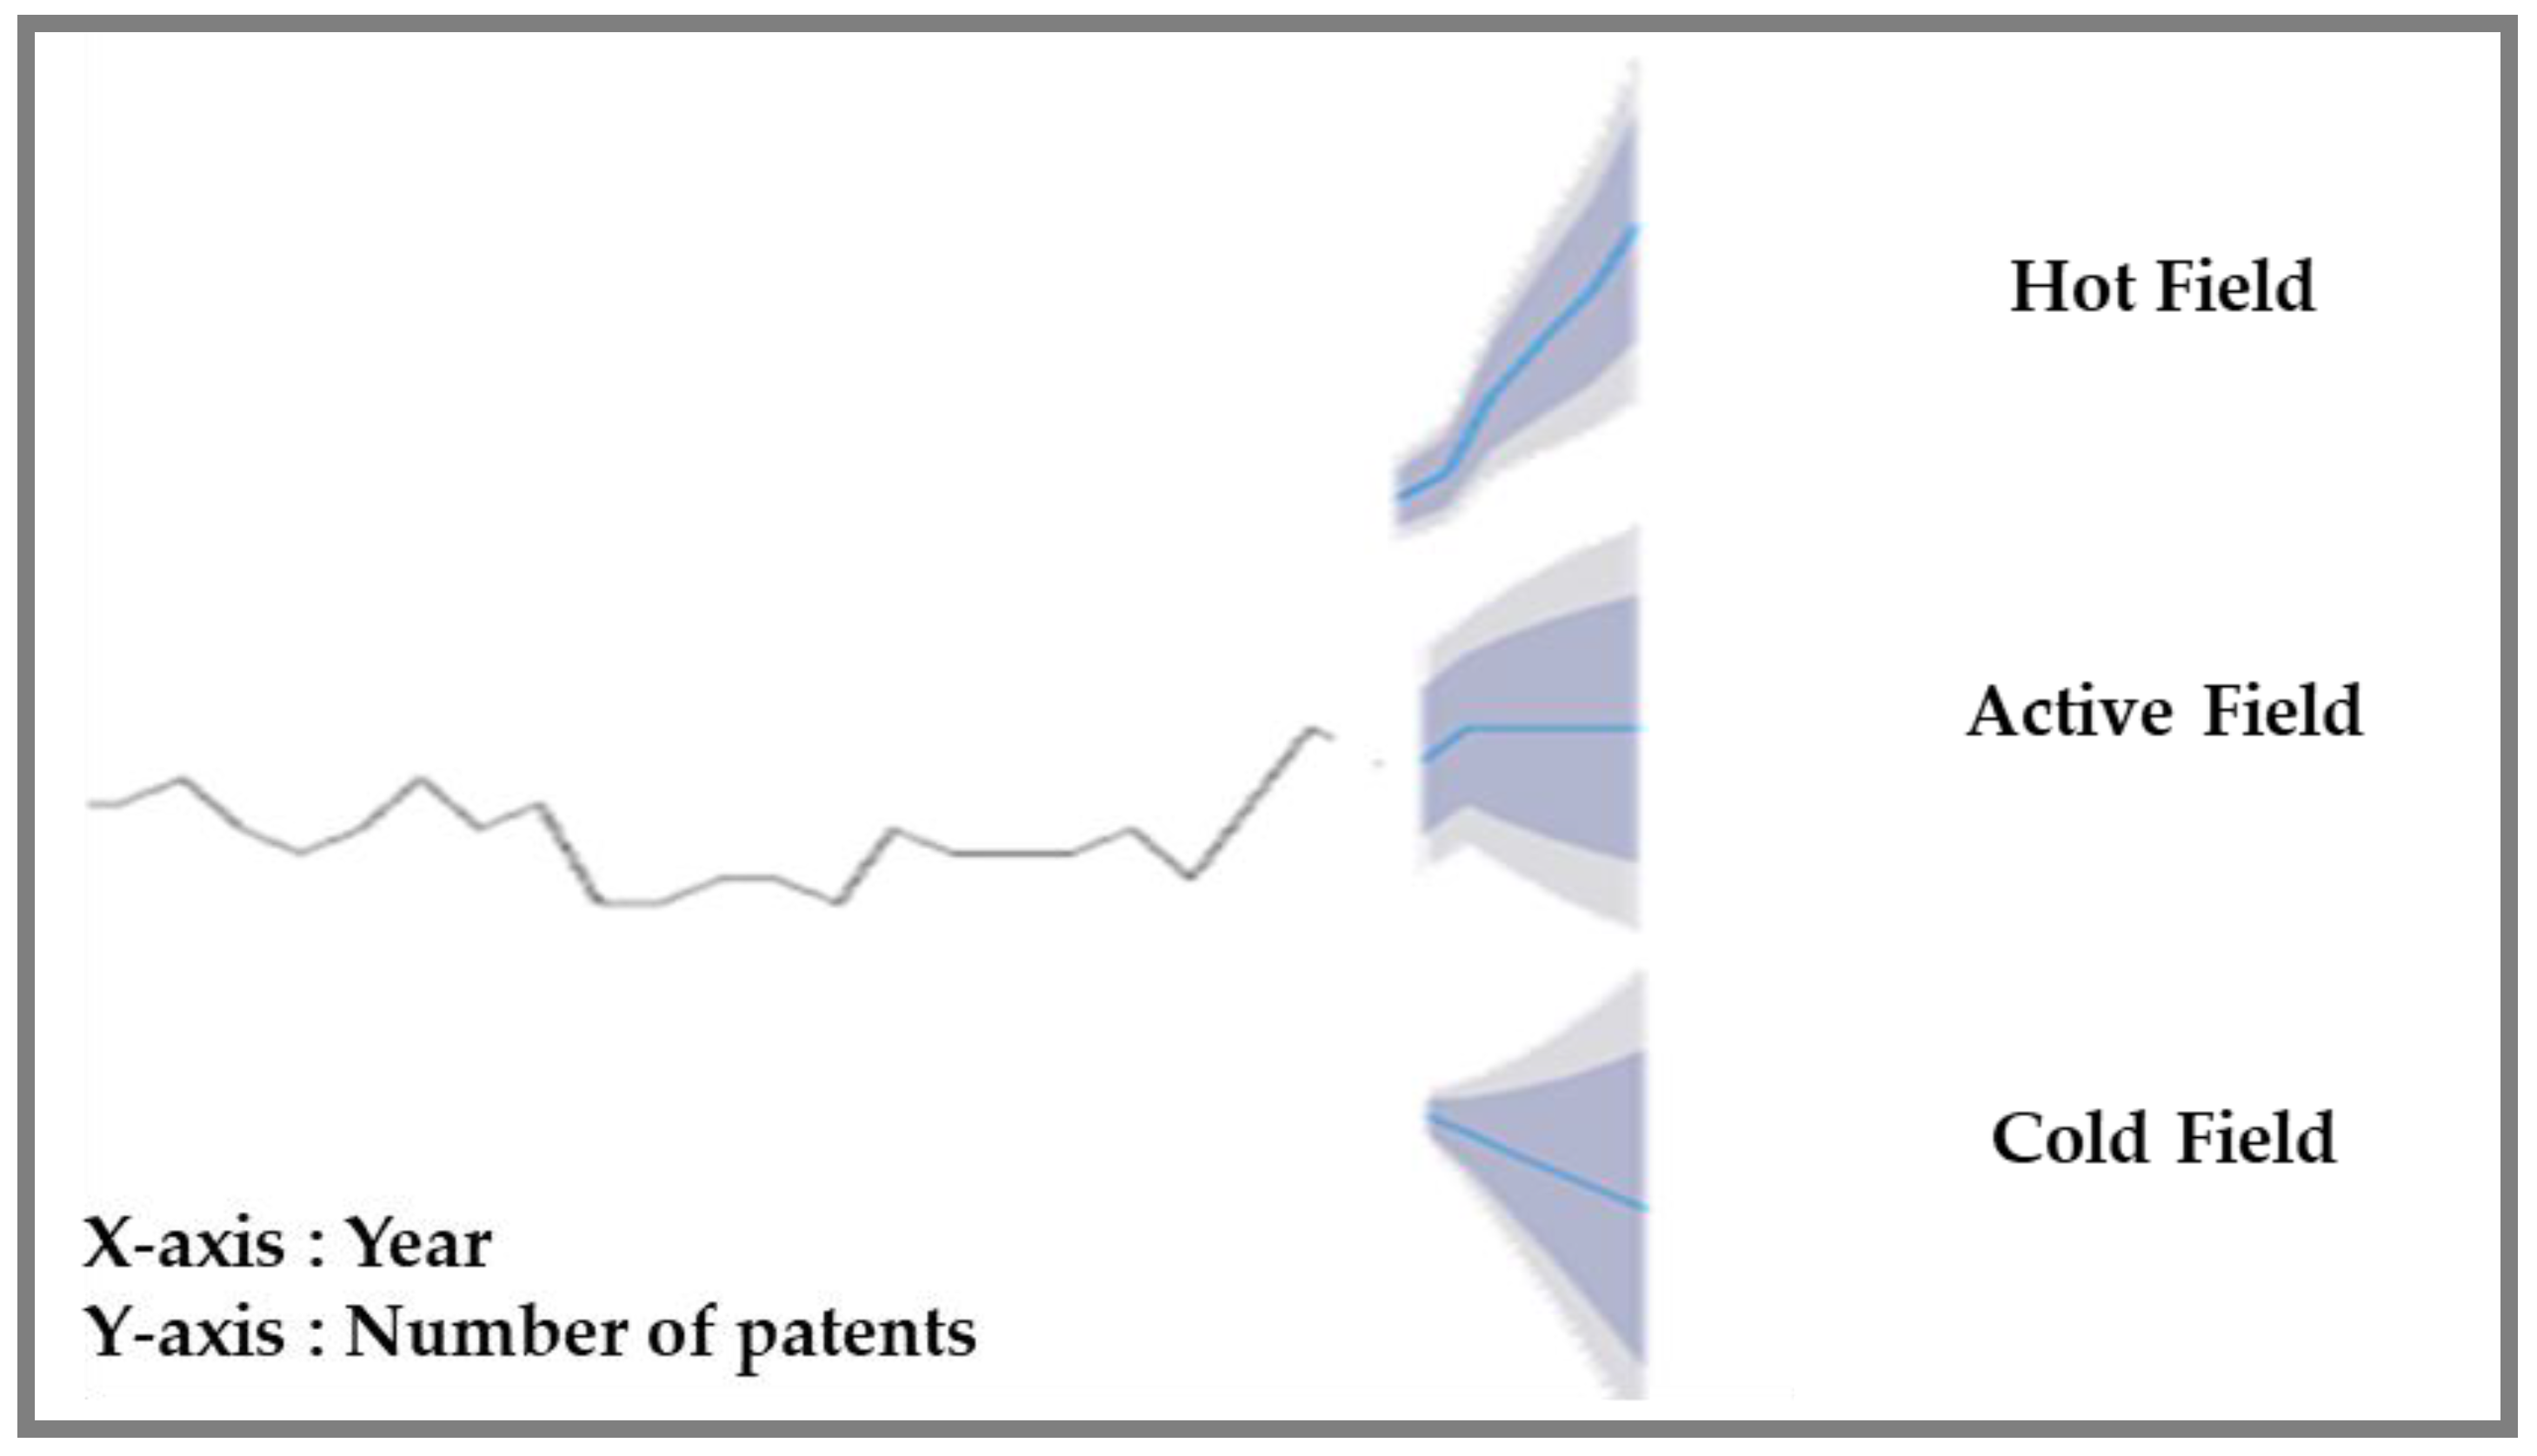
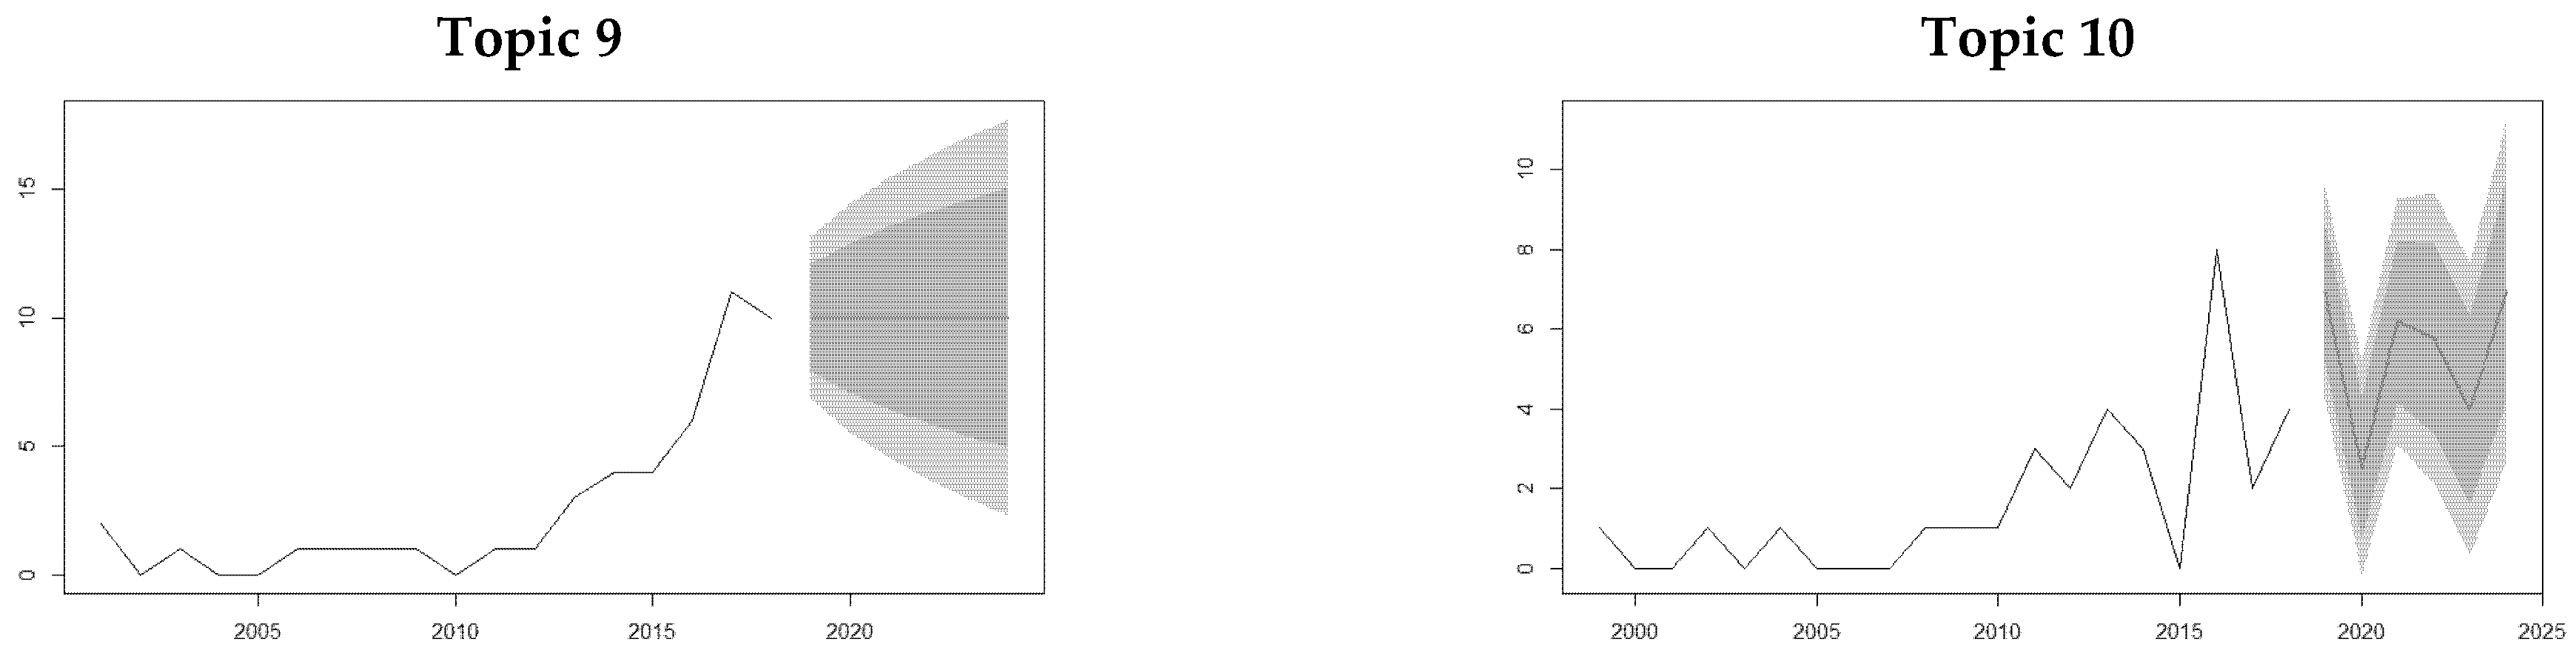
2.3.2. Trend Analysis

Trend analysis is to predict the future of the technological field. Time-series analysis is a method of predicting future values using time-series data, which is historical data obtained continuously at regular intervals over time. Time-series data consists of viewpoints and frequencies, with viewpoints as independent variables and frequencies as dependent variables, and statistical methods are used to predict the future. This is suitable for short-term and medium-term perspectives rather than long-term perspectives due to various environment variables [33]. There are various predictive analytics models in time series analysis, but in this study we reflect the autocorrelation that the previous value affects the subsequent values, the influence of random variables over time, and the tendency of past data. We apply the ARIMA (autoregressive integrated moving average) model to the trend analysis in the technical field. Based on the results of the trend analysis shown in Figure 3, we defined the rising interest as the hot field, the decreasing interest as the cold field, and the stable interest as the active field [7,14].

2.4. Vacant Technologies Using Patent Map

2.4.1. Traditional Patent Map

Patent maps convey visual elements such as charts, graphs, bars, and tables in a way that expresses patent relationships [34,35]. Patent map effectively provides practical and intuitive information to users [36]. Therefore, patent maps are used for establishment of various technology development strategies [37]. The early-stage patent map was developed with the basic patent information, such as author, technical field, and claim scope. Patent maps developed through such simple statistical analysis using basic information have the advantage of simple in development but have the limitation that cannot be used for establishing technology development strategies since other patent details are not utilized [19]. Recent advances in unstructured data analysis techniques have enabled us to overcome such limitation.

2.4.2. Unstructured Data-Based Patent Map

The development of text mining techniques has enabled detailed analysis of patent documents (which are unstructured data) [38]. In this way, various patent maps can be developed by analyzing detailed information of patent documents using text mining techniques [39]. Representative patent maps developed through unstructured data analysis are PCA (principal component analysis), GTM (generative topographic mapping), and SOM (self-organizing map). The patent map based on unstructured data expresses undeveloped technologies through vacant nodes. Vacant node refers to a vacant technology that is not developed yet and used as source to identify undeveloped latent technology. Therefore, vacant nodes contribute to developing the research and development plan of a certain technology [19]. PCA transforms multiple variables into several linear combinations based on feature extraction technology using dimensionality reduction [40]. In other words, it is a technique to explain or express through reducing the dimension by extracting the key variables. However, there is a limitation that detailed understanding is difficult since too much data is linearly combined in the process of extracting main variables. GTM is a mathematical model for density modeling and visualization, a technique to reduce multidimensional data to low dimensions through functions [41]. Unlike the PCA technique, results can be interpreted through reverse mapping algorithm since the dimension is reduced through functions. However, GTM has limitations since it requires environment settings to set various variables and is vague in interpretation since patents exist even in vacant nodes. SOM is an artificial neural network which maps multidimensional data to a two-dimensional topological grid [42]. SOM can map similar data to the same node and visualize the similarities and differences of nodes with color contrast [19,43]. In addition, vacant nodes can be clearly articulated. To sum up, the patent map based on PCA has limitations of analyzing detailed technologies since it consists with many linear combinations. The patent map based on GTM has limitation of unclear definition of technology due to requirement of setting up various variables as well as small numbers of patents in vacant node. In contrast, the patent map using SOM has the advantage of the possibility to define technology for vacant node based on plenty of data. Therefore, in this study, the patent map using SOM is used for analyzing technologies of smart farms.

2.5. Techonology Development Roadmap

Network Analysis
Network analysis quantitatively measures the relationships and interactions among people, groups, and organizations and visualizes their relations [44]. Networks represented with quantitative indicators of nodes provide an overall understanding, including relationships between nodes and the roles of individual nodes [45,46]. In addition, various analytical indicators such as centrality and density can be used for in-depth analysis of the roles of nodes within the network [47,48]. Network analysis has been applied and utilized in various fields such as citation relationships between papers and interpersonal relationships [49,50].
A patent network refers to analyzing the relationship among patents using patent documents as input data [51]. A Patent network analysis enables various in-depth analyses, including relationships among technical elements and key technical elements of technology. Based on this, various technology development strategies can be established [52]. If a network is developed based on patent citation, there is drawback that relation analysis would be limited to retailed contents [53]. Therefore, patent network analysis generally intends to the analysis of patent detailed information [53,54]. The relationships among technologies are analyzed through extracting keywords related with technology by applying the text mining technique to the patent document. Technology keywords extracted by using text mining techniques represent major technology elements of patents, and therefore effective analysis of target technology would be possible [55]. In this way, while analyzing the relationship among technology element using patent networks, idea creation of technology R&D would be possible [56].
This study applies network analysis to the relationship among technology elements to create a technology roadmap for the smart farm technologies. The reliability of this roadmap is increased with the process of creating and demonstrating a technology development roadmap based on the results of the network analysis. Therefore, in order to design a technology development roadmap, the needs of quantitative and specific analysis through patent documents are confirmed and the performance of this study would be maximized.
Patent network analysis measures, visualizes, and analyzes interactions between technologies. The patent-keyword matrix has information on whether a word appears in patent documents as a co-occurrence matrix. We perform network analysis based on the patent-keyword matrix. Network analysis quantitatively analyzes the position and role of an actor on a network using various indicators [57,58]. There are various indicators to analyze the role of a node such as a degree centrality, closeness centrality, and betweenness centrality [59]. Degree centrality is an index that quantifies the number of connections between a node and other nodes. The larger the value, the higher the connection with other nodes and the higher the importance and can be calculated by the following Equation (4). Since degree centrality is a numerical value calculated based on the number of directly connected nodes, it has the characteristic that local centrality has a strong meaning.
Degree   Centrality :   D i = j = 1 N Z ij Z ij :   Number   of   direct   connections   from   node   i   to   j
Closeness centrality is an indicator developed from degree centrality and considers indirect connections within the network. In order to consider indirect connection, the distance between nodes is defined as in Equation (5). That is, the length of the shortest path between a node and all other nodes is expressed in terms of the overall network since it emphasizes the distance between the actor (node) and all other nodes. Global network centrality measurement is possible, which can take into account various relationships.
Closeness   Centrality :   C c = [ j = 1 N d ( i , j ) ] 1 d ( i , j ) :   The   length   of   the   shortest   path   from   node   i   to   j
Betweenness centrality is an indicator that the degree of control of relationships between nodes that are not directly connected. This indicator is calculated at all vertices as in the shortest path Equation (6) to all other vertices passing through that node. This is calculated for the entire network and confirms where it is located in the network. Therefore, it can be interpreted that the larger the index value, the greater the influence on the information transmitted through the entire network. Another way to interpret it is that a node with a large betweenness centrality can distort or filter information as it transmits information in the network, potentially disrupting or disrupting network activity. It can be interpreted by a threatening node that can have it.
Betweenness   Centrality :   C B = j < k g j k ( N i ) g j k g j k ( N i ) :   Number   of   paths   that   include   node   i ,   the   shortest   path   from   node   j   to   k ,   g j k   : Shortest   path   between   nodes   j   and   k
Using various indicators such as the above, we can analyze the relationships between technologies and the core technologies that connect vacant technologies. The results of the analysis can be used by companies and laboratories to develop technology roadmaps for R&D and business planning.

3. Results

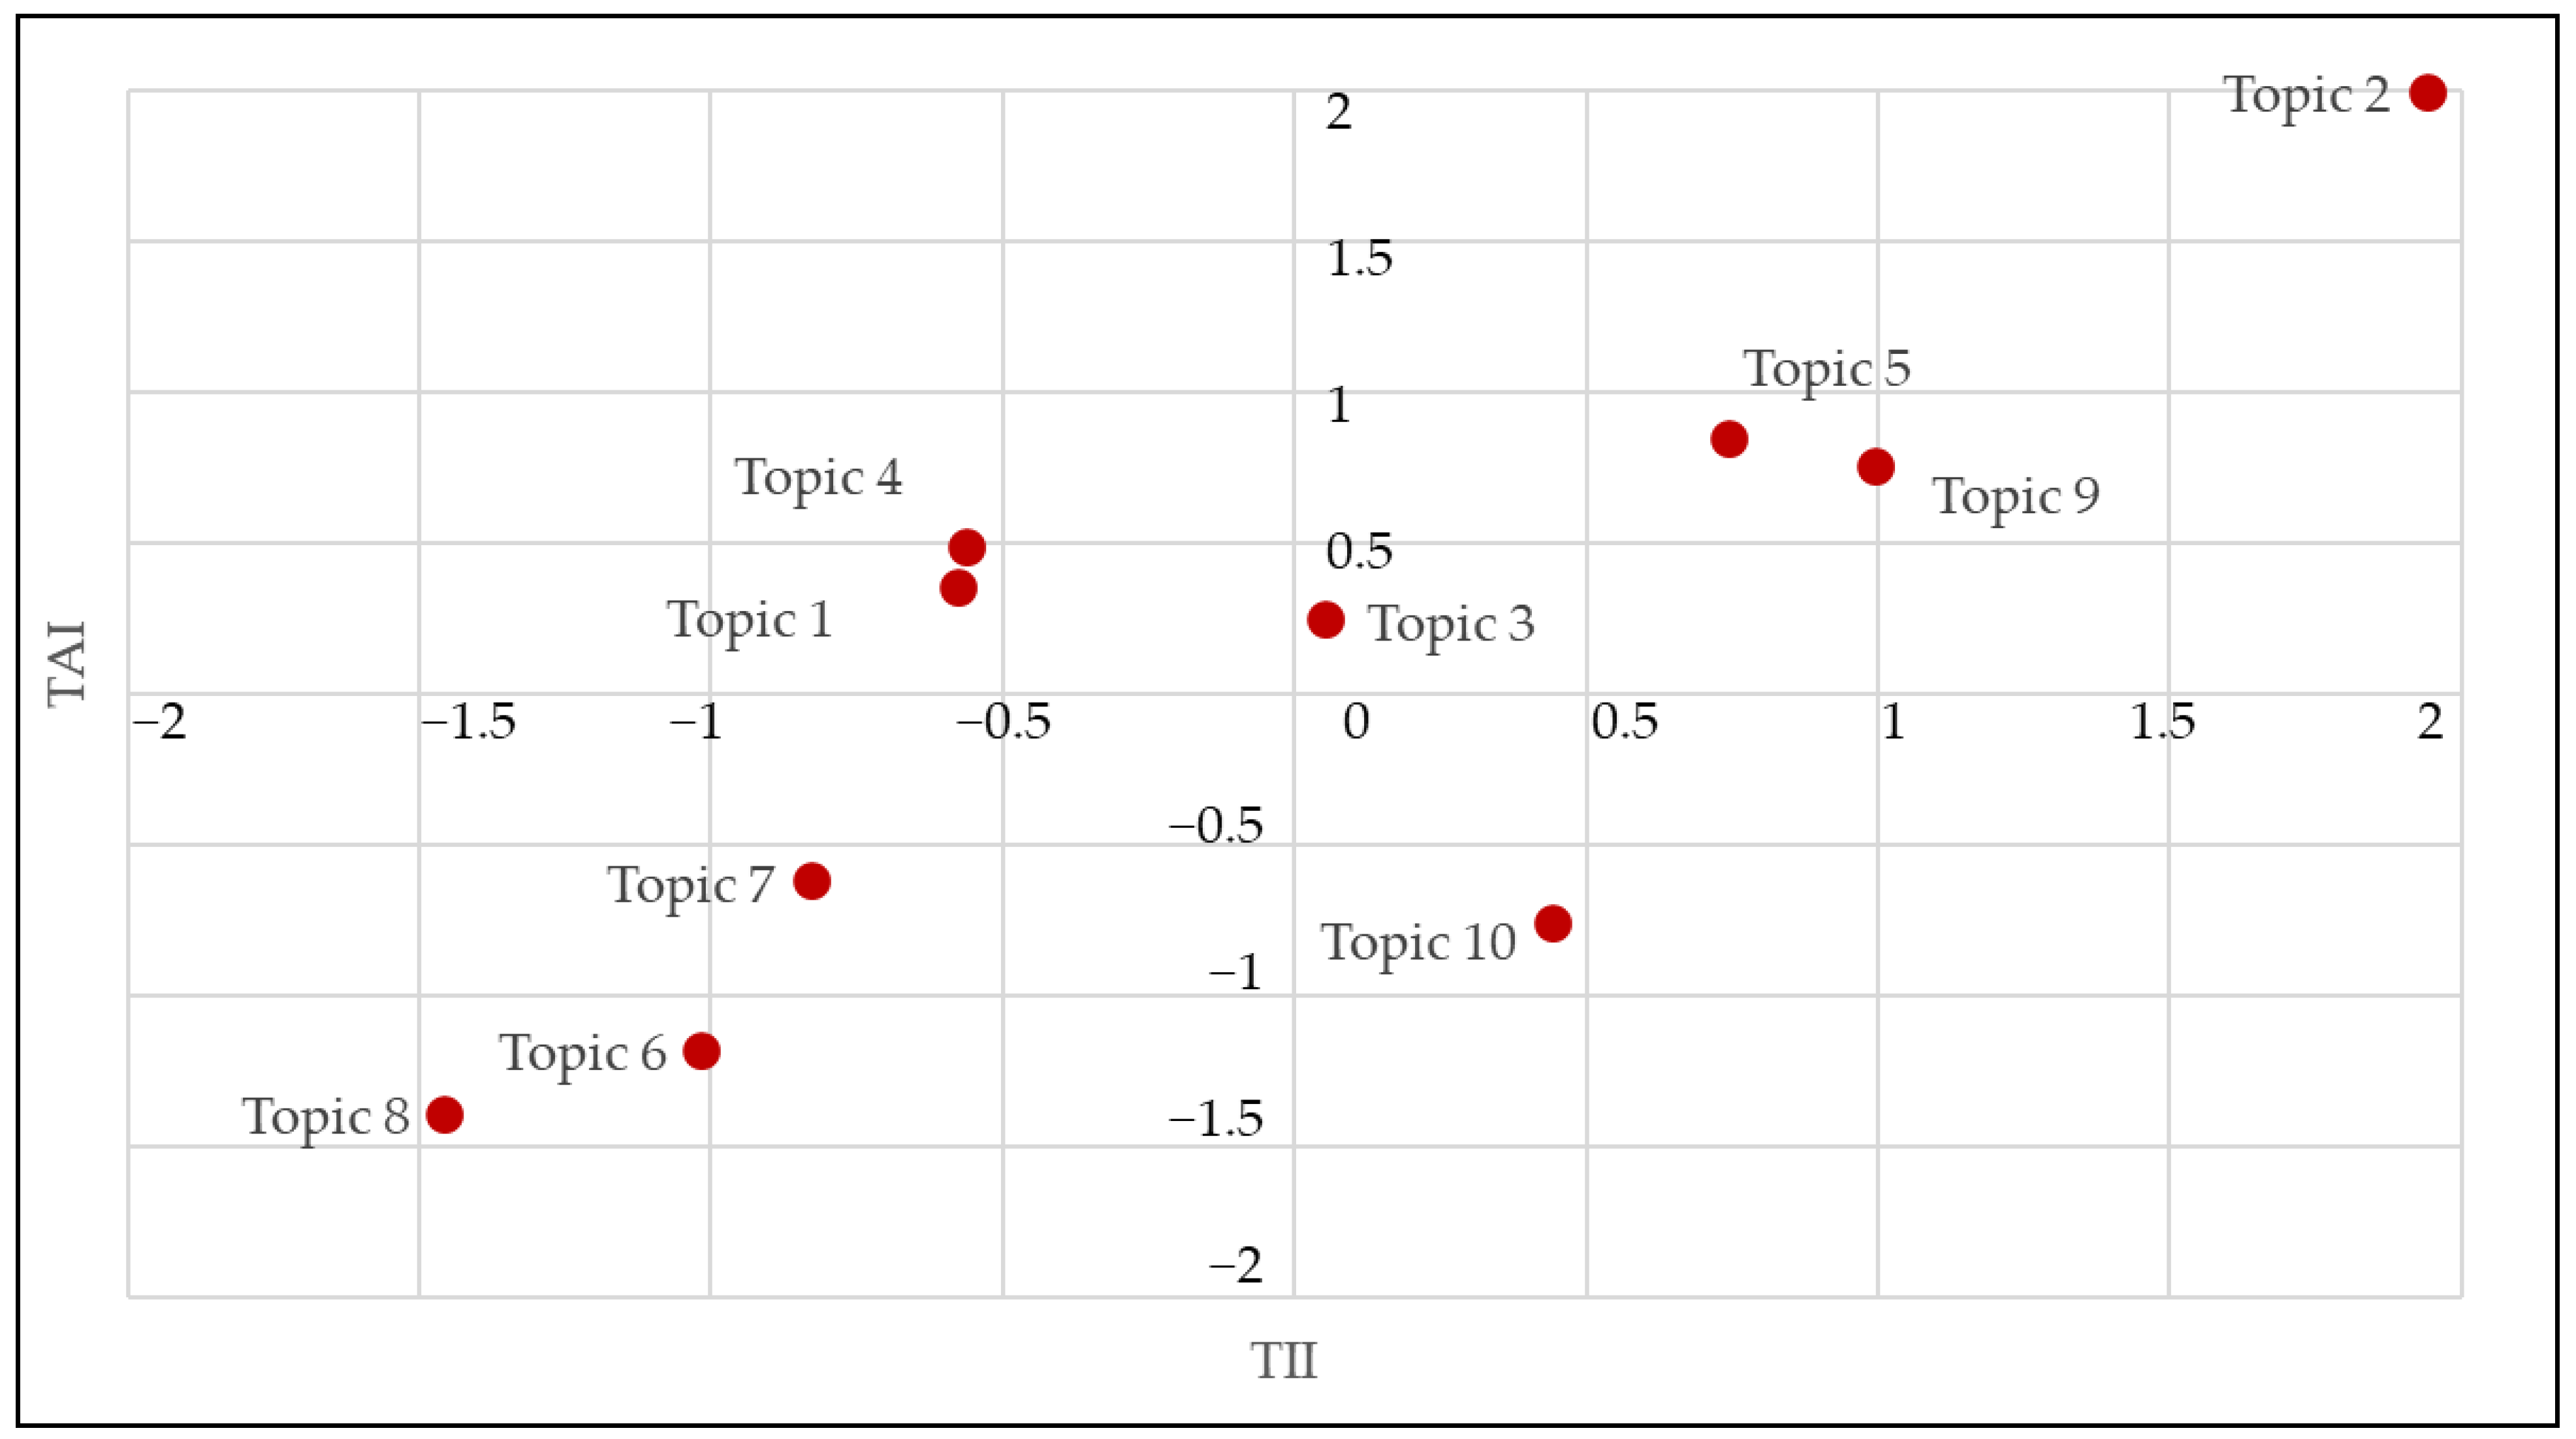
3.1. Segmentation of Smart Farm Technology

The number of clusters (K) should be determined in advance to cluster analysis. The number of clusters (K) can be determined by the complexity algorithm of the language model [28]. A lower complexity value indicates a better representation of the results of the data. When the complexity value is the lowest, the overfitting problem where the model overlearns the data occurs. Therefore, in this study, the point where the complexity value sharply decreases was determined as the number of clusters (K). Figure 4 is a graph of the complexity of the data in accordance with the different number of clusters (K). the number of clusters (K) to be used was determined by comparing the results when K was 5 and 10 where the complexity decreased rapidly. When the number of clusters (K) was smaller than five, there was a difficulty to define topics due to overlapping keywords. So, this study selected the number of clusters (K) as 10 and proceeded the analysis.
The LDA algorithm shows high frequency words per topic and patent documents belonging to that topic. Table 2 summarizes the words with high frequency for each topic that can be identified using the LDA algorithm from patent documents and the names of the topics defined based on those words.

3.2. Prioritize Technologies

Smart Farm technology was divided into 10 detailed technologies areas using LDA algorithms. Promising fields of technology should be identified in order to derive technology development roadmap for smart farm. Therefore, this study conducted importance analysis and trend analysis to confirm the potential of the technology fields.
The current levels of the 10 different technology fields of smart farms were different. As a result, uncertainty existed in developing the technology. Therefore, in the importance analysis, the current technology level in the vacant technology area was identified through technology level map utilizing the number of patent applications as a quantitative indicator and the number of patent citations as a qualitative indicator. The technology level map shows the relative level of each technology field. The results are shown in Figure 5.
There were three levels of smart farm technology. Looking at the results, Topics 2, 3, 5 and 9 were identified as high level since all indicators had positive values, and Topics 1, 4 and 10 were medium since one of the TAI and TII indicators had a positive value. And Topics 6–8 were identified as low level since all indicators were negative values.
Technology feasibility analysis is needed to confirm not only current technology level but also future prospect. Trend analysis is conducted through time series analysis to confirm the promise of future technology fields. This study identified trends by applying the ARIMA method to 10 smart farm technology fields. The ARIMA algorithm requires the definition of parameters p, d, and q, which are variables related to the order, difference, and moving average of the autoregression model. “auto.arima” function in the R programming package was applied for the parameter. To increase reliability of time series analysis, input data should be clarified. The number of patents filed by year were used for input data, since smart farms were newly developed applications of technology and most of patents have been filed since year 2000. If we input frequency data from 1974, it would influence the prediction of time series analysis, and the reliability of the prediction would be harmed. Therefore, the beginning point of input data was set as when data frequency appeared, and the ending point was set as 2019 since patents usually are opened public 18 months after filings.
Trends in smart farm technology have been classified as hot, active, and cold. The results of the trend analysis for 10 technology fields are shown in the Figure 6. Hot field with steadily increasing are Topics 1–3 and active field of continuous developments are Topics 4–8. Topic 9 shows decreasing trend.
In this study, we aimed for searching areas of promising technologies and then developing the technology development roadmaps for them. To identify the promising technology areas, the critical analysis and the trend analysis were conducted.
The criticality analysis analyzes the current technology level based on the number of patent applications and claims terms, and the trend analysis analyzes future trends based on data over time. The result drawn as “High Level” of the critical analysis mean corresponding technology is currently developed actively and is predicted to attain good technology progresses in the future [7,13]. The result drawn as “Hot Field” from the trend analysis mean corresponding technology will be developed actively in the future [14,33]. Therefore, when both “High Level” and “Hot field” are drawn from two analyses, that technology is the promising technology which being developed currently and will be developed in the future and worth to focus [14]. As the results of technology analysis (see Table 3), the priorities of 10 topics are set as follows: (Priority 1: Hot level and Hot field, Priority 2: Medium level and Hot field or High level and Active field, Priority 3: Medium level and Active field, Priority 4: Other cases).
Topics 2 and 3 were drawn as Priority 1, which means both topics are the promising technology topics of contemporary as well as future and in-depth developments should be carried. Topics 1 and 5 were drawn as Priority 2. Topic 1 has good future potentials and would be good for monitoring. When its development trends become active, it could be considered for development topic. However, Topic 5 has no future development prospect although current development is active. Topics of Priority 3 and 4 have not active current and future development activities and needs for developing the technology roadmaps are not high. Therefore, to develop smart farm technologies effectively, intensive analysis of promising technologies, which are topics 2 and 3 of priority 1, is necessary. Through subsequent analysis, we identified vacant technologies for that topic and suggest a technology development roadmap for developing them.

3.3. Identification of Vacant Technologies

The process of developing the technology development roadmap is as follows. Firstly, identification of vacant technologies from promising areas is carried. Then, a development plan for vacant technologies is performed. Vacant technologies are identified through the SOM-based patent map and related technologies of vacant technologies are verified. Therefore, this study conducted an in-depth analysis of Topics 2 and 3, which were drawn as major technical fields in the previous analysis.

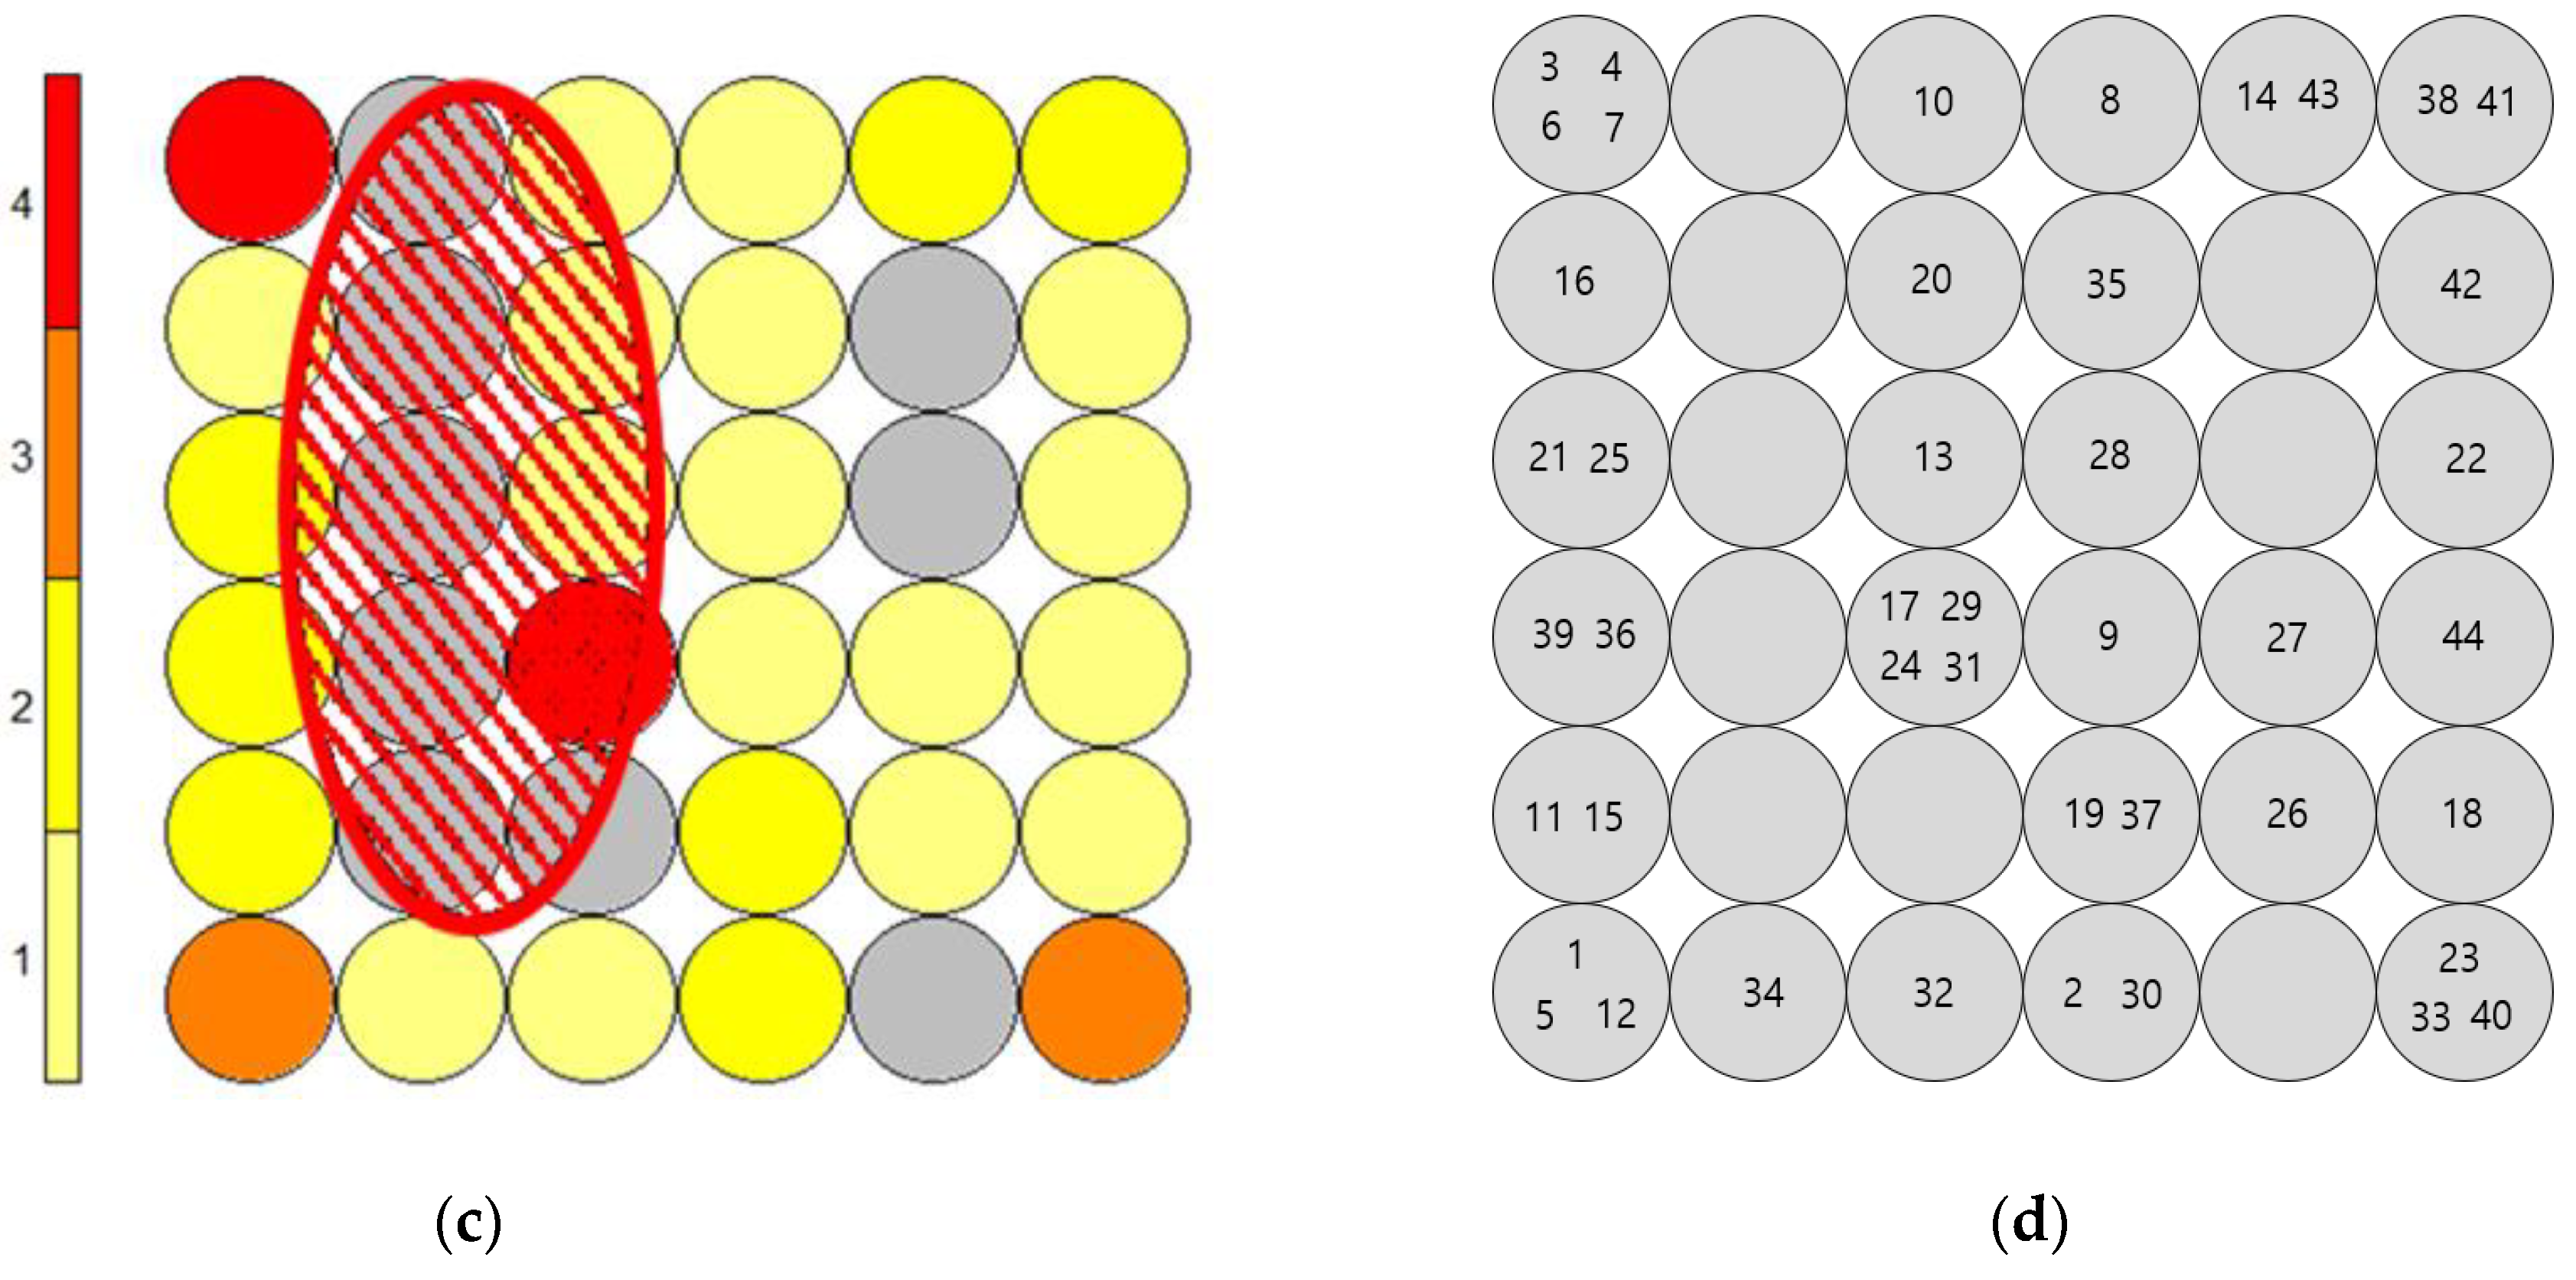
3.3.1. Design of SOM Based Patent Map

We developed a SOM-based patent map using the patent-keyword matrix to identify vacant technologies for technology development required for Topics 2 and 3 derived as promising technology areas. Before developing a SOM-based patent map, a parameter called map size should be defined. There are no rules for determining a parameter of map size. If the map size is too small, vacant nodes cannot be identified. On the other hand, if the map size is too large, there are too many vacant nodes to analyze. Therefore, a sensitivity test was performed to select the number of relevant grids by changing the map size. Since Topics 2 and 3 had 74 and 44 patents, respectively, a maximum of 6 × 6 was possible for a node to be assigned by a patent. Therefore, we performed the test with three options upon size: (1) 4 × 4, (2) 5 × 5, (3) 6 × 6. As a result, as the 4 x 4 map and the 5 × 5 map had limitations of too small patent maps which unable to detect vacant patents, so we would like to derive a vacant technology using the 6 x 6 size map.
Figure 7 shows the identification of vacant patents through the patent map using SOM and visualize two different showings for each topic; (a) and (b) are for Topic 2 and (c) and (d) are for Topic 3. (a) and (c) of Figure 7 visualize the areas of vacant nodes by different color. The nodes with gray color are vacant nodes. (b) and (d) of Figure 7 represent patents belong to nodes and numbers represent patents used for patent map analysis.
If you look at the SOM-based patent map of Topic 2, you can see that three vacant nodes are connected, and the area can be identified as the vacant technology of Topic 2. And in Topic 3, there is an area where six vacant nodes are connected, and this area can be identified as the vacant technology of Topic 3.

3.3.2. Analysis of Surrounding Nodes to Define Vacant Technologies

Topic 2 is “Real-time measurement, monitoring, and cultivation management technology using artificial intelligence and big data for the agricultural and livestock industry”, and one vacant technology area was identified by using the SOM-based patent map. There were a total of 28 patents in the surrounding nodes of the vacant technology area, and the main patents are shown in the Table 4. This vacant technology was analyzed as a technology related to building up intelligent system. In addition, Topic 3 is “Telemetry, identification, monitoring and management technologies for remote or long-distance crop growing and livestock raising”, and, as in Topic 2, one vacant technology area was identified through the SOM-based patent map. There were 26 patents in the surrounding node, and as a result of checking the contents, it was analyzed as technologies related to remote sensing and control. A technology development roadmap was to be constructed based on the vacant technology of Topics 2 and 3.

3.4. Development of Technology Roadmap

In order to build a technology roadmap for vacant technology fields, cross-specific technology analysis of the vacant technology field is required. Therefore, in this study, the relationship between specific technologies was confirmed through network analysis by utilizing the surrounding node patents of the vacant technology, and based on this, the first stage of technology roadmap was designed. Additionally, as technology convergence is taking place today, the technology convergence roadmap among vacant technologies was designed as a second stage technology roadmap.

3.4.1. Development of Technology Roadmap for Vacant Technologies

To develop a technology roadmap for developing vacant technologies, patent documents corresponding to the surrounding nodes of the vacant technology area are re-extracted, and the relationship among technologies is analyzed by performing network analysis through the simultaneous appearance matrix expressed based on the keywords of the patents. Various indicators such as degree centrality, closeness centrality, and betweenness centrality exist for quantitative network analysis. Since the network analysis of this study aims to analyze the critical technology and design a stepwise technology development roadmap for this, betweenness centrality was used for analysis. In visualizing the network, the bigger the betweenness centrality, the more visualized in red.
Figure 8 is a visualization of the results of network analysis. As a result of network analysis using the patent-keyword matrix for the vacant technology of Topic 2, the technologies such as automat, wireless, acquir, farm, and moitor were derived as major technology elements. Based on the keyword, the vacant technology was defined as “The farm automation technology that utilizes intelligently collected data in a wireless environment”. For the vacant technology of Topic 3, the technologies such as control, monitor, applic, remot, and recognit were derived as major technological elements. Based on these, we defined the vacant technology of the Topic 3 as “Recognition-based remote monitoring and control technology for the agricultural industry”.

3.4.2. Development of Technology Roadmap of Converging Vacant Technologies

At the previous network analysis, the vacant technologies for Topics 2 and 3 were named and the major technologies for developing them were identified. The technology roadmap should consider the convergence of vacant technology, as well. To design a roadmap for convergence of vacant technologies, we utilized the core keywords commonly used in Topics 2 and 3. The common keywords are 48 words in total, as shown in the Table 5.
Network analysis was performed by re-extracting the patent–keyword matrix with the corresponding core keywords and patents utilized in the defining vacant technologies of Topics 2 and 3. Figure 9 is a visualization of the results of network analysis. Technologies such as imag, process, different, quality, improv, pesticide, modul, and automat are derived from the major technology components as the result of network analysis. Based on the keyword, the convergence technology for vacant technologies was defined as “Image acquisition and analysis technology for monitoring of the growing environment of the agriculture or livestock industry”.
The smart farm technology roadmap proposed in this study consisted of two stages. Phase 1 of the technology roadmap was the development of “The farm automation technology that utilizes intelligently collected data in a wireless environment” and “Recognition-based remote monitoring and control technology for the agricultural industry”. To develop “The farm automation technology that utilizes intelligently collected data in a wireless environment”, the technology roadmap should be structured to realize automation, wireless, and monitoring functions. In addition, the roadmap should include technologies related with recognition, control, and monitoring to develop “Recognition-based remote monitoring and control technology for the agricultural industry”. Finally, these two technologies had to be fused for the advanced development of smart farm technology. For this, “Image acquisition and analysis technology for monitoring of the growing environment of the agriculture or livestock industry” should be developed as the convergence technology, and technologies related with image recognition, module, and automation should be reflected in the technology development roadmap.

4. Conclusions and Discussion

Smart farms are recognized as a technology that can overcome climatic restrictions and increase the efficiency of food production by utilizing ICT technology. It is considered as one of the more important technologies that can overcome food shortages due to climate change and reduction of agriculture population. Thus, countries around the world are developing these kinds of technologies. However, they find difficulties in selecting promising technologies needed for development. This is due to the fact that levels of key technology fields such as sensor control computing data processing that are required to implement smart farms are different and it is not easy to discover vacant technologies that fill the gabs of different levels. To overcome this, if we analyze the technologies that have already been developed, discover gaps in technology topics that need to be developed in the future, and build a roadmap, we can increase the efficiency of technology development. This paper presented a method based on patent analysis to suggest the direction of efficient technology development for smart farm automation. Based on the published patents, a key-word matrix was created using the TF-IDF method, and LDA topic modeling was conducted to derive 10 key technology topics related to smart farm automation as seen in Table 2.
To verify the result of topic modeling, the result was compared with the smart farm technology development roadmaps already developed by other institutes. Many countries such as Korea and China are interested in developing smart farm technologies and have suggested technology development roadmaps as government institutes level to stimulate developments. The 10 smart farm technology topics presented in Table 2 extracted through LDA analysis in this study contain many similar topics with the technology development topics of the smart farm technology development roadmap proposed by government agencies in Korea and China. Among the R&D topics of the smart farm technology development roadmap presented by the Korean Institute of Science and Technology Evaluation and Planning (KISTEP) in 2019, eight topics are similar with this study [10]. 2019–2021 Technology Roadmap for SME—Smart farm announced by the Korea Ministry of SMEs and Startup in 2018 contains seven similar R&D topics with this study [11]. In addition, the five topics are similar with the list of R&D topics proposed in “The Development Plan for Digital Agriculture and Rural Areas (2019–2025)” announced by the Ministry of Agriculture and Rural Affairs of China in 2019 [60]. Table 6 shows the 10 technology topics related to smart farm summarized in this study and the similarity levels of R&D topics proposed by institutions in Korea and China. KISTEP’s technology development roadmap, which was most recently announced and targeted for general smart farm technologies, matched eight out of ten technology Topics extracted from this study. This indicates that the technology Topics compiled in this study covered a good portion of general smart farm technology. The road map of the Ministry of SMEs and Startups of Korea deals with research and development topics suitable for SMEs with insufficient capital, while the R&D topic of China’s Ministry of Agriculture and Rural Affairs deals with mainly ICT-oriented R&D topics. In particular, Topics 2 and 3, which were selected as promising smart farm technologies in this study, were selected as the main topics of the smart farm R&D roadmap by all three institutions.
To verify future trends among 10 topics, ARIMA model was used for analysis. As a result, “Real-time measurement monitoring and cultivation management technology using artificial intelligence and big data” which is Topic 2 and “Remote measurement, identification, monitoring and operation technology for remote cultivation of crops and livestock” which is Topic 3 were judged to be an area where active development activities are expected. A SOM-based patent map was constructed to identify vacant technologies needed to improve the completeness of these two technical fields, and through patent map and network-based analysis. “Farm automation technology using intelligently collected data in a wireless environment” was identified as vacant technology of Topic 2 (Topic2 VT) and “Remote monitoring based on object recognition and control technology” was identified as vacant technology of Topic 3 (Topic3 VT). These vacant technologies should be reflected in the technology development roadmap as higher priority of development. “Image acquisition and analysis technology for monitoring or surveillance of the growing environment in the agricultural industry” (Topic2&3 VT), which combines two vacant technologies, should be developed as the next step.
To evaluate the results of this study, Topic2 VT, Topic3VT, and Topic2&3 VT were compared with the technology roadmaps of three institutes in Korea and China as shown in Table 7. KISTEP had two similar technology development topics, which were Topic2 VT and Topic3 VT. The roadmap of Minister of SME and Startups of Korea which represent time span 2019–2021 had one similar topic which was Topic2 VT. Ministry of Agriculture and Rural Affairs of China which covers 2019–2025 had technology development topics similar with Topic2 VT, Topic3VT and Topic2&3 VT. As technology development roadmaps cover longer time span, more vacant technologies were included in the technology development plans.
In general, the building of a technology development roadmap is conducted through extensive literature research, analysis of corporate trends, market trends, technology development trends, and applications of AHP. Therefore, this preparation requires a lot of time and efforts. The technology roadmap of KISTEP is made through AHP, and that of Minister of SME and startups are made through a literature research and expert interviews [10,11]. This study shows that quantitative analysis of published patents alone can produce results similar to existing technology development roadmaps. This is meaningful in that it opens up the possibility of saving time, effort, and cost in establishing technology development strategies in various applications in the future.
The next step of study would be applying GTM to find vacant technologies to smart farm patents. As GTM has a complementary characteristic of SOM, thereby having the possibility of checking contents in vacant nodes, it might be helpful to check and compare results.

Author Contributions

E.C. performed data curation, formal analysis, investigation, methodology, validation, and writing of the original manuscript; S.J. contributed to conceptualization, investigation, and formal analysis; C.L. contributed to conceptualization, investigation, supervision, and editing of the manuscript. All authors have read and agreed to the published version of the manuscript.

Funding

This work was supported by the National Research Foundation of Korea (NRF) grant funded by the Korea government (MSIT) (NRF-2020R1F1A1076812). This research was also supported by Brain Korea 21 FOUR.

Institutional Review Board Statement

Not applicable.

Informed Consent Statement

Not applicable.

Data Availability Statement

Not applicable.

Conflicts of Interest

The authors declare no conflict of interest.

References

  1. Caffaro, F.; Cavallo, E. The Effects of Individual Variables, Farming System Characteristics and Perceived Barriers on Actual Use of Smart Farming Technologies: Evidence from the Piedmont Region, Northwestern Italy. Agriculture 2019, 9, 111. [Google Scholar] [CrossRef] [Green Version]
  2. Caffaro, F.; Cremasco, M.M.; Roccato, M.; Cavallo, E. Drivers of farmers’ intention to adopt technological innovations in Italy: The role of information sources, perceived usefulness, and perceived ease of use. J. Rural. Stud. 2020, 76, 264–271. [Google Scholar] [CrossRef]
  3. de Clercq, M.; Vats, A.; Biel, A. Agriculture 4.0: The Future of Farming Technology. In Proceedings of the World Government Summit, Dubai, United Arab Emirates, 10 February 2018; pp. 11–13. [Google Scholar]
  4. Lezoche, M.; Hernandez, J.E.; Díaz, M.D.M.E.A.; Panetto, H.; Kacprzyk, J. Agri-food 4.0: A survey of the supply chains and technologies for the future agriculture. Comput. Ind. 2020, 117, 103187. [Google Scholar] [CrossRef]
  5. Bandara, T.M.; Mudiyanselage, W.; Raza, M. Smart Farm and Monitoring System for Measuring the Environmental Condition Using Wireless Sensor Network-IOT Technology in Farming. In Proceedings of the 2020 5th International Conference on Innovative Technologies in Intelligent Systems and Industrial Applications (CITISIA), Sydney, Australia, 25–27 November 2020; pp. 1–7. [Google Scholar]
  6. Pavón-Pulido, N.; López-Riquelme, J.A.; Torres, R.; Morais, R.; Pastor, J.A. New trends in precision agriculture: A novel cloud-based system for enabling data storage and agricultural task planning and automation. Precis. Agric. 2017, 18, 1038–1068. [Google Scholar] [CrossRef]
  7. Yoon, B.; Park, I.; Yun, D.; Park, G. Exploring Promising Vacant Technology Areas in a Technology-Oriented Company Based on Bibliometric Analysis and Visualization. Technol. Anal. Strateg. Manag. 2019, 31, 388–405. [Google Scholar] [CrossRef]
  8. Lee, W.-I. A Study on the Major Determinants for the Utilization of Technology Roadmap (TRM) in R&D Pro-ject-Focused on the Organizational Capability for the Technology Information Use. J. Inf. Manag. 2008, 39, 177–198. [Google Scholar]
  9. Lee, H.; Geum, Y. Development of the Scenario-Based Technology Roadmap Considering Layer Heterogeneity: An Approach Using CIA and AHP. Technol. Forecast. Soc. Chang. 2017, 117, 12–24. [Google Scholar] [CrossRef]
  10. Institute, KISTEP. Multi-Ministerial Development Package for Smart Farm Innovation Technology; Study Report; Korea Institute of Science and Technology Evaluation and Planning: Eumseong-gun, Korea, 2019. [Google Scholar]
  11. Agency, M.S.S. 2019–2021 SME Strategic Technology Roadmap—Smart Farm. Government; Agency Report; Republic of Korea Ministry of SMEs and Startups: Seo-gu, Korea, 2018. [Google Scholar]
  12. Ernst, H. Patent information for strategic technology management. World Pat. Inf. 2003, 25, 233–242. [Google Scholar] [CrossRef]
  13. Hwang, J.; Kim, K.; Hwang, J.; Jun, S.; Yu, J.; Lee, C. Technological Opportunity Analysis: Assistive Technology for Blind and Visually Impaired People. Sustainability 2020, 12, 8689. [Google Scholar] [CrossRef]
  14. Jun, S.; Han, S.H.; Yu, J.; Hwang, J.; Kim, S.; Lee, C. Identification of Promising Vacant Technologies for the Development of Truck on Freight Train Transportation Systems. Appl. Sci. 2021, 11, 499. [Google Scholar] [CrossRef]
  15. Ernst, H. The Use of Patent Data for Technological Forecasting: The Diffusion of CNC-Technology in the Machine Tool Industry. Small Bus. Econ. 1997, 9, 361–381. [Google Scholar] [CrossRef]
  16. Park, Y.; Yoon, B.; Lee, S. The Idiosyncrasy and Dynamism of Technological Innovation across Industries: Patent Ci-tation Analysis. Technol. Soc. 2005, 27, 471–485. [Google Scholar] [CrossRef]
  17. Lee, S.; Lee, S.; Seol, H.; Park, Y. Using Patent Information for Designing New Product and Technology: Keyword Based Technology Roadmapping. Rd Manag. 2008, 38, 169–188. [Google Scholar] [CrossRef]
  18. Kim, J.; Lee, S. Patent databases for innovation studies: A comparative analysis of USPTO, EPO, JPO and KIPO. Technol. Forecast. Soc. Chang. 2015, 92, 332–345. [Google Scholar] [CrossRef]
  19. Lee, S.; Yoon, B.; Park, Y. An Approach to Discovering New Technology Opportunities: Keyword-Based Patent Map Approach. Technovation 2009, 29, 481–497. [Google Scholar] [CrossRef]
  20. Singh, T.; Kumari, M. Role of Text Pre-processing in Twitter Sentiment Analysis. Procedia Comput. Sci. 2016, 89, 549–554. [Google Scholar] [CrossRef] [Green Version]
  21. Haddi, E.; Liu, X.; Shi, Y. The Role of Text Pre-processing in Sentiment Analysis. Procedia Comput. Sci. 2013, 17, 26–32. [Google Scholar] [CrossRef] [Green Version]
  22. Hassler, M.; Fliedl, G. Text Preparation through Extended Tokenization. In WIT Transactions on Information and Communication Technologies; WIT Press: Southampton, UK, 2006; Volume 37. [Google Scholar]
  23. Kim, K.H.; Han, Y.J.; Lee, S.; Cho, S.W.; Lee, C. Text Mining for Patent Analysis to Forecast Emerging Technologies in Wireless Power Transfer. Sustainability 2019, 11, 6240. [Google Scholar] [CrossRef] [Green Version]
  24. Wu, H.C.; Luk, R.; Wong, K.F.; Kwok, K.L. Interpreting TF-IDF term weights as making relevance decisions. ACM Trans. Inf. Syst. 2008, 26, 1–37. [Google Scholar] [CrossRef]
  25. Yun-Tao, Z.; Ling, G.; Yong-Cheng, W. An Improved TF-IDF Approach for Text Classification. J. Zhejiang Univ. Sci. A. 2005, 6, 49–55. [Google Scholar]
  26. Chen, Q.; Yao, L.; Yang, J. Short text classification based on LDA topic model. In Proceedings of the 2016 International Conference on Audio, Language and Image Processing (ICALIP), Shanghai, China, 11–12 July 2016; pp. 749–753. [Google Scholar]
  27. Tong, Z.; Zhang, H. A Text Mining Research Based on LDA Topic Modelling. In Proceedings of the Computer Science & Information Technology (CS & IT), Vienna, Austria, 21–22 May 2016; pp. 201–210. [Google Scholar]
  28. Eum, S.; Lee, S.; Meng, X.; Cho, S.W.; Lee, C. Analysis of Research Trends of Wireless Power Transfer System for Locomotives Using Topic Modeling Based on LDA Algorithm. J. Korean Inst. Ind. Eng. 2019, 45, 284–301. [Google Scholar]
  29. Yoon, B.; Phaal, R. Structuring technological information for technology roadmapping: Data mining approach. Technol. Anal. Strat. Manag. 2013, 25, 1119–1137. [Google Scholar] [CrossRef] [Green Version]
  30. Joung, J.; Kim, K. Monitoring emerging technologies for technology planning using technical keyword based analysis from patent data. Technol. Forecast. Soc. Chang. 2017, 114, 281–292. [Google Scholar] [CrossRef]
  31. Kürtössy, J. Innovation Indicators Derived from Patent Data. Period. Polytech. Soc. Manag. Sci. 2004, 12, 91–101. [Google Scholar]
  32. Yu, J.; Hwang, J.-G.; Hwang, J.; Jun, S.; Kang, S.; Lee, C.; Kim, H. Identification of Vacant and Emerging Technologies in Smart Mobility Through the GTM-Based Patent Map Development. Sustainability 2020, 12, 9310. [Google Scholar] [CrossRef]
  33. Harvey, A.C.; Fernandes, C. Time Series Models for Count or Qualitative Observations. J. Bus. Econ. Stat. 1989, 7, 407–417. [Google Scholar]
  34. Chen, R. Design patent map visualization display. Expert Syst. Appl. 2009, 36, 12362–12374. [Google Scholar] [CrossRef]
  35. Liu, S.-J. Patent Map–a Route to a Strategic Intelligence of Industrial Competitiveness. In Proceedings of the first Asia-Pacific Conference on Patent Maps, Taipei Taiwan, 29 October 2003; pp. 2–13. [Google Scholar]
  36. Kostoff, R.N.; Schaller, R.R. Science and technology roadmaps. IEEE Trans. Eng. Manag. 2001, 48, 132–143. [Google Scholar] [CrossRef] [Green Version]
  37. Yoon, B.; Yoon, C.; Park, Y. On the Development and Application of a Self–Organizing Feature Map–Based Patent Map. RD Manag. 2002, 32, 291–300. [Google Scholar] [CrossRef]
  38. Tseng, Y.-H.; Lin, C.-J.; Lin, Y.-I. Text mining techniques for patent analysis. Inf. Process. Manag. 2007, 43, 1216–1247. [Google Scholar] [CrossRef]
  39. Tseng, Y.-H. Text Mining for Patent Map Analysis. Catalysts 2005, 5424054, 6333016. [Google Scholar]
  40. Johnson, R.A.; Wichern, D.W. Applied Multivariate Statistical Analysis; Pearson: London, UK, 2014; Volume 6. [Google Scholar]
  41. Bishop, C.M.; Svensén, M.; Williams, C.K.I. GTM: The Generative Topographic Mapping. Neural Comput. 1998, 10, 215–234. [Google Scholar] [CrossRef]
  42. Deboeck, G.; Kohonen, T. Visual Explorations in Finance: With Self-Organizing Maps; Springer Science & Business Media: Heidelberg, Germany, 2013; ISBN 1447139135. [Google Scholar]
  43. van Hulle, M.M. Self-Organizing Maps; Springer: Berlin, Germany, 2012. [Google Scholar]
  44. Hanneman, R.A.; Riddle, M. Introduction to Social Network Methods; University of California: Riverside, CA, USA, 2005. [Google Scholar]
  45. Freeman, L.C. Visualizing Social Networks. J. Soc. Struct. 2000, 1, 4. [Google Scholar]
  46. Borgatti, S.P.; Mehra, A.; Brass, D.J.; Labianca, G. Network Analysis in the Social Sciences. Science 2009, 323, 892–895. [Google Scholar] [CrossRef] [Green Version]
  47. Hung, S.-W.; Wang, A.-P. Examining the small world phenomenon in the patent citation network: A case study of the radio frequency identification (RFID) network. Science 2010, 82, 121–134. [Google Scholar] [CrossRef]
  48. Lee, H.; Kim, C.; Cho, H.; Park, Y. An ANP-based technology network for identification of core technologies: A case of telecommunication technologies. Expert Syst. Appl. 2009, 36, 894–908. [Google Scholar] [CrossRef]
  49. Maind, S.B.; Wankar, P. Research Paper on Basic of Artificial Neural Network. Int. J. Recent. Novation Trends Comput. Commun. 2014, 2, 96–100. [Google Scholar]
  50. Uzzi, B.; Dunlap, S. How to Build Your Network. Harv. Bus. Rev. 2005, 83, 53. [Google Scholar] [PubMed]
  51. Yoon, B.; Park, Y. A text-mining-based patent network: Analytical tool for high-technology trend. J. High Technol. Manag. Res. 2004, 15, 37–50. [Google Scholar] [CrossRef]
  52. Choi, J.; Hwang, Y.-S. Patent keyword network analysis for improving technology development efficiency. Technol. Forecast. Soc. Chang. 2014, 83, 170–182. [Google Scholar] [CrossRef]
  53. Lai, K.-K.; Wu, S.-J. Using the patent co-citation approach to establish a new patent classification system. Inf. Process. Manag. 2005, 41, 313–330. [Google Scholar] [CrossRef]
  54. Breschi, S.; Lissoni, F. Knowledge Networks from Patent Data. In Handbook of Quantitative Science and Technology Research; Springer Science and Business Media LLC: Berlin, Germany, 2004; pp. 613–643. [Google Scholar]
  55. Yoon, B.; Park, Y. Development of New Technology Forecasting Algorithm: Hybrid Approach for Morphology Analysis and Conjoint Analysis of Patent Information. IEEE Trans. Eng. Manag. 2007, 54, 588–599. [Google Scholar] [CrossRef]
  56. Hsueh, C.-C.; Wang, C.-C. The Use of Social Network Analysis in Knowledge Diffusion Research from Patent Data. In Proceedings of the 2009 International Conference on Advances in Social Network Analysis and Mining, Athens, Greece, 20–22 July 2009; pp. 393–398. [Google Scholar]
  57. Butts, C.T. Social Network Analysis with Sna. J. Stat. Softw. 2008, 24, 1–51. [Google Scholar] [CrossRef]
  58. Cho, Y.; Hwang, J.; Lee, D. Identification of effective opinion leaders in the diffusion of technological innovation: A social network approach. Technol. Forecast. Soc. Chang. 2012, 79, 97–106. [Google Scholar] [CrossRef]
  59. Park, Y.-N.; Lee, Y.-S.; Kim, J.-J.; Lee, T.S. The structure and knowledge flow of building information modeling based on patent citation network analysis. Autom. Constr. 2018, 87, 215–224. [Google Scholar] [CrossRef]
  60. Agency, M.A.R. Development Plan for Digital Agriculture and Rural Areas (2019–2025); Government Agency Report; People’s Republic of China Ministry of Agriculture and Rural Affairs: Beijing China, 2019. [Google Scholar]
Figure 1. Overall framework.
Sustainability 13 10709 g001
Figure 2. Technology level map.
Sustainability 13 10709 g002
Figure 3. Technology level map.
Sustainability 13 10709 g003
Figure 4. Plot for optimal K (Number of topics).
Sustainability 13 10709 g004
Figure 5. Result of criticality analysis using technology level map.
Sustainability 13 10709 g005
Figure 6. Result of trend analysis using time series analysis.
Sustainability 13 10709 g006aSustainability 13 10709 g006b
Figure 7. SOM based patent map: (a) Topic 2′s patent map; (b) details of the topic 2′s patent map; (c) topic 2′s patent map; and (d) details of the topic 2′s patent map.
Sustainability 13 10709 g007aSustainability 13 10709 g007b
Figure 8. Results of the keyword network analysis: (a) Topic 2′s vacant technology; (b) Topic 3′s vacant technology.
Sustainability 13 10709 g008
Figure 9. Results of the keyword network analysis: fusion technology.
Sustainability 13 10709 g009
Table 1. The format of the Patent-keyword matrix (436 × 200).
ControlGreenhousSprayStorag Mobil
Patent 10100 0
Patent 20010 0
Patent 30010 1
Patent 40010 0
Patent 4361000 0
Table 2. Results of topic modeling.
TopicDefine and Keyword
Topic 1Irrigation and spray control technologies for agricultural liquids (water, pesticides, fertilizers, etc)
spray, pipe, liquid, control, agricultur, irrig, feed, sprayer, telescop, machin, pollen, convey, storag, rotat, branch, highpressur, automat, work, motion, mist, injector, fruit, stir, insecticid, auxiliari, sensor, camera, pollin, fluidic, farmland
Topic 2Real-time measurement, monitoring, and cultivation management technology using artificial intelligence and big data for the agricultural and livestock industry
monitor, control, agricultur, intellig, center, realtim, cloud, wireless, acquisit, remot, acquir, transmiss, mobil, sensor, automat, breed, farm, humid, storag, spray, applic, feedback, camera, isol, irrig, work, farmland, nutrient, insect, condit
Topic 3Telemetry, identification, monitoring and management technologies for remote or long-distance crop growing and livestock raising
agricultur, cultiv, applic, remot, control, automat, intellig, farmland, acquisit, livestock, traceabl, monitor, mobil, interpret, classifi, satellit, aerial, work, fruit, identifi, strawberri, seedl, form, insect, gps, classif, sensor, storag, condit, wireless
Topic 4Environmental management and irrigation-related automation technology for greenhouses
control, greenhous, irrig, intellig, agricultur, automat, pipelin, monitor, storag, moistur, spray, humid, work, condit, sensor, transmiss, farmland, realtim, gas, supplement, applic, light, reservoir, pipe, switch, shed, cabinet, mudflat, coordin, infrar
Topic 5Object (livestock poultry, etc.) monitoring and automation technology for breeding and reproduction of livestock and fish
control, feed, breed, monitor, farm, automat, intellig, livestock, sensor, alarm, rfid, aquacultur, tag, cultiv, oestrus, realtim, condit, fish, identifi, intak, acquisit, disinfect, panel, submergedtyp, work, switch, compost, spray, liquid, pickup
Topic 6Monitoring and control technology for the environment management such as temper-ature, humidity, gases, etc
monitor, sensor, agricultur, control, storag, humid, fish, acquir, gas, recognit, realtim, cloud, onlin, automat, bee, forecast, traceabl, honeycomb, transduc, chromosom, nest, intellig, condit, strawberri, humitur, pipelin, nondestruct, primer, machin, form
Topic 7Technology to increase the efficiency of crop cultivation in greenhouses
cultiv, greenhous, seedl, fruit, agricultur, nutrient, solar, earthworm, root, threedimension, control, breed, light, supplement, mulch, photovolta, soilless, accumul, ferment, sunlight, panel, beef, mutton, insect, polygonum, fish, mushroom, border, form, framework
Topic 8Optical-based agricultural and livestock measurement and monitoring technology
light, monitor, spectral, remot, alarm, spectrum, agricultur, flight, vehicl, acquir, aerial, atmospher, aerat, spectromet, analyz, phenolog, realtim, form, solar, laser, microcomput, fluoresc, amplifi, resistor, automat, virtual, radiat, control, decisionmak, nondestruct
Topic 9Technology related to the mechanization of harvesting and processing strawwood (rice, wheat, barley, etc.)
straw, wheel, agricultur, convey, feed, machin, rotat, automat, roller, transmiss, gear, work, fuel, pulver, interv, storag, form, pipe, weld, manufactur, stir, cultiv, applic, herbac, light, speed, flexibl, briquet, load, vertic
Topic 10Mechanization and automation technology related to seedling transplantation or planting
machin, control, agricultur, seedl, hydraul, work, wheel, farm, spiral, rotat, speed, plough, pipe, grass, cultiv, vehicl, steer, automat, fan, subsoil, farmland, applic, condit, agv, highspe, transmiss, axi, clodcrush, plow, selfdriven
Table 3. Summary of technical analysis in the topics.
TopicCriticality AnalysisTrend AnalysisPriority
Topic 1Medium LevelHot Field2
Topic 2High LevelHot Field1
Topic 3High LevelHot Field1
Topic 4Medium LevelActive Field3
Topic 5High LevelActive Field2
Topic 6Low LevelActive Field4
Topic 7Low LevelActive Field4
Topic 8Low LevelActive Field4
Topic 9High LevelActive Field2
Topic 10Medium LevelActive Field3
Table 4. Key patents for vacant technology by topic.
TopicPatent
Topic 2Cloud edge collaborative platform architecture for watershed water environment ecological intelligent management
Crop growth monitoring method and system based on big data and cloud computing
Intelligent monitoring system for sewage discharge of pig breeding industry
Medium Level
Cow fine breeding method based on RFID technology
Movable intelligent precision farming system
Topic 3Crop interpretation method and system based on RapidEye satellite remote sensing image
A method for accurately verifying and protecting agricultural insurance based on remote sensing data and digital field
Smart tobacco planting management system based on Internet of Things
Slope farmland extracting method and system based on high-resolution remote sensing image
A method for accurately settling agricultural disaster claim based on remote sensing data and digital field
Table 5. Common keywords list.
Common Keyword List
accordacquisitagriculturapplicautomat
differdischargdiseasdrivefeed
improvintegrinternetlivestockmachin
pesticidplantpositprocessproduct
remotsafetisamplsenssensor
collectconnectcontrolcropfertil
managfixgreenhousimagmonitor
protectmechanmodultechnicrelat
servicqualitireducstoragtechnolog
traceutilveget
Table 6. Similarity comparison between the result of this study’s topic modeling and technology development roadmaps of three different institutes of Korea and China.
AgencyKISTEPMinister of SME and Startups, KoreaMinistry of Agriculture and Rural Affairs, China
Smart Farm Innovative Technology Development for Multiple Ministry Departments
KISTEP
Smart Farm Technology Roadmap for SME
Minister of SME and Startups, Korea
The Development Plan for Digital Agriculture and Rural Areas,
Ministry of Agriculture and Rural Affairs, China
Topic 1VV
Topic 2VVV
Topic 3VVV
Topic 4VV
Topic 5V V
Topic 6VVV
Topic 7V
Topic 8 VV
Topic 9 V
Topic 10V
Table 7. Similarity comparison between the result of this study’s vacant technologies identifications and technology development roadmaps of three different institutes of Korea and China.
AgencyKISTEPMinister of SME and Startups, KoreaMinistry of Agriculture and Rural Affairs, China
Smart Farm Innovative Technology Development for Multiple Ministry Departments
KISTEP
Smart Farm Technology Roadmap for SME
Minister of SME and Startups, Korea
The Development Plan for Digital Agriculture and Rural Areas,
Ministry of Agriculture and Rural Affairs, China
Topic 2 VTVVV
Topic 3 VTV V
Topic 2 & 3 VT V
Publisher’s Note: MDPI stays neutral with regard to jurisdictional claims in published maps and institutional affiliations.

