Article

Which CSR Activities Are Preferred by Local Community Residents? Conjoint and Cluster Analyses

by
Siraprapa Panthong
and
Viriya Taecharungroj
*
Business Administration Division, Mahidol University International College, Nakhon Pathom 73170, Thailand
*
Author to whom correspondence should be addressed.
Sustainability 2021, 13(19), 10683; https://doi.org/10.3390/su131910683
Submission received: 29 August 2021 / Revised: 24 September 2021 / Accepted: 24 September 2021 / Published: 26 September 2021

Abstract

:
Industrial estates (IEs) are important for economic growth, but they also negatively impact the living environment of local communities. To foster community acceptance, IEs and companies often implement corporate social responsibility (CSR) programs. However, very few studies have explored the preferences of local communities. Therefore, the first objective of this research was to identify the CSR dimensions and activities preferred by local communities surrounding Amata City Industrial Estate in Chonburi, Thailand, while the second objective was to categorize residents based on their CSR preferences using K-means clustering. Data were collected from 309 residents and assessed using a choice-based conjoint analysis, with the two most preferred CSR dimensions identified as economy and environment. The results confirmed heterogeneity within a community. Seven segments were identified as wellness enthusiasts, sustainable developers, knowledge supporters, balanced conservators, nature lovers, utilitarian developers and economic persons. The findings should be beneficial for IE management in Thailand and could be used by companies and local governments to initiate citizen-centric CSR activities.

1. Introduction

Industrial estates (IEs) generate income and gross domestic product (GDP) for countries. Economic activities in industrial estates provide employment to increase production capacity and exports, while improving public infrastructure. However, manufacturing, transportation, and construction activities in industrial estates increase energy consumption, exacerbate pollution, and negatively impact the living environment as well as the health and safety of the surrounding local communities [1]. Acceptance and trust by the local communities are challenged [2] and conflicting interests also occur. Local people are also concerned about potential threats to the loss of cultural resources, whereas the government or others embraced industrial development due to job creation [3].
Several studies have investigated the relationships between industrial manufacturers and community acceptance. The results have shown that distribution of fairness and community responsibility were crucial factors for building trust and acceptance among the local population, especially for companies with high negative impacts on the environment and society [4,5]. To espouse fairness and community values, companies often undertake corporate social responsibility (CSR) to benefit the society by promoting environmental protection activities through educational, social, and cultural support [2,6,7]. It would be beneficial if industrial estates understood the preferences of local communities toward their CSR activities; however, this aspect has been scarcely researched and explored.
The purpose of this study was to identify the CSR dimensions and activities preferred by local community residents who lived within 5 km of the Amata City Industrial Estate in Chonburi, Thailand. The data were collected from 309 participants with various genders, ages, education levels, occupations, and incomes. Amata City is a good study area as it has the largest IE in Thailand, an area of 24.9 sq km, and is part of the Eastern Economic Corridor (EEC), one of Thailand’s national economic strategies [8]. A choice-based conjoint (CBC) methodology was applied to determine the preferences of the local residents. As a second objective, this research elucidated the grouping of residents based on their preferences. A K-means cluster analysis was performed to identify distinct segments of residents.
This research contributes to the body of knowledge concerning CSR by providing an alternative citizen-centric approach, utilizing conjoint and cluster analyses to investigate the preference of the local community. The results of the conjoint analysis can be used to support companies, the Industrial Estate Authority of Thailand (IEAT), or local government to optimize their approach to initiate preferred CSR activities and improve local community well-being. Further, the cluster analysis helps to illuminate the divergent preferences of residents in the same community. In the next section, we review relevant literature followed by sections on the methodology, findings, and discussion.

2. Literature Review

2.1. Industrial Estates and Their Externalities

Industrial estates (IEs) contribute to countries’ economic activities [9], and also raise the social well-being of people living nearby, especially regarding public safety, family life, and public utilities [10]. IEs foster economic growth by attracting foreign direct investment (FDI) and multinational companies [11]. IEs also enhance urbanization through employment opportunities and accelerate population migration from rural areas [12], with a shift in local occupations from agricultural to industrial sectors [13]. The expanding population generated by IEs increases housing demand and the need for urban development projects and neighborhood amenities such as shopping malls, restaurants, banks, security, as well as health and educational institutions. As a case in point, Amata Corporation promoted its two IEs in Rayong and Chonburi as the “Perfect City” and emphasized the plethora of amenities including 24-hour hospitals, greenery, bird park, childcare services, and arts and culture, all sponsored by the Amata Foundation that cares for human needs [11].
However, the rise of IEs and urbanization in developing counties also has negative impacts on natural resources [14]. The development of cities increases pollution with more energy consumption, waste disposal, and water effluent discharge [15], causing contamination of water, soil, and air [16]. IEs increase environmental pollution with unhealthy social conditions for those living nearby [17,18]. For example, the rapid development of industrial parks in the Tianjin Economic Development Area (China) and Burnside Industrial Park (Canada) have generated several problems including intensive resource consumption, unmanaged environmental pollution, and mushrooming waste gas emissions [19]. Similarly, an industrial estate in Oluyole has generated water pollution, with release of waste from factory operations to the local community [20]. Disregarding these environmental concerns leads to distress and conflict [14,21]. As well as these negative externalities of industrial estates on the environment, several social problems also occur. One study has indicated that the negative impacts of industrial estates on socioeconomic conditions include chronic poverty, human rights abuses, and crime [16].

2.2. Industrial Estate Development in Thailand and Community Acceptance

IEs in Thailand also confront many challenges from the local communities. Some residents support IEs, while others vehemently oppose them. Residents who have supported industrial development perceived that IEs provided job opportunities, generated income, and enhanced education [22]. However, protesters have raised concerns about negative impacts on the environment, health, safety and other social issues. Local perceptions of the performance of four eco-industrial estates Bang Phli, Gateway City, Map Ta Phut, and Samut Sakhon showed that communities were concerned about air pollution, water pollution, dust, odors, and noise [23]. Research revealed that many factories and facilities in Map Ta Phut Industrial Estate in Rayong polluted the area, caused industrial accidents, and negatively impacted the health of residents in the surrounding communities [1]. These complaints were common in many IE projects such as the Doi Lor Community in Chiang Mai Province [24], the Bunrueang Community [25] in Chiang Rai Province, and the Jana District [26,27]. To ameliorate conflict, IEs need to gain acceptance from the local communities and residents.
IEs need to gain communities’ acceptance of their license to operate. A community refers to a collective group of people with networks and relationships who live in a territorial area, such as a neighborhood, a town, or a city [28]. A sense of community is defined as the invisible touch that connects people and describes the relationships of a person with the community [29]. The sense of community that welcomes a person into the fold is referred to as social acceptance, while social rejection is the act/intention of expelling a person or an entity from the community [30]. Offensive actions of IEs from the perspective of the local community, such as unethical treatment of operations and negligence to address negative impacts on the neighboring areas resulted in social rejection. The establishment of shared values between companies and interest groups is vital to recognize mutual benefits and build trust and acceptance [31].
A common approach by firms to improve community acceptance is the establishment of CSR activities to enhance the relationship between companies and the community by improving their well-being [6]. CSR activities can also raise corporate profits for shareholders [32].

2.3. Dimensions of Corporate Social Responsibility (CSR)

CSR has been conceptualized using several frameworks and lenses encompassing business ethics, stakeholder engagement, sustainability, corporate citizenship, conscious capitalism, and shared values [33]. Among these, the three common elements are value, balance, and accountability. CSR creates net values to improve the general welfare of society through a balance of stakeholder interests and expectations to display company accountability for business practices, policies, and processes [34]. CSR can be regarded as a moral act, whereby management includes associated stakeholders into business considerations and responds appropriately for the mutual benefit of both the company and the stakeholders (Freeman, as cited in Virakul et al. [35]). CSR activities allow companies to demonstrate social responsibility [36], and build trust with stakeholders [37]. The community-based Eco-Industrial Estates (EIE) framework suggests that community involvement is key to successfully identify mutual benefits through the creation of trust among industrial estates and local communities [31]. Social expectation drives the significance of CSR that is viewed as a tool to reduce and mitigate industrial harms and provide public welfare to the society [38].
However, the needs and beliefs of stakeholders are often diverse and distinct [39,40,41]. Thus, organizations must first determine the dimensions of CSR activities expected from their stakeholders [42].
There are several dimensions of CSR activities. To plan and implement CSR activities, companies adopt guidelines from international organizations such as the UN Global Compact or Sustainable Development Goals (SDGs), the Global Reporting Initiative (GRI), the International Organization for Standardization (ISO), the Dow Jones Sustainable Development (DJSI), and the FTSE4Good Index Series [43]. Most of these institutions and studies commonly assess three aspects of sustainable development as the environment, society, and economy—commonly referred to as the triple bottom line [44]. However, a more profound investigation into the common practices initiated by companies revealed more than these three dimensions. This research categorized CSR activities into six dimensions: economy, education, environment, health and safety, infrastructure, and social and culture.
The educational dimension addresses and enhances educational opportunities [45] for communities. Examples of CSR activities in this dimension are scholarships, training, and school construction and development [6,7]. The economic dimension refers to activities that improve employment, jobs, and income of local communities such as occupational development programs, contract farming, and local economic development [45]. The environmental dimension refers to activities that improve and preserve natural resources [46]. Examples of CSR activities in the health and safety dimension are illness prevention campaigns, improvement of people’s well-being [6], organ donation campaigns, and fundraising for hospitals [7]. The infrastructure dimension refers to programs that support the physical quality of living such as power supply enhancement and water accessibility and housing campaigns for disaster victims and underprivileged people [7], while the sociocultural dimension refers to activities that address specific community issues [7] such as cultural support, community intuitions support, youth, arts, religious supports, and welfare [6,45,47]. Table 1 summarizes the key literature encompassing all six dimensions.
However, despite the many economic benefits of industrial estates, concerns about the negative externalities such as environmental degradation, community health and safety, and loss of cultural resources still exist [1,3,17,18]. CSR can be viewed as a mediating role for companies [36] to manifest societal values and accountabilities, balance stakeholder interests, and regain trust from the community [34]. Many studies have emphasized the importance of local communities (e.g., Chapple and Moon [45] and Srisuphaolarn [7]) but very few studies have investigated the preferred CSR activities of local residents (e.g., van Hierden [48]). This limited understanding of CSR preferences presents the research gap that this study fills by answering the research question “What are the preferred CSR dimensions of residents living in the vicinity of IEs?”

3. Materials and Methods

The research methodology comprised three approaches to identify the preferences of people toward CSR dimensions as content analysis, choice-based conjoint analysis (CBA), and cluster analysis. The main analytical tool was a conjoint analysis indicating “levels” of CSR activities for respondents to select. Content analysis of existing CSR activities by firms in Thailand was performed to specify the levels in the conjoint analysis.

3.1. Levels of CSR Dimensions Using Content Analysis

A content analysis was applied to explore and understand possible CSR activities (levels) in each dimension. Sustainability reports in 2019 of 20 industrial-related companies listed in the SET50 were analyzed to categorize the types of CSR activity into six dimensions. The results, shown in Table 2, separated the CSR activities into three levels. The first level signified that the CSR activity was not present, the second indicated that the firm provided knowledge support for the CSR dimension, while the third, as the highest level, showed substantial company commitment by providing capital and resources for activity improvement. Examples include a plantation and conservation project (environment), occupational support (economy), a mobile health check-up and clinic (health), school facilities improvement (education), sponsoring a religious activity (culture), and public utility development (infrastructure). These levels form the central part of the subsequent conjoint analysis.

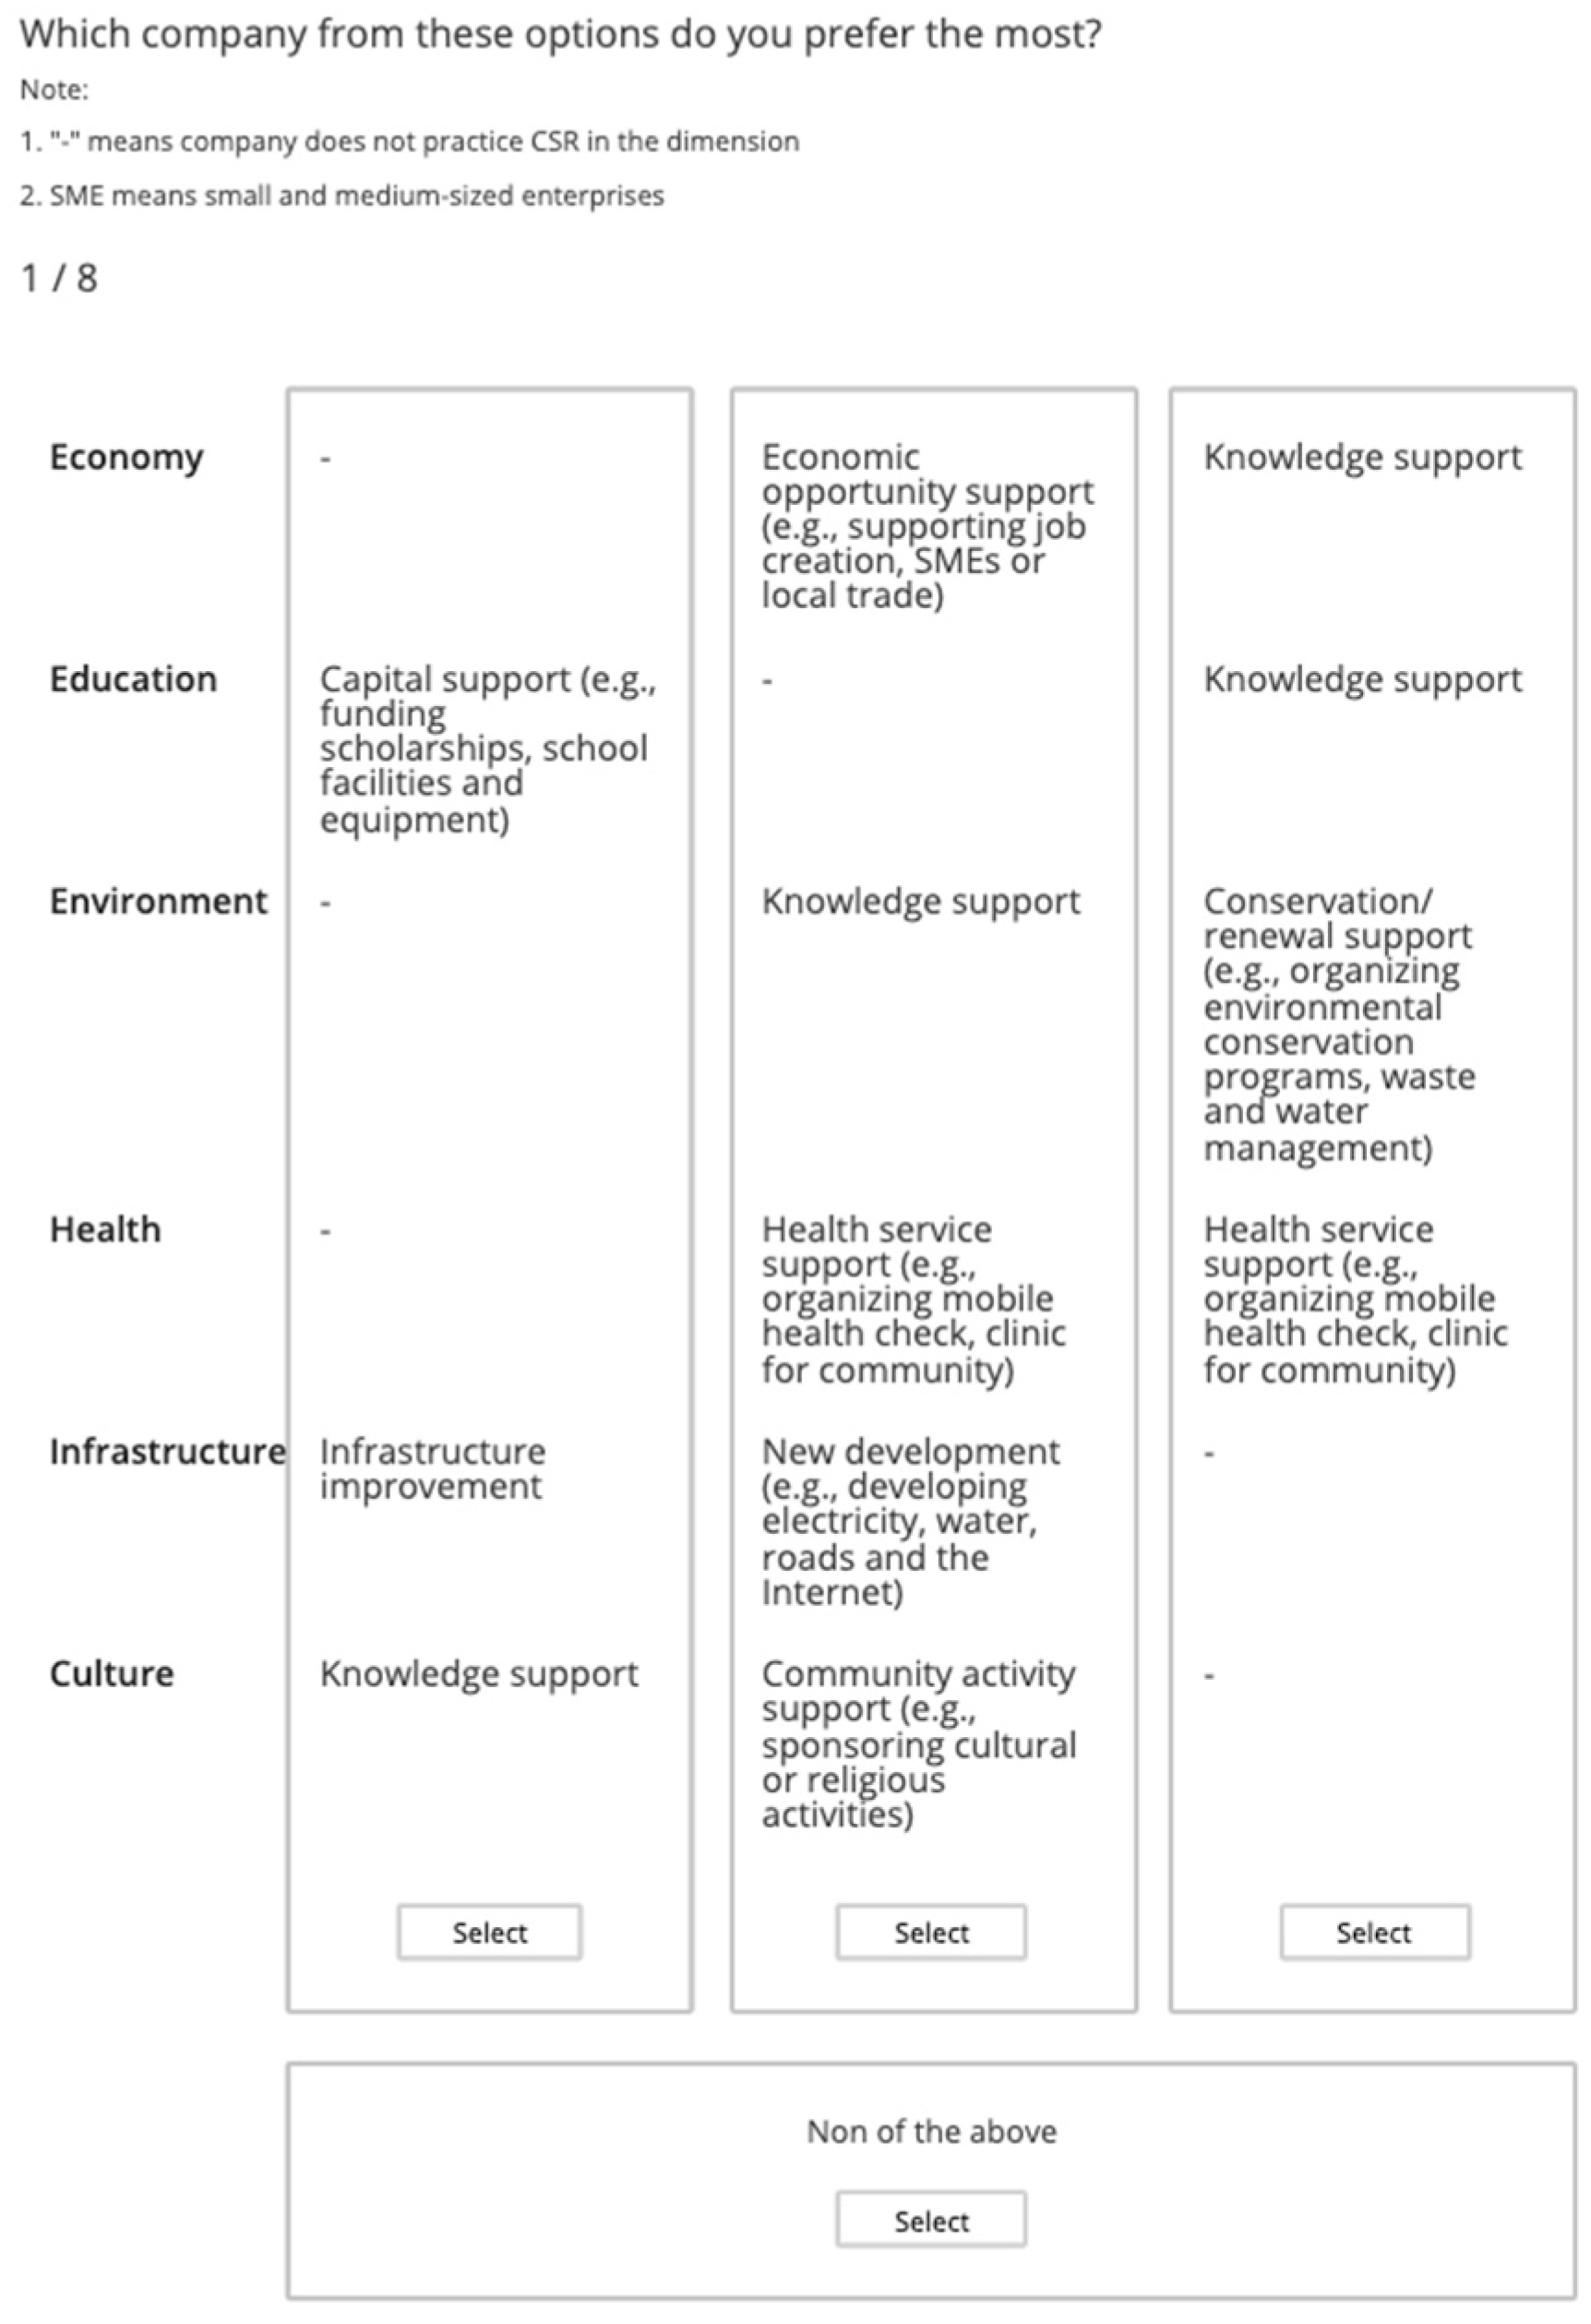
3.2. Choice-Based Conjoint Analysis

A choice-based conjoint analysis (CBA) is a multivariate analysis technique used to evaluate respondent decisions on multi-attribute choices to estimate individual utility functions [49]. Individuals make decisions and tradeoffs between competing sets of attributes to select their most preferred option [50]. CBA can effectively analyze choices in a sophisticated decision-making situation. Survey formulation, collection, and analysis were conducted using Sawtooth Software. The respondents were presented with three options (and a “none of the above” option) to answer the question “Which company from these options do you prefer the most?” Each hypothetical company presented a random combination of CSR activities in the six dimensions. Figure 1 shows an example of a “task” in the conjoint survey produced by Sawtooth Software. Each respondent completed eight tasks. The survey questions were translated into the Thai language.
The “utility” of each level of the six CSR dimensions was calculated by Sawtooth Software using the empirical Bayes method [51]. The importance of each dimension was calculated by the range of utilities in the dimension. A CSR dimension with a high range had higher relative importance than dimensions with low ranges. The conjoint analysis produced the importance levels of the six dimensions for each individual respondent. Subsequently, such levels were calculated to infer the overall preference of the local community and were used to identify relatively homogeneous segments of residents using a cluster analysis.
Data were collected from 309 respondents living within 5 km of Amata City, Chonburi, Thailand. Sawtooth (2019) suggested a sample size of 300 respondents to provide a robust result [52]. The snowball quota sampling technique was used to collect surveys from 309 residents, with distribution between May 2021 and July 2021.

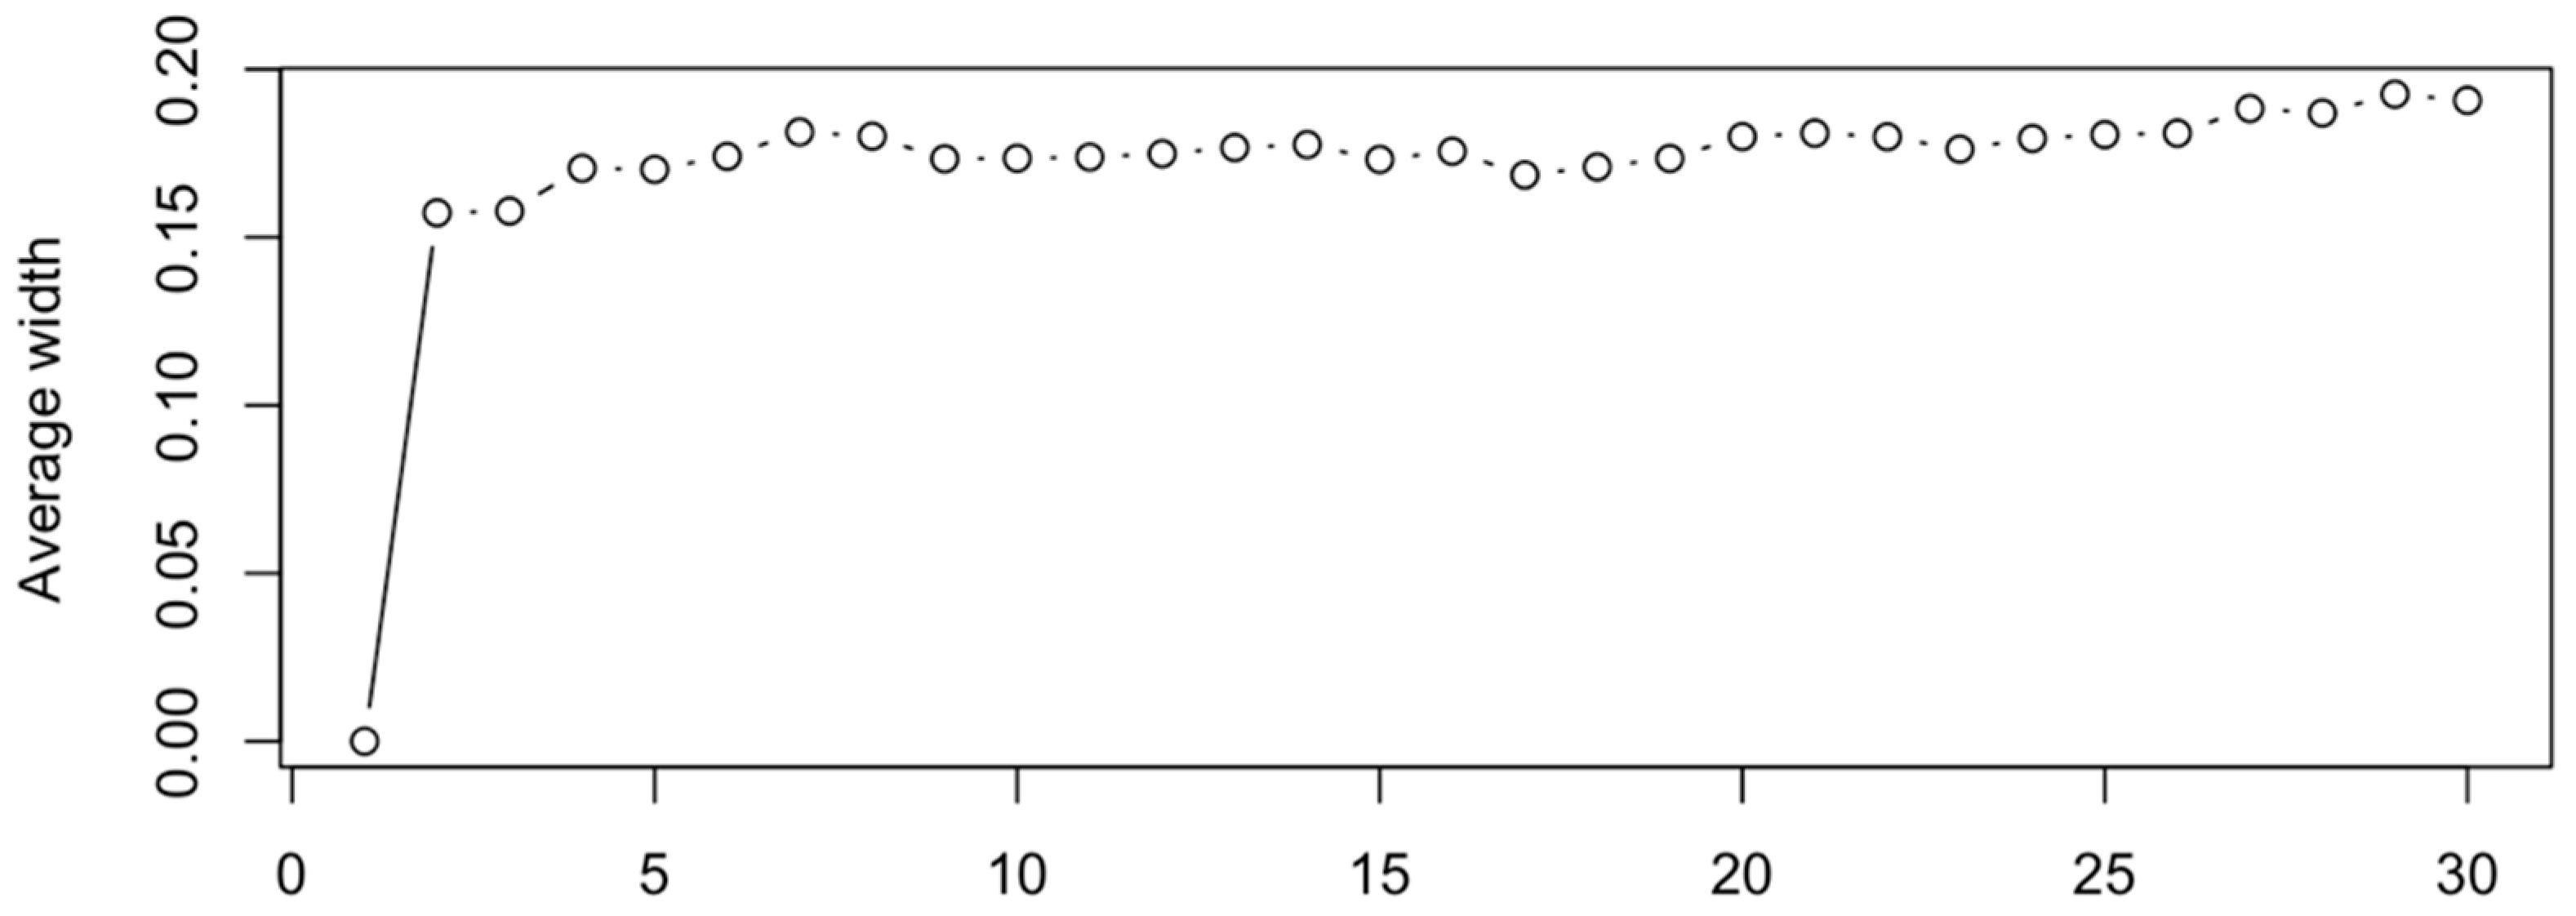
3.3. Cluster Analysis

K-means clustering was performed to segment respondents based on their preferences. A cluster analysis is an exploratory technique that identifies natural structures within the data. The K-means algorithm is an unsupervised learning algorithm that learns patterns from unlabeled data to create a compact internal representation of its world and generate ingenious content [53]. When given a set of data points, cluster analysis partitions the data into groups that are as similar as possible. Skouloudis, Evengelinos and Malesios [54] performed K-means clustering to group NGOs based on their viewpoints toward a firm’s CSR activities, and demonstrated the viability of this technique in the CSR context. Here, K-means clustering was utilized to group respondents based on the importance they placed on each CSR dimension as derived from the conjoint analysis. The number of clusters was specified using a silhouette method in the “cluster” package in R. The results of the silhouette method, in Figure 2, show that the average width had a local peak at seven clusters. The subsequent K-means cluster analysis (K = 7) was performed using a k-means function in the “stats” package in R, with 1000 maximum iterations and 1000 random starts to ensure robustness.

4. Results

4.1. Choice-Based Conjoint Findings

In total, 309 respondents completed the choice-based conjoint survey, comprising 159 females and 150 males (51% and 49%). Full demographic profiles of the respondents are shown in Table 3.
The results of the choice-based conjoint analysis are displayed in Table 4 as the importance level and the utility value. The importance level of each dimension is the average (mean) importance level of all 309 respondents in the survey; the utility value of three CSR activity levels within each dimension, which implied the influence of each level of activity on the respondents’ decision making, was also computed by averaging the utility values of all respondents. The results of the choice-based conjoint analysis showed that economy was the most important dimension (19.1%), followed by environment (18.1%), infrastructure (16.7%), health (15.8), culture (15.3%), and education (15%). The range of utility values in the economy dimension was 88.3 (from 49.3 to −39), the range of environment was 79.7, while education with the lowest importance value had the smallest range at 47.5.
For the utility of different CSR levels, the difference between low (no support) and moderate (knowledge support/infrastructure improvement) levels was less than the difference between moderate and high levels. To illustrate, an increase in utility of economy from low (−39) to moderate (−10.4) was 28.6, whereas an increase from moderate (−10.4) to high (49.3) was 59.7. This pattern appeared in most dimensions including health (30.1 vs. 35.1), infrastructure (18 vs. 45.9) and culture (17.2 vs. 32.6). However, two dimensions had a different pattern with the increase from low to moderate levels higher than the increase from moderate to high levels as education (25.4 vs. 22.1) and environment (49.3 vs. 30.4).

4.2. Comparison of Dimensions among Respondent Groups

Table 5 presents a breakdown of respondents by demographic variables and the average importance level of each group. The two most important CSR dimensions for both male and female residents were economy (18.7% and 19.5%) and environment (17.9% and 18.3%), while the three most important dimensions for all three generations (Gen X, Gen Y, and Gen Z, respectively) were economy (19.2%, 18.4%, and 20.5%), environment (18.1%, 17.9%, and 18.5%) and infrastructure (16.8%, 16.7%, and 16.5%). Residents with different educational backgrounds identified economy (ranging from 18.8–19.2%) and environment (17.9–19.6%) as the two most important dimensions. The third place varied between health and infrastructure.
Preferred CSR dimensions varied slightly among different occupations. The top two dimensions among the majority of occupations were the economy (18.2–20.3%) and the environment (17.9–19.4%), while people who worked in manufacturing chose infrastructure as the second rank (18.2%). The results also indicated that the economy and environment were relatively important across most occupations. Ranking CSR dimensions based on income levels yielded an interesting result. Three out of four income groups (low, high, and very high income) preferred environment the most (18.7%, 19.0%, and 19.1%, respectively) whereas middle-income residents preferred economy (20.12%). Likewise, people who held a bachelor’s degree and those whose educational attainment was lower than a bachelor’s degree preferred economy to the environment, while residents holding a degree higher than a bachelor’s level chose environment as the most preferred dimension.
To determine whether differences between the groups were significant, the T-test was performed to assess differences in the importance levels between the two genders, while an analysis of variance (ANOVA) was performed to compare means of the importance levels among generations, education levels, occupations, and income levels. The results showed that differences in the importance levels of all dimensions were not statistically significant at p-value = 0.05. Despite some differences among groups, the demographic variables showed no meaningful differentiation in CSR preferences, with no apparent relationship between the importance levels and the demographic variables. Therefore, to further understand the preferences of the local community, a cluster analysis was conducted to categorize people based on their individual CSR preferences.

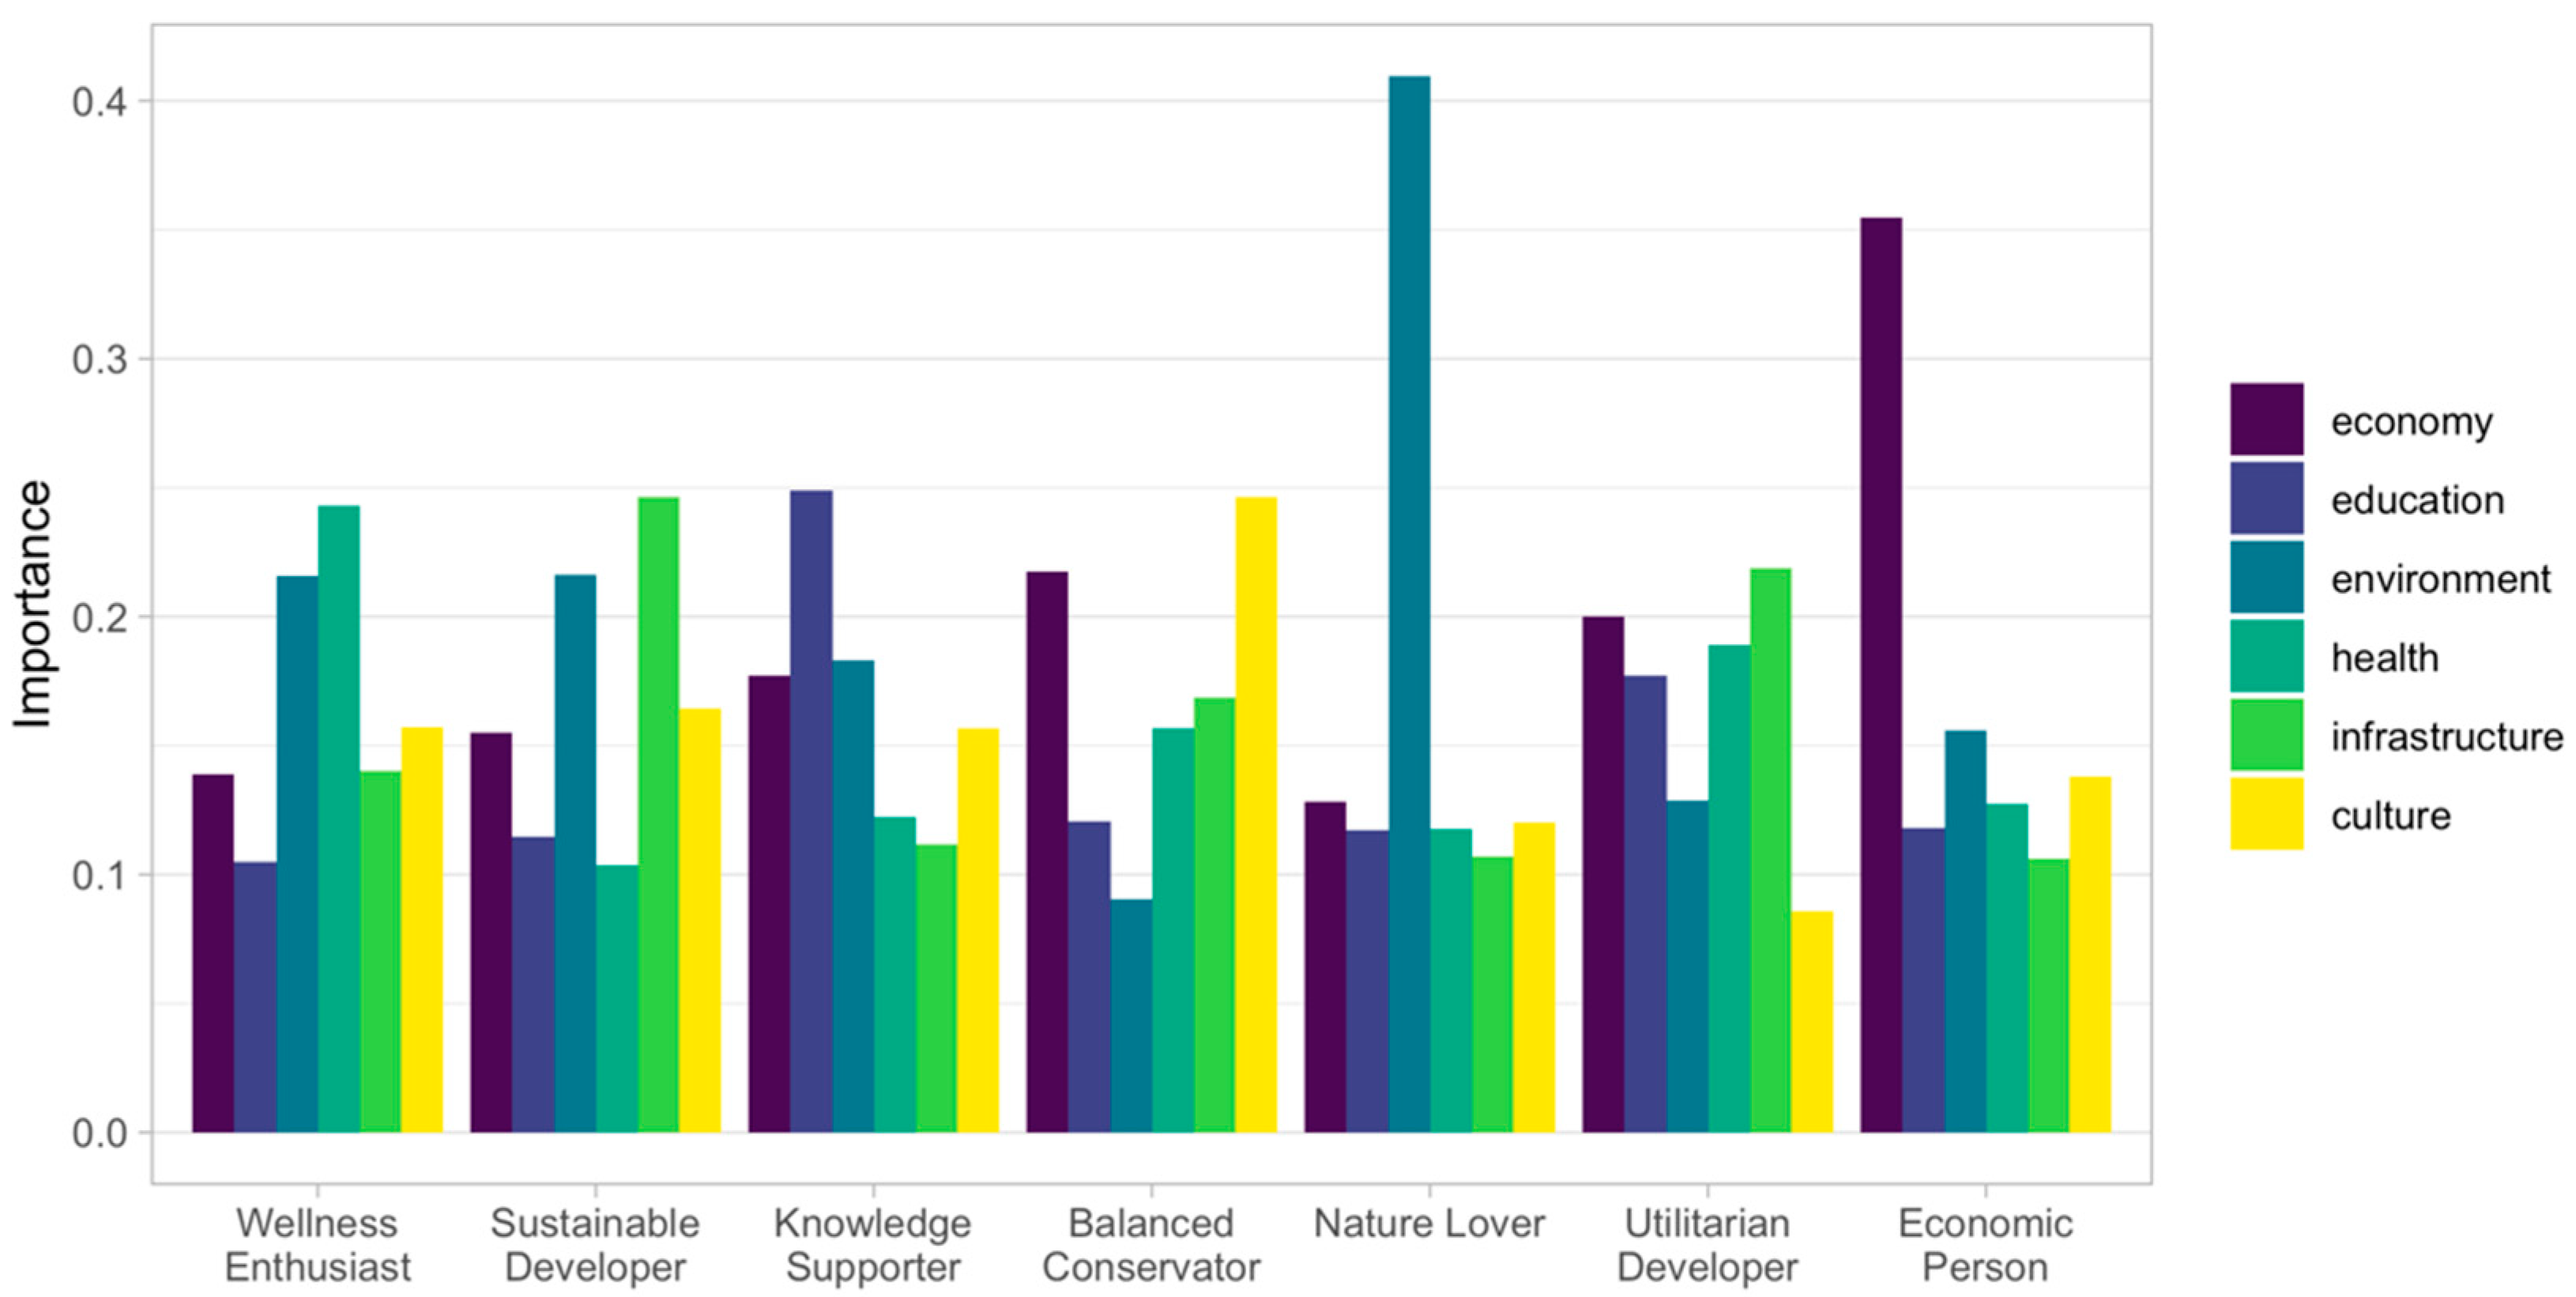
4.3. Cluster Analysis

The results of the K-means cluster analysis showed seven clusters (segments) of people who shared relatively similar CSR preferences. Each segment was named based on their distinct preferences as: wellness enthusiast (59 respondents), knowledge supporter (58), sustainable developer (57), utilitarian developer (55), balanced conservator (36), economic person (32) and nature lover (12). Figure 3 and Table 6 exhibit average importance levels of the seven segments. A cross-tabulation analysis was performed to understand the demographics of each segment, and the details presented in Table 7. Table 7 shows the number of people in each segment and demographic profile. Percentages represent the proportion of segment members in each demographic profile. For example, of the 59 respondents in the wellness enthusiast segment, 33 (55.9%) are male while 26 (44.1%) are female.
The wellness enthusiasts strongly preferred health (24.3%), followed by the environment (21.6%) (Table 6). There was a mix of genders and generations among the wellness enthusiasts, but the majority were in Gen Y and had a bachelor’s degree (Table 7). Many worked in the business field and were in the low or middle-income groups. The sustainable developers strongly preferred infrastructure improvement and development (24.6%) and the environment (21.6%). Most were Gen Y, held a bachelor’s degree or lower, and worked as corporate employees, professionals, or in manufacturing. There were more male than female sustainable developers (64.9%). The knowledge supporters preferred education (24.9%) as compared with the other CSR dimensions. A distinct characteristic of knowledge supporters was that they had the highest proportion of very high-income residents (20.7%) as compared with the other segments. The balanced conservators highly valued culture (24.6%) and the economy (21.7%). They had a combination of genders and occupations. About half of the samples held a degree lower than a bachelor’s degree (55.6%), were in Gen Y, and the middle-income group.
The nature lovers strongly and distinctly preferred the environmental dimension of CSR (41%). They had the fewest members and were predominantly female (66.7%). The utilitarian developers valued infrastructure and the economy the most at 21.9% and 20%, respectively, while health and education were a close third and fourth (18.9% and 17.7%, respectively). They placed the least importance on the cultural dimension (8.6%). They were mainly female (60%) with middle-income (47.3%) or low-income (21.8%) earnings. Lastly, the economic persons specifically and strongly cared about the economy dimension (35.5%). The majority of economic persons were male (56.3%), belonged to the middle-income group (62.5%), with lower than a bachelor’s degree educational attainment (53.1%).

5. Discussion and Conclusions

This research studied the preference of local residents toward the six dimensions of CSR activities as economy, education, environment, health, infrastructure, and culture; it is the first to identify utility values and levels of importance of different CSR dimensions using a conjoint analysis. The results showed that the top three CSR dimensions that residents near Amata City preferred were economy, environment, and infrastructure. The economy-related CSR activities include wealth creation in the community through small and medium enterprise (SME) support, local trade promotion, and job creation. These activities were the most sought after by the respondents. The environment-related CSR activities include increasing green areas, environmental conservation programs, and waste and water management, while infrastructure development involves essential utilities such as electricity, water, roads, and the Internet.
Our findings differed from van Hierden et al. [48] who noted that communities in Australia preferred infrastructure, crisis, and prevention support, while this research found that the local community preferred CSR activities that improved the economy and the environment. One probable explanation for this disparity is the context of this study, which was located in a developing nation, i.e., Thailand. As such, residents in the surrounding community preferred economy-driven initiatives to improve their well-being rather than other CSR dimensions. By contrast, residents in developed nations such as Australia have less need for economic support from the companies. This issue should be further explored. The research results suggested that the importance levels of all six dimensions were similar. Education had the lowest importance at 15.0%, whereas the economy was the most important dimension at 19.1%. A cluster analysis was performed to further identify the distinct segments of residents and their unique preferences.
The cluster analysis revealed that the CSR preferences were not homogenous within the community. Individual preferences suggested seven segments of residents as wellness enthusiasts, sustainable developers, knowledge supporters, balanced conservators, nature lovers, utilitarian developers, and economic persons. The results showed that most segments placed high importance on multiple dimensions. Two segments preferred only one CSR dimension—economic persons and nature lovers—as the smallest segments identified in this research (32 and 12 respondents, respectively). This implied that companies should consider CSR activities that serve multiple dimensions to achieve social acceptance from the majority of residents.
The wellness enthusiasts placed high emphasis on both health and environment-related CSR activities. The “Save Earth, Safe Us” campaign by Amata City combined the health and environment dimensions [55]. This initiative promoted health and environmental protection activities and encouraged participants to be aware of the impact of climate change. The sustainable and utilitarian developers distinctly preferred infrastructure development. The key difference between these two segments was that in addition to infrastructure, the sustainable developers preferred the environment as their second dimension. The CSR initiatives that appeal to this segment should improve the infrastructure and also conserve the environment. For example, the “solar cell system” campaign by PTT promotes the use of solar cells by knowledge sharing and community investments [56], while the “community biogas pond” project by CPF provides contract farmers with a biogas system that produces energy and reduced pollution [57]. By contrast, the utilitarian developers preferred the economy, education, and health almost as much as infrastructure. The “social development project” by IRPC appealed to this group. Wells were built to secure water supply and increase community household income [58]. The balanced conservators preferred CSR activities that both conserved culture and stimulated economic growth. An example of CSR initiatives that served both dimensions was the “local products and businesses support” project by CPF. This provides advice and funding for local communities to strengthen their local businesses, while the “mangrove forest ecotourism” integrates local ways of living and culture with income generating community-led ecotourism [57].
In conclusion, this research used a conjoint analysis to investigate local community preferences toward the six CSR dimensions. The economy and environment were the two most preferred dimensions, but the cluster analysis showed that the preferences of residents were heterogeneous. From the seven segments, economic persons and nature lovers preferred one CSR dimension, while the other segments preferred companies that aimed to improve multiple dimensions of sustainability.

5.1. Theoretical Contributions

The research findings by Loe et al. [59] provided evidence of non-homogenous community preferences. They conducted qualitative interviews and found that local needs and expectations regarding CSR contributions from companies differed among local groups and within the same community. This research reinforced the notion that heterogeneity in the same community existed, and confirmed that the one-size-fits-all CSR program was suboptimal [54]. The heterogeneity of preferences within the same community can be explained by the socioecological model (SEM). This posits that human development is influenced by external environments [60]. The SEM theory tries to understand human development and the relationship between individuals and the surrounding environment [61]. According to the SEM model, individual distinctive preferences and decision making are dynamic and impacted by the interaction between individuals’ characteristics, the community, and the surrounding environment [61]. Individual interactions with complex networks and systems contribute to distinctive preferences, notwithstanding their shared demographic characteristics. As Bateson [62] posited that “individuals differ for a variety of reasons, some genetic and some stochastic”, this research opened new avenues for future investigation of the reasons for individual differences in preferences toward CSR activities.
The results indicated that five out of seven identified segments preferred a combination of CSR dimensions, with only two segments preferring only one CSR dimension. This research supported the notion that a CSR strategy must balance several aspects of sustainability [44]. Past studies posited that balancing standards, sustainability principles, and competing demands from stakeholders were crucial for the success of CSR strategy [34]. Our findings indicated that multiple dimensions of CSR initiatives were preferred by the local community.

5.2. Managerial Implications

5.2.1. Promote CSR Programs of Amata City That Foster Both the Economy and the Environment

A conjoint survey is a suitable tool for companies and CSR practitioners to discover insights. The findings indicated that the CSR initiatives related to the economy and the environment were considered to be the two most important overall dimensions. The community collectively preferred activities related to these dimensions, such as income distribution and environmental conservation. As such, Amata City should actively initiate and promote CSR activities in these two dimensions to improve community acceptance. The environmental quality audit committees’ suggestions in the Amata Sustainability Report also advised Amata City to expand CSR activities in these two dimensions [55]. However, other dimensions—infrastructure, education, health, and culture—should not be neglected because results of the conjoint analysis showed that a moderate level (knowledge support) had higher utilities than no support at all.

5.2.2. Develop CSR Initiatives Based on a Citizen-Centric CSR Strategy

Strategically integrating stakeholders’ needs and expectations [63] coherently offer benefits to companies and the well-being of society. A citizen-centric strategy is important in various fields, including urban development [64], health service development [65], and community investment [48]. Citizen centricity embraces community interests [66], and focuses on audiences who benefit from CSR initiatives [48]. Despite the significance of economy and environment, the cluster analysis revealed resident heterogeneity. Therefore, IEs should continually examine local community needs and preferences, understand community expectations, and evaluate the suitability of CSR initiatives. Amata City should periodically track the attitudes and acceptance of these seven segments of residents, and initiate CSR activities that optimize community well-being.

5.3. Study Limitations and Future Research

There are both limitations and opportunities for further research. First, although a choice-based conjoint analysis assists researchers and marketers to gain insights from the research participants, this method is appropriate for analysis with fewer than seven attributes. Further research could explore preferences on CSR activities and conduct community interviews to further identify needs and expectations that might have been overlooked. Second, the demographic variables explored in this study showed no relation between preferences toward CSR dimensions. This provides room for future research to explore other socioeconomic variables that may affect community preferences. Third, the current research results may no longer be valid due to changes in timeframe, economy, as well as social and environmental situations. CSR is a dynamic concept that changes over time [67]. Thus, industrial estates should continuously revalidate community needs and expectations to develop appropriate CSR initiatives that can maximize trust and acceptance by the local community.

Author Contributions

S.P., research framework, theoretical development, writing, data collection; V.T., software and analysis, supervision, editing. All authors have read and agreed to the published version of the manuscript.

Funding

This research received no external funding.

Institutional Review Board Statement

The study was conducted according to the guidelines of the Declaration of Helsinki, and approved by the Institutional Review Board of Institute for Population and Social Research, Mahidol University (protocol code 2020/11-408 on 17 December 2020).

Informed Consent Statement

Informed consent was obtained from all subjects involved in the study.

Data Availability Statement

Not applicable.

Acknowledgments

The authors thank the editors, Valentín Molina-Moreno, Juan Victor Meseguer Sánchez, Gabriel López-Martínez, the three anonymous reviewers, and Roman Meinhold whose comments helped improve the manuscript.

Conflicts of Interest

The authors declare no conflict of interest.

References

  1. Pinyochatchinda, S. Map Ta Phut as an exemplar of the industrial estates of Thailand. J. Soc. Dev. Sci. 2012, 3, 6–15. [Google Scholar] [CrossRef] [Green Version]
  2. Pongpiachan, S. Factors affecting stakeholder’s levels of satisfaction with community partnership association in Rayong Province, Thailand. J. Hum. Behav. Soc. Environ. 2018, 28, 903–927. [Google Scholar] [CrossRef]
  3. Wang, H.; Tong, L.; Takeuchi, R.; George, G. Corporate social responsibility: An overview and new research directions: Thematic issue on corporate social responsibility. Acad. Manag. J. 2016, 59, 534–544. [Google Scholar] [CrossRef]
  4. Lacey, J.; Carr-Cornish, S.; Zhang, A.; Eglinton, K.; Moffat, K. The art and science of community relations: Procedural fairness at Newmont’s Waihi Gold operations, New Zealand. Resour. Policy 2017, 52, 245–254. [Google Scholar] [CrossRef]
  5. Kang, J.; Hustvedt, G. Building trust between consumers and corporations: The role of consumer perceptions of transparency and social responsibility. J. Bus. Ethics 2014, 125, 253–265. [Google Scholar] [CrossRef]
  6. Bosetti, L. Corporate community investment: A Strategic approach. Symphonya. Emerg. Issues Manag. 2019, 1, 68–85. [Google Scholar] [CrossRef] [Green Version]
  7. Srisuphaolarn, P. From altruistic to strategic CSR: How social value affected CSR development—A case study of Thailand. Soc. Responsib. J. 2013, 9, 56–77. [Google Scholar] [CrossRef]
  8. Lunkam, P. Thailand Industry Outlook 2018–20 Industrial Estate. Available online: https://www.krungsri.com/en/research/industry/industry-outlook/Real-Estate/Industrial-Estate/IO/Industry-Outlook-Industrial-Estate (accessed on 30 May 2021).
  9. Bataineh, T.M.; Aligah, K.M.A.; Alawneh, A.M. The Economic Impact of the Qualifying Industrial Estates in Jordan on the Jordanian Economic Activity: A Case Study on Al-Hassan Industrial Estate, Jordan, (2000–2014). Int. Bus. Res. 2016, 9, 169–175. [Google Scholar] [CrossRef]
  10. Ibrahim, M.F.; Chung, S.W. Quality of life of residents living near industrial estates in Singapore. Soc. Indic. Res. 2003, 61, 203–225. [Google Scholar] [CrossRef]
  11. Aveline-Dubach, N. 5 THE ROLE OF INDUSTRIAL ESTATES IN THAILAND’S INDUSTRIALIZATION New Challenges for the Future. In Sustainability of Thailand’s Competitiveness; Intarakumnerd, P., Lecler, Y., Eds.; ISEAS Publishing: Pasir Panjang, Singapore, 2010; pp. 174–206. [Google Scholar]
  12. Langeweg, F.; Hilderink, H.; Maas, R. Urbanisation, Industrialisation and Sustainable Development; Rijksinstituut voor Volksgezondheid en Milieu RIVM: Utrecht, The Netherlands, 2000. [Google Scholar]
  13. Michaels, G.; Rauch, F.; Redding, S.J. Urbanization and structural transformation. Q. J. Econ. 2012, 127, 535–586. [Google Scholar] [CrossRef]
  14. Alshuwaikhat, H.M. Strategic environmental assessment can help solve environmental impact assessment failures in developing countries. Environ. Impact Assess. Rev. 2005, 25, 307–317. [Google Scholar] [CrossRef]
  15. Poumanyvong, P.; Kaneko, S. Does urbanization lead to less energy use and lower CO2 emissions? A cross-country analysis. Ecol. Econ. 2010, 70, 434–444. [Google Scholar] [CrossRef]
  16. Kumah, A. Sustainability and gold mining in the developing world. J. Clean. Prod. 2006, 14, 315–323. [Google Scholar] [CrossRef]
  17. Downey, L.; Van Willigen, M. Environmental stressors: The mental health impacts of living near industrial activity. J. Health Soc. Behav. 2005, 46, 289–305. [Google Scholar] [CrossRef] [Green Version]
  18. Ghasemian, M.; Poursafa, P.; Amin, M.M.; Ziarati, M.; Ghoddousi, H.; Momeni, S.A.; Rezaei, A.H. Environmental impact assessment of the industrial estate development plan with the geographical information system and matrix methods. J. Environ. Public Health 2012, 2012, 407162. [Google Scholar] [CrossRef]
  19. Liu, Z.; Adams, M.; Cote, R.P.; Geng, Y.; Li, Y. Comparative study on the pathways of industrial parks towards sustainable development between China and Canada. Resour. Conserv. Recycl. 2018, 128, 417–425. [Google Scholar] [CrossRef]
  20. Osibanjo, O.; Daso, A.P.; Gbadebo, A.M. The impact of industries on surface water quality of River Ona and River Alaro in Oluyole Industrial Estate, Ibadan, Nigeria. Afr. J. Biotechnol. 2011, 10, 696–702. [Google Scholar]
  21. Sun, J.; Wang, J.; Wang, T.; Zhang, T. Urbanization, economic growth, and environmental pollution: Partial differential analysis based on the spatial Durbin model. Manag. Environ. Qual. Int. J. 2019, 30, 483–494. [Google Scholar] [CrossRef]
  22. GimyongNews. A Group for Taling Chan Villagers Support the Development of Jana Industrial Estate, Expecting More Occupation Opportunities. Available online: https://news.gimyong.com/article/13309 (accessed on 20 May 2020).
  23. Yamsrual, S.; Sasaki, N.; Tsusaka, T.W.; Winijkul, E. Assessment of local perception on eco-industrial estate performances after 17 years of implementation in Thailand. Environ. Dev. 2019, 32, 100457. [Google Scholar] [CrossRef]
  24. ManagerOnline. Doi Lo Community Protest the Halal Industrial Estate at Chiang Mai Province. Available online: https://mgronline.com/local/detail/9580000041138 (accessed on 20 May 2020).
  25. Petchlorian, T. The Rise of Bunrueang Community. Available online: https://www.posttoday.com/social/local/387443 (accessed on 20 May 2020).
  26. BBC. Fishman Heir who did not want Jana to be Industrial Area. Available online: https://www.bbc.com/thai/thailand-52663857 (accessed on 20 May 2020).
  27. ManagerOnline. Jana Conservation Community Protested the Development of Jana Industrial Estate. Available online: https://mgronline.com/south/detail/9630000058701 (accessed on 20 May 2020).
  28. Pickvance, C. Community: A Critical Response; Blackwell: Oxford, UK, 1977. [Google Scholar]
  29. McMillan, D.W.; Chavis, D.M. Sense of community: A definition and theory. J. Community Psychol. 1986, 14, 6–23. [Google Scholar] [CrossRef]
  30. Leary, M.R. Affiliation, acceptance, and belonging. Handb. Soc. Psychol. 2010, 2, 864–897. [Google Scholar]
  31. Panyathanakun, V.; Tantayanon, S.; Tingsabhat, C.; Charmondusit, K. Development of eco-industrial estates in Thailand: Initiatives in the northern region community-based eco-industrial estate. J. Clean. Prod. 2013, 51, 71–79. [Google Scholar] [CrossRef]
  32. Friedman, M. The social responsibility of business is to increase its profits. In Corporate Ethics and Corporate Governance; Springer: Berlin/Heidelberg, Germany, 2007; pp. 173–178. [Google Scholar]
  33. Carroll, A.B.; Brown, J.A. Corporate social responsibility: A review of current concepts, research, and issues. In Corporate Social Responsibility; Emerald Publishing Limited: Bentley, UK, 2018. [Google Scholar]
  34. Schwartz, M.S.; Carroll, A.B. Integrating and unifying competing and complementary frameworks: The search for a common core in the business and society field. Bus. Soc. 2008, 47, 148–186. [Google Scholar] [CrossRef]
  35. Virakul, B.; Koonmee, K.; McLean, G.N. CSR activities in award-winning Thai companies. Soc. Responsib. J. 2009, 5, 178–199. [Google Scholar] [CrossRef]
  36. Brown, T.J.; Dacin, P.A. The company and the product: Corporate associations and consumer product responses. J. Mark. 1997, 61, 68–84. [Google Scholar] [CrossRef] [Green Version]
  37. Morgan, R.M.; Hunt, S.D. The commitment-trust theory of relationship marketing. J. Mark. 1994, 58, 20–38. [Google Scholar] [CrossRef]
  38. Sheehy, B. Defining CSR: Problems and solutions. J. Bus. Ethics 2015, 131, 625–648. [Google Scholar] [CrossRef]
  39. Lehman, G. A legitimate concern for environmental accounting. Crit. Perspect. Account. 1995, 6, 393–412. [Google Scholar] [CrossRef]
  40. Neu, D.; Warsame, H.; Pedwell, K. Managing public impressions: Environmental disclosures in annual reports. Account. Organ. Soc. 1998, 23, 265–282. [Google Scholar] [CrossRef]
  41. Unerman, J.; Bennett, M. Increased stakeholder dialogue and the internet: Towards greater corporate accountability or reinforcing capitalist hegemony? Account. Organ. Soc. 2004, 29, 685–707. [Google Scholar] [CrossRef]
  42. Unerman, J. Stakeholder engagement and dialogue. In Sustainability Accounting and Accountability; Routledge: London, UK, 2010; pp. 105–122. [Google Scholar]
  43. Gjølberg, M. Measuring the immeasurable?: Constructing an index of CSR practices and CSR performance in 20 countries. Scand. J. Manag. 2009, 25, 10–22. [Google Scholar] [CrossRef] [Green Version]
  44. Montiel, I. Corporate social responsibility and corporate sustainability: Separate pasts, common futures. Organ. Environ. 2008, 21, 245–269. [Google Scholar] [CrossRef] [Green Version]
  45. Chapple, W.; Moon, J. Corporate social responsibility (CSR) in Asia: A seven-country study of CSR web site reporting. Bus. Soc. 2005, 44, 415–441. [Google Scholar] [CrossRef] [Green Version]
  46. Walley, N.; Whitehead, B. It’s not Easy Being Green. Available online: https://hbr.org/1994/05/its-not-easy-being-green (accessed on 30 May 2020).
  47. De Chiara, A.; Spena, T.R. CSR strategy in multinational firms: Focus on human resources, suppliers and community. J. Glob. Responsib. 2011, 2, 60–74. [Google Scholar] [CrossRef]
  48. van Hierden, Y.T.; Dietrich, T.; Rundle-Thiele, S. A citizen-centred approach to CSR in banking. Int. J. Bank Mark. 2020, 39, 638–660. [Google Scholar] [CrossRef]
  49. Green, P.E.; Krieger, A.M.; Wind, Y. Thirty years of conjoint analysis: Reflections and prospects. Interfaces 2001, 31, S56–S73. [Google Scholar] [CrossRef] [Green Version]
  50. Lancaster, K.J. A new approach to consumer theory. In Mathematical Models in Marketing: A Collection of Abstracts; Springer: Berlin/Heidelberg, Germany, 1976; pp. 106–107. [Google Scholar]
  51. Hair, J.; Black, W.C.; Babin, B.; Anderson, R.; Tatham, R. RE [2010]: Multivariate Data Analysis. In A Global Perspective; Pearson Prentice Hall: Hoboken, NJ, USA, 2010. [Google Scholar]
  52. Sawtooth. Sample Size Issues for Conjoint Analysis Studies. Available online: https://sawtoothsoftware.com/resources/technical-papers/sample-size-issues-for-conjoint-analysis-studies (accessed on 16 April 2021).
  53. Han, J.; Kamber, M.; Pei, J. 10—Cluster Analysis: Basic Concepts and Methods. In Data Mining, 3rd ed.; Han, J., Kamber, M., Pei, J., Eds.; Morgan Kaufmann: Boston, UK, 2012; pp. 443–495. [Google Scholar]
  54. Skouloudis, A.; Evangelinos, K.; Malesios, C. Priorities and perceptions for corporate social responsibility: An NGO perspective. Corp. Soc. Responsib. Environ. Manag. 2015, 22, 95–112. [Google Scholar] [CrossRef]
  55. Amata Sustainability Report. Available online: https://investor.amata.com/en/downloads/sustainability-reports (accessed on 15 June 2021).
  56. PPT Sustainability Report. Available online: https://www.pttplc.com/en/Media/Publications/Report/Sustainabilityreport.aspx (accessed on 20 September 2021).
  57. CPF Sustainability Report. Available online: https://www.cpfworldwide.com/en/sustainability/report (accessed on 20 September 2021).
  58. IRPC Social Well-Being. Available online: https://www.irpc.co.th/en/social-dimension/social-responsibility/ (accessed on 20 September 2021).
  59. Loe, J.S.; Kelman, I.; Fjærtoft, D.B.; Poussenkova, N. Arctic petroleum: Local CSR perceptions in the Nenets region of Russia. Soc. Responsib. J. 2017, 13, 307–322. [Google Scholar] [CrossRef]
  60. Bronfenbrenner, U. Ecology of the family as a context for human development: Research perspectives. Dev. Psychol. 1986, 22, 723. [Google Scholar] [CrossRef]
  61. Kilanowski, J.F. Breadth of the socio-ecological model. J. Agromedicine 2017, 22, 295–297. [Google Scholar] [CrossRef]
  62. Bateson, P. Why are individuals so different from each other? Heredity 2015, 115, 285–292. [Google Scholar] [CrossRef] [PubMed] [Green Version]
  63. Husted, B.W.; Allen, D.B. Corporate social responsibility in the multinational enterprise: Strategic and institutional approaches. J. Int. Bus. Stud. 2006, 37, 838–849. [Google Scholar] [CrossRef]
  64. Stapper, E.; Van der Veen, M.; Janssen-Jansen, L. Consultants as intermediaries: Their perceptions on citizen involvement in urban development. Environ. Plan. C: Politics Space 2020, 38, 60–78. [Google Scholar] [CrossRef] [Green Version]
  65. Walsh, L.; Hill, S.; Wluka, A.E.; Brooks, P.; Buchbinder, R.; Cahill, A.; Dans, L.F.; Lowe, D.; Taylor, M.; Tugwell, P. Harnessing and supporting consumer involvement in the development and implementation of Models of Care for musculoskeletal health. Best Pract. Res. Clin. Rheumatol. 2016, 30, 420–444. [Google Scholar] [CrossRef] [PubMed]
  66. McAteer, M.; Orr, K. Public participation in Scottish local government: Strategic and corporate confusions. Public Money Manag. 2006, 26, 131–138. [Google Scholar] [CrossRef]
  67. Argandoña, A.; von Weltzien Hoivik, H. Corporate Social Responsibility: One Size Does Not Fit All. Collecting Evidence from Europe. J. Bus. Ethics 2009, 89, 221–234. [Google Scholar] [CrossRef] [Green Version]
Figure 1. Example of a conjoint analysis survey.
Sustainability 13 10683 g001
Figure 2. Results of the silhouette method.
Sustainability 13 10683 g002
Figure 3. Seven segments based on CSR preference.
Sustainability 13 10683 g003
Table 1. The six corporate social responsibility dimensions.
Bosetti (2019)Srisuphaolarn (2013)Chapple and Moon (2005)
EducationEducational support and human capital development programsScholarships and building schoolsEducational support and training
EconomyImproved employability of disadvantaged youthOccupational development and contract-farming supportAgricultural and local economic development
EnvironmentAwareness of climate change and environmental protection through restoration of habitats and endangered speciesEnvironmental programs such as forestry restoration, process innovation, eco-value products, preservation of natural resources, recycling and alternative energyEnvironmental conservation
Health and safetyHealth campaigns to prevent illness and improve the well-being of the population Blood donation campaigns with the Thai Red Cross and fundraising for hospitalsHealth, sport, and safety support
Social and cultureCampaigns to support art and culture, with engagement in specific collaborations related to culture, communities and scientific institutesSocial programs to enhance well-being e.g., Thai traditional music and awareness of family bondingYouth, arts, culture, and support and welfare of religious organizations
Basic infrastructurePower accessibility and water access to refugee campsHousing for disaster victims and the underprivilegedHousing support
Table 2. CSR levels derived from content analysis.
EnvironmentEconomyHealthEducationCultureInfrastructure
Level 1No SupportNo SupportNo SupportNo SupportNo SupportNo Support
Level 2Knowledge
support
Knowledge
support
Knowledge
support
Knowledge
support
Knowledge
support
Infrastructure
improvement
Level 3Conservation/renewal support (e.g., organizing environmental conservation programs, and waste and water management)Economic opportunity support (e.g., supporting job creation, SMEs, or local trade)Health service support (e.g., organizing mobile health check, a clinic for the community)Capital support (e.g., funding scholarships, school facilities, and equipment)Community activity support (e.g., Sponsoring cultural or religious activities)New development (e.g., developing electricity, water, roads, and the Internet)
Table 3. Respondent profiles.
TotalFemaleMale
Generation (age range)
Gen X (Before 1979)936033
Gen Y (1980–1994)1475889
Gen Z (1995–2003)694128
Religion
Christian14410
Buddhist290152138
Islam211
others321
Education level
Lower than a bachelor’s degree1386573
Bachelor’s degree1327755
Higher than a bachelor’s degree391722
Occupation/Degree
Business owner643232
Employee (employee, banking, account)773839
Government official312011
Manufacturing442123
Professional (medical, healthcare, physician,
engineer, technology, programmer,
legal, education, training)
462026
Other472819
Monthly income
Low (Less than 15,000 Baht)673928
Middle (15,000–30,000 Baht)1507971
High (30,000–45,000 Baht)512526
Very high (More than 45,000 Baht)411625
Total309159150
Table 4. Importance and utility values of the choice-based conjoint analysis.
DimensionLevelImportanceUtility
EconomyNo support19.1%−39.0
Knowledge support−10.4
Economic opportunity support49.3
EducationNo support15.0%−24.3
Knowledge support1.1
Capital support23.2
EnvironmentNo support18.1%−43.0
Knowledge support6.3
Conservation/renewal support36.7
HealthNo support15.8%−25.1
Knowledge support−5.0
Service support30.1
InfrastructureNo support16.7%−27.3
Infrastructure improvement−9.3
Infrastructure development36.6
CultureNo support15.3%−22.3
Knowledge support−5.1
Organizational support27.5
Table 5. Demographic groups and average importance levels (%).
DemographicnEconomyEducationEnvironmentHealthInfrastructureCulture
Gender
Male15918.715.517.916.615.915.4
Female15019.514.518.315.017.515.2
Generation
GenX9319.215.118.115.216.815.6
GenY14718.415.317.916.316.715.4
GenZ6920.514.318.515.716.514.5
Income level
Low 6718.115.418.715.418.114.3
Middle 15020.114.917.215.516.615.7
High5118.114.119.017.016.515.4
Very high4118.416.119.116.215.115.1
Education level
Lower than bachelor’s degree13819.115.717.914.717.415.3
Bachelor’s degree13219.214.517.816.916.415.2
Higher than bachelor’s degree3918.814.419.616.115.415.6
Occupation
Business owner6418.215.118.116.017.215.3
Employee7720.315.116.815.416.815.6
Government official3119.114.218.818.314.914.7
Manufacturing4418.415.817.915.018.214.6
Other4718.516.218.615.416.215.2
Professional4619.713.519.415.816.015.7
Table 6. Average importance levels (%) of the seven segments.
Segment NameEconomyEducationEnvironmentHealthInfrastructureCulture
Wellness enthusiast13.910.521.624.314.015.7
Sustainable developer15.511.421.610.424.616.4
Knowledge supporter17.724.918.312.211.215.7
Balanced conservator21.712.09.015.716.924.6
Nature lover12.811.741.011.810.712.0
Utilitarian developer20.017.712.918.921.98.6
Economic person35.511.815.612.710.613.8
Table 7. Cross-tabulation analysis between demographic profiles and segments.
DemographicWellness EnthusiastSustainable DeveloperKnowledge SupporterBalanced ConservatorNature LoverUtilitarian DeveloperEconomic Person
%n%n%n%n%n%n%n
Gender
Female55.93335.12053.43155.62066.7860.03343.814
Male44.12664.93746.62744.41633.3440.02256.318
Generation
Gen X25.41529.81736.22133.31241.7527.31525.08
Gen Y57.63443.92546.62752.81916.7247.32643.814
Gen Z16.91026.31517.21013.9541.7525.51431.310
Education level
Lower than a bachelor’s degree30.51849.12848.32855.62041.7540.02253.117
Bachelor’s degree54.23242.12441.42436.11325.0343.62437.512
Higher than a bachelor’s degree15.398.8510.368.3333.3416.499.43
Occupation
Business20.31226.31519.01113.9525.0329.1166.32
Employee18.61119.31122.41336.11341.7525.51431.310
Government official16.9103.5212.175.628.319.1512.54
Manufacturing10.2619.31115.5919.478.3110.9612.54
Other16.9108.8519.01113.9516.7212.7721.97
Professional16.91022.81312.1711.140.0012.7715.65
Income level
Low25.41524.61424.11411.1416.7221.81218.86
Middle33.92050.92950.02961.12233.3447.32662.520
High25.41514.085.2319.4733.3418.21012.54
Very high15.3910.5620.7128.3316.7212.776.32
Publisher’s Note: MDPI stays neutral with regard to jurisdictional claims in published maps and institutional affiliations.

