Article

Assessing Energy Poverty in Urban Regions of Mexico: The Role of Thermal Comfort and Bioclimatic Context

by
Karla G. Cedano
,
Tiare Robles-Bonilla
*,
Oscar S. Santillán
and
Manuel Martínez
Instituto de Energías Renovables, Universidad Nacional Autónoma de Mexico, Temixco 04510, Mexico
*
Author to whom correspondence should be addressed.
Sustainability 2021, 13(19), 10646; https://doi.org/10.3390/su131910646
Submission received: 1 September 2021 / Revised: 22 September 2021 / Accepted: 23 September 2021 / Published: 25 September 2021
(This article belongs to the Topic Climate Change and Environmental Sustainability)

Abstract

:
The increase of energy access to households has been a global priority. By 2018, 89.59% of the world population had access to electricity, while 97.26% of the persons living in urban areas (The Mexican Government reports it at 99.99%) had access. We must now move beyond access to electricity and address energy poverty in urban spaces. A household is energy poor when their inhabitants are incapable of securing proper domestic energy services. Several different methodologies were developed to measure energy poverty. The Multidimensional Energy Poverty Index (MEPI) by Nussbaumer has been successfully used in Africa and in Latin-America. The MEPI considers five dimensions: cooking, lighting, household appliances, entertainment/education and communication. We developed a Multidimensional Energy Deprivation Index (MEDI), based on MEPI. Thermal comfort has been included as sixth dimension, by considering the temperature of the region where the household is located. We found important differences between MEPI and MEDI for Mexico at the national level (urban-MEPI at 0.028 vs. 0.071 urban-MEDI, which implies a higher degree of energy poverty). Also, differences between geopolitical and bioclimatic regions were found. Having better ways to assess energy poverty in the urban context is a key factor to develop effective public policies that might alleviate it.

1. Introduction

Energy poverty (EP) is a growing and urgent issue currently affecting many people in the world. EP may manifest in several ways and at different levels (which make it hard to measure and compare), and despite its importance as a social phenomenon, there is not a universal definition at the moment [1]. Nevertheless, as a general approximation of the subject, it can be said that EP is the inability to access adequate, affordable, reliable, high-quality, safe, and environmentally benign energy services to support economic and human development [2].
EP is of particular interest in cities. Currently, around half of the world’s population lives in cities, and for the year 2050, 70% of the world inhabitants is predicted to live in urban settlements [3]. Cities account for between 60% and 80% of energy consumption and near 75% of carbon emissions, despite the fact that hey only occupy 3% of the Earth’s surface [3]. The United Nations (UN) acknowledges the importance of cities in sustainable development, and for the accomplishment of Sustainable Development Goal (SDG) 11: For sustainable cities and communities, addressing urban energy poverty is imperative.
EP incidence can be found within a wide range of populations: from local groups to different national contexts, which highlights the relevance of assessing its spatial distribution [4]. For the urban areas, dwellings have a higher probability of being able to access modern energy services (especially electricity and liquefied petroleum gas), and for this reason, the lack of access of energy services might reflect poverty and unaffordability [5]. Roberts et al. (2015) undertook a study in the UK context, and they found that the experience of fuel poverty in urban areas lasts longer on average, and that fuel poverty also has a higher probability of persistence [6]; whilst Robinson et al. (2018) found that there is a higher prevalence of fuel poverty in urban areas [4]. In México, García Ochoa & Graizbord Ed (2016) evaluated the deprivation of energy services while distinguishing between rural and urban settlements, where they also discussed the importance of the climate when assessing EP [7].
Positive Energy Districts (PED) emerge as a strategy to decarbonise urban spaces in Europe. Bruck et al (2021) define a PED as a community that generates a surplus of energy with renewable sources in comparison with the energy it consumes from the grid on an annual basis, and that keeps its CO2 emissions balance at zero. They show that with actual electricity demand patterns PEDs are feasible and even pose a cheaper alternative against the import of energy when favourable climatic conditions are met. They also show a decrease in energy consumption. Thus, both issues imply an incentive in the householders’’ economy [8].
The dwellings or buildings that might be conceptualized as a PED have to actively manage their energy consumption and the energy flow between them and the national grid [9].
For the development of PEDs, the urban energy end-use must be very low, and this requires high energy efficiency, especially in the building, industry, and transport sectors [10]. An important feature of the PEDs is that achieving an annual surplus of net energy is not their only goal, they also must adequately handle such surpluses to prevent additional stress on the electrical grid [10]. For the accomplishment of the later objective, PEDs must offer alternatives for increasing the self-consumption and consumption on site, technologies for storage (both for short and long term) and provide energy flexibility by means of smart grids [11].
Hearn & Castaño-Rosa highlight that PEDs are a solution that might alleviate energy poverty (EP). Even though some places enforce public policies to promote the use of PV systems or the decrease of social tariffs as measures to alleviate, they are not enough. This is the main reason why the concept of PEDs gains interest as a better strategy, since households experience a decrease in their energy expenses and increase their energy behaviour [12].
The objective of the present work is to generate knowledge regarding the Mexican incidence of energy poverty in urban areas. The paper seeks to answer the research question: What is MEDI´s relevance for energy poverty evaluation and its alleviation through public policy design in Mexican urban populations? The originality of the paper lies in two main issues: first, the introduction of the Multidimensional Energy Deprivation Index (MEDI), an indicator based in Nussbaumer´s Multidimensional Energy Poverty Index (MEPI) that includes thermal comfort, considering both the bioclimatic region and the temperature in the measurement of energy poverty. Second, this is the first study that assesses energy poverty in urban areas in the Mexican context. The results attempt to act as an information source for the elaboration of public policies with the aim to address energy poverty in Mexico.
The article is presented as follows: in the Section “Materials and Methods”, both MEPI and MEDI are described, as well as the data set used for the analysis. The results and the comparison for both indexes are presented in “Results”, along with the identification of energy deprivation in terms of the different Mexican bioclimatic regions and some examples of specific urban areas. Finally, in “Discussion”, the key results and the more important findings are discussed.

2. Materials and Methods

2.1. MEPI Description

The Multidimensional Energy Deprivation Index (MEDI) is based on Nussbaumer´s Multidimensional Energy Poverty Index (MEPI). MEPI is an indicator that captures a set of energy deprivations that affects people by means of five dimensions and six indicators that represent basic energy services, as shown in Table 1. The people living in a particular dwelling are in an energy poverty condition if the combination of deprivations faced exceeds a predefined threshold [13].
MEPI measures energy poverty on d variables across a population of n individuals. The matrix Y = [yij] represents the states matrix n x d for i persons through j variables. yij > 0 indicates the state of individual i on variable j. A weighting vector w is composed of wj elements corresponding to the weight that is applied to variable j. It is defined by:
j = 1 d W j = 1
The deprivation threshold zj on variable j is set; then, all individuals with deprivations on any variable are detected. Subsequently, it is defined the deprivation matrix g = [gij] where each element gij is determined by:
g i j = { w j , y i j < z j   0 , y i j   z j }  
In a MEPI calculation, elements on the states matrix are non-numerical, and for that reason the threshold is defined as a set of conditions to be fulfilled. Later, a column vector c of deprivations counts is built, where the ith entry indicates the sum of deprivations that i person is facing, where:
c i = j = 1 d g i j
The dwellings on the energy poverty condition are identified with the definition of a limit k > 0, which is applied to the column vector c, a dwelling is considered to be one of energy poverty if its weighted deprivation count ci exceeds k. The censored vector of deprivation count is represented by c(k), which is different to c for it counts zero deprivations to the persons that are not identified on multidimensional energy poverty.
c i ( k ) = { 0 , c i k   c i , c i > k }  
Headcount ratio H represents the proportion of the population considered as energy poor, and is calculated with H = q/n, where q is the number of persons on energy poverty (ci > k), and n, the total number of the sample. H indicates the incidence of multidimensional energy poverty. The average of the censored weighted deprivation count ci(k) represents the intensity of multidimensional energy poverty, and is calculated by:
A = i = 1 n C i ( k ) q
MEPI captures information regarding incidence and intensity of energy poverty, and is defined as MEPI = H × A. When calculating H and A, the number of persons in each dwelling are included.

2.2. MEDI Description

Robles & Cedano (2021) state the need to consider bioclimatic regions to better understand energy poverty (EP). This is in regard to the importance that thermal comfort has in the proper assessment of EP. They create a new index adding not only the dimension of thermal comfort, but also a climate analysis that includes the regional climatic conditions to properly assess the need of appliances to achieve it. This index, called the Multidimensional Energy Deprivation Index (MEDI), considers the extreme temperature ranges that take place in Mexico and the importance of being deprived of appliances to mitigate the effects of extreme weather [14]. We use annual average extreme temperatures considering that a 30 °C average implies thermal discomfort, whether the standard deviation is large or small. In other words, a small standard deviation can translate to having minimum variations around 30 °C, which makes livelihood or work-related activities uncomfortable without the aid of cooling appliances. And on the other hand, in those cases where the standard deviation is larger, we can infer that the temperature can rise to even higher values, thus increasing the need of cooling appliances to achieve thermal comfort.
MEDI methodology allows for the incorporation of new dimensions and variables, and an alternative dimension was added, as shown in Table 2.
Thermal comfort is a very important topic when assessing energy poverty, since providing it is considered an energy service needed to achieve wellbeing. Its relevance can be shown in several case studies; for example, in the summer of 2003, more than 70,000 deaths caused by extreme heat in Europe were reported [15]. Without any doubt, accessing thermal comfort can decrease the number of deaths related to very low temperatures or to dehydration when very high temperatures occur, not only in Europe, where most of the recent events are being reported, but also in Latin America. Thermal comfort has been thoroughly studied since 1959 by Crowden, with studies analysing its effects on human health in households. We found 16,976 papers on the Web of Science regarding thermal comfort up to August 2021; however only 85 of those papers address energy poverty also. These 85 papers focus on mortality, vulnerability, deprivation, and extreme temperature, among other topics as can be found in Table 3 (Data from Minero bibliométrico Avanzado [16]).
Population increases in urban areas and a building’s inadequate design and construction that affects thermal comfort affects quality of life in urban spaces. Karakounos et al [17], Gaitani et al [18], and Pontes et al [19] consider climatic regions and bioclimatic design to alleviate the adverse effects of extreme temperature and climate change. This situation can be alleviated by retrofitting buildings with materials that have better behaviour against temperature increases. They also suggest adding green spaces to decrease outdoor temperature and, in turn, decrease energy consumption for cooling. However, there are some cases where adjacent buildings increase temperature, thus adding layers of complexity to alleviate the lack of thermal comfort and increasing the need for cooling appliances. Calixto & Huelz highlight the importance of climate considerations in building design, since this is directly related with energy consumption, especially in countries in the Global South, like Mexico, where climate diversity is high. In this region, bioclimatic diversity has to be considered in the design and construction of buildings to attain thermal comfort and energy savings [20].
Robles & Cedano (2021) modified in a proportional way the weights that Nussbaumer et al defined in their methodology, while including the dimension of thermal comfort. The first approach was to adjust the weights for the five original dimensions proportionally, so they were not significantly altered when adding thermal comfort [14]. The weights were as shown in Table 4.
Also, new weights were applied to all the dimensions as shown in Table 5. To establish MEDI´s weights, experts on the subject were consulted. They agreed on considering cooking as essential, followed by electricity and then appliances, since until this point, health and safety were considered, as well as which appliances were useful for food preservation and to prevent indoor pollution. Later, thermal comfort was considered due to its importance as an energy service. Finally, entertainment/education and communication were included [14].

2.3. Databases Used

The data used for the evaluation was obtained from the National Survey of Income and Expenditures in Households (Encuesta Nacional de Ingresos y Gastos en los Hogares, ENIGH, in Spanish). This survey is applied every two years by the National Institute of Statistics and Geography (Instituto Nacional de Estadística y Geografía, INEGI). We used the data of the survey applying secondary data analysis [21]. The ENIGH database includes information associated with three levels: dwelling, household, and the household ’s members; and the results can be extensive for the whole population, with a confidence interval of 90%. The analyzed information encompassed 73,405 dwellings in which 256,989 persons reside [22].
In Section 2.2 it is mentioned that Robles & Cedano use the temperature of the bioclimatic region as conditional for calculating MEDI, and it is taken from the National Water Comission (Comisión Nacional del Agua, CONAGUA) dataset. In its web page, the information includes the national monthly average maximum or minimum perspective temperature in a three-month period. However, the authors requested CONAGUA information regarding one year’s daily temperatures by municipality. CONAGUA delivered information about the year daily minimum, average and maximum temperature available. Temperature is expressed in degrees Celsius [23].

3. Results

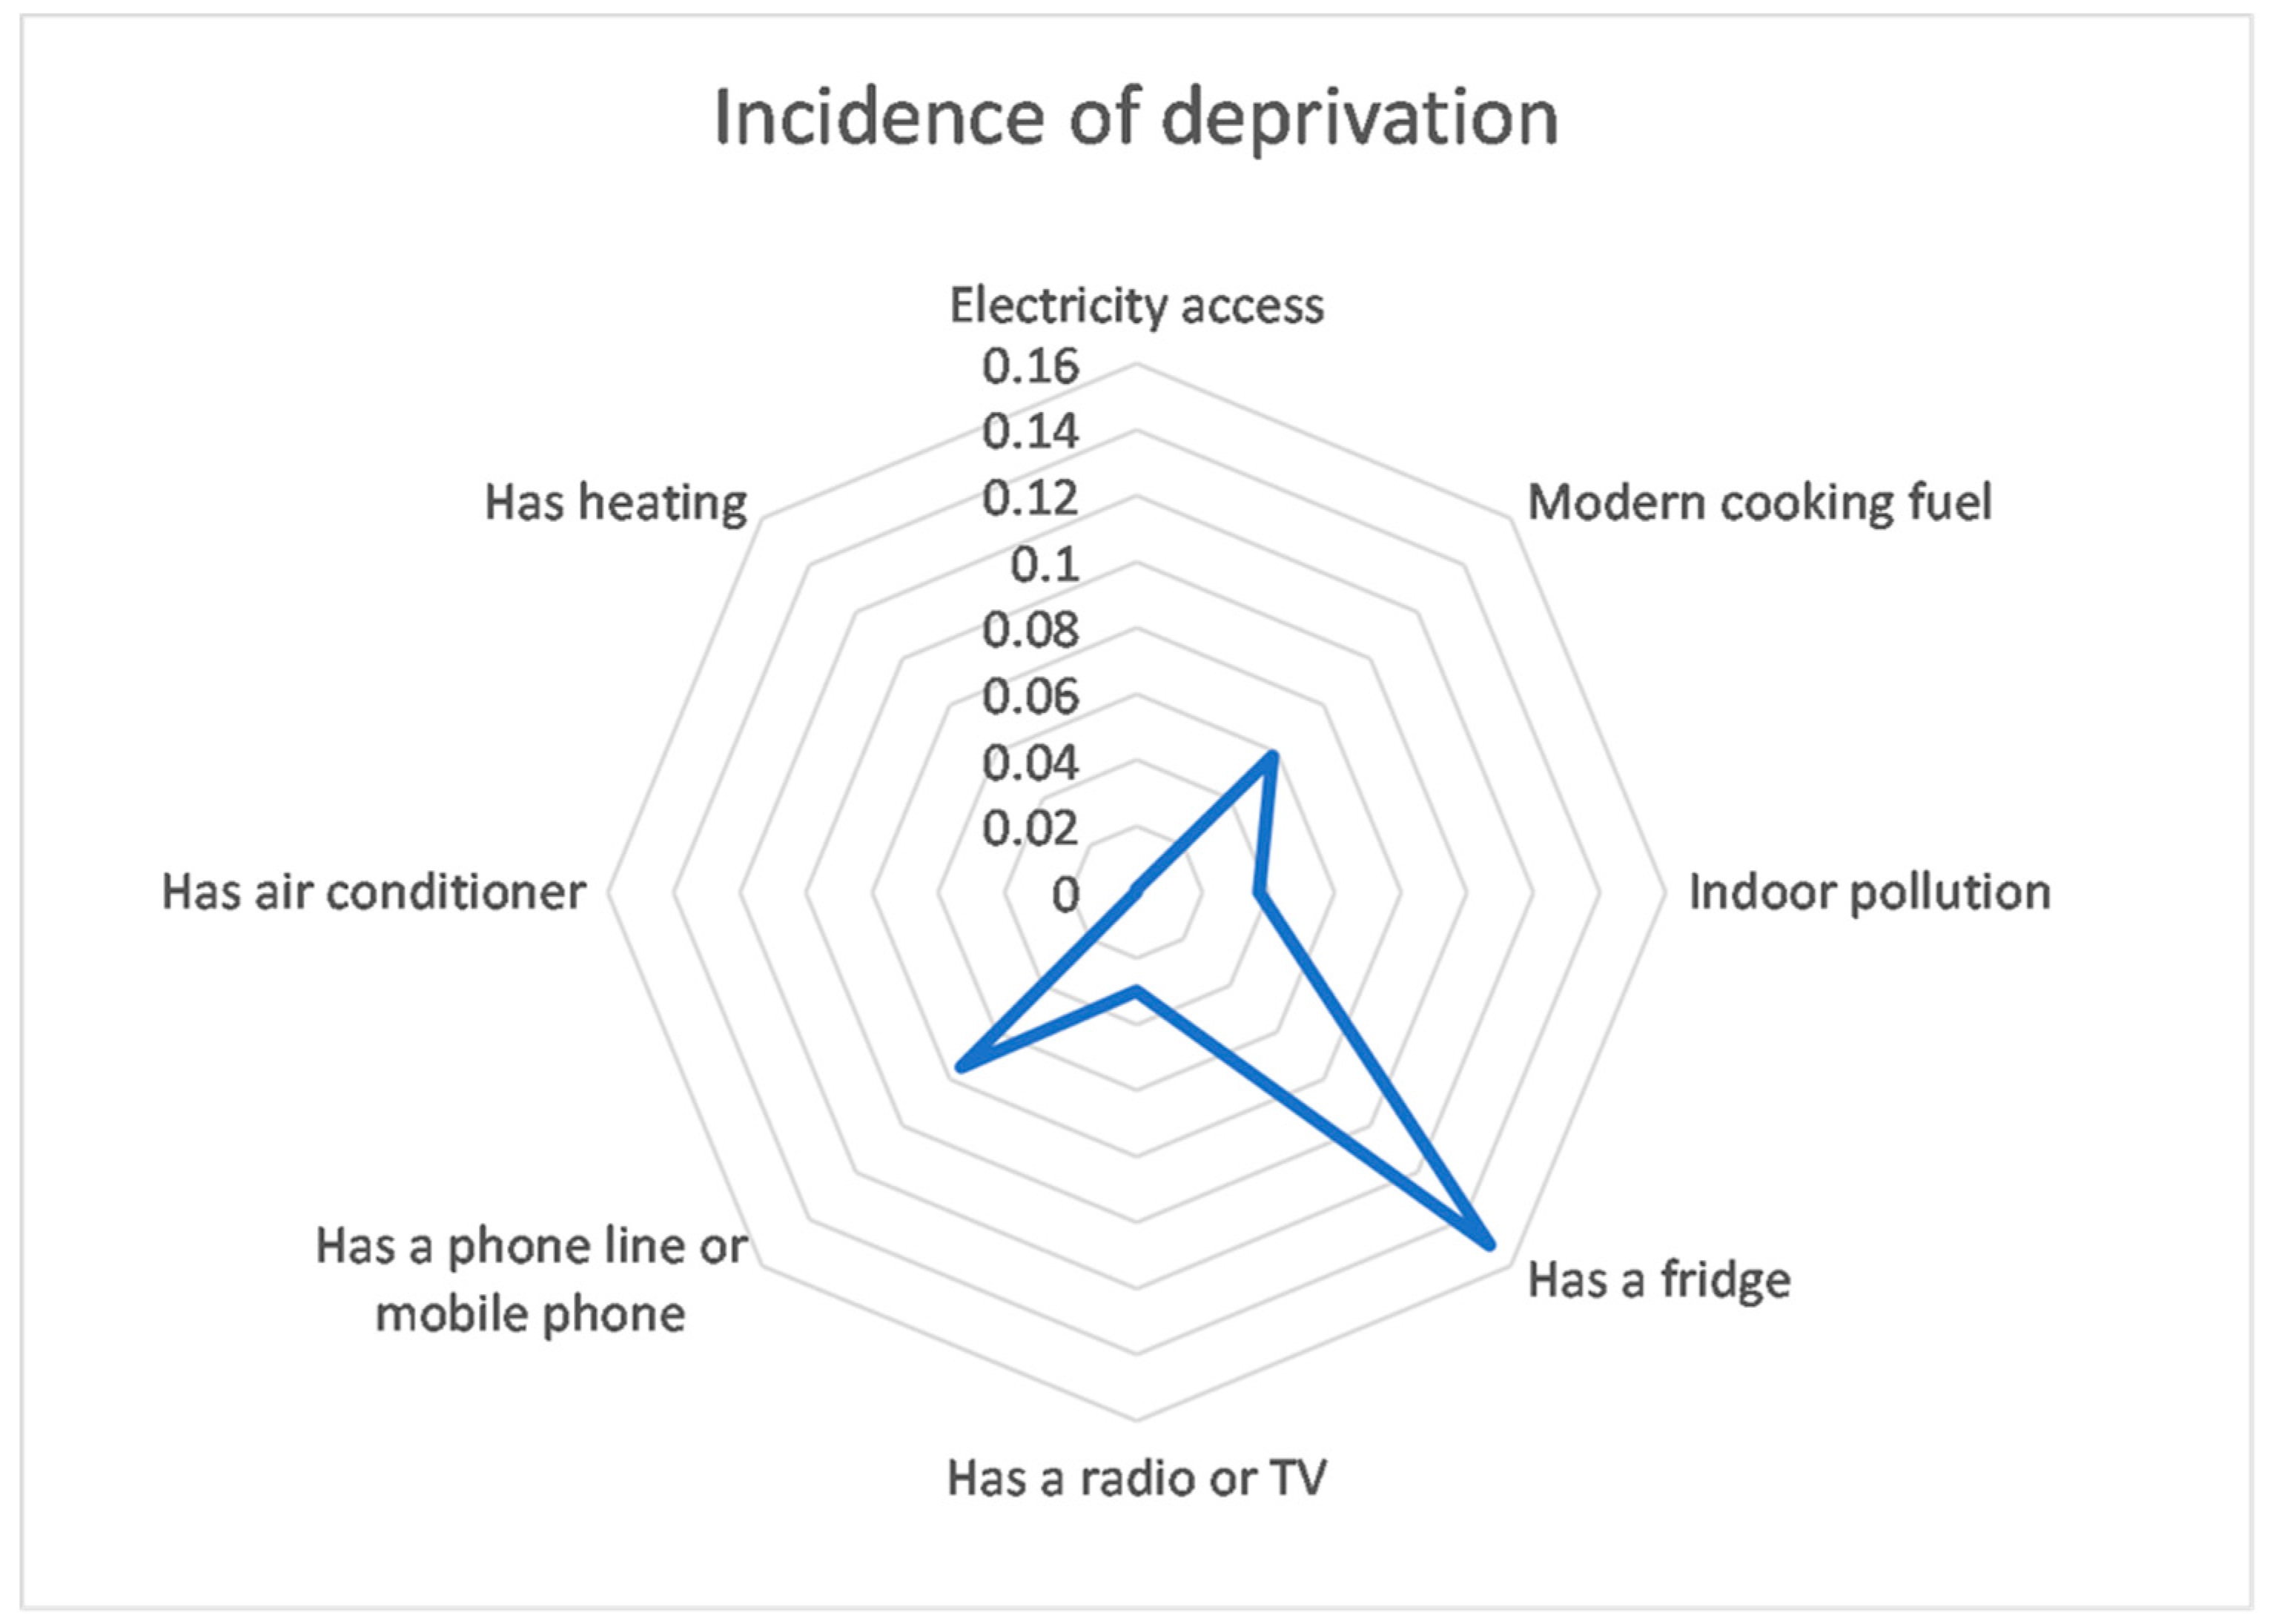
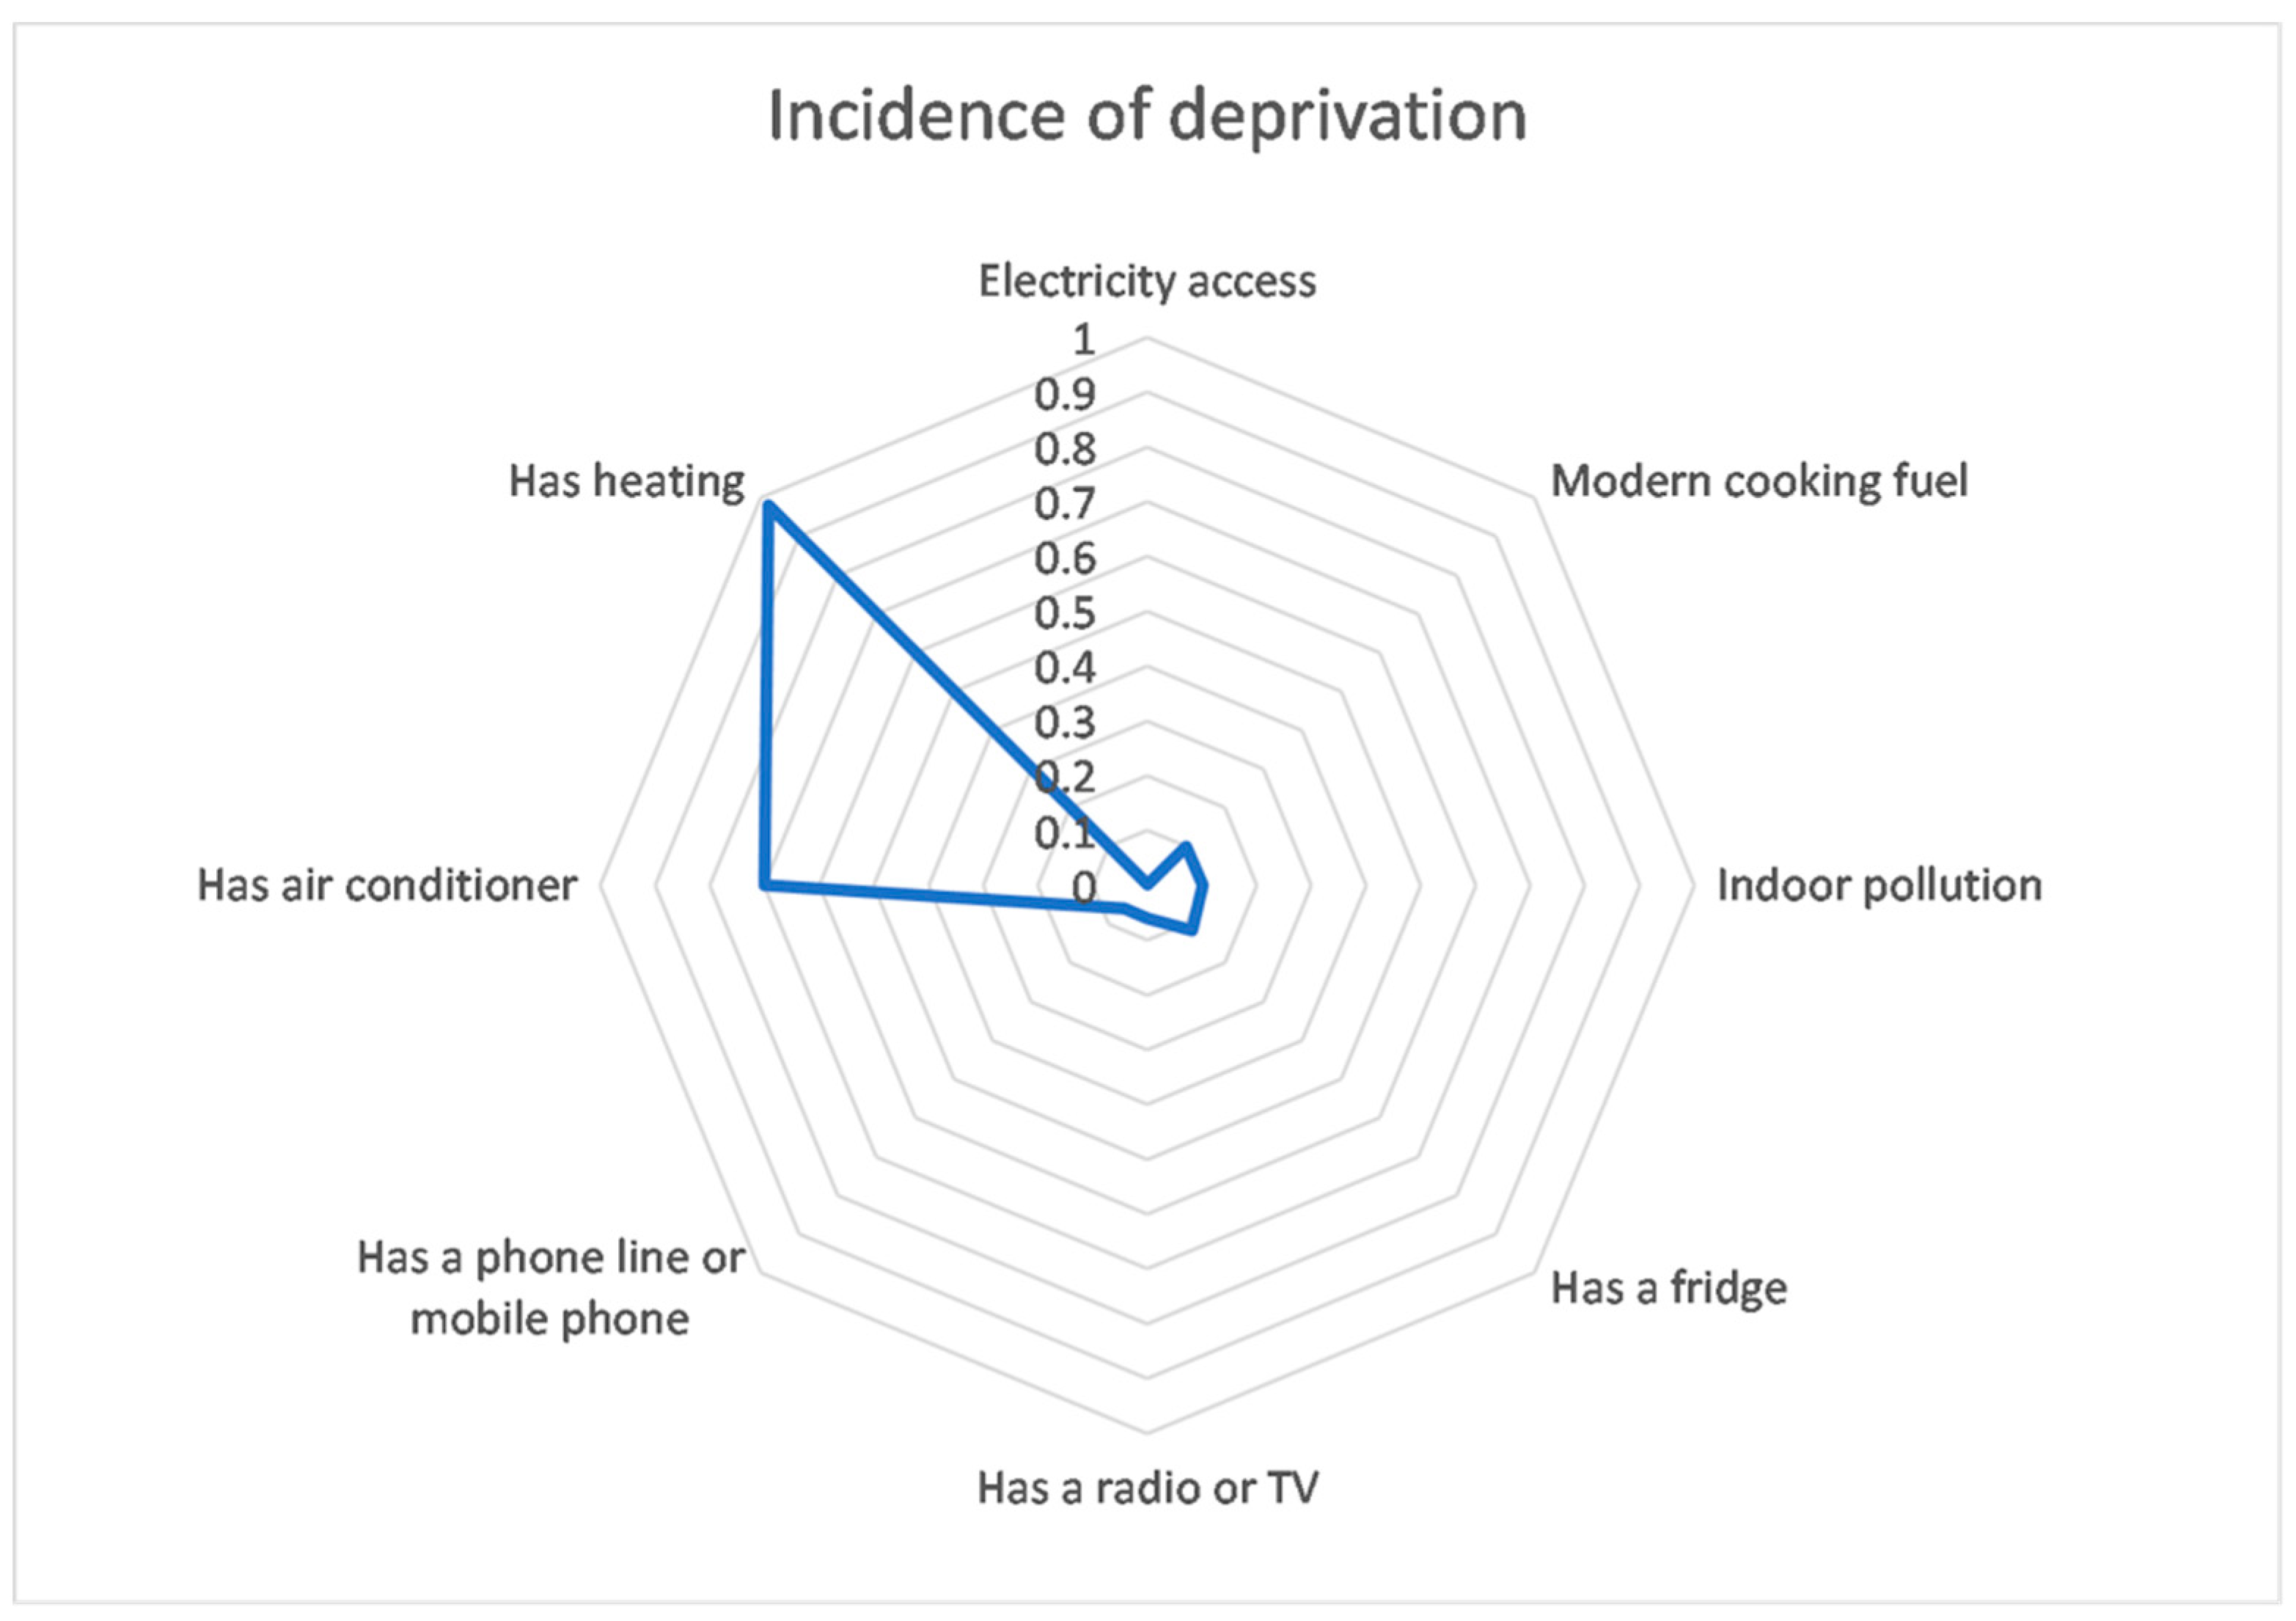
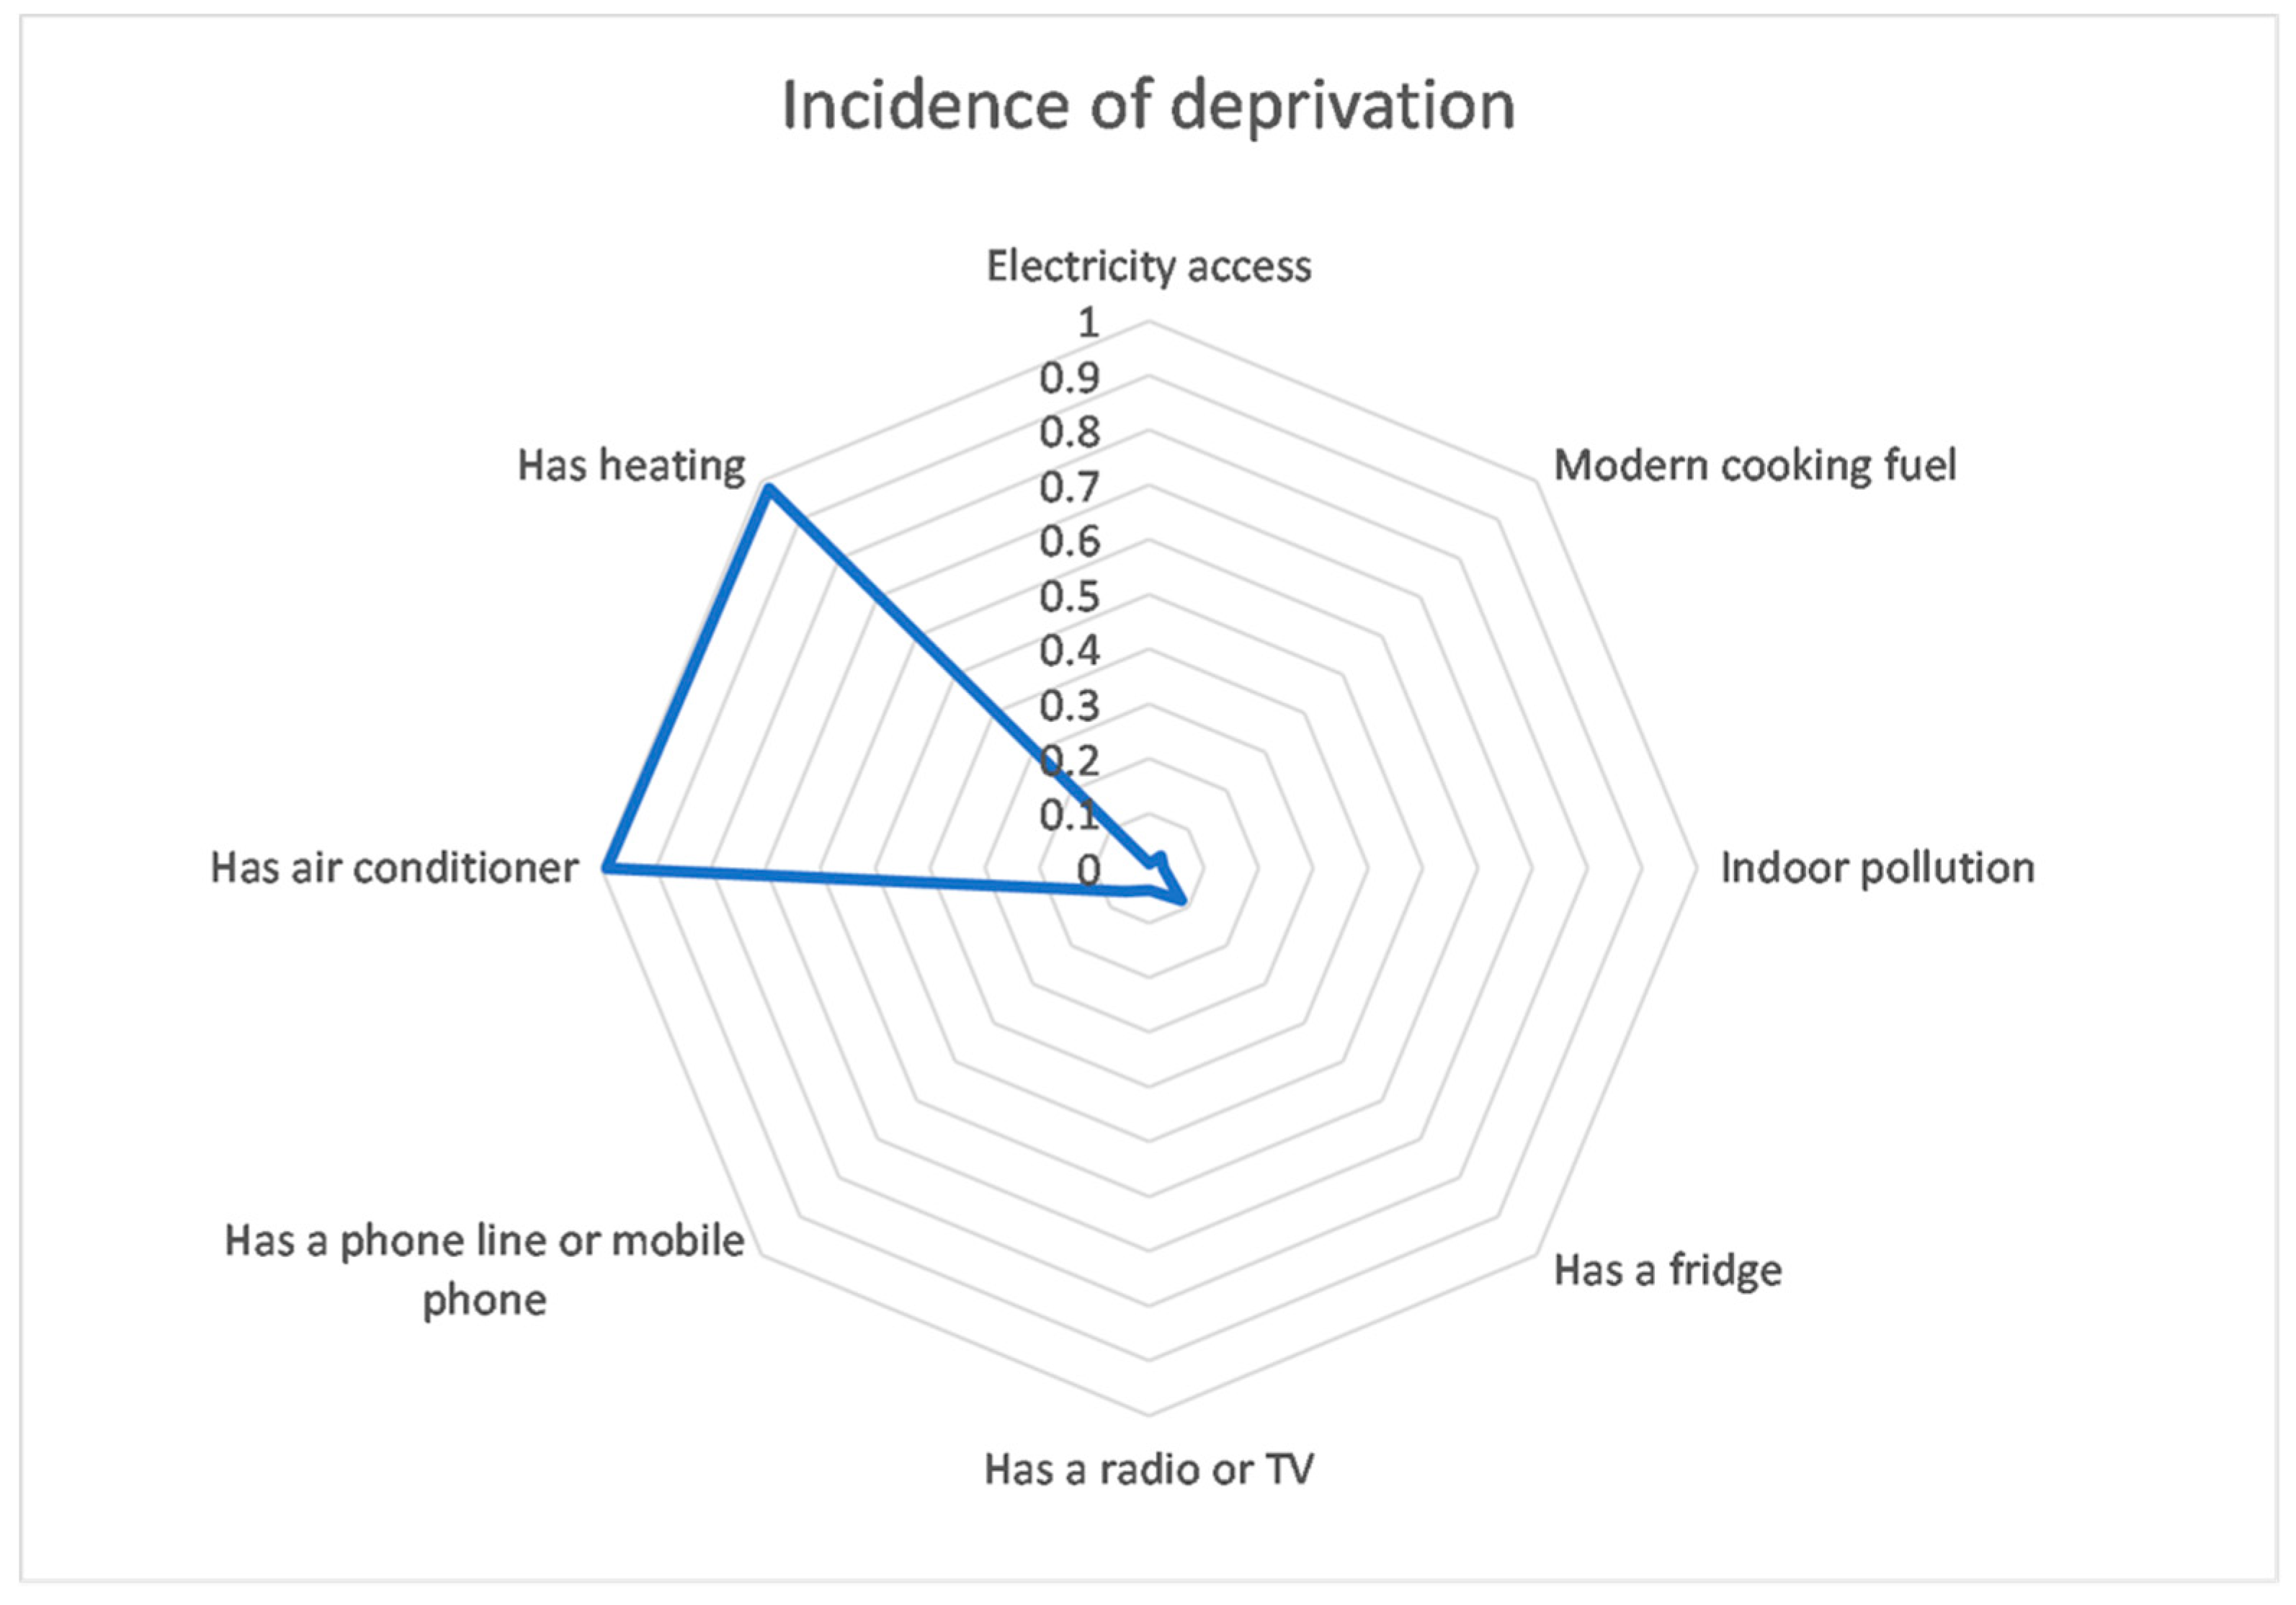
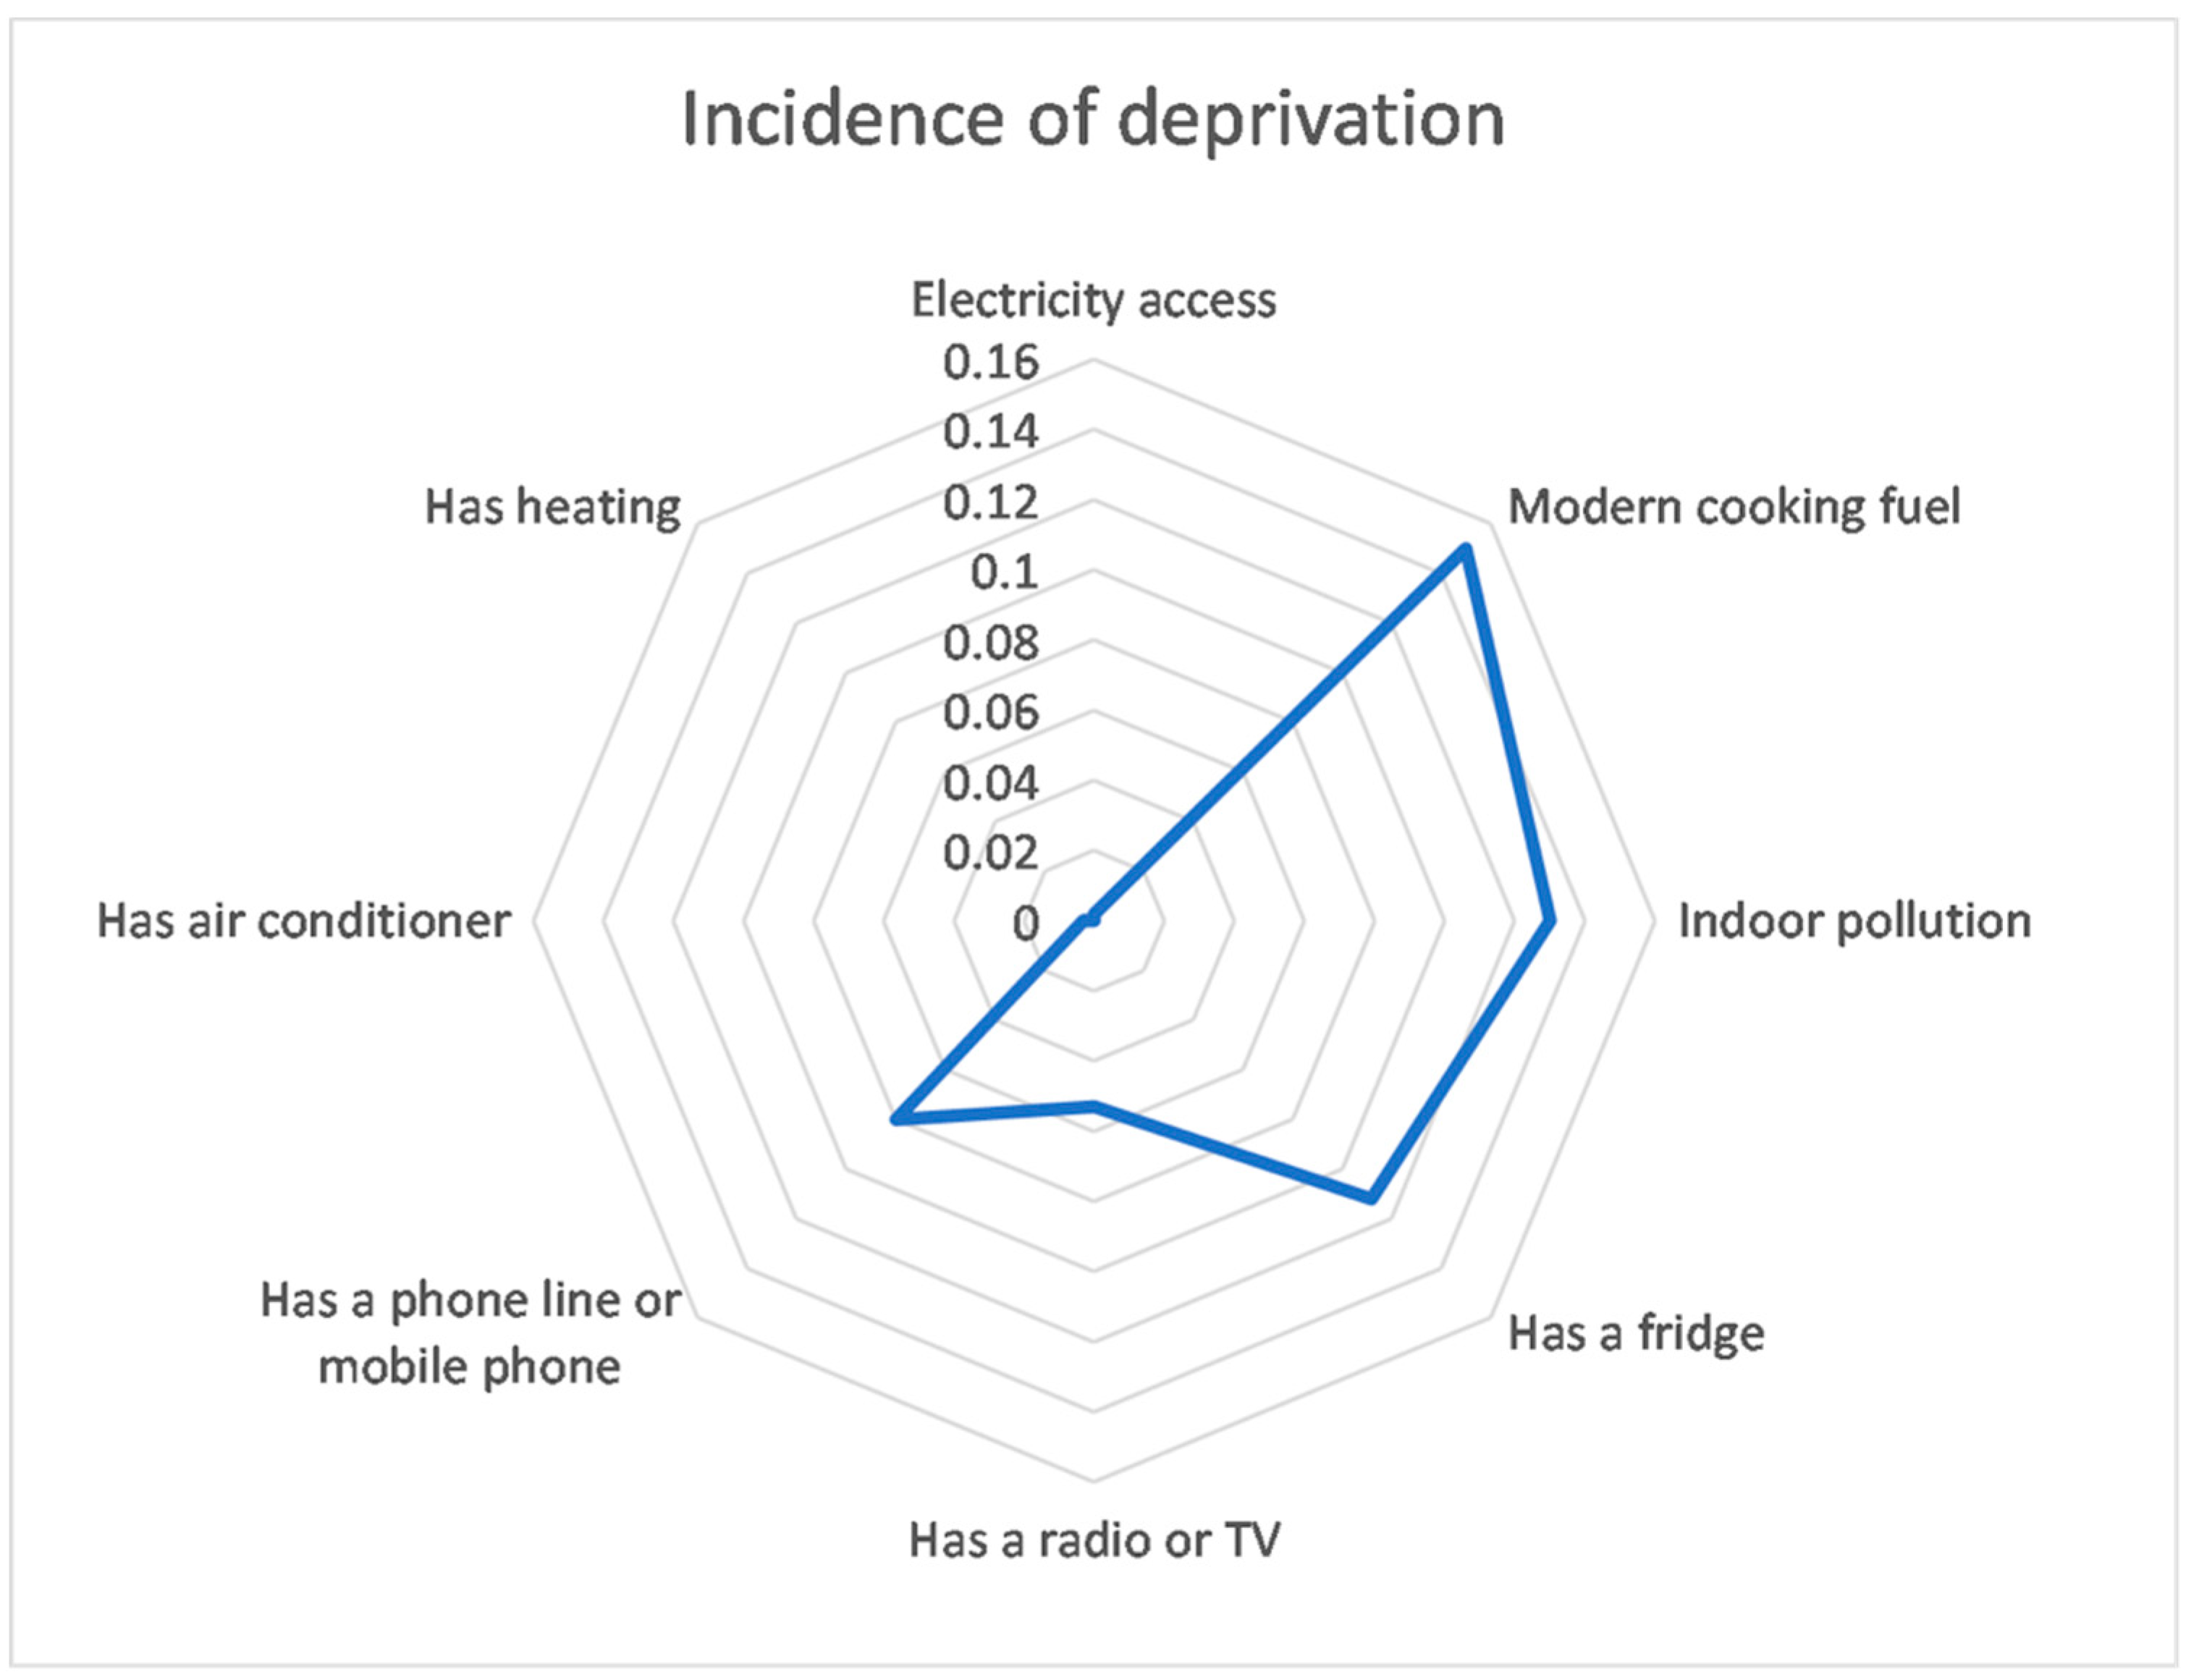
3.1. Identification of Energy Deprivation by Bioclimatic Region

Two cases were analyzed for the identification of energy deprivation in relation to the bioclimatic region. In the first one, the extreme temperatures in the bioclimatic region were used, meaning that the minimum temperature among the municipalities of the region was set as tmin and the maximum temperature among the municipalities of the region was set as tmax. The second case considers only the average temperature, leaving the extreme temperatures out of the analysis. The two cases together show two completely different results: when using extreme temperatures 99% of the people show deprivations regarding thermal comfort, while just one bioclimatic region presents the need to use thermal comfort appliances when using the average temperature, resulting in a low incidence in this dimension.
To better understand the incidence of deprivations within the bioclimatic regions, the indicator´s weights were adjusted and the calculation was made considering the variables instead of the dimensions. A weight of 1, as opposed to the previously allocated weights, was used for the calculation of each variable alone, setting the weights of the other variables to zero. As an example, to know the incidence of the access to electricity variable, its weight was set in 1 while the weights of all the other variables was set to zero.
For the first case, where the extreme temperatures are used, all of the bioclimatic regions present the lack of heating or air conditioning as the most emerging deprivation affecting 99% of the people. Warm weather has presented temperatures below 10 ºC (in part due to climate change), which have caused them to face heating deprivation. Dry tempered, tempered and humid semi-cold weather also requires heating. Humid tempered, dry semi-cold and semi-cold weathers show a wider deprivation of air conditioning in relation to heating, while both are at concerning levels. Figure 1 shows humid warm bioclimate and highlights the lack of heating. Figure 2 shows humid tempered weather, where both deprivation of heating and air conditioning are at a similar level.
For the second case, where the average temperatures were used, only the semi-humid warm region needed air-conditioning appliances. However, it only had an incidence of 0.36. The larger deprivation presented in most of the regions is the lack of refrigerator. Only in the semi-humid warm and humid warm was the larger deprivation was the type of cooking fuel used. Figure 3 shows the semi-humid warm weather where this can be seen. The incidence for the air conditioning, while existing, cannot be seen due to the low value it poses in relation to the resolution of the figure. Figure 4 presents tempered weather, highlighting that the refrigerator is the deprivation with the larger incidence.
This analysis shows that the first case is more sensible to the weather variations and allows a more accurate assessment of thermal comfort conditions in each location. In this regard, we have a better approximation to the energy needed by a household to achieve thermal comfort. The following MEPI, MEPI comfort and MEDI will be calculated considering the annual average maximum and minimum temperatures.

3.2. Specific Urban Areas

A specific capital city was selected in each bioclimatic region as part of the bioclimatic analysis. The aim is to observe the differences on energy poverty measurements when using MEPI, MEPI with thermal comfort and MEDI. In all the cities, the level of the index regarding energy poverty is larger when using MEPI with thermal comfort instead of MEPI (except in Xalapa where is the same), and is larger when using MEDI instead of MEPI with thermal comfort, highlighting that MEDI might show better resolution when identifying people on energy poverty, since the weights for each dimension and variable were chosen by Mexican experts on energy access and poverty. Table 6 shows the differences between both MEPIs and MEDI as well as the maximum, minimum and average temperatures in each city.
When using average maximum and minimum temperatures, all the capital cities need heating and, excluding Toluca, all the cities need air conditioning. On the other hand, when using annual average temperatures, none of the selected cities would need heating or air conditioning. Another important finding is that the second and the third largest cities in the country, Guadalajara and Monterrey, have a MEPI of zero; that is, there seems to be no energy poverty in those cities; however, when using both MEPI with thermal comfort or MEDI, the two cities show households with energy poverty. This is due to the lack of appliances to attain thermal comfort.

4. Discussion

The analysis of energy poverty in cities becomes more relevant due to the high share of the population that lives in urban areas and, knowing the share is going to get significantly higher in the future, both in the world and in Mexico. The large number of people living together in mega urban areas might foster the lack of access to energy services. The alleviation of energy poverty is a challenge that must be addressed with context-related measures. One very interesting approach arises from fostering Positive Energy Districts. In this regard, we know that “In 2018 Europe, 39.3% of the population lived in the cities, 31.6% lived in towns and suburbs” [24], that is, more than 70% of Europe’s population is concentrated in urban spaces. Also, according to [25], more than 40% of Europe’s residential buildings were built before 1960, and 50% between 1960 and 1990. Considering that buildings account for 40% of energy consumption, 36% of CO2 emissions and 55% of electricity consumption, renovation of those dwellings is critical. Then for Europe, the reduction of energy consumption and CO2 emissions must be urgently addressed by city planners, developers, and operators by considering a systemic approach. A proposal to analyse the refurbishment of cities at district level has been considered as critical, and even the objective to obtain positive energy districts has been put forward by Yvann Nzengue and co-authors [26].
In 2013, Mexico announced a new approach to housing and urban policy, calling for a more explicit qualitative focus on housing and the urban environment. Nevertheless, it was more a quantitative push for formal housing, which came with quantitative costs: inefficient development patterns resulting in a hollowing out of city centres and the third-highest rate of urban sprawl in the Organization for Economic Cooperation and Development (OECD); increasing motorization rates; a significant share of vacant housing, with one-seventh of the housing stock uninhabited in 2010; housing developments with inadequate access to public transport and basic urban services; and social segregation [27].
The OECD [28] considered that Mexico´s moderate growth over the past two decades has been supported by oil wealth, working age population growth, and open trade and investment policies. Despite this growth, Mexico has not converged towards higher living standards and the gap in GDP per capita with the OECD average and the United States has not narrowed. Informal work remains high, encompassing nearly 60% of formal jobs and about a quarter of GDP. Inequality and poverty declined only moderately, and large gaps prevail between regions while poverty disproportionately affects the indigenous population.
Andres Manuel Lopez Obrador, President of Mexico, announced in one of his daily briefings that his government established as a priority area the recovery of homes in both low-income and housing areas to revive the construction sector and the consumption of building materials [29]. Furthermore, Roman Meyer, Mexican Minister for Agriculture, Territorial and Urban Development, explained in a briefing that of the 34 million households in the country, 9.4 million have underdevelopment issues, and that 79% of those are due to precarious building materials. He also revealed that there are about 650 thousand abandoned dwellings, of which 175 thousand will be recovered by the government, and the federal government will also provide all services to their urban surroundings. The programs will be financed directly to the inhabitants to promote self-construction or by individual contracting of local building workers. Therefore, in the short-term context, one can surmise that the establishment of federal energy programs for household development will be a difficult task.
Nevertheless, according to the Mexican National Council of Population (CONAPO, in Spanish) the Mexican population was 128 million as of 2020 and is projected to be 148 million by 2050 [30]. If accurate, if a 90 to 10 percentage ratio is taken for urban to rural distribution and a density of four people per house is considered, at least four million dwellings with pertinent urban infrastructure must be built. This gives the opportunity to establish programs for energy savings using renewable energies and developing positive energy districts.

5. Conclusions

Few papers address the evaluation of energy poverty in urban spaces and take into consideration thermal comfort and the climatic features of the evaluated regions. To have a better understanding of how energy poverty presents, and which are the factors that cause it, is a first step in alleviating the situations that many people in the world, especially in cities, are facing. There is no doubt that thermal comfort is a critical matter when analysing energy consumption. From heating devices in winter, to cooling devices in summer, energy consumption is greatly affected by these appliances. Its importance has been addressed by several studies [14,15,31]. We highlight its importance in urban dwellings not only because of the actual and forecasted population concentration in cities, but also considering possible district-focused strategies to alleviate it.
One of the main contributions of this paper is the application of MEDI, based on the structure of Nussbaumer et al.’s MEPI by adding the dimension of thermal comfort and using the bioclimatic regions for its evaluation. MEDI and MEPI are both useful for the evaluation of energy poverty; however, the results indicate that the multidimensional index is 2.5-fold when using MEDI instead of MEPI. This last part is evidence of the much larger incidence of energy poverty when considering thermal comfort. These findings are useful for policy makers when addressing energy poverty, both in rural and urban areas.
One of the most difficult challenges to properly assess thermal comfort lies in the regional differences on climate and the individual perception as well as its ability to adapt to it. Our research is one of the first attempts to include annual average temperatures (maximum, mean and minimum), as a parameter to consider while evaluating a household vulnerability in regard with thermal comfort. We chose 10 Mexican main cities, each in a different bioclimatic region, to show the difference that considering thermal comfort poses while measuring energy poverty. To do this, we used two different thresholds. The first only took into consideration annual average mean temperatures, while the second had a double-sided criterion, taking, for one side, the annual average minimum temperature, and for the other side, the annual average maximum temperature. The latter was a more accurate measure, since it considers a wider range of temperatures.
Assessing EP by considering thermal comfort in urban spaces is key to better understand the regional distribution of households classified by their energy accessibility and consumption. Since the calculation for EP can be done by localities or districts, mapping different EP conditions can help urban planning and policy making to foster locally the emergence of PEDs where EP is low, and connecting these PEDs with districts that exhibit high levels of EP. Since non-EP districts have the economic possibility to invest in renewable infrastructure, local governments can promote the development of PEDs. This energy solidarity model can be applied to urban and periurban zones, complementing energy needs of those in energy poverty.

Author Contributions

Conceptualization, K.G.C., T.R.-B.; Data curation, T.R.-B.; Formal analysis, K.G.C., T.R.-B., O.S.S. and M.M.; Investigation, K.G.C., T.R.-B., O.S.S. and M.M.; Methodology, K.G.C., T.R.-B. and O.S.S.; Project administration, K.G.C. and M.M.; Software, T.R.-B.; Supervision, K.G.C. and M.M.; Validation, K.G.C., O.S.S. and M.M.; Visualization, T.R.-B.; Roles/Writing–original draft, K.G.C., T.R.-B., O.S.S. and M.M.; Writing–review & editing, O.S.S., K.G.C. and M.M. All authors have read and agreed to the published version of the manuscript.

Funding

The authors want to gratefully to IER-UNAM internal project: Social Demand of energy for the financial support.

Institutional Review Board Statement

Not applicable.

Informed Consent Statement

Not applicable.

Acknowledgments

The authors O.S.S. and T.R.-B. want to gratefully acknowledge the financial support from the Mexican Consejo Nacional de Ciencia y Tecnología (CONACyT) awarded under their PhD. grant number 495905 and 794456, respectively.

Conflicts of Interest

The authors declare no conflict of interest.

References

  1. Kyprianou, I.; Serghides, D.K.; Varo, A.; Gouveia, J.P.; Kopeva, D.; Murauskaite, L. Energy poverty policies and measures in 5 EU countries: A comparative study. Energy Build. 2019, 196, 46–60. [Google Scholar] [CrossRef]
  2. United Nations Development Programme (2000). World Energy Assessment. Energy and the Challenge of Sustainability. Available online: https://www.undp.org/sites/g/files/zskgke326/files/publications/World%20Energy%20Assessment-2000.pdf (accessed on 1 May 2021).
  3. United Nations. Goal 11: Make cities Inclusive, Safe, Resilient and Sustainable. Available online: https://www.un.org/sustainabledevelopment/cities/. (accessed on 1 May 2021).
  4. Robinson, C.; Bouzarovski, S.; Lindley, S. ‘Getting the measure of fuel poverty’: The geography of fuel poverty indicators in England. Energy Res. Soc. Sci. 2018, 36, 79–93. [Google Scholar] [CrossRef]
  5. Nathan, H.S.K.; Hari, L. Towards a new approach in measuring energy poverty: Household level analysis of urban India. Energy Policy 2020, 140, 111397. [Google Scholar] [CrossRef]
  6. Roberts, D.; Vera-Toscano, E.; Phimister, E. Fuel poverty in the UK: Is there a difference between rural and urban areas? Energy Policy 2015, 87, 216–223. [Google Scholar] [CrossRef] [Green Version]
  7. García-Ochoa, R.; Graizbord-Ed, B. Privation of energy services in Mexican households: An alternative measure of energy poverty. Energy Res. Soc. Sci. 2016, 18, 36–49. [Google Scholar] [CrossRef]
  8. Bruck, A.; Diaz Ruano, S.; Auer, H. A Critical Perspective on Positive Energy Districts in Climatically Favoured Regions: An Open-Source Modelling Approach Disclosing Implications and Possibilities. Energies 2021, 14, 4864. [Google Scholar] [CrossRef]
  9. Rehman, H.; Reda, F.; Paiho, S.; Hasan, A. Towards positive energy communities at high latitudes. Energy Convers. Manag. 2019, 196, 175–195. [Google Scholar] [CrossRef]
  10. Frontiers. Positive Energy Districts: Transforming Urban Areas into High Efficiency Districts with Local Renewable Generation and Storage. Available online: https://www.frontiersin.org/research-topics/14941/positive-energy-districts-transforming-urban-areas-into-high-efficiency-districts-with-local-renewab#overview. (accessed on 1 May 2021).
  11. Hedman, Å.; Rehman, H.U.; Gabaldón, A.; Bisello, A.; Albert-Seifried, V.; Zhang, X.; Guarino, F.; Grynning, S.; Eicker, U.; Neumann, H.-M.; et al. IEA EBC Annex83 Positive Energy Districts. Buildings 2021, 11, 130. [Google Scholar] [CrossRef]
  12. Hearn, A.X.; Castaño-Rosa, R. Towards a Just Energy Transition, Barriers and Opportunities for Positive Energy District Creation in Spain. Sustainability 2021, 13, 8698. [Google Scholar] [CrossRef]
  13. Nussbaumer, P.; Bazilian, M.; Modi, V. Measuring energy poverty: Focusing on what matters. Renew. Sustain. Energy Rev. 2012, 16, 231–243. [Google Scholar] [CrossRef] [Green Version]
  14. Robles-Bonilla, T.; Cedano, K.G. Addressing Thermal Comfort in Regional Energy Poverty Assessment with Nussbaumer’s MEPI. Sustainability 2021, 13, 352. [Google Scholar] [CrossRef]
  15. Thomson, H.; Simcock, N.; Bouzarovski, S.; Petrova, S. Energy & Buildings Energy poverty and indoor cooling: An overlooked issue in Europe. Energy Build. 2019, 196, 21–29. [Google Scholar] [CrossRef] [Green Version]
  16. Kostoff, R.N.; del Río, J.A.; Cortés, H.D.; Smith, C.; Smith, A.; Wagner, C.; Karypis, G.; Malpohl, G.; Tshiteya, R. Clustering methodologies for identifying country core competencies. J. Inf. Sci. 2007, 33, 21–40. [Google Scholar] [CrossRef] [Green Version]
  17. Karakounos, I.; Dimoude, A.; Zoras, S. The influence of bioclimatic urban redevelopment on outdoor thermal comfort. Energy Build. 2018, 158, 1266–1274. [Google Scholar] [CrossRef]
  18. Gaitani, N.; Mihalakakou, G.; Santamouris, M. On the use of bioclimatic architecture principles in order to improve thermal comfort conditions in outdoor spaces. Build. Environ. 2007, 42, 317–324. [Google Scholar] [CrossRef]
  19. Pontes, R.H.; Najjar, M.K.; Hammad, A.W.A.; Vazquez, E.; Haddad, A. Adapting the Olgyay bioclimatic chart to assess local thermal comfort levels in urban regions. Clean Techn. Environ. Policy 2021, 23, 1–15. [Google Scholar] [CrossRef]
  20. Calixto Aguirre, V.I.; Huelsz, G. Consumo de energía en edificios en México. Legado Arquit. Diseño 2018, 24, 40–47. [Google Scholar]
  21. INEGI (National Institute of Statistic and Geography). National Survey of Household Income and Expenditure (ENIGH). 2018 New Series, Microdata. Available online: https://www.inegi.org.mx/programas/enigh/nc/2018/#Microdatos (accessed on 1 May 2018).
  22. INEGI (National Institute of Statistic and Geography). National Survey of Household Income and Expenditure (ENIGH). 2018 New Series, Documentation. Available online: https://www.inegi.org.mx/programas/enigh/nc/2018/ (accessed on 1 May 2018).
  23. CONAGUA. National Meteorological Service. Available online: https://smn.conagua.gob.mx/es/climatologia/pronostico-climatico/temperatura-form, (accessed on 20 September 2019).
  24. Eurostat. Urban and rural living in the EU. Available online: https://ec.europa.eu/eurostat/web/products-eurostat-news/-/EDN-20200207-1 (accessed on 19 December 2020).
  25. Encore. Old European Building Stock. Available online: http://encorebim.eu/en/news/third-new (accessed on 19 December 2020).
  26. Nzengue, Y.; Boishamon, A.; Laffont-Eloire, K. Planning City Refurbishment: An Exploratory Study at District Scale. Available online: http://www.sinfonia-smartcities.eu/contents/knowledgecenterfiles/planning-city-refurbishment--an-exploratory-study-at-district-scale.pdf (accessed on 10 November 2020).
  27. OECD. OECD Urban Policy Reviews: Mexico 2015: Transforming Urban Policy and Housing Finance, OECD Urban Policy Reviews, OECD Publishing: Paris, France 2015. Available online: https://read.oecd-ilibrary.org/urban-rural-and-regional-development/oecd-urban-policy-reviews-mexico-2015_9789264227293-en#page1 (accessed on 20 September 2020).
  28. OECD. OECD Economic Surveys: Mexico 2019. Available online: https://www.oecd.org/economy/surveys/Mexico-2019-OECD-economic-survey-overview.pdf (accessed on 2 December 2020).
  29. Andrés Manuel López Obrador. Programas de Vivienda Generan Empleos y Reactivan la Economía. Conferencia Presidente AMLO [Video]. Available online: https://youtu.be/12BlYyebe8c (accessed on 3 December 2020).
  30. CONAPO. Demographic Indicators of Mexico from 1950 to 2050. Available online: http://www.conapo.gob.mx/work/models/CONAPO/Mapa_Ind_Dem18/index_2.html (accessed on 20 September 2019).
  31. Ormandy, D.; Ezratty, V. Health and thermal comfort: From WHO guidance to housing strategies. Energy Policy 2012, 49, 116–121. [Google Scholar] [CrossRef]
Figure 1. Humid warm weather.
Sustainability 13 10646 g001
Figure 2. Humid tempered weather.
Sustainability 13 10646 g002
Figure 3. Semi-humid warm weather.
Sustainability 13 10646 g003
Figure 4. Tempered weather.
Sustainability 13 10646 g004
Table 1. MEPI information [13].
DimensionIndicator (Weight)VariableDeprivation Limit (Poor If…)
CookingModern cooking fuel (0.2)Type of cooking fuelUse any fuel besides electricity, LPG, kerosene, natural gas or biogas
Indoor pollution (0.2)Food cooked on stove or open fire (no hood/chimney) if using any fuel beside electricity, LPG, natural gas or biogasTrue
LightingElectricity access (0.2)Has access to electricityFalse
Services provided by means of household appliancesHousehold appliance ownership (0.13)Has a fridgeFalse
Entertainment/ educationEntertainment/education appliance ownership (0.13)Has a radio or televisionFalse
CommunicationTelecommunication means (0.13)Has a phone land line or a mobile phoneFalse
Table 2. Thermal comfort dimension [14].
DimensionIndicatorVariableDeprivation Cut-Off
(Poor If…)
Thermal comfortThermal comfort accessHas an air conditioner or heatingFalse
Table 3. Keywords in 85 papers about thermal comfort and energy poverty.
ConsumptionLow-Income Households
HealthClimate
MortalityVulnerability
ImpactEnergy justice
Energy deprivationExtreme temperature
MitigationOlder people
Excess winter deathsEfficiency
Table 4. Proportional weights of original MEPI when adding thermal comfort [14].
DimensionIndicatorVariableWeight
CookingModern cooking fuelType of cooking fuel0.18
Indoor pollutionFood cooked on stove or open fire0.18
LightingElectricity AccessHas Access to electricity0.18
Services provide by means of household appliancesHousehold appliance ownershipHas a fridge0.115
Entertainment/educationEntertainment/education appliance ownershipHas a radio or television0.115
CommunicationTelecommunication meansHas a phone land line or a mobile phone0.115
Thermal comfortThermal comfort accessHas an air conditioner or heating0.115
Table 5. MEDI information [14].
DimensionIndicatorVariableWeight
CookingModern cooking fuelType of cooking fuel0.13
Indoor pollutionFood cooked on stove or open fire0.13
LightingElectricity AccessHas Access to electricity0.24
Services provide by means of household appliancesHousehold appliance ownershipHas a fridge0.21
Entertainment/educationEntertainment/education appliance ownershipHas a radio or television0.08
CommunicationTelecommunication meansHas a phone land line or a mobile phone0.07
Thermal comfortThermal comfort accessHas an air conditioner or heating0.14
Table 6. MEPI and MEDI of capital cities in each bioclimatic region.
RegionCapital CityMEPIMEPI ComfortMEDITminTmaxTaver
Humid warmCampeche0.0240.0600.0706.044.027.0
Dry warmMonterrey0.0000.0330.039−8.044.023.1
Extreme dry warmHermosillo0.0130.0290.036−7.549.025.5
Semi-humid warmCiudad Victoria0.0060.0310.040−4.044.022.7
Semi-coldToluca0.0070.0140.045−4.026.014.2
Humid semi-coldXalapa0.0500.0500.0606.034.019.0
Dry semi-coldPachuca0.0030.0490.059−2.731.016.0
TemperateGuadalajara0.0000.0180.0224.037.521.0
Humid temperateTepic0.0040.0420.0498.235.023.0
Dry temperateOaxaca0.0150.0800.0948.039.523.0
Publisher’s Note: MDPI stays neutral with regard to jurisdictional claims in published maps and institutional affiliations.

