Article

Investigating the Effect of High-Rise Buildings’ Mass Geometry on Energy Efficiency within the Climatic Variation of Egypt

Architecture Department, Faculty of Engineering, Minia University, El-Minya 61519, Egypt
*
Author to whom correspondence should be addressed.
Sustainability 2021, 13(19), 10529; https://doi.org/10.3390/su131910529
Submission received: 26 August 2021 / Revised: 11 September 2021 / Accepted: 13 September 2021 / Published: 23 September 2021
(This article belongs to the Special Issue Buildings and Sustainable Energy: Technologies, Policies, and Trends)

Abstract

:
Energy conservation is recently the most important issue all over the world, including in Egypt. Recently, the built environment of Egypt has experienced a dramatic change in its buildings’ typology, with more interest in constructing high-rise buildings. This in turn creates high demand for energy, as high-rise buildings are considered to be one of the most energy-consuming types of buildings. Egypt has a wide variety in its climatic conditions, with seven different inhabited climatic regions, and a further one which is uninhabited. Therefore, integrating the energy efficiency of a building as a major design factor in the early design stages of such a type of buildings is important. This article is concerned with investigating the effect of high-rise buildings’ geometrical shape on the building’s energy consumption within the different climatic regions of Egypt. Four building shapes (square, circular, rectangular, and ellipse) are examined. The long axe of the models is oriented to the north (“the optimum orientation within all regions”), with a window-to-wall ratio (WWR) of 30%. The performance of these models is studied in seven cities representing the inhabited Egyptian climatic regions using simulation software, DesignBuilder, with the EnergyPlus simulation tool. Study findings revealed that adjusting the geometric form of the building significantly affects energy consumption and thermal comfort with climatic variation. The most compact shape, circular, was the most suitable geometrical shape in four regions out of seven. The ellipse shape was found to be the most suitable mass geometry within two other regions, while the square shape was found to be effective in only one region. The results of this research indicate that designers should not use the rectangular shape anywhere across Egypt.

1. Introduction

The increasing global energy demand and the shortage of energy sources has forced our attention towards energy conservation concepts in the early design stage of buildings. The high-rise building form is considered as the most energy-consuming type of building [1,2]. Its massive mass, along with dense occupancy and complicated mechanical systems, create considerable challenges for the designers who are trying to achieve energy efficiency and thermal comfort within its enclosure [3]. Although this is a significant problem, it can be noted that the high-rise building type has been adopted by many countries, either for achieving land-use efficiency through vertical extension, or for giving the country a contemporary modern visual perception. Recently, Egypt has started to catch up with others in the high-rise building race. Therefore, the built environment of Egypt has encountered dramatic changes in its buildings’ typology as skyscrapers continue to be built in many locations across the country. This, in turn, will significantly increase the country’s overall energy consumption.
According to the recently published Egyptian Electricity Holding Company EEHC report, Egypt consumed 55.2 gigawatts of electricity in 2017/2018 [4] compared to 45 gigawatts in 2016/2017 [5], with a drastic increase of about 22.5%. The built environment in Egypt has been found to consume more than 60% of electric energy in Egypt (Figure 1) [6].
Air conditioning and lighting have been found to consume more than two-thirds of energy in Egypt’s commercial buildings sector (Figure 2) [7]. High-rise buildings are mainly used as commercial and office buildings. It was reported that high-rise buildings, and in particular office buildings, are among the most energy-consuming types of buildings [8]. Most of the overall operating energy consumption in these buildings was found to be due to their permanent reliance on HVAC systems and artificial lighting during working hours [7]. This shows that most of the energy in this type of buildings is mainly used to provide thermal comfort to the users.
The ability to generate thermal comfort for the users of a building is affected by many factors that can be controlled by the architect, such as external climatic conditions, building fabric, building envelope treatments, building mass, and orientation [9,10]. Integrating these factors in the early design stage of the building can significantly decrease energy consumption. Moreover, it is well-known that different climatic conditions impose different design requirements on buildings and how they are treated [11,12]. In addition, both the design guides and recent research indicate that building mass geometry is one of the most important design factors that significantly affects a building’s energy efficiency, and therefore should be carefully considered by architects [13].
Climatically, the Egyptian land has been classified in general by Koeppen’s climate classification as a hot, arid, desert climate, with northern and eastern costal narrow strips experiencing hot steppe climate conditions [14]. However, and for environmental design purposes, the local Housing and Building Research Center (HBRC) [15] has divided Egypt into eight different climatic design regions. A representative city was defined for each region (Figure 3). One of these regions (the Sinai high lands) is a hard mountain terrain and is uninhabited (R6). The other seven climatic design regions are: the north coast region (R1), with its representative city (Alexandria); the delta and Cairo region (R2), with its representative city (Cairo); the region of northern-upper Egypt (R3), with its representative city (El-Minya); the region of southern-upper Egypt (R4), with its representative city (Asyut); the east coast region (R5), with its representative city (Hurghada); the desert region (R7), with its representative city (El-Kharga; and finally, the region of southern Egypt (R8), with its representative city (Aswan) (Figure 3). These regions vary significantly in their climatic conditions, which in turn require different architectural considerations to be integrated in building design for the optimum climatic and energy response.
Figure 4, Figure 5, Figure 6 and Figure 7 illustrate the climatic design regions’ variation in climatic conditions in each region’s representative city using the weather data included in its typical metrological year file (TMY).
Several studies have emphasized the strong correlation between the geometrical form of the building mass and its performance in energy consumption. The building’s energy performance is significantly affected by climatic condition variation for the same geometrical mass shape.
On one hand, most recent studies are directly concerned with the comparison of the impact of different mass shapes on energy consumption. On the other hand, other studies are concerned with the impact of the shape on the thermal gains of the building, which in turn significantly affects energy consumption. These studies were conducted in a variety of climatic regions, such as hot-arid, hot-humid, tropical, subtropical, and temperate climates.
Ramzi et al. [16] studied the impact of mass geometrical compactness on the energy consumption of buildings in the cities of Tunis and Kuwait, which experience the climatic conditions of hot, arid deserts. A parametric analysis was conducted for two building forms (rectangular and L-shape) within the two cities using a simulation tool (DOE-2). The window-to-wall ratio was set at either 0 (with no windows) or 25% for both of the shapes used. The results of the study showed that the rectangular shape consumed less energy in comparison to the L-shaped one. The researchers explained these results with reference to the higher compactness of the rectangular form than the L form, which in turn decreased the surface area of the building that was exposed to harsh external climatic conditions. However, no attention was given to the orientation of the buildings regarding the sun, which could give different results.
A similar study was conducted [17] in the hot, arid climate of Kuwait using eight different shapes of an office building with a footprint of 625 m2 and a height of 20 floors. The aim of the study was to develop a mathematical relationship between the building mass’s shape and its energy consumption, taking into account the building’s aspect ratio (width/length, or W/L), window-to-wall ratio (WWR), and variation in orientation. Eight geometrical shapes were investigated, including square, rectangular, L-shape, T-shape, cross-shape, H-shape, U-shape, and cut-shape. The parametric analysis was conducted using DOE-2 simulation software for the studied models to analyze their energy use. The results indicated that their energy use decreases as the relative compactness of the building shape increases due to variations in solar exposure for the different shapes.
Within the Mediterranean climate, a study [18] concerned with investigating the impact of a rectangular residential building mass’s aspect ratio, comprising width-to-length ratio (W/L), roof-to-walls ratio (R/W), and surface-to-volume ratio (S/V) on thermal performance, and therefore on energy consumption. The building area, the height, and the volume of the building mass were set constant at 500 m2, 20 m, and 10,000 m3, respectively. Ten W/L ratios, ranging from 0.1 to 1, were examined using Ecotect and IES simulation tools. The study concluded that S/V ratio is the main shape parameter affecting the building’s thermal performance. Moreover, a reduction of about 40% in the building’s energy consumption could be achieved when W/L = 0.8. The authors therefore recommended employing passive strategies and mass geometrical studies in the early design stages.
A hot, humid climate was targeted by two studies regarding the impact of building mass shape on either solar gain or cooling loads. Both factors could significantly affect the building’s energy consumption. The first study [19] studied the impact of high-rise buildings’ geometrical shape on the annual amount of solar gain within the hot, humid climate of Malaysia. Two open-plan office building models were used in this study, with square and circular shaped plans. They studied both shapes with varying aspect ratios (width-to-length, or W/L) while maintaining the same footprint at 1225 m2 and height at 120 m. Three aspect ratios (W/L) were simulated for each shape (1:1, 1:1.7, and 1:3) using Ecotect simulation software. They found that the solar gain of a building is directly proportional to its energy consumption. The results of the study showed that the circular building model with W/L = 1:1 achieved the lowest solar gain and in turn the lowest energy consumption in such a climate. However, the highest solar gain and worst energy consumption was achieved by the rectangular shape, with W/L = 1:3.
In the same context of Malaysia, the second study [20] investigated the relationship between the building form and the cooling loads inside the building using Ecotect simulation software. Eight buildings’ geometrical form models were built (rectangular, square, courtyard, L, T, U, ellipse, and circle) and simulated. The results showed that the most compact shapes (circle and square) achieved the lowest cooling load and in turn the lowest energy consumption. Moreover, the researchers argued that the main cause of these results is the small surface area exposed to heat penetration due to the high compactness of these shapes.
Raji et al. [11] investigated the relationship between energy efficiency and building mass shape for a high-rise office building with a footprint of 1500 m2 and a height of 40 storeys in three different climates (tropical, subtropical, and temperate) using the DesignBuilder simulation tool. For each climate type, three cities (Amsterdam, Sydney, and Singapore) were selected as representative cities for the temperate climate, subtropical climate, and tropical climate, respectively. Twelve building mass geometry shapes were modelled and tested for their energy performance in each climate. These shapes were circle, octagon, ellipse, square, triangle, rectangle, atrium, H- shape, U-shape, Z-shape, cross-shape, and Y-shape. The orientation of all the models examined was set to north, and the opening-to-wall ratio was set to 50%. The results of this study revealed that the basic geometric shapes (circle and square) achieved the highest energy performance in the different studied climates, while the Y-shape was found to be the worst performing shape across the different climates. The optimal energy performance was obtained by the ellipse shape in both temperate and subtropical climates, along with the octagon shape in the tropical climate.
In the different climatic context of China, a study was conducted [13] to improve the energy efficiency of office buildings in the city of Tianjin. Five building shape models (Square, triangle, cross, circle, and oval) of high-rise office towers with a plan footprint of 1444 m2 were tested and simulated using the DesignBuilder software. The study tested the effects of geometric shapes on a building’s energy performance. The results showed that the maximum energy saving in such a climate was achieved by the oval shape.
Limited studies are found to employ a real building as a case study in identifying the impact of a building’s mass geometry on its energy consumption. A comparative study was conducted [21] on two high-rise residential buildings in Korea in order to identify the relationship between a building’s shape and its energy consumption. The geographical location of both case studies was selected in a way to be almost identical in climatic conditions. Geometry-wise, the case studies’ masses were Y-shape and I-shape. Total electricity and gas consumption of both case studies were calculated as a fraction of the total floor area in each case. The results revealed that the linear I-shaped floor plan case performed better in terms of total electricity consumption but consumed 10% more gas than the Y-shaped one.
From the above discussion, it can be summarized that the shape of the building plays an important role in determining the energy performance of the building. There is a relationship between the compactness of the building and its energy usage. The energy consumption of a building decreases when its relative compactness increases. In addition, it was reported that energy performance is significantly affected by mass geometry within both hot and cold climates, while only a slight impact could be found in temperate climates [22]. Basic building mass shapes (circular, square, and oval) are found to achieve the best energy performance across different climates.
In light of the outlined above background and previous work, this study aims to investigate the effect of high-rise office buildings’ mass geometry on energy efficiency within the various Egyptian climatic regions. Moreover, it tries to answer this key question: Which mass geometry of high-rise building best suits climatic conditions of each Egyptian climatic design region and achieves optimum energy efficiency? Answering such a question could help designers decide which building mass shape can be adopted in which climatic region for less energy consumption.

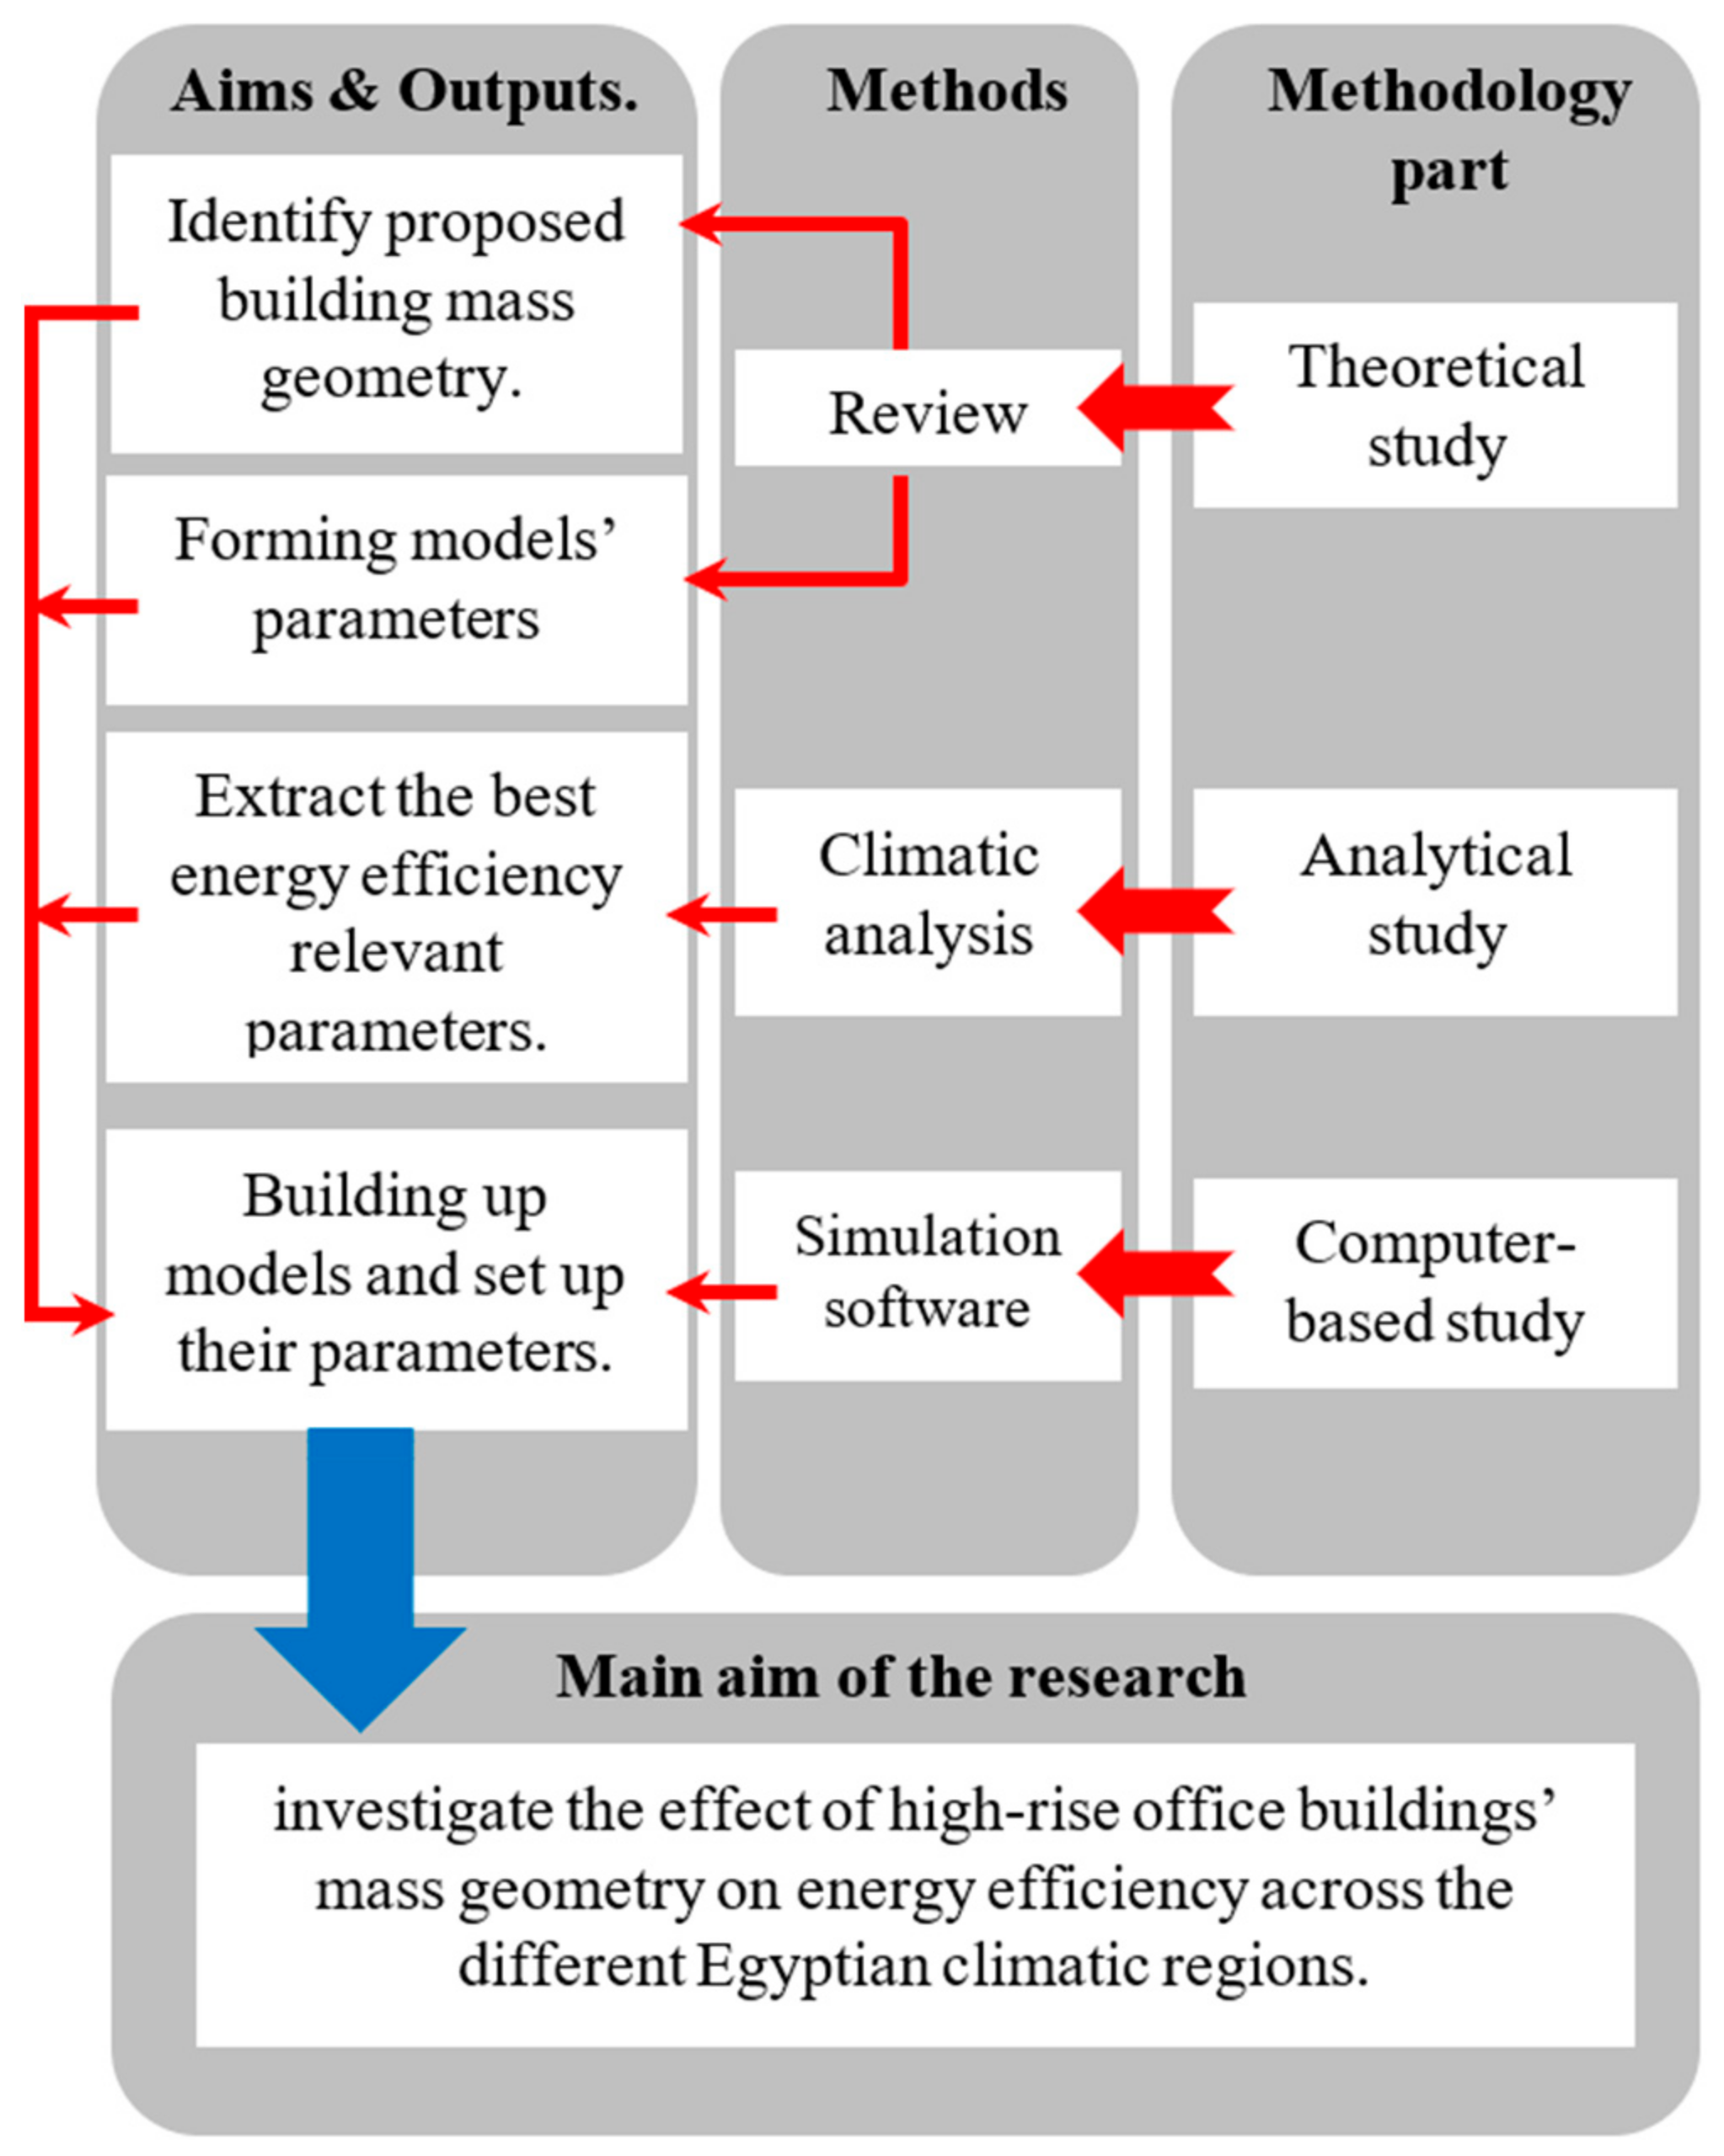
2. Materials and Methods

In order to achieve the research aim, a mixed-methodology approach is adopted, including three main parts. The first part is the theoretical study. This part depends on a theoretical review, and aims to identify the building mass geometries best suited to the Egyptian context to be adopted in this investigation. The second part is the analytical study, which aims to analyze the climatic context of the Egyptian climatic regions to extract the best energy efficiency scores of the most relevant parameters of the cases chosen in part one. The third part is the computer-based study that employs a simulation tool to investigate the energy performance of the models set by the first two parts of the methodology across each Egyptian climatic region. Figure 8 illustrates the research methodology overview.

2.1. Theoretical Study

According to the previous work discussed in the introduction, the basic geometric shapes, such as the circular and square shapes, attained the lowest energy consumption in different climatic conditions. The building width-to-length (W/L) ratios of 1:1 and 1:3 were reported by Olgay [23,24] and Yeang [25] to be the optimum in terms of heat gain within moderate and hot climates, such as Egypt’s, and in turn in energy efficiency [19]. Therefore, and by applying these two W/L ratios to both square and circle shapes, this study adopted four basic shapes (circle, square, ellipse, and rectangle). The proposed building models’ height was set at 145 m over 40 storeys, as this is the predominant high-rise building height within Egypt [26]. The footprint of all models is assumed to be 1600 m2. This area was set to achieve a surface-to-volume (S/V) ratio of the study’s models ranging between 0.096 and 0.122. The models’ S/V range was found to comply with the range that frequently resulted from the five generations classification of tall buildings based on energy consumption (0.085–0.16) [27,28]. The window-to-wall ratio (WWR) has been set at 30%, which expresses the average between the ratios of 20–30% and 30–40% recommended for temperate and tropical climates for optimum energy efficiency [11]. Table 1 illustrates the study models’ geometrical characteristics according to the review conducted during the theoretical part of the methodology.

2.2. Analytical Study

This part aims to identify the best orientation in each Egyptian climatic region, as a main climatic parameter affecting energy consumption through the climatic analysis method, which is to be applied to the models. Typical meteorological year (TMY) weather data files for each representative city of the Egyptian climatic region was analyzed using the Szokolay method [29] of solar radiation analysis integrated into the Autodesk Weather Tool software. By applying this technique, Figure 9a–g show the best orientation for the cities of Alexandria, Cairo, El-Minya, Asyut, Hurghada, El-Kharga, and Aswan, which represent the Egyptian climatic regions of R1, R2, R3, R4, R5, R7, and R8, respectively.
The analysis shows that the best orientation to achieve the minimum annual solar gain in most analyzed cities is to orient the long axes of the building to face almost north, and to extend it from east to west (Figure 9). According to this analysis, all the models’ orientation will be fixed to the north across all Egyptian climatic regions.

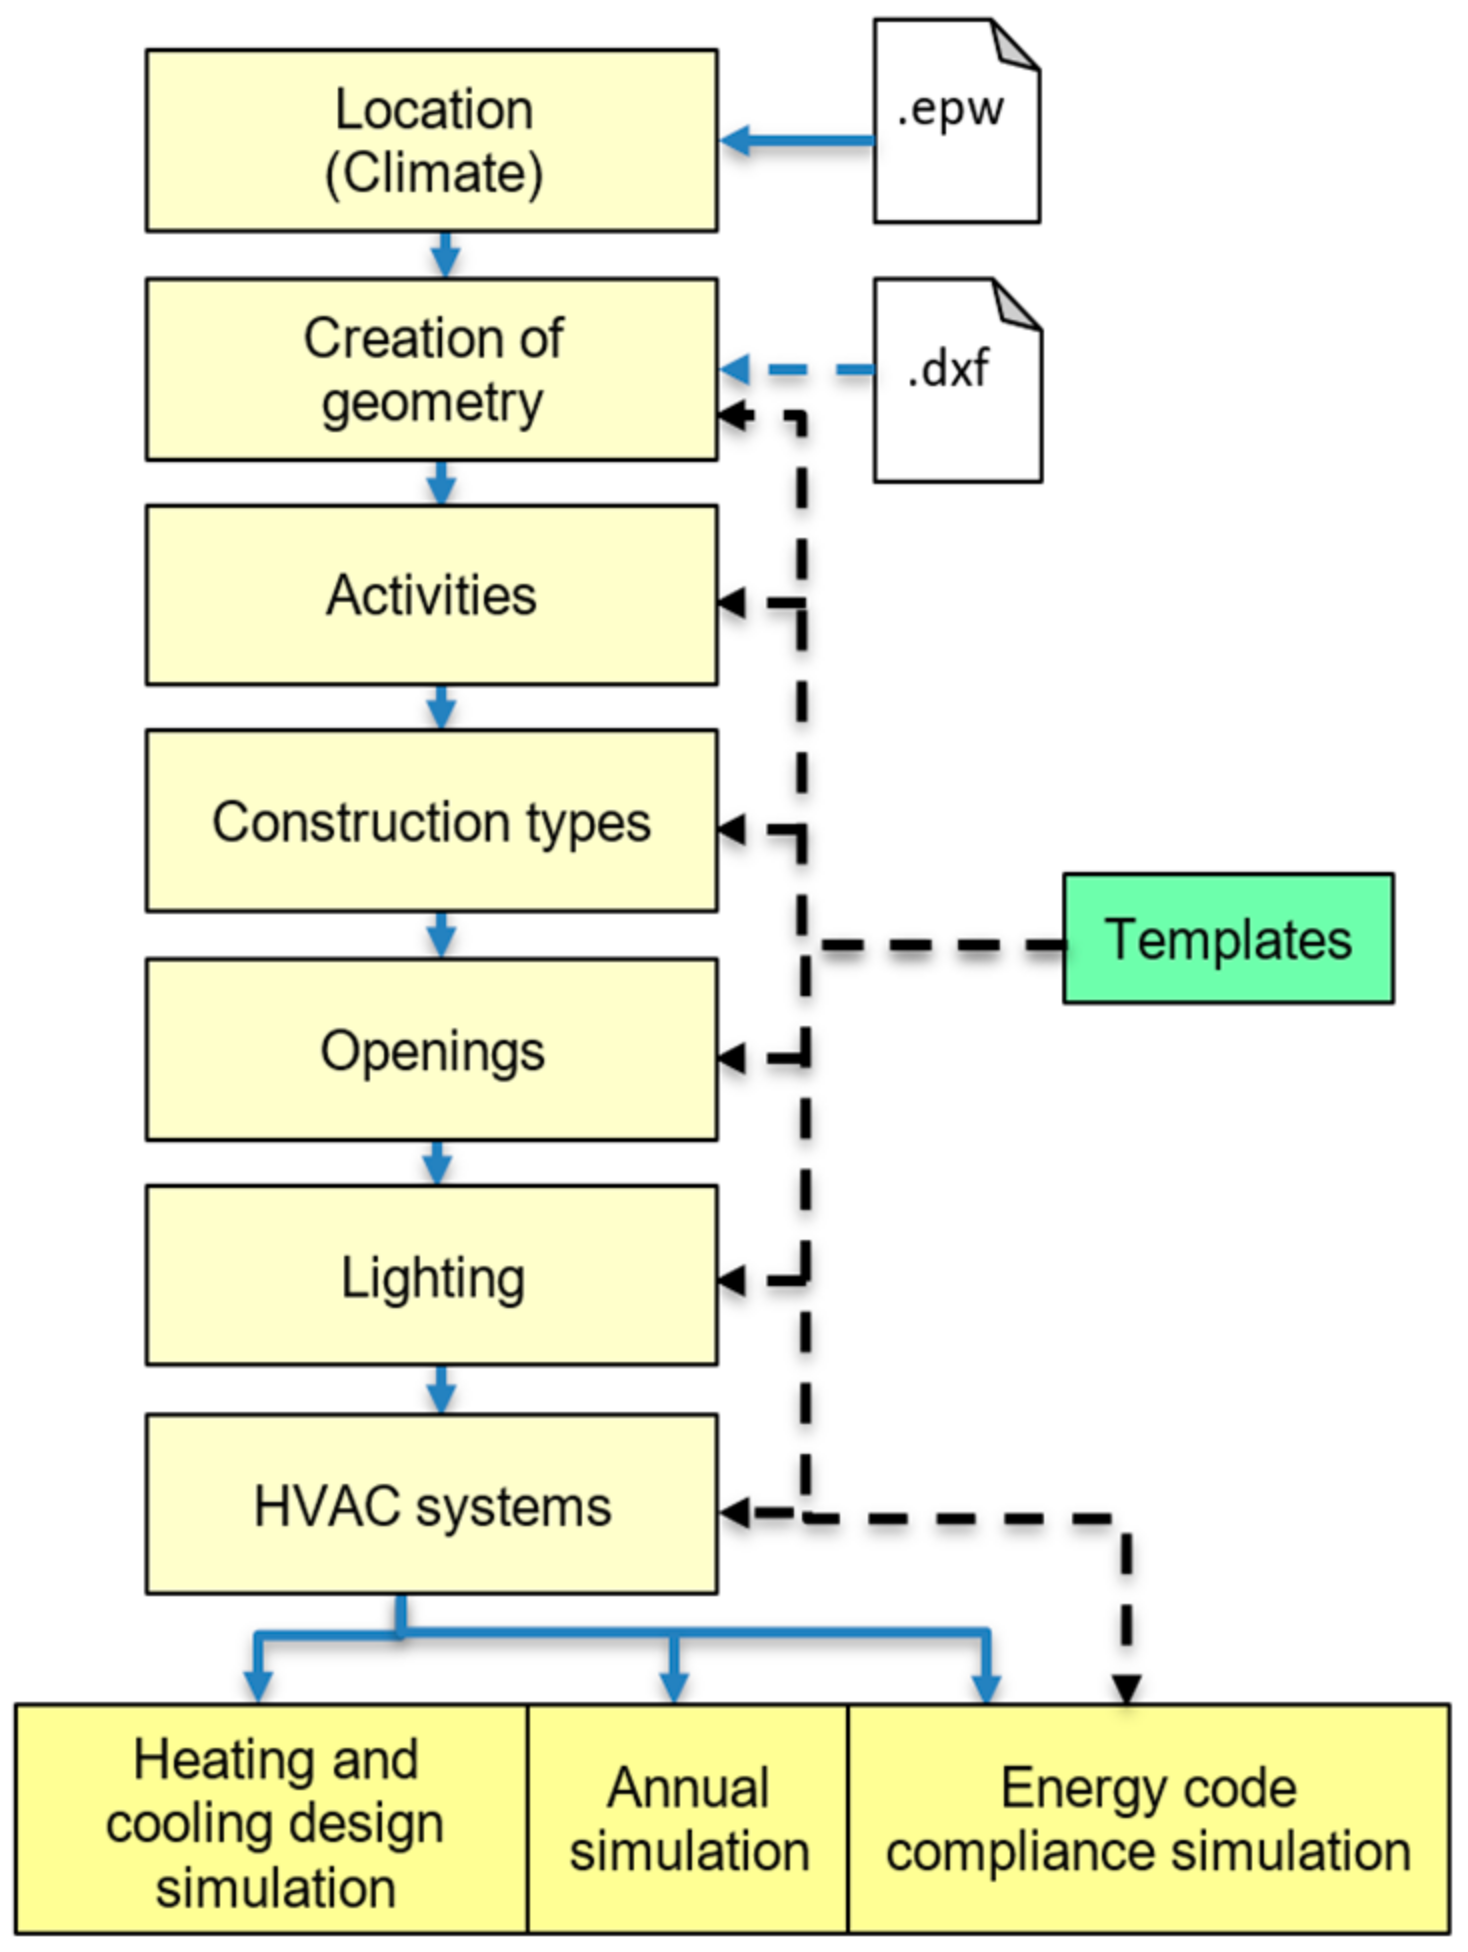
2.3. Computer-Based Study

Computational simulation is considered to be one of the most effective analysis and research methods in calculating and predicting building’s energy and thermal performance [30]. In this study, Energy Plus simulation technology has been implemented in the DesignBuilder—V6.1 energy simulation software that we adopted. This software was selected because it is powerful, offers easy modeling, and has an excellent graphical interface, along with its ability to introduce accurate calculations of energy consumption, thermal comfort, daylight, and cost [31,32]. Figure 10 illustrates the DesignBuilder workflow [33].
An open-plan office building model for each case was constructed in DesignBuilder, with characteristics and orientation formulated in Section 2.1 and Section 2.2. The TMY weather files for each representative city of the seven investigated climatic regions were assigned to the model. The occupants’ number and density were calculated as follows:
Assumptions:
  • 30% of floor area is services core and not used for office activities.
  • Each person needs (6 m2) office space.
Calculations:
  • Net office activity area = 1600 (gross floor area) − (0.3 × 1600) = 1120 m2
  • Total number of occupants = 1120/6 = 186.67 ≈ 187 Person
  • Density = 187/1600 = 0.117 Person/m2
All inputs of set points for heating, cooling, humidity control, and ventilation rate have been obtained from The Egyptian Code to Design and Execute HVAC Works [34]. The code determined that the acceptable temperature range in office building is 24–26 °C for cooling and 21:23 °C for heating, so the study relied on the highest (26 °C) and the lowest (21 °C) values. The lighting intensity was set to comply with the European standards for office activity, which report that acceptable illuminance and glare factor are 500 lux and 19, respectively [35]. During weekends, it is assumed that the lighting, equipment, and HVAC system in the office models are off.
ASHRAE [36] equation (Equation (1)) for calculating the minimum fresh air required per person was adopted and the fresh air inputs were calculated as follows:
Vbz = RP × Pz + Ra × Az
where:
  • Vbz = Breathing zone outdoor airflow
  • Az = Zone floor area
  • Pz = Zone population
  • RP = Outdoor airflow rate required per person (2.5 L/s per person for office space)
  • Ra = Outdoor airflow rate required per unit area (0.3 L/s.m2 for office spaces)
So:
Vbz = 2.5 × 187 + 0.3 × 1600 = 947.5 L/s
Fresh air per person = Vbz/zone population = 947.5/187 = 5.1 L/s per person
For the rest of model’s inputs, Table 2 includes only the customized inputs that have been amended by the authors. Inputs within the software domain other than these inputs were kept as the default values of the software.

3. Results

The computer-based study results, analysis, and discussion are presented for each representative city of each Egyptian climatic design region.

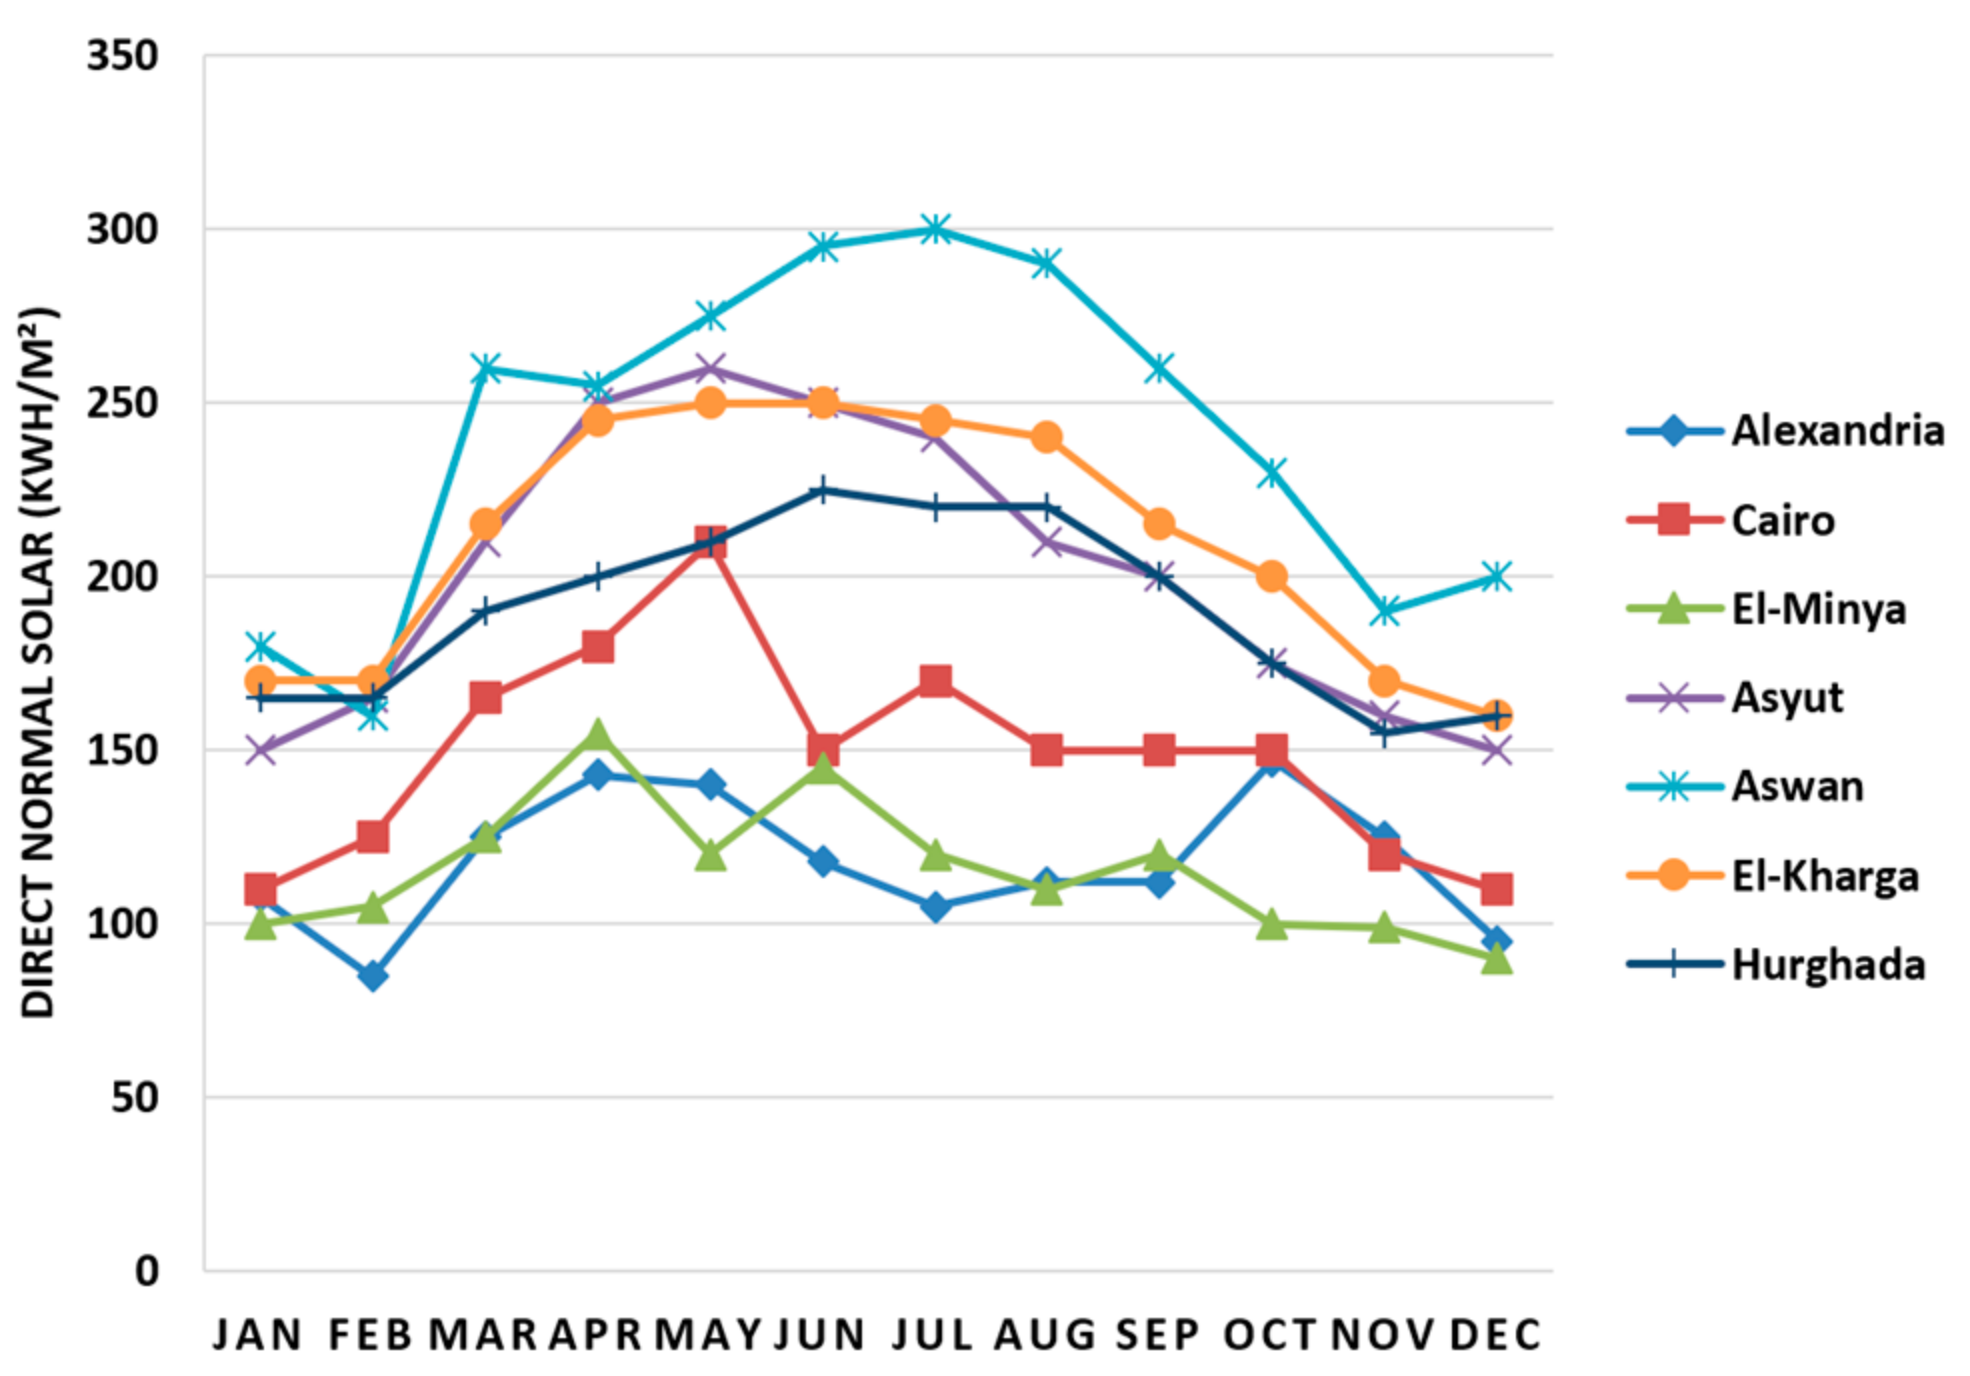
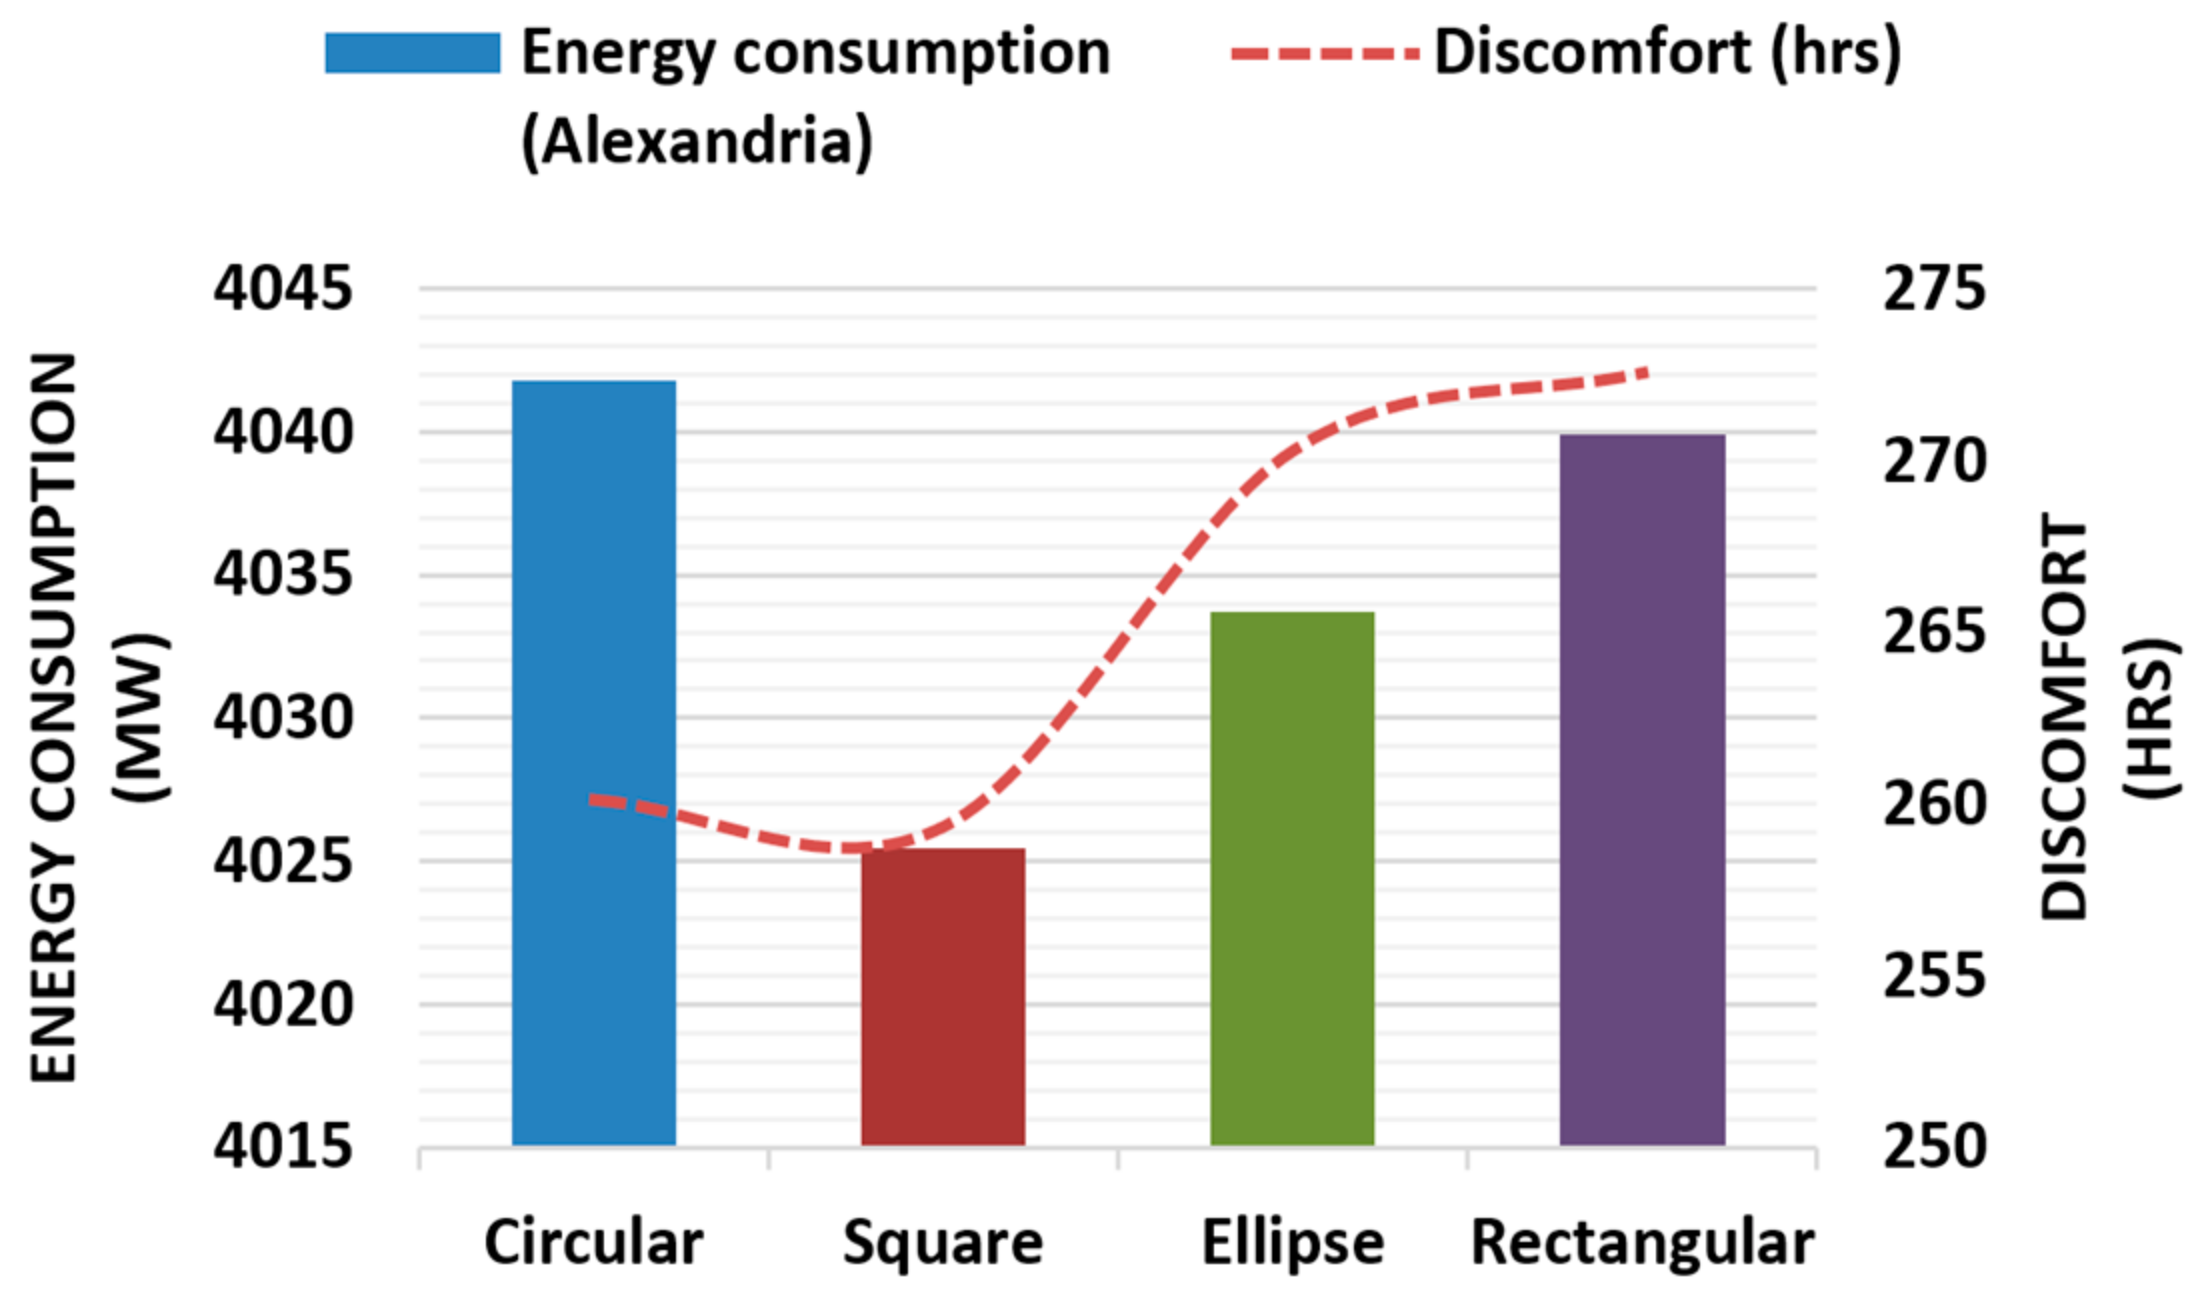
3.1. Alexandria (North Coast Region—R1)

The simulation results of the four studied geometrical shapes within (Alexandria) revealed that the square shape has achieved the lowest annual energy consumption (4025.4 megawatts) compared with the other shapes under investigation (Figure 11). In addition, it achieved the minimum hours of discomfort (259 H) during the year. In contrast, the circular shape had the highest energy consumption of 4041.8 megawatt along with, surprisingly, almost the same discomfort hours of the square-shape model. It can be clearly seen from the graph (Figure 11) that the ellipse, rectangular, and circular models increased their total energy consumption in comparison to the square model by 0.2%, 0.36%, and 0.4%, respectively. The highest time spent under discomfort condition (272 H) was observed in the rectangular-shape model.

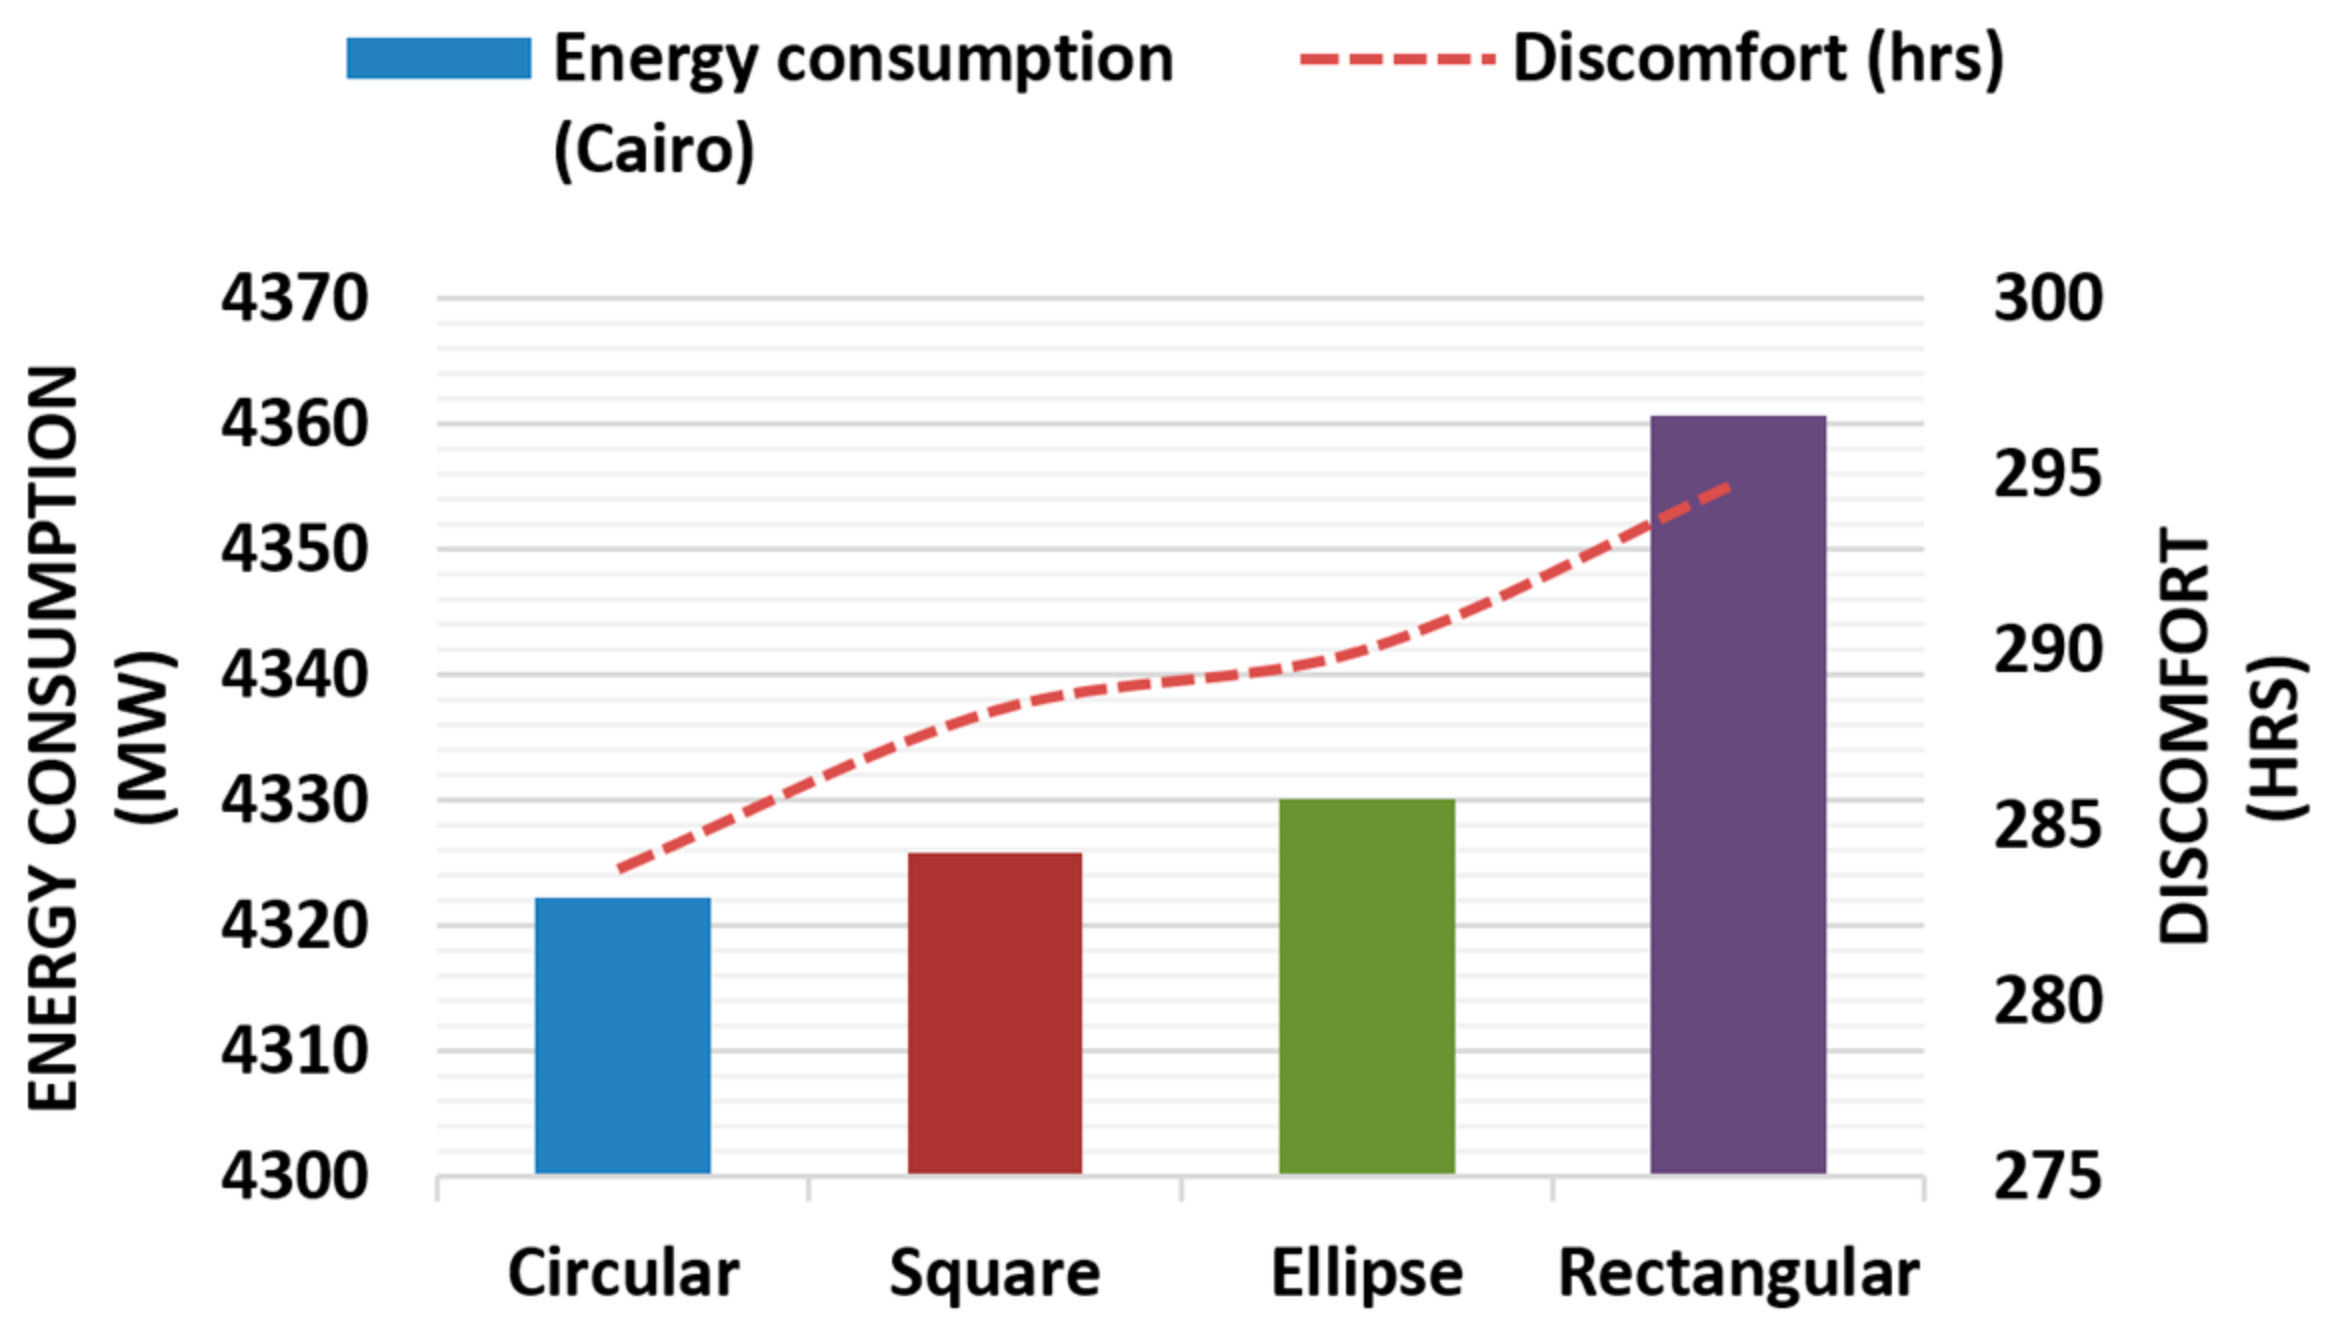
3.2. Cairo (Delta and Cairo Region—R2)

The results revealed that in Cairo the optimum energy conservation were achieved by the circular-shape model, while the rectangular model achieved the highest energy consumption. The circular model consumed only 4322.3 megawatts, which was higher by approximately 0.08%, 0.18%, and 0.89% in the square, ellipse, and rectangular shapes, respectively (Figure 12). Discomfort hours followed the same trend as energy consumption, achieving the lowest value (283.8 H) within the circular shape and the highest one (294.8 H) in the rectangular shape.

3.3. El-Minya (Region of Northern Upper Egypt—R3)

For El-Minya, the results (Figure 13) show almost the same performance of the examined shapes as with Cairo. The circular shape had the lowest total energy use of about 4296.12 megawatts, while the rectangular model had the highest total energy consumption of about 4353.8 megawatts, with a nearly 1.34% increase in energy consumption. Both the square- and ellipse-shape models had a respective energy consumption of only 0.42% and 0.48%, more than the optimum (circular) shape. Moreover, the same trend was followed in discomfort hours.

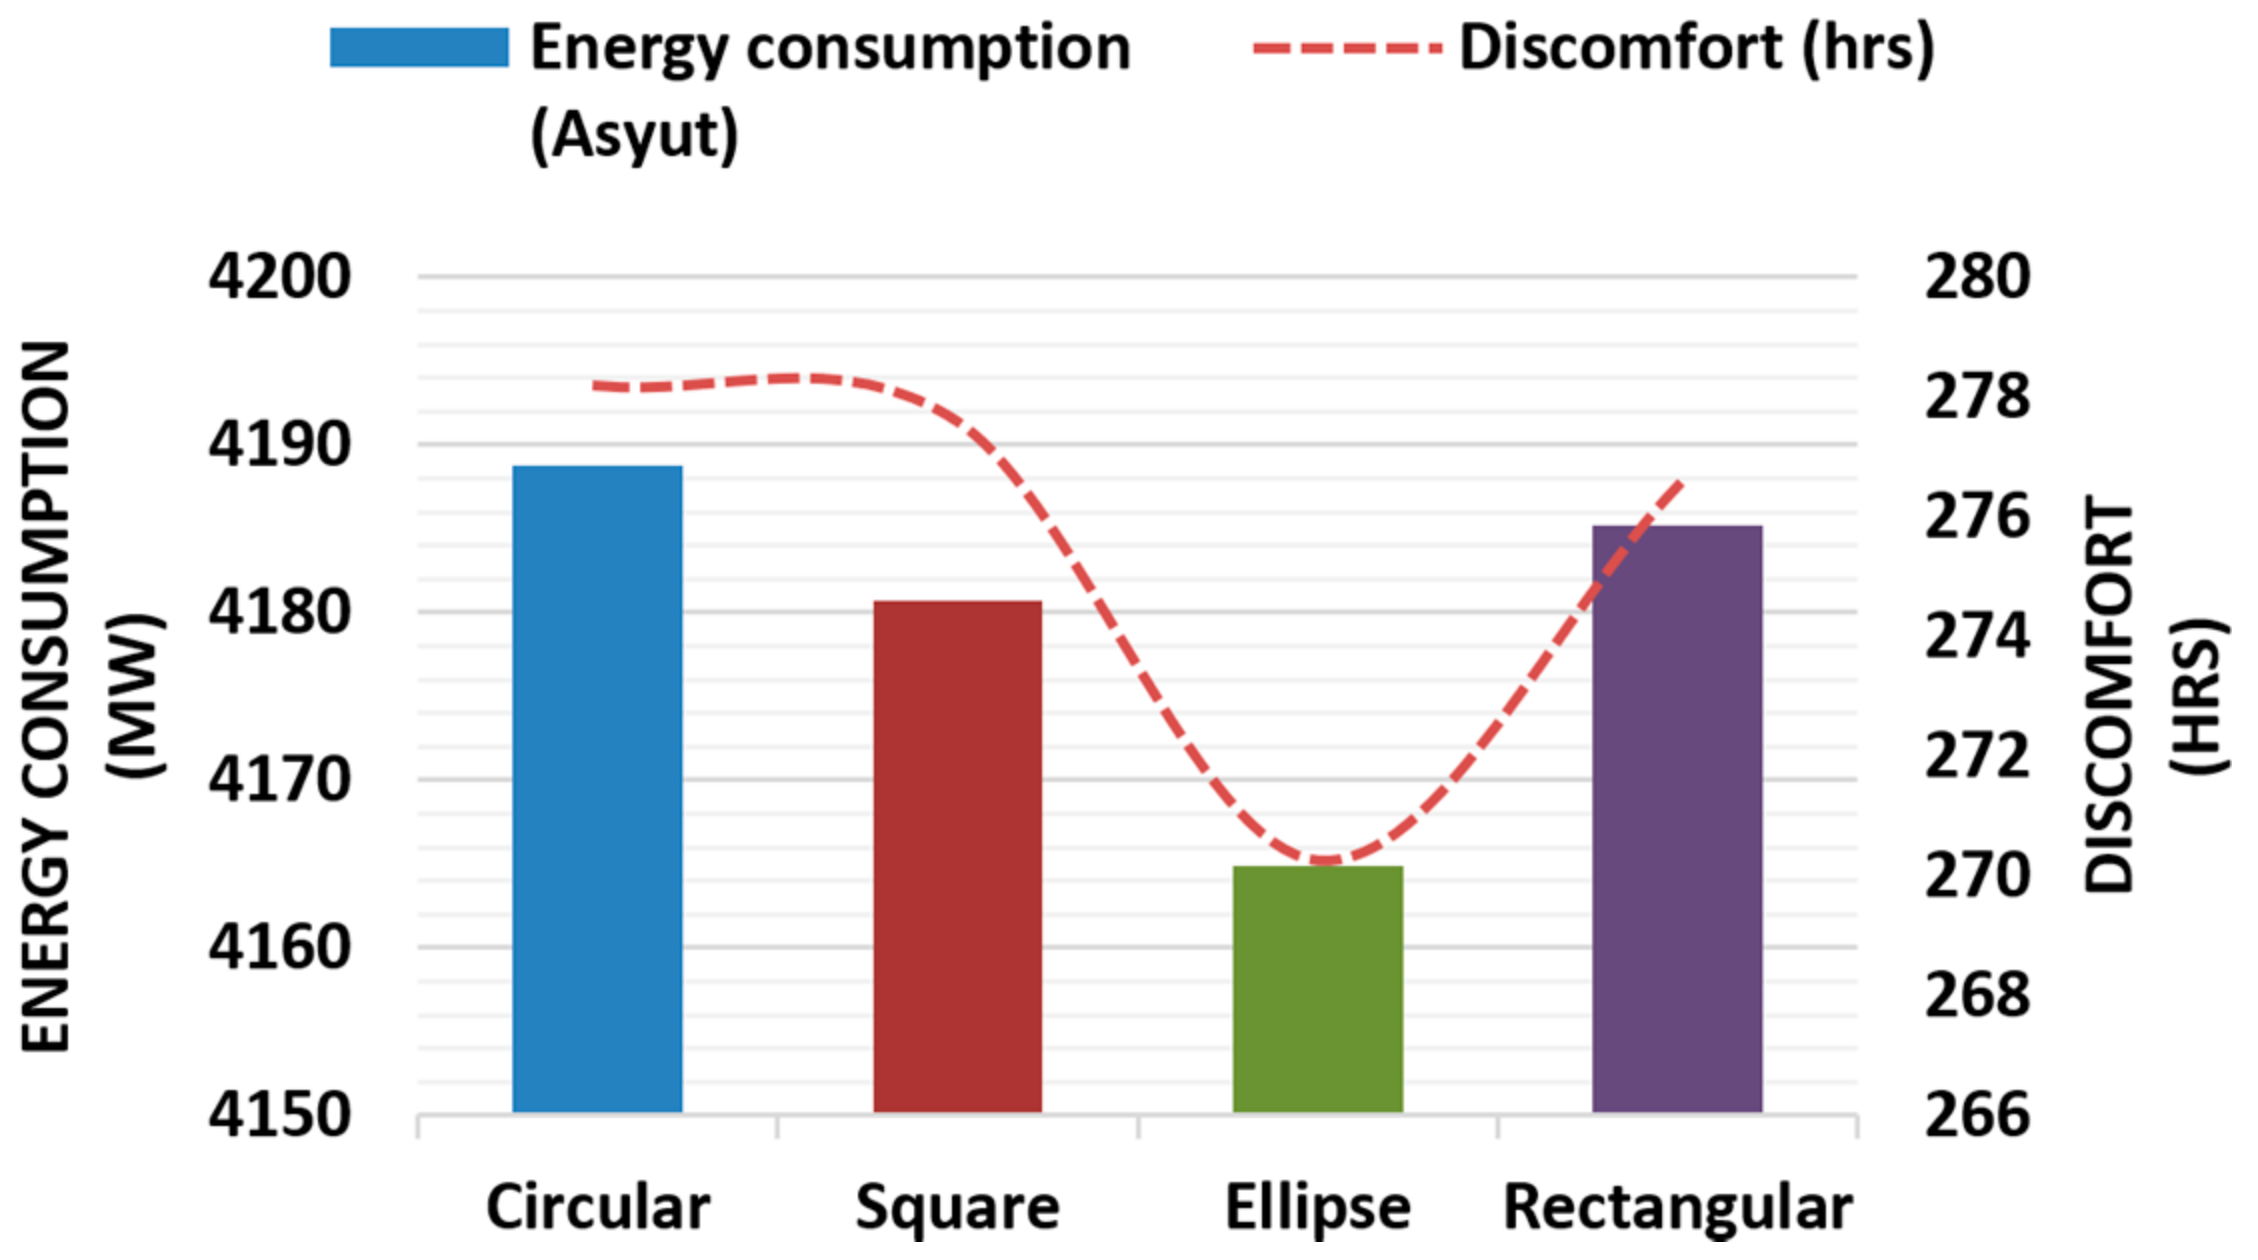
3.4. Asyut (Region of Southern Upper Egypt—R4)

In Asyut, the results (Figure 14) indicated that the ellipse shape has consumed the lowest amount of energy, along with the lowest duration spent under thermally discomfortable conditions. The highest values for both total energy consumption and discomfort hours had been achieved by the circular shape. The ellipse-shape model saved energy consumption by almost 0.6% compared to the circular one, with a difference of 23.81 megawatts.

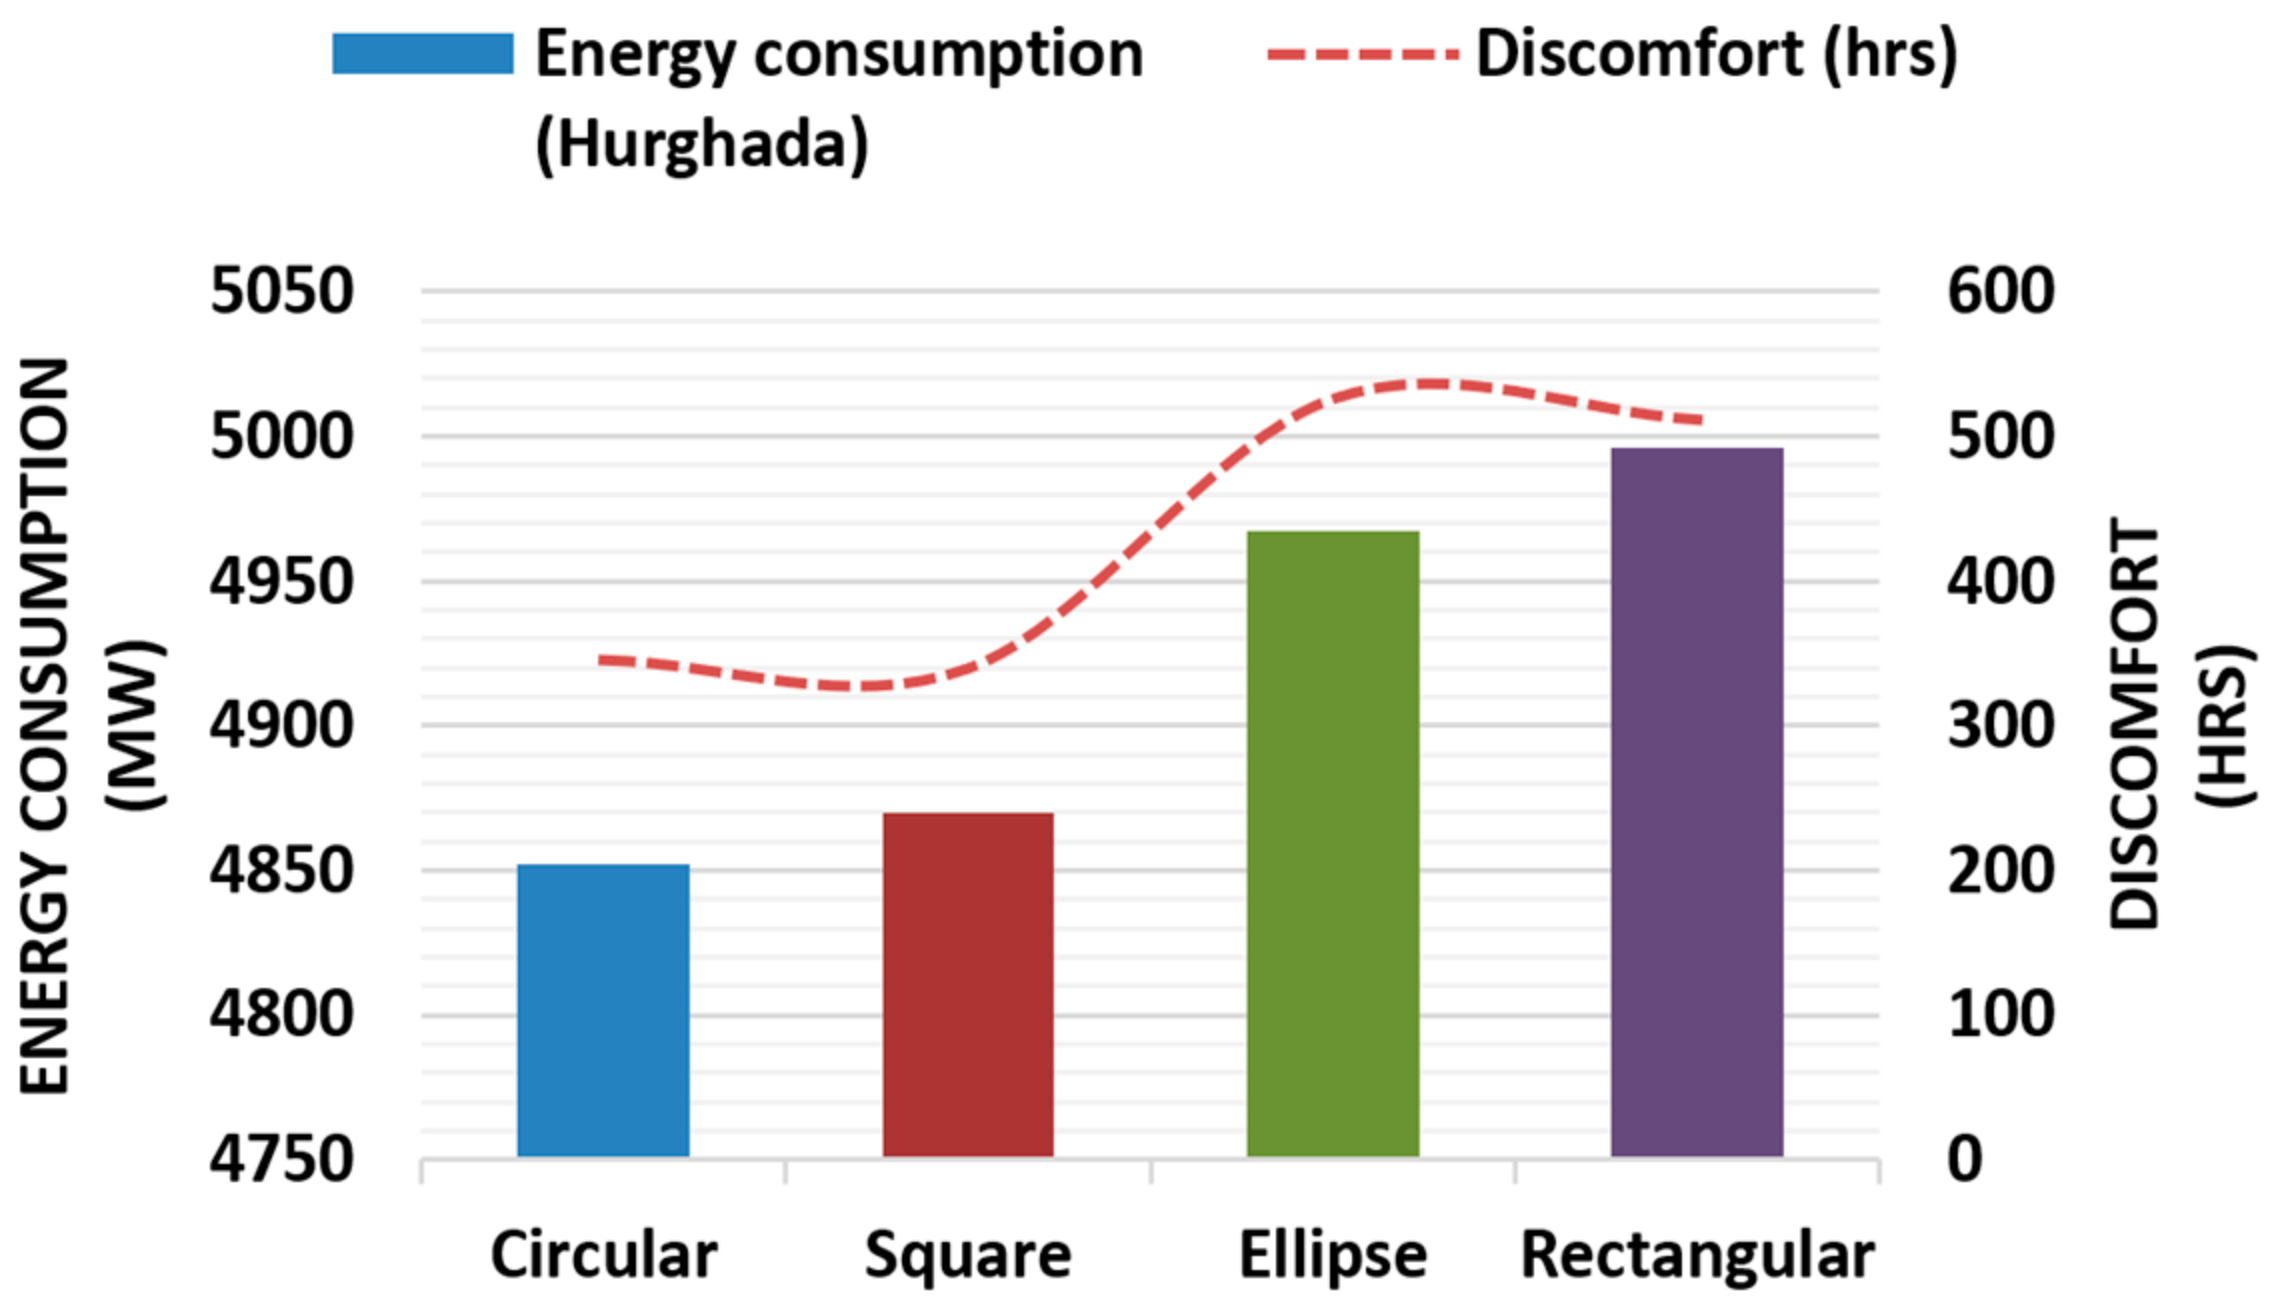
3.5. Hurghada (East Coast Region—R5)

Within the context of Hurghada, the results (Figure 15) show that the circular shape had the lowest total energy use of 4852.29 megawatts. Meanwhile, the highest energy use was found to be in the rectangular shape, with a value of 4996.22 megawatts and an energy consumption which was 2.97% more than the circular shape. In terms of discomfort time, the lowest duration has been achieved by both the square and circular shapes, with a tiny difference between them, while the highest has been achieved by the ellipse shape.

3.6. El-Kharga (Desert Region—R7)

In El-Kharga, the circular shape has been found to require a lower amount of annual energy, using about 4859.35 megawatts (Figure 16). The rectangle shape had the worst energy performance with a consumption of 4907.83 megawatts, which was 1% higher than the circular shape. Moreover, the square and ellipse models have almost the same total energy consumption, using 0.31% and 0.33% more than the circular model, respectively. In terms of discomfort hours, the result showed the same trend and performance of models as with Hurghada.

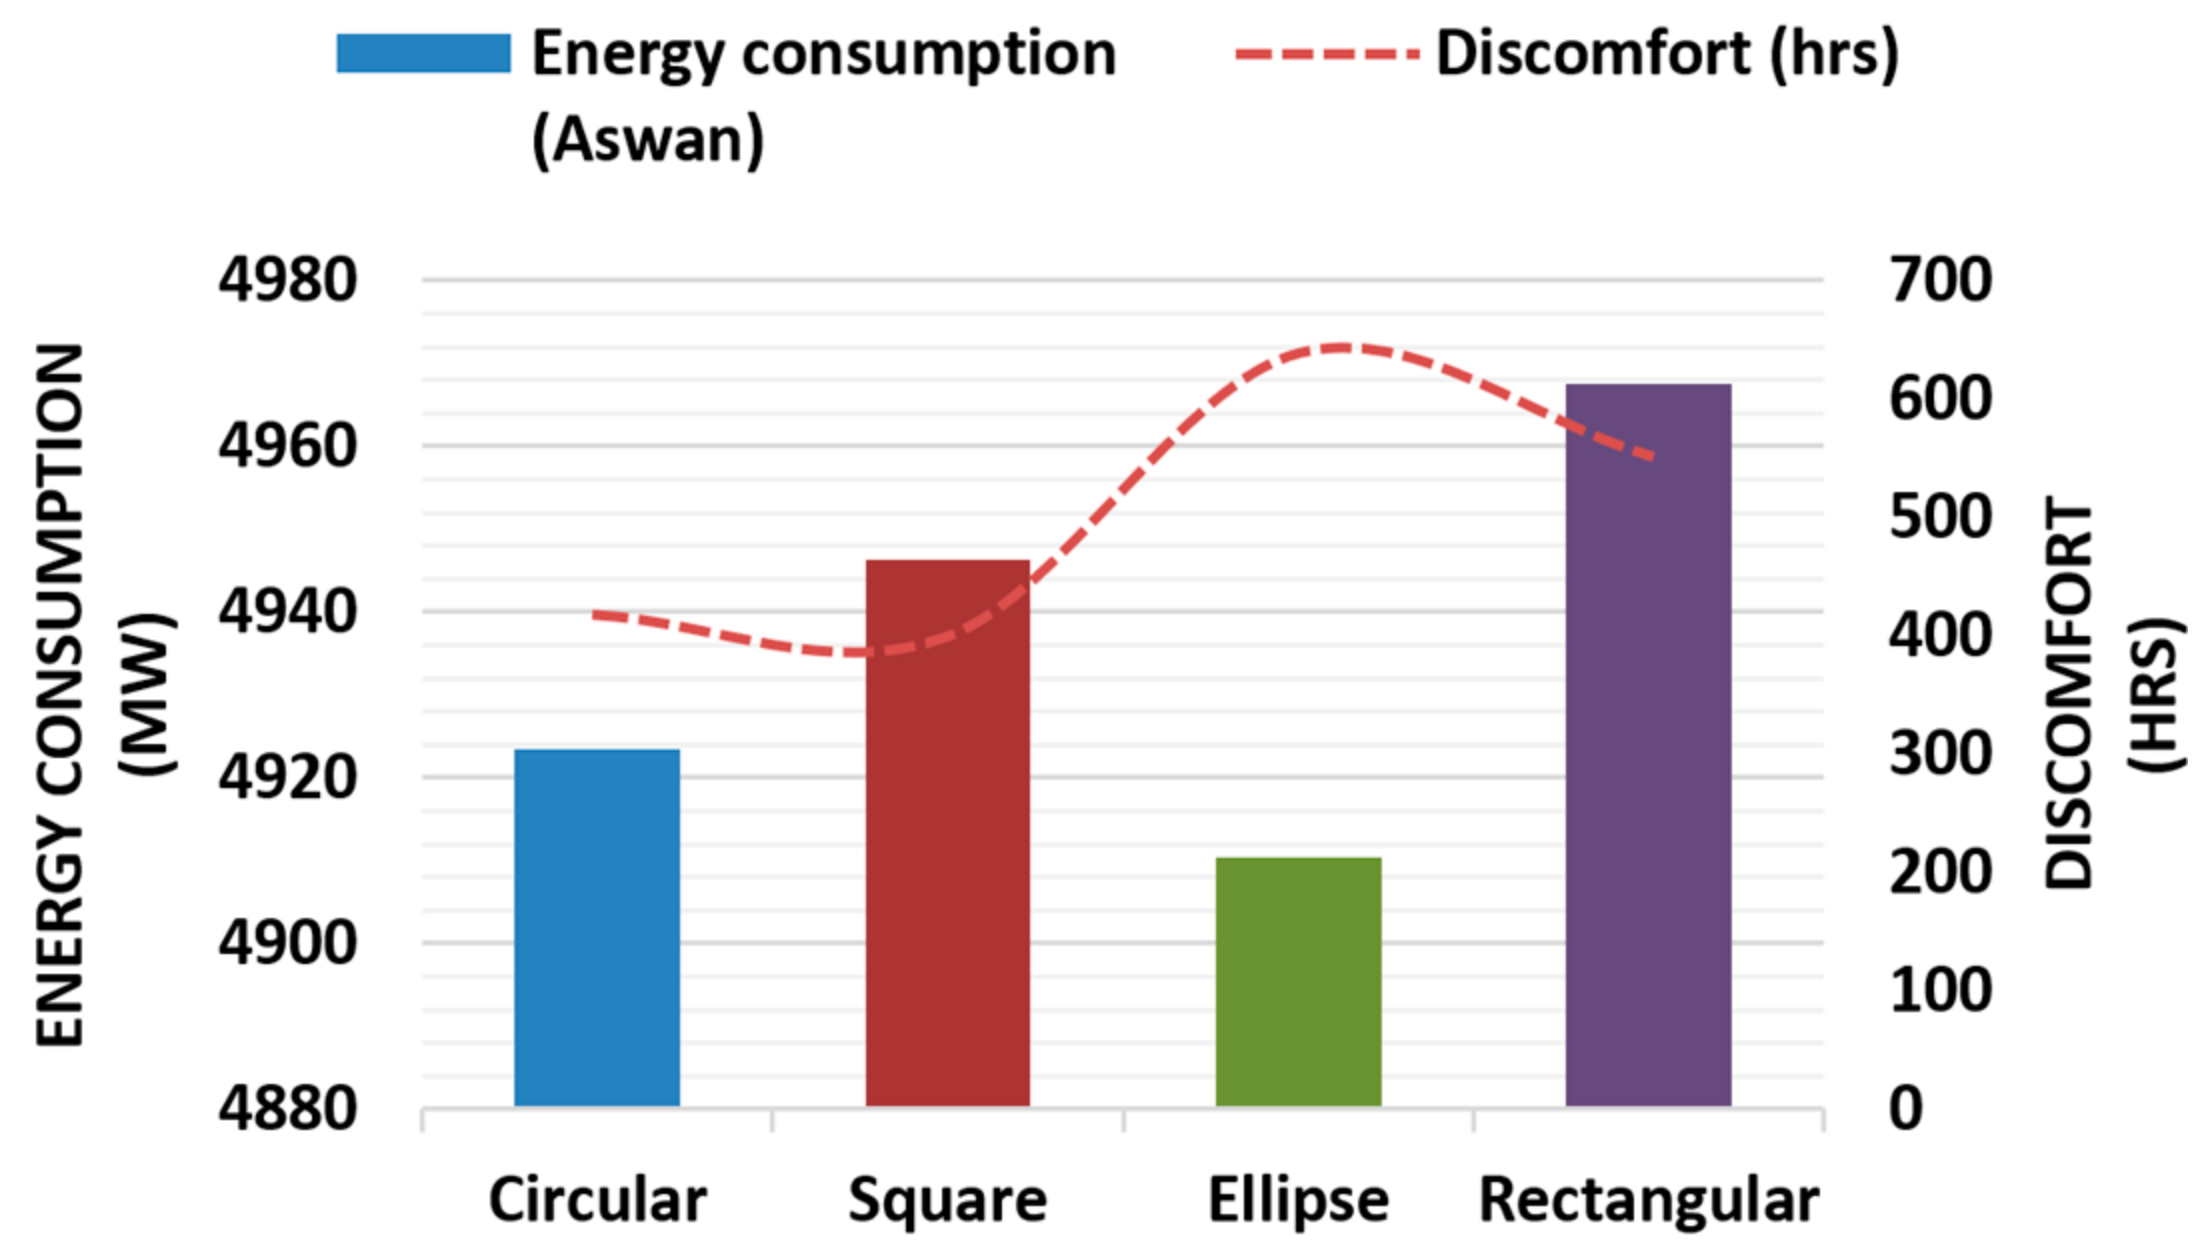
3.7. Aswan (Region of Southern Egypt—R8)

In Aswan (Figure 17), the annual energy consumption of the four simulated shapes came in order from lowest to highest as follows: the ellipse (4910.34 megawatts), the circular, the square, and finally the rectangular (4967.62 megawatts) shapes. The rectangular shape consumed 1.17% more energy than the ellipse-shape model. However, unexpectedly, the highest discomfort hours have been achieved by the ellipse shape that was considered the most efficient in its energy performance.
Table 3 summarizes the study’s results and findings from its different methodological parts.

4. Discussion

From the previous results and in terms of energy consumption, the most compact shape, the circular building (S/V = 0.096), was found to be the most suitable geometrical shape for high-rise buildings in four out of seven Egyptian climatic regions (Cairo-R2, El-Minya-R3, Hurghada-R5, and Elkhrga-R7). This result was found to be compatible with the findings of previous work performed on hot, humid climates [19,20] with climatic conditions similar to Cairo-R2 and Hurghda-R5. Within hot, arid climates that have similar conditions to El-Minya-R3 and Elkhrga-R7, Al-Anzi et al. 2009 [17] confirmed that the most compact building shape consumes the lowest energy.
The ellipse shape is found to be the most suitable mass geometry within Asyut-R4 and Aswan-R8, regions which have the driest climate across Egypt. This result contradicts the studies with results that come from tests performed in arid regions [16,17], which recommended compacted building mass for energy conservation in such climates. This performance can be justified by the fixed northern orientation of the large surface façade along with shallow building mass width. This orientation provides a high percentage of shade to the surface area of the northern wide façade, which reduces heat gain during hot summers. Both regions have maximum values of direct solar incidence compared with other climatic regions (Figure 6). Therefore, these conditions, along with the low humidity (Figure 5) and high wind speed (Figure 7) of both regions, can reduce heat gain and save the energy consumed in cooling and heating together.
The square shape is found to be effective in only Alexandria-R1, a region that lies on the coast of the Mediterranean Sea. Although the square model is less compact than the circular model, with a higher surface-to-volume ratio (S/V), it was able to benefit from low temperatures during the summer and a warmer climate during the winter that helped it preserve energy. Moreover, the cloudy sky during the year can significantly reduce solar gain through the large, exposed surface of façades, along with providing more natural lighting. This could reduce the energy required for lighting and HVAC systems.
The worst energy performance is achieved by the rectangular shape across all Egyptian climatic regions except Asyut-R4 and Alexandria-R1, where the circular shape was the worst. The high surface-to-volume ratio (S/V) of the rectangular shape, which facilitate the reception of large amounts of solar radiation gain, could be the reason behind its bad performance.
On the other hand, thermal comfort is found to be significantly associated with building compactness. The lowest amount of thermal discomfort duration was obtained by the most compact buildings’ shapes (circular and square) except for Asyut—R4. In Asyut-R4, the ellipse model was the most thermally comfortable building because of the high wind speed in the summer months that allowed faster cooling for the building mass.
The results also indicate the wide variations in energy usage among Egyptian climatic regions (Figure 18). In addition, the huge differences in the ability of high-rise buildings to provide thermal comfort in the different regions has been highlighted. It can be clearly seen from Figure 18 that high-rise buildings have proven efficiency in achieving thermal comfort and energy usage in R1, R2, R3, and R4. In contrast, within the harsh climatic conditions of R5, R7, and R8, the models showed, in general, poor performance regarding energy and thermal comfort.

5. Conclusions

The study aimed to investigate the effect of a building’s geometric shape on the energy efficiency of high-rise buildings across different Egyptian climatic regions. Four models’ geometrical shapes were simulated in seven inhabited climatic regions using EnergyPlus as part of the DesignBuilder software. The outputs of annual total energy consumption have been used to define the optimal building shape for each climate. The conclusions drawn from the study emphasized that the most compact shape, the circular building, is the most suitable geometrical shape for high-rise buildings in four regions out of seven from the Egyptian climatic regions (R2, R3, R5, and R7). The ellipse shape is found to be the most suitable mass geometry within R4 and R8, while the square shape is found to be effective in only R1. In addition, energy consumption and thermal comfort are found to be somewhat related, with relative building mass compactness. Although the percentage of energy consumption varies slightly with the change in the shape of the building, this small percentage may represent thousands of kilowatts that deserve to be considered.

6. Research Limitations, Recommendations and Further Work

This work was limited to just studying the effect of high-rise buildings’ mass geometry on energy efficiency within the Egyptian climatic variant context. Many factors, such as orientation and WWR, were set to their best energy performance values in such a context according to our review to eliminate and minimize their impact.
In the light of the research results, the authors recommend not to construct high-rise buildings within climatic regions with the harsh climatic conditions of R5, R7, and R8 because of massive annual energy consumption and poor internal thermal conditions.
However, many other parameters could significantly change the results, such as changing window-to-wall ratio (WWR) and building orientation. The combined effect of these parameters should be further investigated. Moreover, the impact of applying passive measures to the building envelope, along with integrating smart and renewable energy solutions, should be considered in future research. Applying such systems and solutions were reported to achieve considerable energy conservation [37].
In addition, there are some considerations that need to be further clarified for the correct use of results and for the future progress of this research. First, single-zone/open-plan style offices were specified for the entire floor space in all building models. Using one activity template has both benefits and drawbacks. Positively, it reduces the model’s complexity and saves simulation time. Negatively, change in the function of some areas and their consequences have an impact on energy consumption which cannot be reflected in the model (e.g., the usability of space areas). Furthermore, an increase of usable space will increase the internal gains due to occupancy, office equipment, and lighting, which could have an effect on the heating and cooling requirements.

Author Contributions

Conceptualization, M.E.-A. and M.O.; methodology, M.E.-A., M.O. and G.H.; software, G.H.; formal analysis, M.O. and G.H.; resources, M.O. and G.H.; data curation, M.O. and G.H.; writing—original draft preparation, M.E.-A. and G.H.; writing—review and editing, G.H. and M.O.; visualization, M.O. and G.H.; supervision, M.E.-A. All authors have read and agreed to the published version of the manuscript.

Funding

This research received no external funding.

Data Availability Statement

All relevant data are included within the manuscript.

Acknowledgments

The authors would like to acknowledge Heba Hassan (Bani-Suif University—Arch. Dept.—Egypt) and Elsadeq H. Nour-Eldeen (MEP Dept.—Minia University—Egypt) for their appreciated support and help in setting up the study’s computer model parameters.

Conflicts of Interest

The authors declare no conflict of interest.

References

  1. Elotefy, H.; Abdelmagid, K.S.S.; Morghany, E.; Ahmed, T.M.F. Energy-efficient Tall Buildings Design Strategies: A Holistic Approach. Energy Procedia 2015, 74, 1358–1369. [Google Scholar] [CrossRef] [Green Version]
  2. El-Shorbagy, A.-m. GREEN SKYSCRAPERS: Criteria for Dynamic Sustainable Tall-Buildings. In Proceedings of the Third AIN SHAMS University International Conference on Environmental Engineering (ASCEE), Cairo, Egypt, 14–16 April 2009. [Google Scholar]
  3. Saroglou, T.; Meir, I.A.; Theodosiou, T.; Givoni, B. Towards energy efficient skyscrapers. Energy Build. 2017, 149, 437–449. [Google Scholar] [CrossRef]
  4. Egyptian Electricity Holding Company. Annual Report 2017/2018; Ministry of Electricity & Renewable Energy: Cairo, Egypt, 2018.
  5. Egyptian Electricity Holding Company. Annual Report 2016/2017; Ministry of Electricity & Renewable Energy: Cairo, Egypt, 2017.
  6. Rasazi, H. The Arab Republic of Egypt—Power Sector in Brief; African Development Bank Group (AFDB): Cairo, Egypt, 2010; Available online: https://www.afdb.org/en/documents/document/egypt-2010-power-sector-in-brief-22468 (accessed on 13 September 2021).
  7. Hassan, A.G.A.E. Parametric Design Optimization for Solar Screens: An Approach for Balancing Thermal and Daylight Performance for Office Buildings in Egypt; Faculty of Engineering, Cairo University: Giza, Egypt, 2016. [Google Scholar]
  8. Pérez-Lombard, L.; Ortiz, J.; Pout, C. A review on buildings energy consumption information. Energy Build. 2008, 40, 394–398. [Google Scholar] [CrossRef]
  9. Patil, B.; Valsson, S. Contemporary Vernacular Built Form and Thermal Comfort. In Proceedings of the 6th International Conference on Innovative Trends in “Civil Engineeering, Architecture and Environmental Engineering for Sustainable Infrastructure Development”, New Delhi, India, 24–25 January 2015. [Google Scholar]
  10. Brown, G.Z.; Dekay, M. Sun, Wind and Light: Architectural Design Strategies, 2nd ed.; John Wiley & Sons, Inc.: New York, NY, USA; Chichester, UK, 2001. [Google Scholar]
  11. Raji, B.; Tenpierik, M.; Dobbelsteen, A. Early-Stage Design Considerations for the Energy-Efficiency of High-Rise Office Buildings. Sustainability 2017, 9, 623. [Google Scholar] [CrossRef] [Green Version]
  12. Givoni, B. Climate Conssideration in Building and Urban Design; Van Nostrand Reinhold: New York, NY, USA, 1998. [Google Scholar]
  13. Liu, L.; Wu, D.; Li, X.; Hou, S.; Liu, C.; Jones, P. Effect of geometric factors on the energy performance of high-rise office towers in Tianjin, China. Build. Simul. 2017, 10, 625–641. [Google Scholar] [CrossRef] [Green Version]
  14. Kottek, M.; Grieser, J.; Beck, C.; Rudolf, B.; Rubel, F. World Map of the Köppen-Geiger Climate Classification Updated. Meteorol. Z. 2006, 15, 259–263. [Google Scholar] [CrossRef]
  15. National Housing and Building Research Centre (HBRC). The Egyptian Code to Improve Energy Efficiency in Buildings; Residential Buildings; The Egyptian Ministry of Housing, Utilities & Urban Communities: Cairo, Egypt, 2005; Volume 1.
  16. Ourghi, R.; Al-Anzi, A.; Krarti, M. A simplified analysis method to predict the impact of shape on annual energy use for office buildings. Energy Convers. Manag. 2007, 48, 300–305. [Google Scholar] [CrossRef]
  17. AlAnzi, A.; Seo, D.; Krarti, M. Impact of building shape on thermal performance of office buildings in Kuwait. Energy Convers. Manag. 2009, 50, 822–828. [Google Scholar] [CrossRef]
  18. Muhaisen, A.; Abed, H. Effect of building proportions on the thermal performance in the mediterranean climate of the Gaza Strip. J. Eng. Res. Technol. 2015, 2, 112–121. [Google Scholar]
  19. Ling, C.; Ahmad, M.; Ossen, D. The Effect of Geometric Shape and Building Orientation on Minimising Solar Insolation on High-Rise Buildings in Hot Humid Climate. J. Constr. Dev. Ctries. 2007, 12, 27–38. [Google Scholar]
  20. Rashdi, W.S.S.W.M.; Embi, M.R. Analysing Optimum Building form in Relation to Lower Cooling Load. Procedia-Soc. Behav. Sci. 2016, 222, 782–790. [Google Scholar] [CrossRef] [Green Version]
  21. Choi, I.Y.; Cho, S.H.; Kim, J.T. Energy consumption characteristics of high-rise apartment buildings according to building shape and mixed-use development. Energy Build. 2012, 46, 123–131. [Google Scholar] [CrossRef]
  22. Susorova, I.; Tabibzadeh, M.; Rahman, A.; Clack, H.L.; Elnimeiri, M. The effect of geometry factors on fenestration energy performance and energy savings in office buildings. Energy Build. 2013, 57, 6–13. [Google Scholar] [CrossRef]
  23. Olgyay, V. Design with Climate: Bioclimatic Approach to Architectural Regionalism, 1st ed.; Princeton University Press: Princeton, NJ, USA, 1963. [Google Scholar]
  24. Lyndon, D.; Olgyay, V.; Reynolds, J.; Yeang, K. Design with Climate: Bioclimatic Approach to Architectural Regionalism—New and Expanded Edition; Princeton University Press: Princeton, NJ, USA, 2016. [Google Scholar]
  25. Yeang, K. Bioclimatic Skyscrapers; Artemis London Limited: London, UK, 1994. [Google Scholar]
  26. Council on Tall Buildings and Urban Habitat (CTBUH). Egypt Tall Buildings List. Available online: https://www.skyscrapercenter.com/country/egypt/buildings (accessed on 21 April 2021).
  27. Oldfield, P.; Trabucco, D.; Wood, A. Five energy generations of tall buildings: A historical analysis of energy consumption in high rise buildings. J. Archit. 2009, 14, 591–613. [Google Scholar] [CrossRef]
  28. Oldfield, P.; Trabucco, D.; Wood, A. Five energy generations of tall buildings. In The Sustainable Tall Building, 1st ed.; Routledge: London, UK, 2019; pp. 53–73. [Google Scholar]
  29. Szokolay, S.V. Thermal Design of Buildings; RAIA Education Division: Canberra, Australia, 1987. [Google Scholar]
  30. Ochedi, E.; Taki, A. Energy Efficient Building Design in Nigeria: An Assessment of the Effect of the Sun on Energy Consumption in Residential Buildings. J. Eng. Archit. 2019, 7, 51–61. [Google Scholar] [CrossRef]
  31. Mahmoud, A.; Elkhiary, A. Simulation Analysis for evaluating Smart technique of Energy Performance in Egypt. IOP Conf. Ser. Earth Environ. Sci. 2019, 397, 012002. [Google Scholar] [CrossRef] [Green Version]
  32. Algendy, A.S.; Anbar, M.F. Energy Efficiency in residential buildings in Egypt with special reference to windows. Int. J. Curr. Eng. Technol. 2017, 7, 126–134. [Google Scholar]
  33. DesignBuilder Software Ltd. DesignBuilder v6 Simulation Documentation, 4th ed.; DesignBuilder Software Ltd.: Stroud, UK, 2019. [Google Scholar]
  34. National Housing and Building Research Centre (HBRC). The Egyptian Code to Design and Execute HVAC Works; Airconditioning; The Egyptian Ministry of Housing, Utilities & Urban Communities: Cairo, Egypt, 2005; Volume 1.
  35. European Committee for Standardization. European Committee for Standardization. European Standard—EN 12464-1. In Light Lighting: Lighting Work Places—Part 1: Indoor Work Places; European Committee for Standardization CEN: Brussels, Belgium, 2002. [Google Scholar]
  36. American Society of Heating Refrigerating and Air-Conditioning Engineers (ASHRAE). ANSI/ASHRAE Standard 62.1: Ventilation for Acceptable Indoor Air Quality; American Society of Heating, Refrigerating and Air-Conditioning Engineers, Inc.: Atlanta, GA, USA, 2010. [Google Scholar]
  37. Prada, M.; Prada, I.F.; Cristea, M.; Popescu, D.E.; Bungu, C.; Aleya, L.; Bungu, C.C. New solutions to reduce greenhouse gas emissions through energy efficiency of buildings of special importance Hospitals. Sci. Total Environ. 2020, 718, 137446. [Google Scholar] [CrossRef] [PubMed]
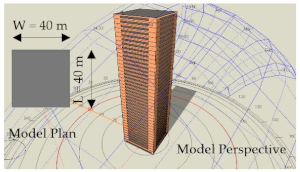
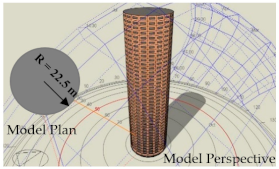
Figure 1. Electricity consumption in Egypt by sector [6].
Sustainability 13 10529 g001
Figure 2. Energy consumption pattern for office and commercial buildings in Egypt [7].
Sustainability 13 10529 g002
Figure 3. Climatic design regions of Egypt with representative cities indicated [15].
Sustainability 13 10529 g003
Figure 4. Variation in dry bulb temperature for Egyptian climatic regions’ representative cities.
Sustainability 13 10529 g004
Figure 5. Variation in relative humidity for Egyptian climatic regions’ representative cities.
Sustainability 13 10529 g005
Figure 6. Variation in direct solar radiation for Egyptian climatic regions’ representative cities.
Sustainability 13 10529 g006
Figure 7. Variation in most-frequent wind speed for Egyptian climatic regions’ representative cities.
Sustainability 13 10529 g007
Figure 8. The research methodology overview.
Sustainability 13 10529 g008
Figure 9. The best orientation of the buildings (indicated in yellow) within the Egyptian climatic regions to achieve minimum average solar gain: (a) the best orientation in Alexandria city (R1); (b) the best orientation in Cairo city (R2); (c) the best orientation in El-Minya city (R3); (d) the best orientation in Asyut city (R4); (e) the best orientation in Hurghada city (R5); (f) the best orientation in El-Kharga city (R7); (g) the best orientation in Aswan city (R8).
Sustainability 13 10529 g009
Figure 10. DesignBuilder workflow [33].
Sustainability 13 10529 g010
Figure 11. Total annual energy consumption and discomfort hours results in Alexandria (R1).
Sustainability 13 10529 g011
Figure 12. Total annual energy consumption and discomfort hours results in Cairo (R2).
Sustainability 13 10529 g012
Figure 13. Total annual energy consumption and discomfort hours results in El-Minya (R3).
Sustainability 13 10529 g013
Figure 14. Total annual energy consumption and discomfort hours results in Asyut (R4).
Sustainability 13 10529 g014
Figure 15. Total annual energy consumption and discomfort hours results in Hurghada (R5).
Sustainability 13 10529 g015
Figure 16. Total annual energy consumption and discomfort hours results in El-Kharga (R7).
Sustainability 13 10529 g016
Figure 17. Total annual energy consumption and discomfort hours results in Aswan (R8).
Sustainability 13 10529 g017
Figure 18. Total energy use and discomfort hours results variation across Egypt.
Sustainability 13 10529 g018
Table 1. The study models’ geometrical characteristics.
W/LArea (m2)H (m)S/VWWR
Model (1) - Square1:116001450.10730%
Sustainability 13 10529 i001
Model (2) - Rectangle1:316001450.12230%
Sustainability 13 10529 i002
Model (3) - Circle1:116001450.09630%
Sustainability 13 10529 i003
Model (4) - Ellipse1:316001450.11630%
Sustainability 13 10529 i004
Table 2. DesignBuilder inputs assigned to study models.
CategorySub-CategoryItemInput
ActivityOccupancyDensity0.117 Person/m2
Metabolic rateOffice activity
Metabolic factor0.9
Occupancy schedule8.00 am to 16.00/5 days per week
Clothing1 Clo/winter
0.5 Clo/summer
Other gainsOffice equipment13 w/m2
Environmental controlCooling setpoint26 °C
Heating setpoint21 °C
Fresh air5.1 L/S/Person
Humidity control20–50%
Lighting, target illuminance500 Lux
ConstructionExternal walls- Aluminum cladding: 4 mm
- Glass fiber insulation: 25 mm
- Cement mortar: 20 mm
- Concrete blocks: 200 mm
- Cement mortar: 20 mm
Sustainability 13 10529 i005U value = 0.748 W/m2·K
OpeningsGlazing typeDouble Low-E (10 mm/13 mm Argon)U value = 1.15 W/m2·K
Aluminum window frameU value = 573 W/m2·K
LightingLED lighting (with day lighting control)
Power density2.5 w/m2-100 lux
Luminaire typeRecessed
Working plan height0.8 m
Glare19
HVACVAV, air-cooled chiller, fan-assisted reheat
Heating system coefficient of performance (COP)0.85
Cooling system coefficient of performance (COP)1.8
Auxiliary energy35 KWh/m2
Ventilation rate6 Ac/h
Table 3. Summary of the study’s findings.
Theoretical StudyAnalytical StudyComputer-Based Study
Extract the Study Models’ Geometrical CharacteristicsClimatic regionBest Orientation Achieves Minimum Annual Solar GainBest Energy Performance Shape and Its annual ConsumptionWorst Energy Performance Shape and Its Annual ConsumptionAnnual Energy Saved
ParameterValueProposed Models PlanShapeMWShapeMWMW
W/L ratio1:1 and 1:3Square
Sustainability 13 10529 i006
Rectangular
Sustainability 13 10529 i007
Circular
Sustainability 13 10529 i008
Ellipse
Sustainability 13 10529 i009
R1The long axes of the building to face (North)Square4025.4Circular4041.816.4
S/V ratio0.096-0.122R2Circular4322.3Rectangular4360.6738.37
WWR30%R3Circular4296.12Rectangular4353.857.68
Height145 mR4Ellipse4164.91Circular4188.7223.81
Stories no.40R5Circular4852.29Rectangular4996.22143.93
Footprint1600 m2R7Circular4859.35Rectangular4907.8348.48
R8Ellipse4910.34Rectangular4967.6257.28
Aims achievedSetting up the tested models characteristicsAnswering the question: Which mass geometry of high-rise building best suits the climatic conditions of each Egyptian climatic region and achieves optimum energy efficiency?
Publisher’s Note: MDPI stays neutral with regard to jurisdictional claims in published maps and institutional affiliations.

