Article

Constructed Wetlands in South Korea: Current Status and Performance Assessment

Civil and Environmental Engineering Department, Kongju National University, Cheonan City 31080, Korea
*
Author to whom correspondence should be addressed.
Sustainability 2021, 13(18), 10410; https://doi.org/10.3390/su131810410
Submission received: 30 June 2021 / Revised: 2 September 2021 / Accepted: 13 September 2021 / Published: 18 September 2021

Abstract

:
The efficiency of nature-based facilities is mostly evaluated in terms of their pollutant removal capabilities; however, apart from water purification functions, constructed wetlands also perform ecological, cultural, and environmental education functions. A multi-criteria performance index was developed in this study to evaluate the overall efficiency of constructed wetlands. A total of 54 constructed wetlands installed across South Korea were monitored to evaluate the pollutant removal performance of the facilities. A comparison between the conventional pollutant removal-based evaluation and the developed multi-criteria index was also performed to determine the key changes in the results of evaluation when different methods are employed. Among the different types of wetlands studied, hybrid systems were found to be the most effective in terms of pollutant removal due to their complex configurations and functions. Newly constructed treatment wetlands have unstable performance and thus, a stabilization period ranging from two to five years is required to assess the facility’s pollutant removal capabilities. As compared to the conventional pollutant removal-based efficiency evaluation, the comprehensive evaluation method provided a more strategic tool for identifying the facilities’ strengths and weaknesses. Generally, the multi-criteria performance index developed in this inquiry can be utilized as a general tool for evaluating the sustainability of similar nature-based facilities.

1. Introduction

Anthropogenic activities and societal development are the primary drivers of land use and land-use changes (LULUCs). Over the past few centuries, there has been an exponential increase in urban, agricultural, livestock, and industrial areas due to the extensive conversion of natural landscapes and forest zones [1,2,3]. LULUCs within a watershed can cause various environmental problems such as the disruption of natural water circulation, air, soil, and water pollution, and ecosystem damage [4,5,6,7,8]. Urban areas with a high percentage of impermeable surfaces consequently reduce the infiltration potential, thus resulting in increased rainfall-to-runoff conversion and inadequate groundwater recharge. Moreover, densely populated urban areas generate large amounts of wastes that may lead to severe ecosystem damage. Agricultural and livestock operations also discharge significant pollutant loads into the environment due to the widespread use of agrichemicals and improper waste disposal from animal husbandry. Climate change also exacerbates the negative impacts of LULUCs on nature and human health. The Global Risks Report 2020 published by the World Economic Forum (WEF) indicated that biodiversity loss, extreme weather conditions, natural disasters, water crises, and human-made environmental disasters are highly probable due to the failure to address climate change [9]. Generally, the combined effects of climate change and LULUCs were expected to increase the economic, environmental, and social risks.
The United Nations developed the 17 sustainable development goals (SDGs) to solve multidimensional problems arising in various fields, such as poverty eradication, environment and society, and education. Among the 17 goals, four items (i.e., SDG 6—clean water and sanitation, SDG 11—sustainable cities and communities, SDG 13—climate action, and SDG 14—life below water) were primarily concerned with solving problems related to the water environment [10,11,12,13]. South Korea is among the countries that have been actively participating in the initiatives set by the United Nations, especially in terms of addressing environmental issues. Since the year 2000, environmental preservation has become an important component of government policies in South Korea [14]. Recent policies for managing non-point source (NPS) pollution were also formulated to address the environmental impacts of diffuse pollution. The four major rivers restoration project was a part of the Green New Deal Policy in the year 2009 that mainly focused on water resources management, flood control, and ecosystem rehabilitation [15]. The initial reports revealed NPS pollutants contributed 66.1, 64.4, 76.2, and 70.7% of the total biochemical oxygen demand (BOD) loads in the Han River, Nakdong River, Geum River, and Yongsan River, respectively. A significant portion of the total phosphorus (TP) loads in the Han River (51.3%), Nakdong River (58.6%), Geum River (65.1%), and Yongsan River (70.3%) were also traced from NPS [16]. Overall, it was revealed that the NPSs had greater pollutant contributions (51.3 to 76.2%) in South Korea’s four major rivers as compared with the point sources of pollution.
The South Korean government adopted nature-based solutions (NBS) to effectively manage non-point source pollution. Green infrastructures (GI) and low-impact development (LID) systems were installed in several locations across the country to facilitate the effective treatment of point and NPS pollutants through a decentralized management approach. Among the different types of nature-based systems utilized in South Korea, constructed wetland is one of the most commonly used facilities for treating stormwater runoff and wastewater from various land uses (i.e., urban, agricultural, livestock, and industrial areas) [17,18,19]. Constructed wetlands aim to mimic the functions of natural wetlands. These engineered systems can be classified as free water surface wetlands (FWS), horizontal sub-surface flow wetlands (HSSF), vertical flow wetlands (VF), and hybrid wetland systems [20,21]. FWS wetlands have high volume capacities that can be effective in storing large water volumes during extreme rainfall conditions. Constructed wetlands equipped with media layers (i.e., HSSF and VF) can also provide additional treatment for wastewater and stormwater by means of sedimentation, the filtration of particulates and suspended matter, and biological mechanisms initiated by plants and microorganisms [22,23,24,25]. On the other hand, hybrid systems inherit the advantages and disadvantages of the constructed wetland types incorporated in the design.
Apart from regulating services (i.e., water storage and pollutant treatment), constructed wetlands also perform provisioning, cultural, and supporting services. Snyder (2019) investigated the provisioning services of a tropical constructed wetland by quantifying the biomass production of the system. The results showed that wetland agroecosystems that have high net primary productions can be used for bioenergy generation. Moreover, the water treatment value that can be derived from the system can fully subsidize the cost for biomass production, thus making constructed wetlands sustainable sources of bioenergy [26]. Constructed wetland systems can also provide non-material benefits to the ecosystem. In a study conducted by Pedersen et al. (2019), wetlands near residential areas promote activities that support well-being and help improve the locals’ quality of life [27]. Constructed wetlands also perform educational, social-relational, and aesthetic functions as a part of their cultural services [28]. Similar to natural wetlands, constructed wetlands also support other ecosystem services by helping in soil formation and nutrient cycling [29].
Despite the various ecosystem services provided by nature-based facilities, constructed wetlands in South Korea are mostly utilized to perform water purification functions. According to the constructed wetlands installation manual of South Korea’s Ministry of Environment, the average pollutant removal efficiencies of constructed wetlands for BOD, TP, and total nitrogen (TN) were 53, 60, and 37%, respectively, which are relatively lower as compared with other LID facilities [30]. Considering the widespread application of constructed wetlands in South Korea, it is necessary to conduct an inquiry regarding the status and efficiency of these systems. Therefore, this study mainly focused on evaluating the treatment performance of several constructed wetlands installed across South Korea. Similar studies regarding the treatment performance of constructed wetlands in South Korea were conducted by several authors [31,32,33,34,35]; however, a nationwide survey of constructed wetlands treating runoff from various land use types has not been performed yet. Furthermore, the ecosystem services provided by nature-based systems are often overlooked since the efficiency of facilities is commonly assessed only in terms of their pollutant removal capabilities. Shen et al. (2017) evaluated the comprehensive benefits of constructed wetlands using indices derived from the social, environmental, and economic benefits of the facilities [36]. In this study, a multi-criteria performance index using a different set of indices was also developed to assess the sustainability of constructed wetlands holistically. A comparison between the pollutant removal-based and multi-criteria assessment was conducted to determine the key changes in the results of evaluation when different methods are employed.

2. Materials and Methods
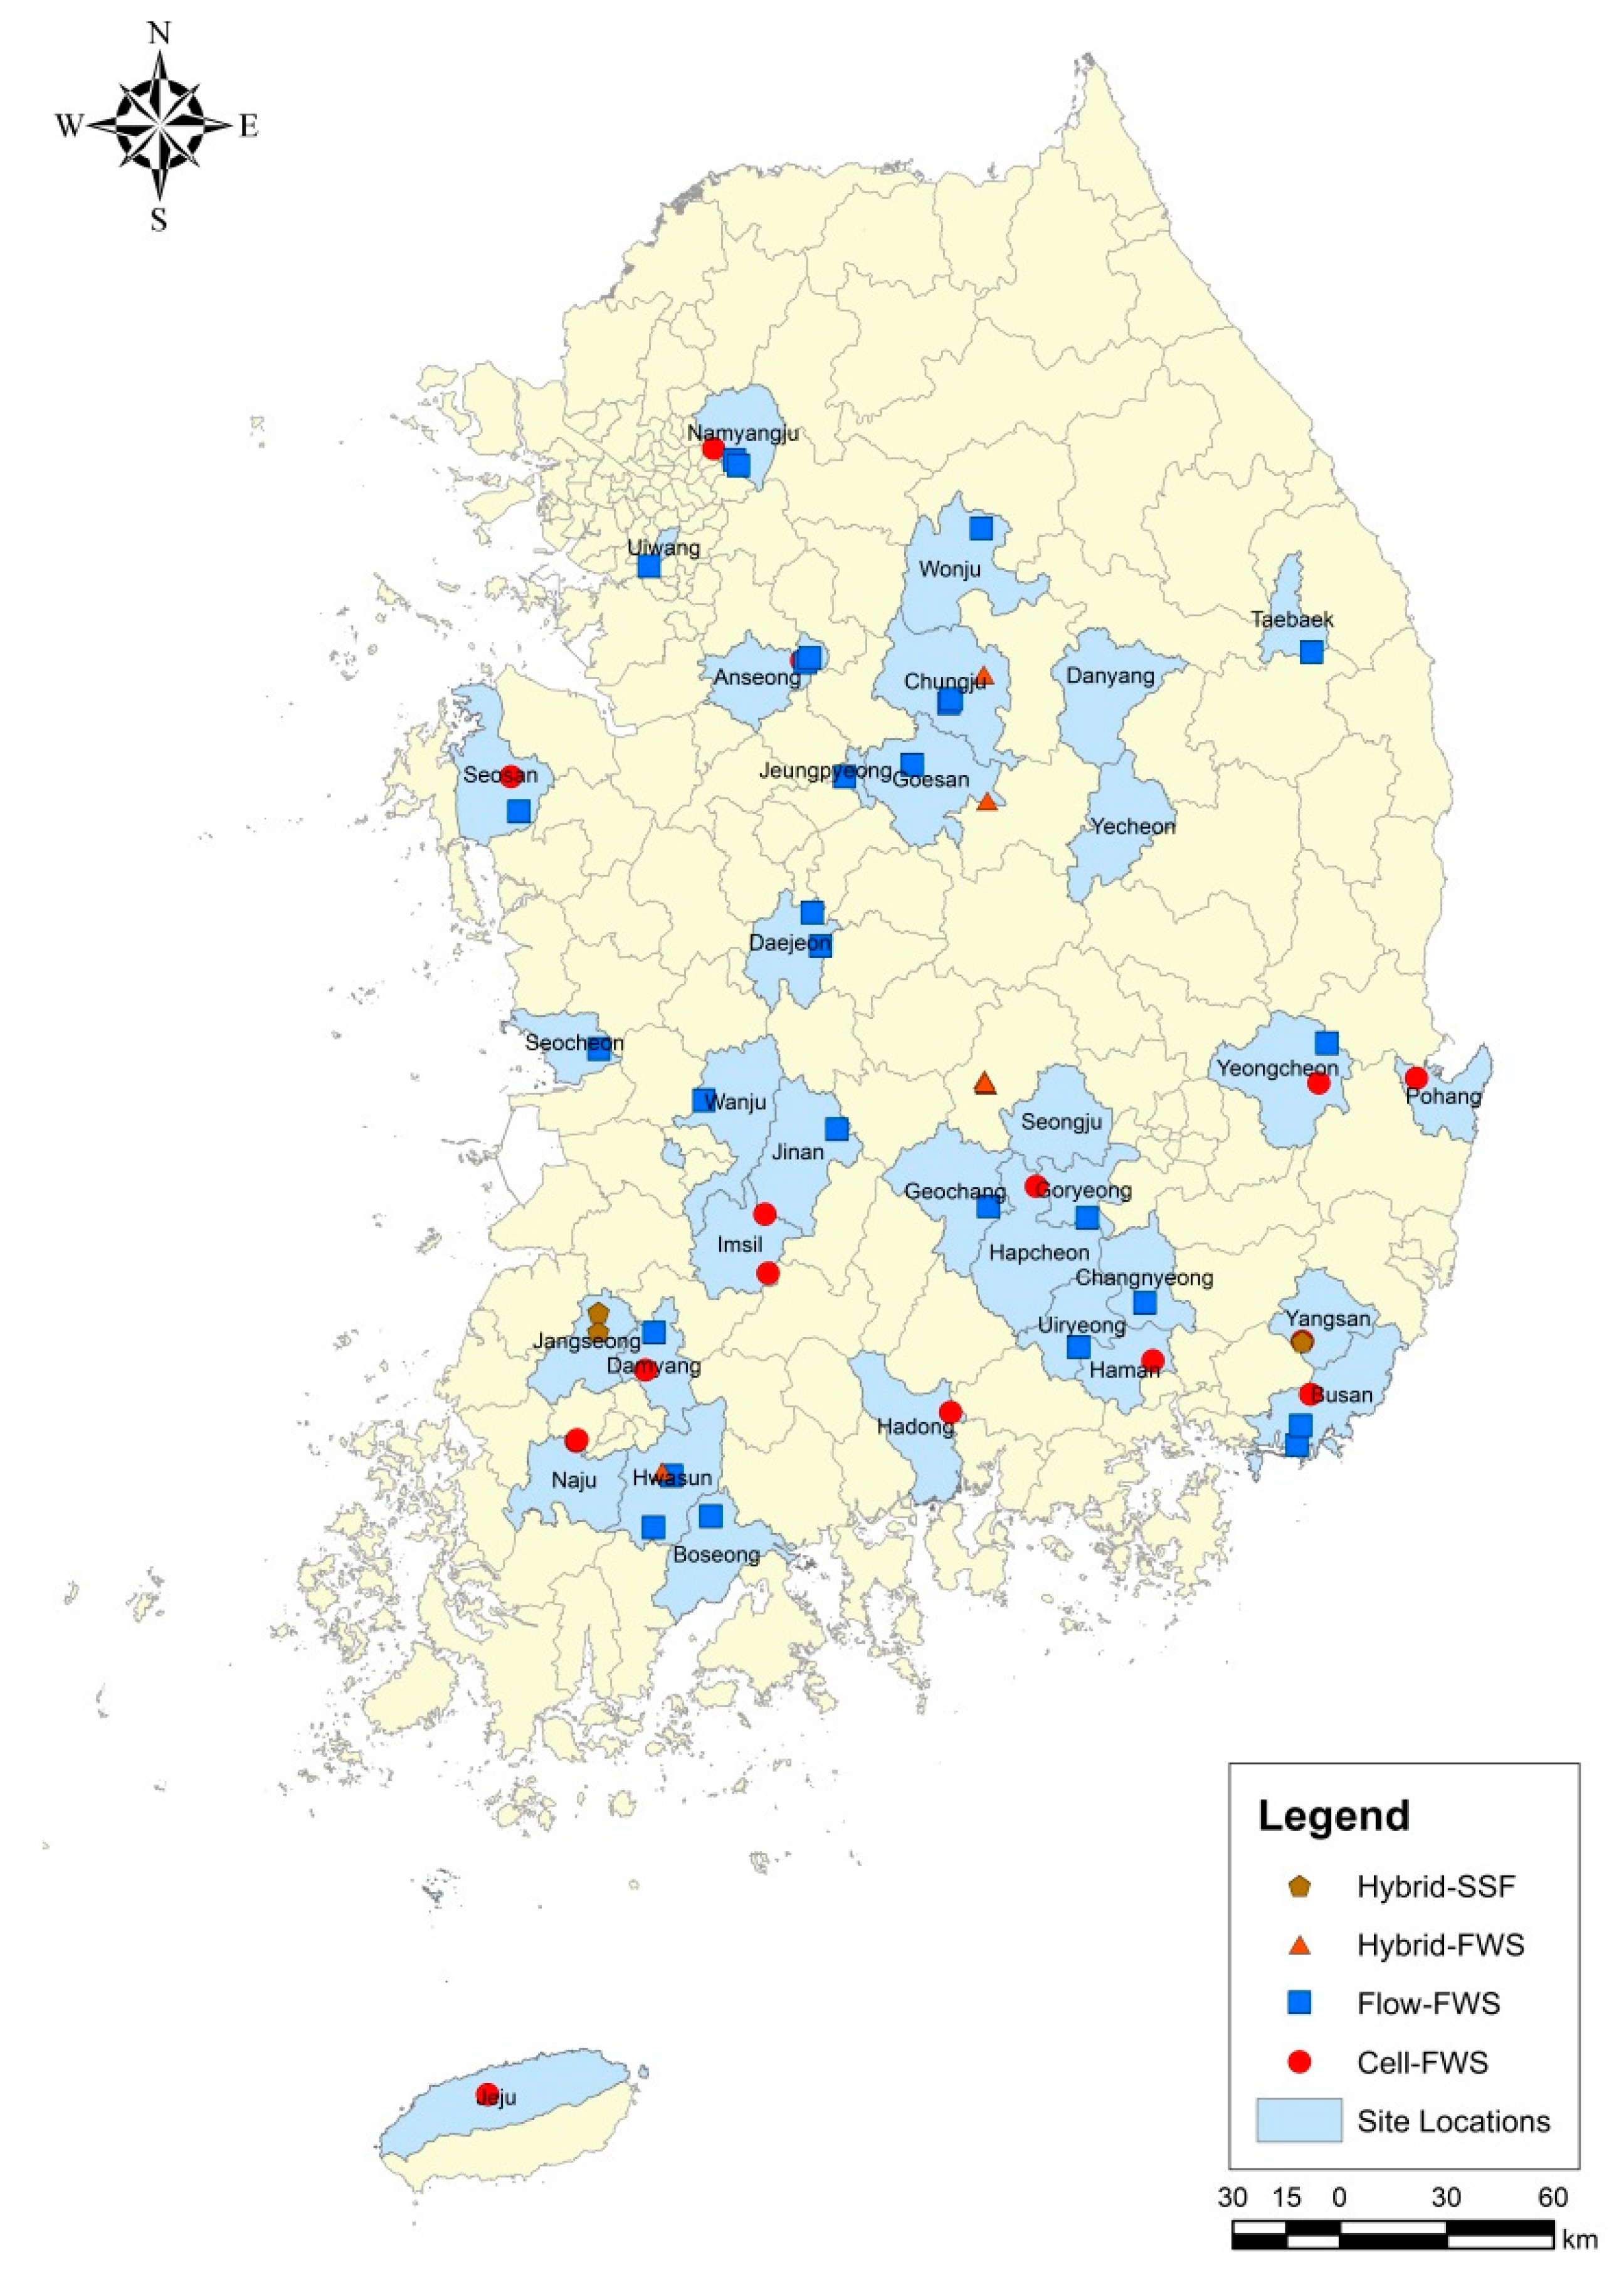
2.1. Site Location

The Korean ministry of environment has been installing various LID/GI facilities throughout the country since 2008 in accordance with the second phase of the comprehensive NPS management plan. A total of 54 constructed wetlands were installed at 35 locations across South Korea from 2011 to 2018. Among the 54 constructed wetlands, 13 were installed in urban areas, 25 were located in agricultural areas, 3 were utilized in industrial areas, 3 were constructed in commercial areas, and 10 were placed in livestock areas. The types of constructed wetlands evaluated in this study are illustrated in Figure 1. Cell-type free water surface (Cell-FWS) constructed wetlands were composed of a series of cell-like compartments that perform specific functions. The first cell serves as a sedimentation tank, whereas succeeding cells were designed to perform biological treatment processes. Cell-type facilities were configured to efficiently treat shock loads. Flow-type FWS (Flow-FWS) constructed wetlands are characterized by a series of meanders designed to maximize the hydraulic retention time of the facilities [37]. Similar to Cell-FWS constructed wetlands, Flow-FWS systems have specified areas for sedimentation and biological treatment processes, despite the lack of distinct boundaries that separate each treatment unit. The combination of Cell-FWS and Flow-FWS was referred to as Hybrid-FWS, whereas the facilities configured as the combination of horizontal and vertical subsurface flow-types were designated as Hybrid-SSF. The locations of the 54 monitored constructed wetlands are shown in Figure 2 and the facility characteristics are described in detail in Table 1.

2.2. Monitoring, Sample Collection, and Water Quality Analysis

Monitoring was performed from 2016 to 2019 to assess the treatment performance of the constructed wetlands. Due to the large catchment area of the facilities, monitoring was conducted considering a minimum rainfall depth of 10 mm for all constructed wetlands. A minimum of three antecedent dry days was also observed to ensure the sufficient accumulation of pollutants in the catchment area [38]. Flow rates were measured every five minutes and grab water samples were collected from the inlet and outlet of the facility. The first inflow sample was collected as soon as a visible change in water level was observed in the inflow port, whereas succeeding samples were collected at an hourly interval. The start of effluent sampling was determined by the design HRT of the constructed wetlands. Similarly, succeeding effluent samples were collected at an hourly interval. Each facility was monitored eight times and a total of 12 influent and 12 outflow samples were collected for each monitored event. The sampling frequency and the total number of samples were formulated in accordance with the guidelines set by the Korean Ministry of Environment. Water samples were analyzed following the standard methods for the examination of water and wastewater proposed by the American Public Health Association, American Water Works Association, and the Water Environment Federation [39]. The water quality parameters included in the analyses were BOD, chemical oxygen demand (COD), suspended solids (SS), TN, and TP.

2.3. Statistical Analyses

Statistical analyses were conducted using SYSTAT 12 and Origin2020b statistical software. Correlation analysis was also performed, and the hypotheses were tested at 5% significance level using the Student t-test or one-way ANOVA. The flow weighted average concentration, or event mean concentration (EMC), was used to quantify pollutant concentrations in the influent and effluent samples. As shown in Equation (1), EMC can be calculated by dividing the total cumulative pollutant load throughout the rainfall duration t by the cumulative runoff volume. EMC is frequently used to quantify non-point source pollution during storm events in the catchment area of research facilities [31,40].
EMC ( mg / L ) = t = 1 t = T C i n / o u t ( t ) × q i n / o u t ( t ) t = 1 t = T q i n / o u t
where Cin/out denotes the influent or effluent concentrations (mg/L) and qin/out (t) represents the inflow or outflow rate at time t (L).
The amount of inflow and outflow pollutant loads in the constructed wetlands was determined using the inflow and outflow EMCs and flow volumes. The total amount of inflow and outflow mass is calculated by using Equation (2).
Pollutant   load   ( kg ) = T = 1 t = T C i n / o u t ( t ) q i n / o u t ( t )
The pollutant mass reduction in each constructed wetland was calculated by dividing the difference of the summation of influent and summation of effluent loading with the summation of influent loading, also known as the summation of loads method, shown in Equation (3) [41].
Removal   efficiency   ( % ) = t = 1 t = T C i n ( t ) q i n ( t ) t = 1 t = T C o u t ( t )   q o u t ( t ) t = 1 t = T C i n ( t )   q i n ( t ) × 100

2.4. Development of Multi-Criteria Performance Index

A comprehensive evaluation index considering various constructed wetland functions was developed to create a more appropriate method for assessing the efficiency and sustainability of constructed wetlands. The indices used to evaluate the overall efficiency of the constructed wetlands were listed in Table 2. The indices were formulated based on the different ecosystem services provided by the constructed wetlands [42]. The proposed evaluation method incorporated the ecological and cultural functions of the constructed wetlands to account for the facilities’ non-material benefits. Moreover, the operation and landscape management status of the facilities were also evaluated to determine potential areas of improvement in terms of maintenance and operation. Survey questionnaires (see Supplementary Materials) were distributed to 12 experts in the field of water research, urban planning, environmental engineering, and policymaking to derive the weights for each index. Three respondents for each field of expertise were selected to eliminate the bias in evaluating the weight of different indices.
Values were normalized by dividing the score of each criterion with the largest score [43]. The assessment scores were evaluated using the weighted sum model (WSM) indicated in Equation (4).
A i W S M s c o r e = j = 1 n ( w j a i j )
where AiWSM-score is the assessment score, wj represents the weight of the criteria, and aij is the normalized value considering a specific criterion.
The comprehensive evaluation index for assessing the overall constructed wetland efficiency was comprised of treatment function index (TF), cultural function index (CF), ecological function index (EF), and operational and landscape management index (OM). The overall efficiency was calculated using Equation (5).
W S ( % ) = i = 1 n ( α i T F i ) + i = 1 n ( β i C F i ) + i = 1 n ( γ i E F i ) + i = 1 n ( δ i O M i )
where WS represents the wetland sustainability (%); TFi, CFi, EFi, and OMi denote individual indices; and α, β, γ, and δ corresponded to the item weights derived from survey responses.
The sustainability of each constructed wetland was evaluated using the criteria listed in Table 3. A sustainability score of less than 20 indicated that the facility requires significant improvements in all its functions and operational conditions. Scores ranging from 20 to 60 suggest that further improvements must be considered to increase the sustainability of the constructed wetlands, whereas facilities with sustainability scores greater than 60 indicated that all constructed wetland functions were maximized through adequate maintenance.

3. Results and Discussion

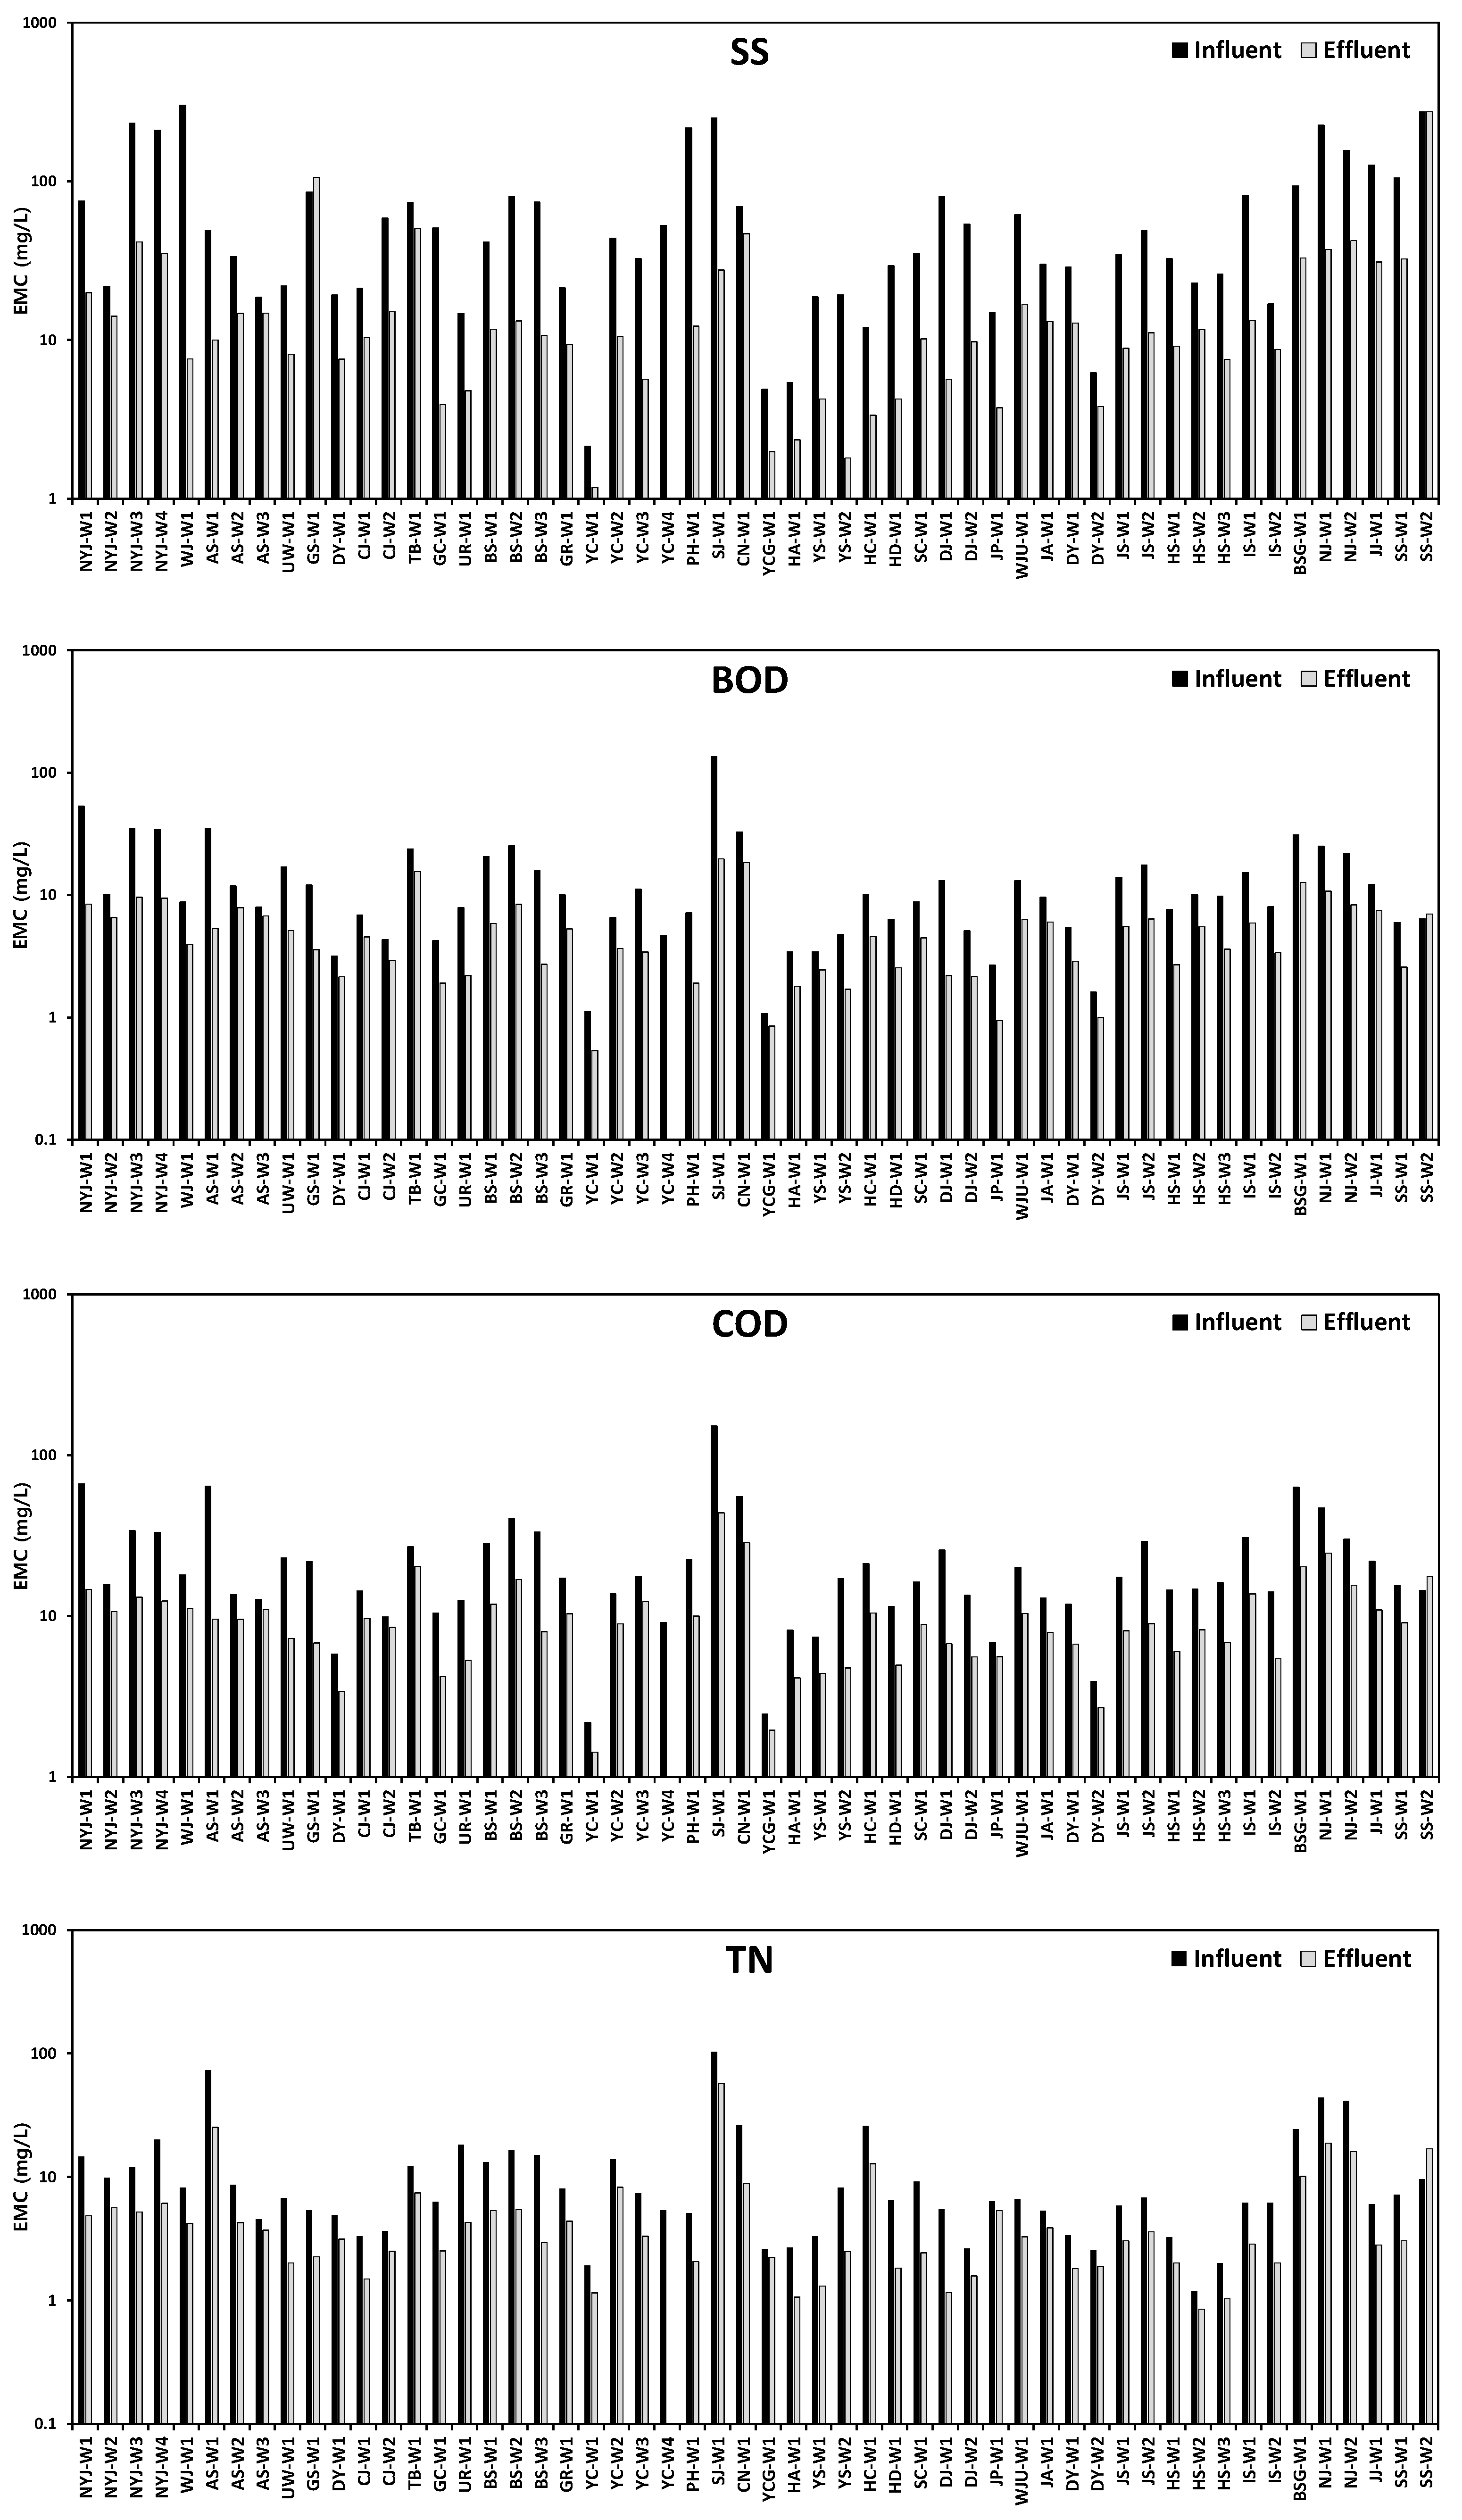
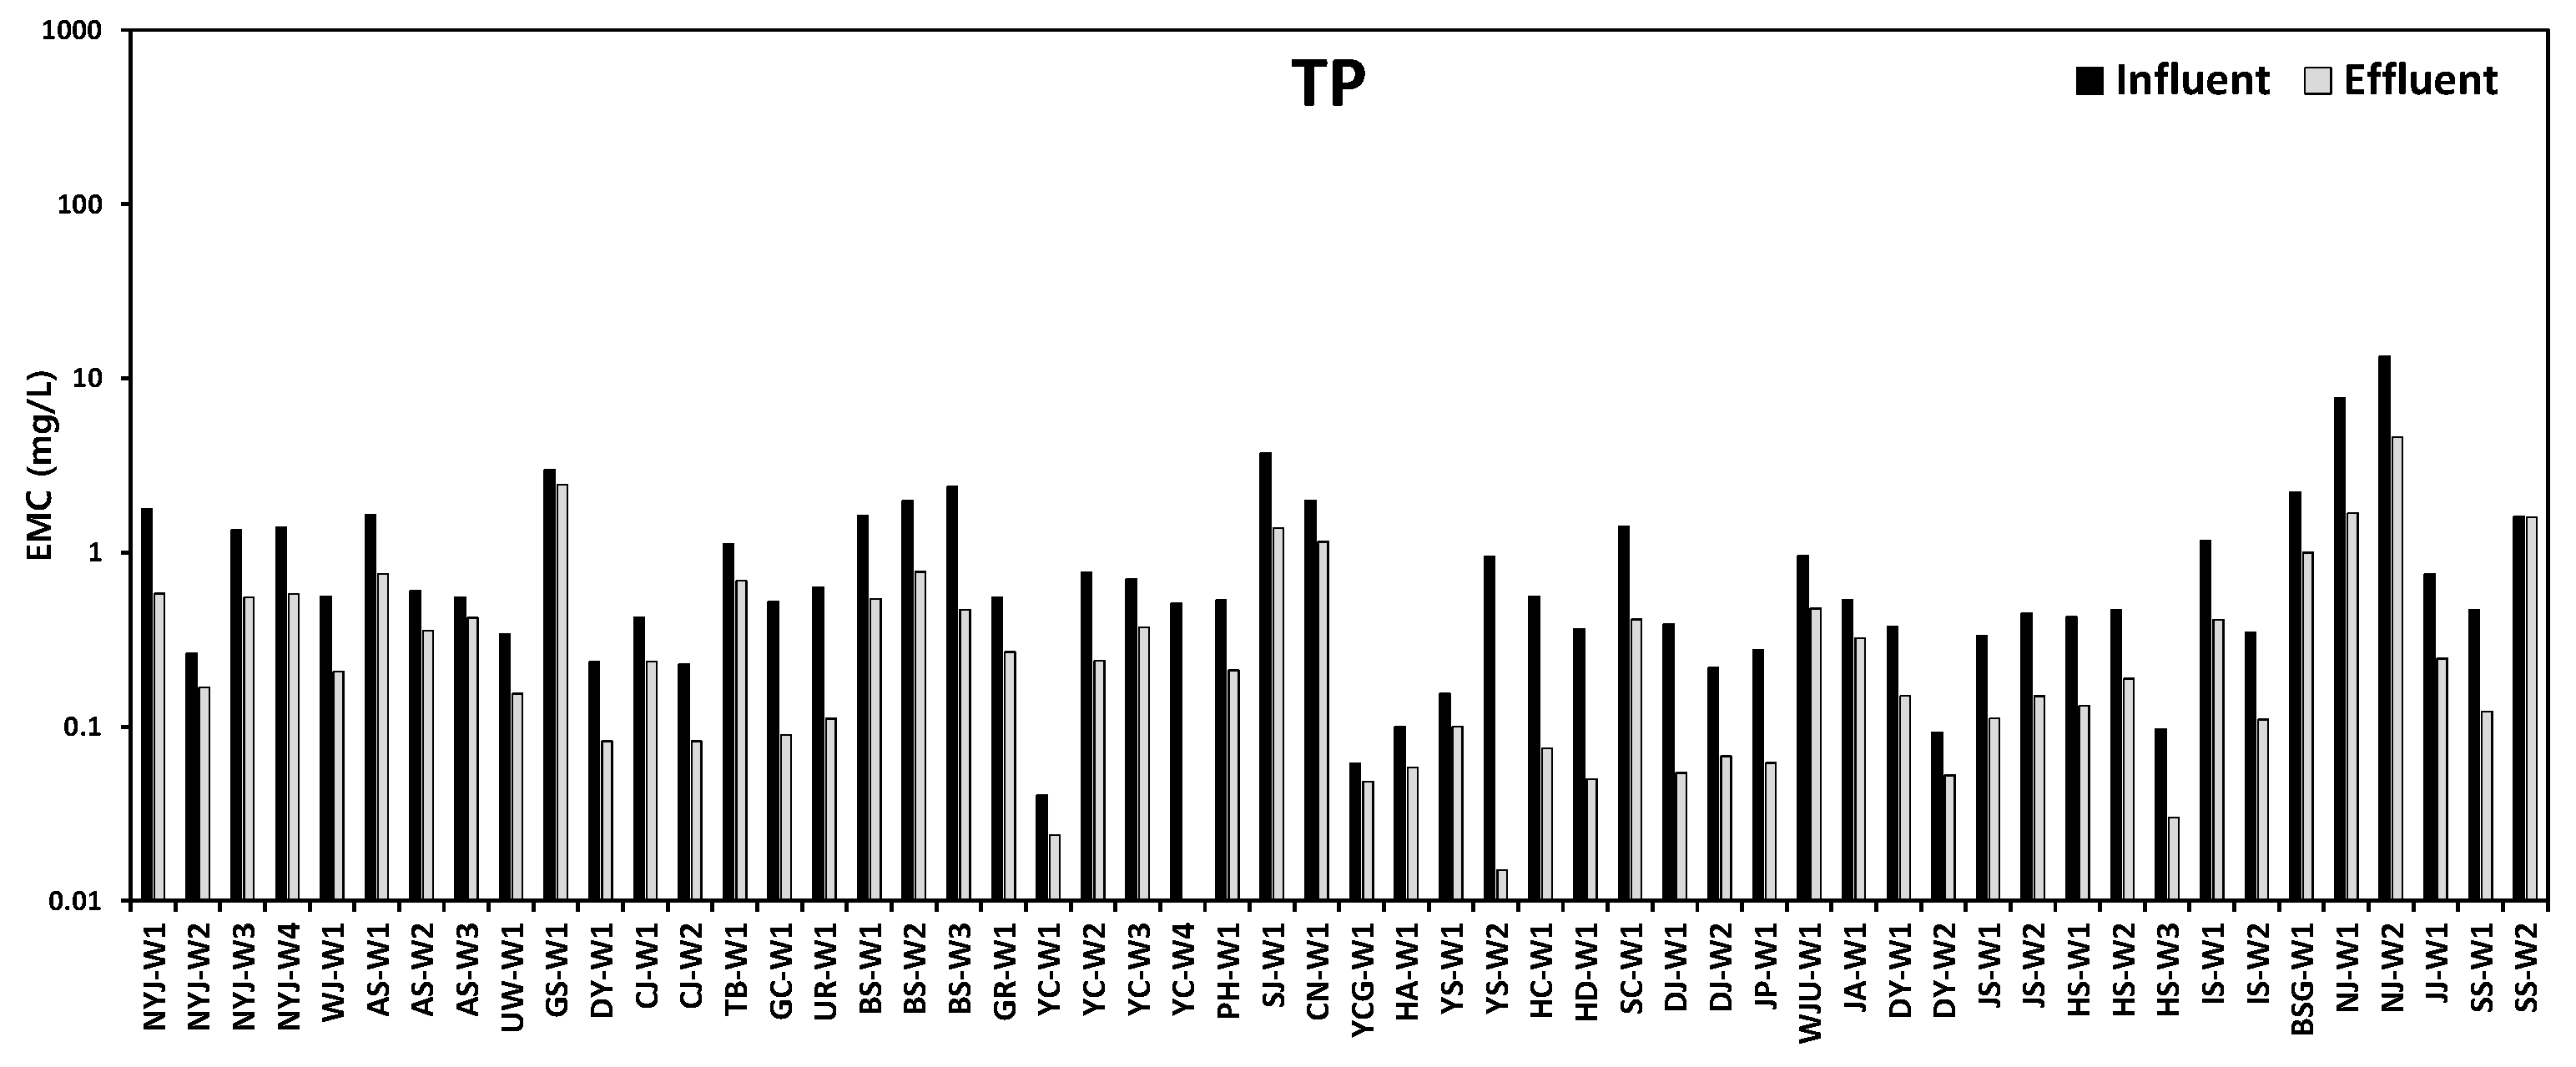
3.1. EMC of Pollutants in Constructed Wetland Influent and Effluent

The average inflow and outflow EMCs of the monitored constructed wetlands are illustrated in Figure 3. The influent EMC (mean ± standard deviation) of SS, BOD, COD, TN, and TP were 70.7 ± 74.7, 15.2 ± 19.6, 23.8 ± 23.1, 12.6 ± 17.4, and 1.2 ± 2.1 mg/L, respectively. In the case of effluent, the EMC of SS, BOD, COD, TN, and TP were found to be 21.2 ± 39.1, 5.5 ± 4.1, 10.4 ± 7.1, 5.9 ± 8.7, and 0.5 ± 0.7 mg/L, respectively. Approximately 70% of the monitored facilities had influent BOD concentrations less than the average BOD concentration (15 mg/L) of the 54 monitored constructed wetlands, indicating that only 30% of the facilities received highly polluted runoff. The constructed wetlands receiving considerably low influent BOD concentrations also exhibited up to 89% increased effluent concentrations. Similar to the BOD, the majority of the facilities (59.9%) had influent COD concentrations less than the observed mean value of 20 mg/L, prompting a 29 to 89% increase in the effluent concentrations. The influent SS concentrations of 28 facilities were below the average influent SS concentration (40 mg/L) of all the wetlands, but a 40 to 88.9% increase in the SS effluent concentration was observed on 46 facilities. The average influent TN and TP concentrations in the constructed wetlands amounted to 10 and 0.5 mg/L, respectively. Similar to other pollutant parameters, more than half of the monitored wetlands discharged higher pollutant concentrations as compared with the inflow concentrations. Negative removal efficiencies of constructed wetlands were also widely reported in different studies. Perdana et al. (2020) cited the decay of plant organs inside constructed wetland systems and a low hydraulic retention time (HRT) as the primary causes of the negative BOD and COD removal. Plant residues in the substrate increased the organics loading in the facility, whereas inadequate contact times limited the anaerobic conditions within the media [44]. Negative removal rates of nutrients were also reported in the constructed wetlands studied by Land et al. (2016). The subsequent mineralization and release of phosphorus compounds in sediments can increase the TP concentrations in water, whereas nitrogen removal was found to be negatively correlated with hydraulic loading [45]. In facilities where the influent pollutant concentrations were relatively high, the pollutant concentrations were greatly reduced after passing through the constructed wetland systems, which indicated that adequate pollutant removal was performed. Organics (BOD and COD) and TN were removed through the phytoremediation mechanisms imparted by plants and microbiological activities. Additionally, since plants can induce flow retardation, these components also aid in the sedimentation of particulates containing adsorbed phosphorus compounds.
The influent and effluent EMCs for the analyzed pollutants did not show a definite trend or correlation (R = 0.12). The influent pollutant concentrations in a constructed wetland are greatly affected by rainfall and catchment characteristics. High stormwater runoff volumes tend to dilute the pollutant concentrations in the influent; however, greater rainfall intensities also increase the magnitude of first flush, especially in urban areas [46,47]. The lowest influent BOD concentration (1.1 mg/L) was observed in YCG-W1, whereas the highest was noted in SJ-W1 (135.8 mg/L). Both wetlands are located in agricultural regions; however, a large difference in the influent BOD concentrations was attributed to the difference in the catchment area characteristics. Land use and drainage systems have a direct effect on the distribution of NPS pollutants in a watershed. Peak runoff volume and the time-to-peak can vary greatly depending on the basin shape. If the upstream portion of the basin is wide, the time-to-peak increase, and the number of washed-off pollutants can also be greater. Further analysis revealed that YC-W1 had the lowest effluent BOD concentration (0.5 mg/L); SJ-W1 had the highest effluent BOD concentration (19.8 mg/L). Generally, the constructed wetland effluent can be mainly influenced by the facility design (i.e., shape, size, and wetland components) and influent characteristics [48,49,50,51,52].
The lowest influent and effluent COD concentrations, with values amounting to 1.4 and 2.2 mg/L, respectively, were observed on YC-W1. More than 80% of YC-W1′s catchment area was made up of forests, thereby resulting in limited pollutant sources within the basin. The highest influent (152.6 mg/L) and effluent (43.8 mg/L) COD concentrations were recorded at the SJ-W1 constructed wetland, since its catchment area was dominated by urban and agricultural areas. In most cases, urban and agricultural areas are characterized by diverse pollutant sources with relatively high concentrations due to the increased anthropogenic activities. In constructed wetlands, plants and microorganisms serve as essential components for effective pollutant removal. Moreover, the effluent COD concentration tends to increase proportionally alongside the increase in influent concentration [53].
The lowest influent (2.1 mg/L) and effluent SS concentrations (1.2 mg/L) were also observed in YC-W1. Contrary to the undisturbed forest catchments, the highest influent SS concentration (301.7 mg/L) was noted in WJ-W1, which receives runoff from a catchment area harboring several livestock facilities. SS-W2 had the highest effluent SS concentration, amounting to 274 mg/L. Constructed wetlands usually undergo a stabilization stage in order to reach maturity for adequate pollutant removal performance. Since the construction of SS-W2 was just completed in the year 2018, the facility was still undergoing a stabilization period when the monitoring was conducted.
Similar to other constructed wetlands situated on undisturbed catchments, the lowest influent (1.2 mg/L) and effluent (0.9 mg/L) TN concentrations were observed at HS-W2, wherein 60% of the total catchment area was made up of forests. SJ-W1, which is situated in an agricultural and urban catchment, had the highest influent and effluent TN concentrations amounting to 102.6 and 57.7 mg/L, respectively. YCW-W1 had the lowest influent TP concentration (0.04 mg/L) among all the monitored constructed wetlands. The presence of several agricultural and urban spaces in NJ-W2′s catchment resulted in the detection of the highest influent and effluent TP concentrations amounting to 13.4 and 4.6 mg/L, respectively.
The influent and effluent pollutant concentrations in the constructed wetlands were found to be greatly affected by the land-use type, rainfall characteristics, and facility design. The agricultural, livestock, and urban land use have greater potential to increase the pollutant concentrations in the runoff due to a wide array of anthropogenic activities that contribute to the generation of pollutants. Forest areas have relatively lower runoff pollutant concentrations as compared with developed catchments. Aside from minimal anthropogenic influence, natural landscapes have natural water purification processes (natural soil filtration and infiltration, canopy interception, phytoremediation, etc.). Since the runoff from forest areas has lower pollutant concentrations, it may not be necessary to use constructed wetlands to improve its water quality. Constructed wetlands should be feasibly located in areas close to non-point sources of pollution, such as agricultural, livestock, and urban areas, in order to maximize its treatment benefits. Among the 54 monitored constructed wetlands, the five facilities receiving the most polluted runoff were situated in catchment areas with a predominantly agricultural, livestock, and urban land use type. On the other hand, the facilities receiving the least polluted runoff were located in areas that are mainly composed of mixed forest and agricultural land uses. The effluent pollutant concentrations in SS-W2 were higher as compared to its influent pollutant concentrations. During the monitoring period, SS-W2 can still be considered in its stabilization phase since the facility was relatively new. A stabilization period of two years may be necessary to allow adequate plant growth and the establishment of microbial colonies that aid in the constructed wetlands’ pollutant treatment mechanisms. Generally, a constructed wetland can only be effectively assessed after it has reached a stable stage.

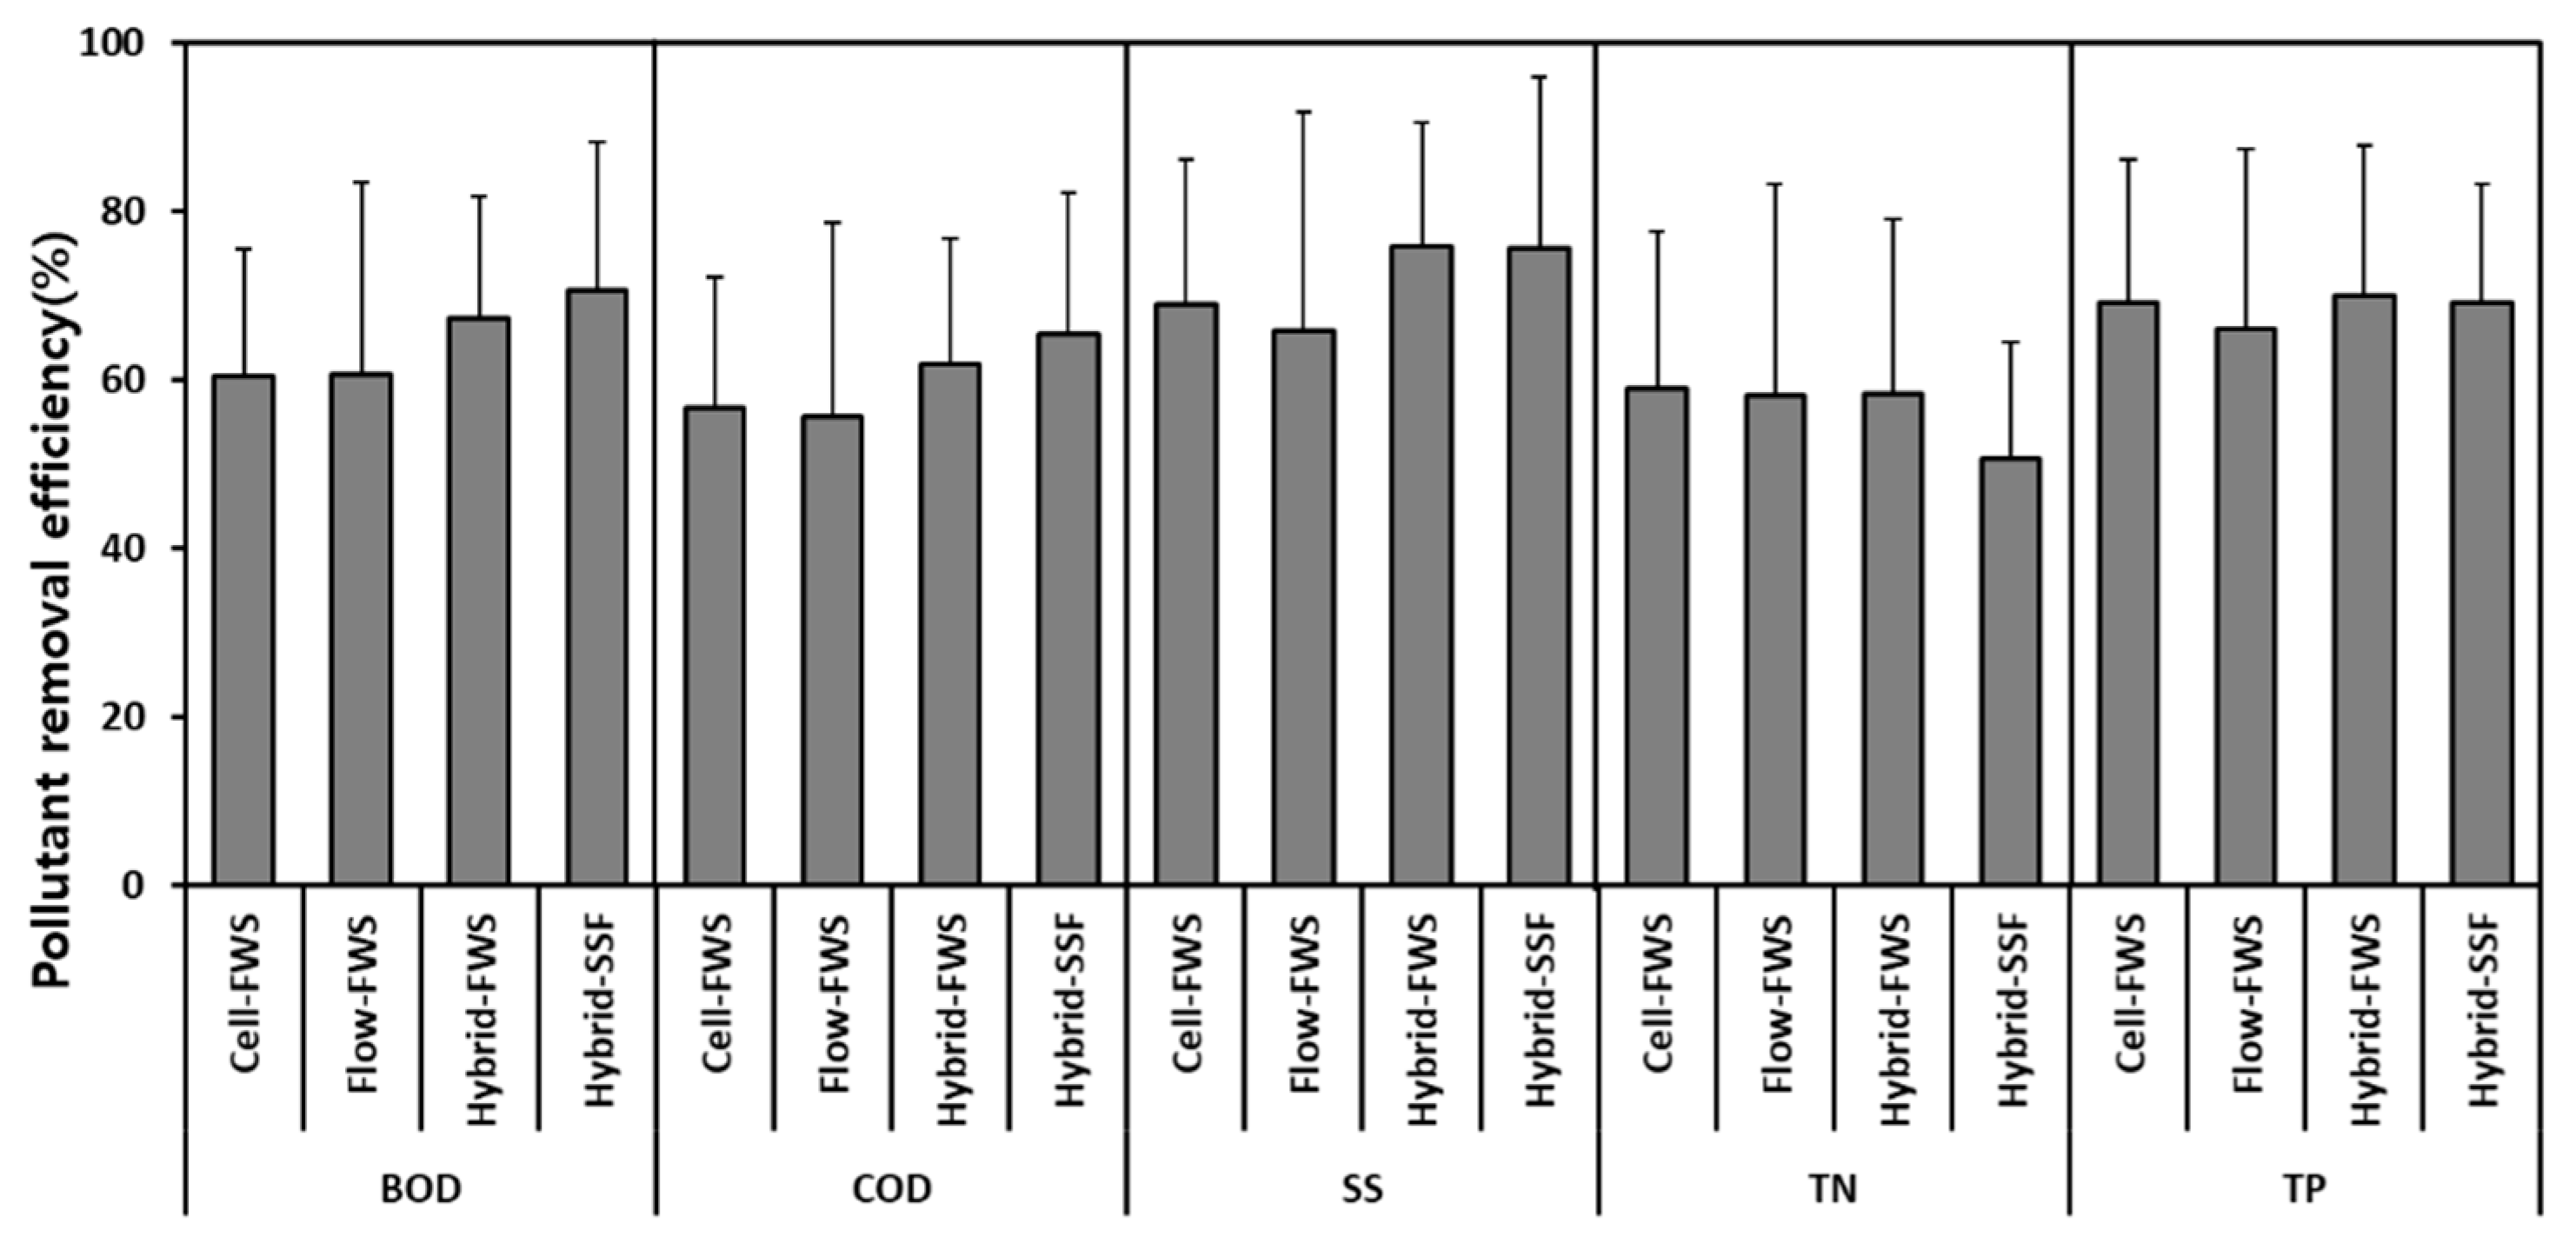
3.2. Characteristics and Pollutant Removal Performance of Different Constructed Wetland Types

The mean pollutant removal performance of the different types of constructed wetlands is exhibited in Figure 4. The hybrid constructed wetlands showed 1.2 to three times greater pollutant removal efficiencies as compared with cell- or flow-type facilities. The BOD removal in Hybrid-SSF and Hybrid-FWS constructed wetlands amounted to 70.6 and 67.2%, respectively, whereas the Cell-FWS and Flow-FWS wetlands have a comparable BOD removal efficiency of 60.5%. The highest mean COD reduction efficiency was observed in the Hybrid-SSF constructed wetlands (65.4%) followed by the Hybrid-FWS (61.8%), Cell-FWS (56.7%), and then Flow-FWS types (55.6%). The results presented by Bang et al. (2019) also highlighted the effectiveness of hybrid constructed wetlands in treating organics, wherein the combination of VF and HF systems exhibited the effective removal of bulk organic matter in the influent wastewater. The oxic condition in the VF constructed wetland initiated the effective removal of biodegradable organic matter, whereas the HF constructed wetland component of a hybrid system efficiently reduced the biodegradable organic matter concentration [54]. The hybrid-FWS constructed wetlands showed the highest average SS reduction (75.8%), while Hybrid-SSF, Cell-FWS, and Flow-FWS also provided satisfactory SS treatment with mean removal efficiencies ranging from 65 to 75.6%. The SS removal of the constructed wetlands investigated in this study was comparable to the values obtained from other inquiries. Vymazal and Březinová (2018) reported an SS removal of up to 67% from a constructed wetland treating agricultural runoff [55]. The wastewater treatment wetland studied by Slak et al. (2005) had an SS removal efficiency of 65%. Slak et al. (2005) highlighted the contribution of macrophytes in the effective removal of SS in a constructed wetland. Macrophytes provide the water surface with shade from sunlight and, thus, prevent the growth of algae that contribute to the amount of SS. Moreover, the biofilms formed in the stem of constructed wetland plants also aided in the sorption of suspended matter [56]. Generally, constructed wetlands can serve as excellent sediment traps due to the provisions for particle settling and filtration incorporated in their design.
Different processes are involved in the removal of nutrients in a constructed wetland. Microorganism-induced nitrification and denitrification are considered as the major pathways of nitrogen removal in constructed wetlands, whereas phosphorus can be removed through sorption in the substrates, sedimentation, and algal or macrophyte assimilation [57,58,59]. Among the monitored facilities, the most profound TN reduction (59%) was observed in Cell-FWS wetlands, while other wetland types did not show considerable differences in TN reduction (50.7 to 58.2%). FWS constructed wetlands can provide different redox conditions for enhanced nitrification and denitrification. On the other hand, the constructed wetlands with filter beds had lower pollutant removal efficiencies as compared with the other facility types due to the inadequate retention time needed to effectively accomplish the nitrification and denitrification processes [60]. The mean TP removal efficiencies of Hybrid-FWS, Hybrid-SSF, Cell-FWS, and Flow-FWS constructed wetlands were 69.8, 69.2, 69.1, and 65.9%, respectively.

3.3. Influence of Constructed Wetland Design on Pollutant Removal Performance

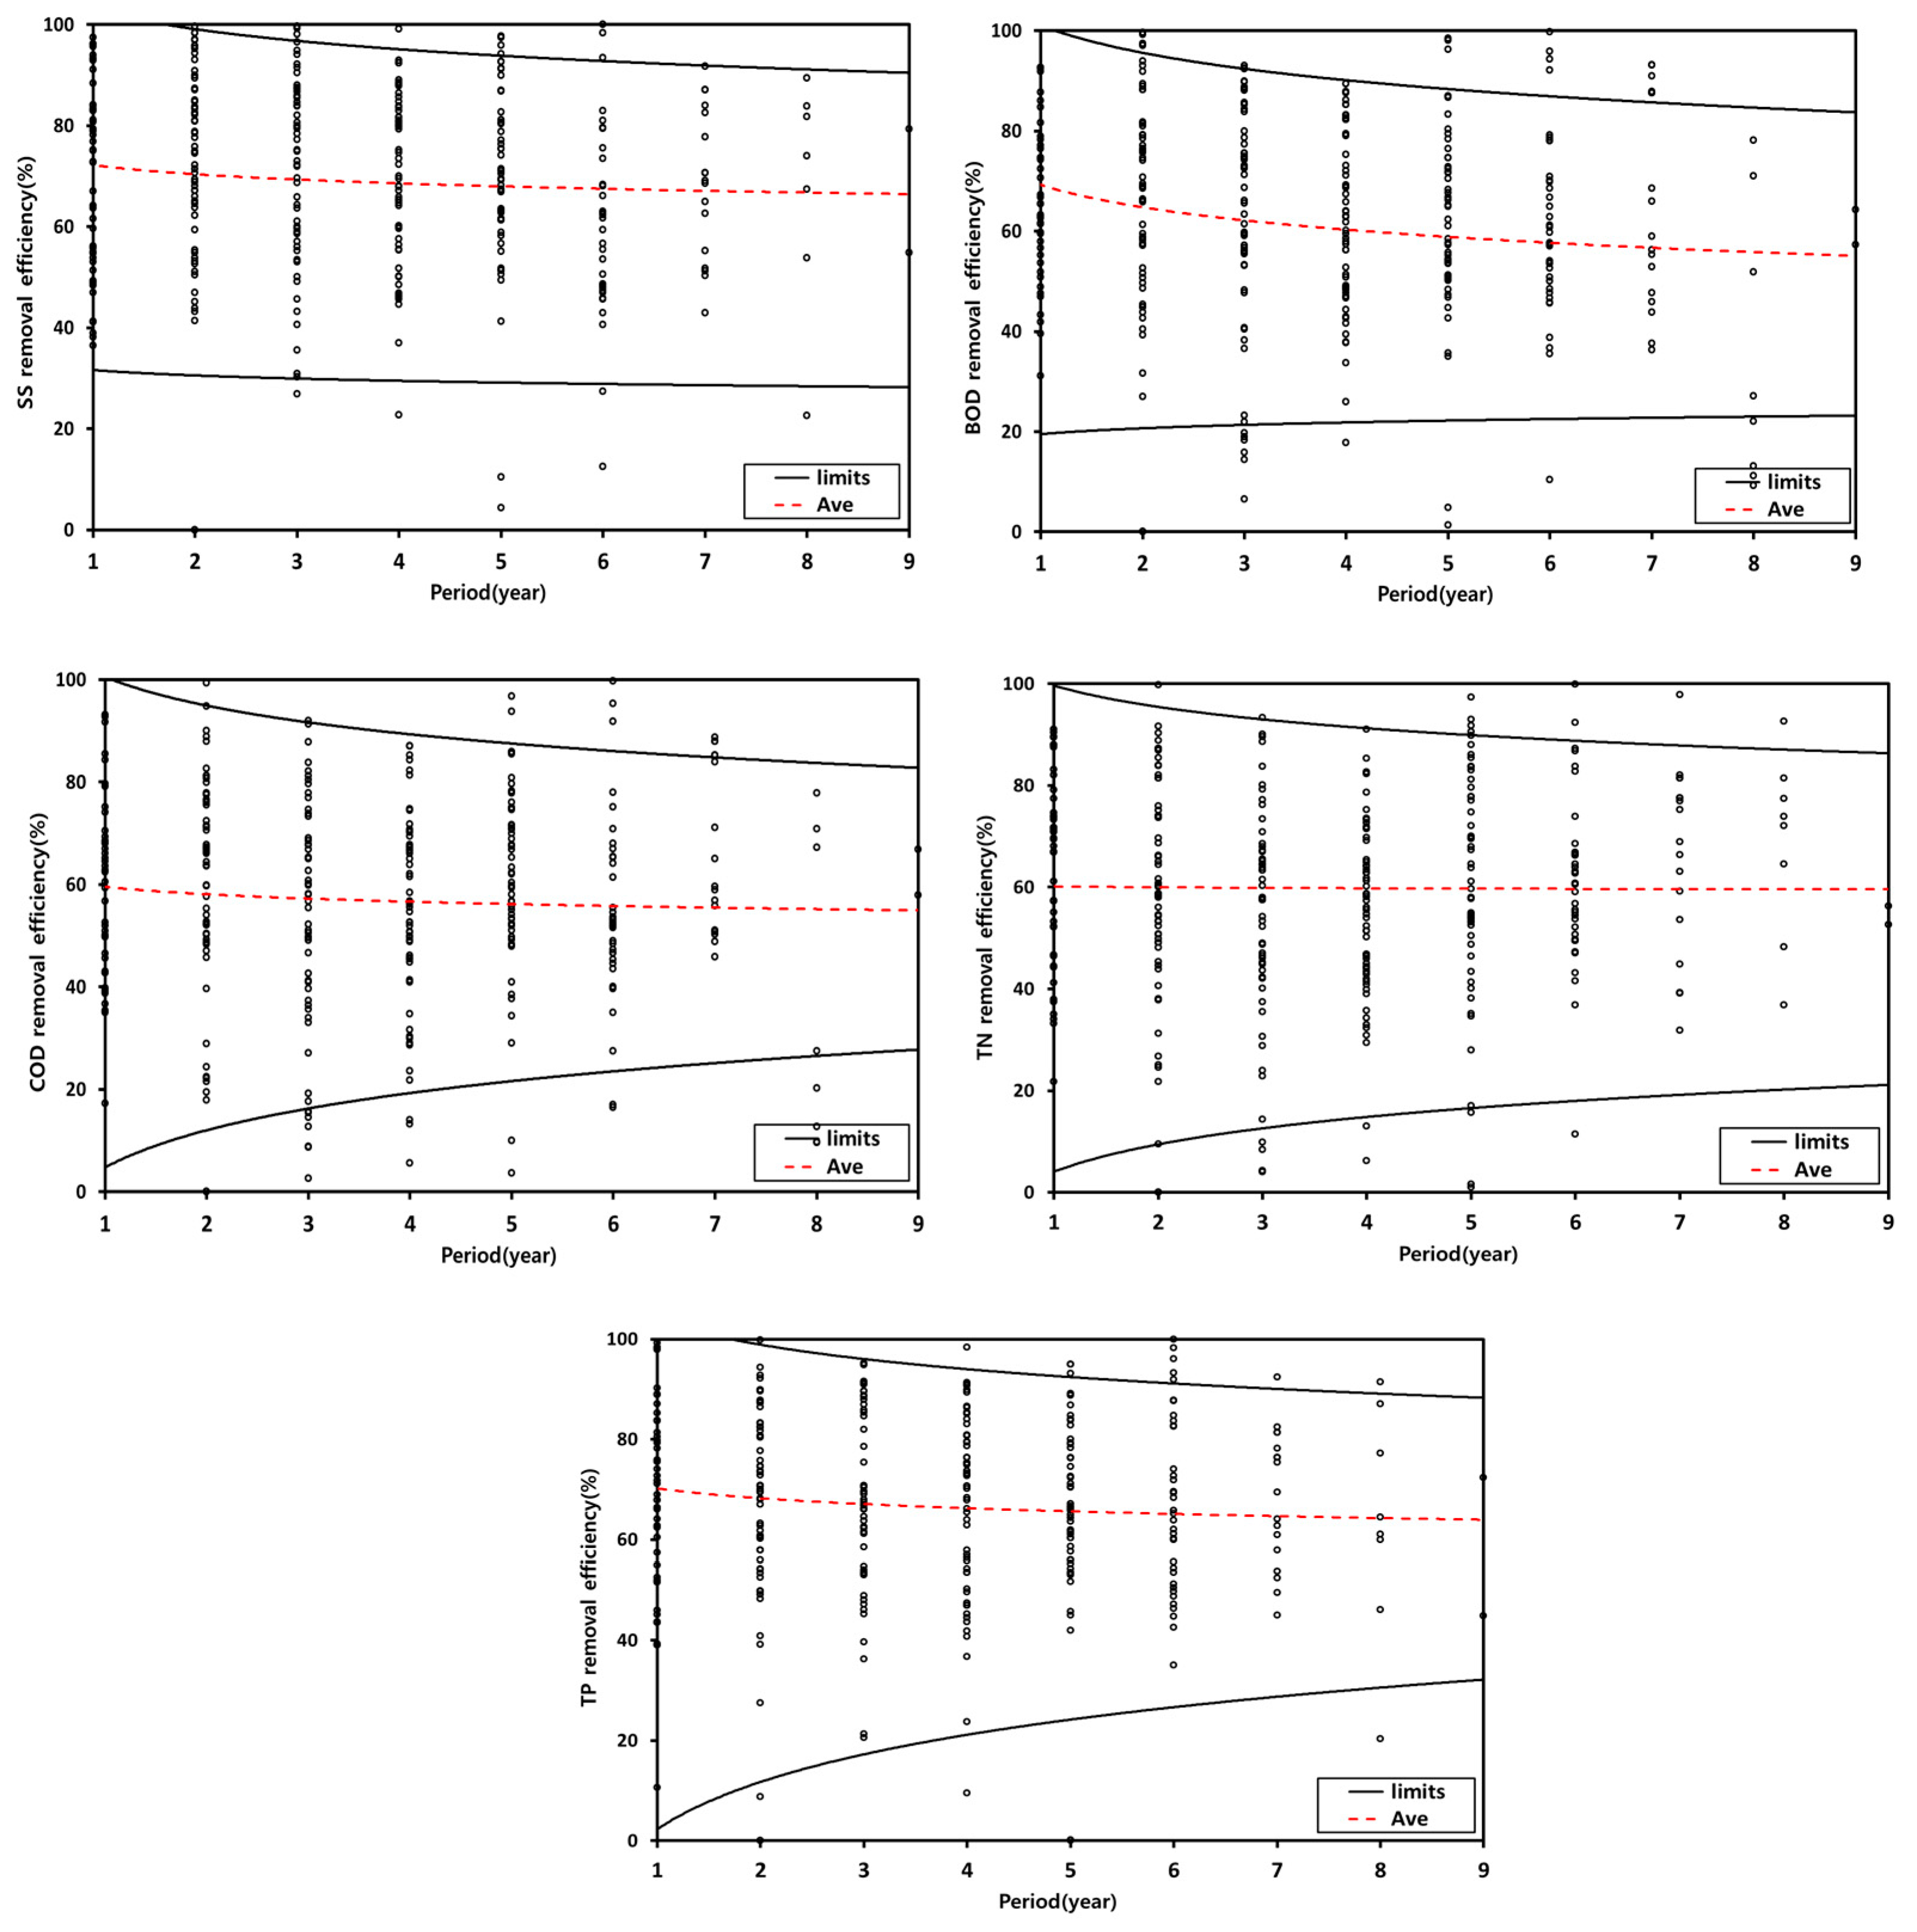
3.3.1. Pollutant Removal Performance of Constructed Wetlands with Respect to the Period of Operation

The changes in the pollutant removal performance of the constructed wetlands with respect to the period of operation are shown in Figure 5. The efficiency of the facilities may vary greatly due to the influence of influent pollutant concentrations, the hydraulic and hydrologic characteristics of monitored events, the degree of wetlands stability, and the effect of maintenance activities [61]. Based on the mean removal efficiency, the wetlands stabilization period for the steady removal of BOD and COD was four to five years. In the case of particulate matter (SS) and nutrients (TN and TP), consistent patterns of removal were observed after two to three years of operation. A closer examination of the individual removal efficiencies indicated that a five-year stabilization period is required to achieve stable nutrients and organic matter removal, whereas the particulates removal did not show notable differences with respect to the year of operation.
Constructed wetlands usually have low plant density during the early stages of operation. The soil layers in artificial systems may also have significantly different characteristics as compared with natural wetlands. Due to the abovementioned reasons, constructed wetlands may not exhibit adequate pollutant removal capabilities during the early stages of operation due to the unstable formation of microbial colonies and vegetative covers. While the components for biological remediation are developing in newly constructed wetlands, sedimentation, filtration, and adsorption can be considered as the dominant treatment mechanisms for stabilizing wetland systems. Unlike natural wetlands, where peat layers are well-formed, some constructed wetlands use engineered soil layers with highly variable characteristics. Constructed wetland soils have low organic matter and nutrient contents at the beginning of operation, making them reliable sinks for the adsorption, deposition, and decomposition of pollutants [50]. Sparsely vegetated systems may also show the low potentials of pollutant removal by means of phytoremediation.

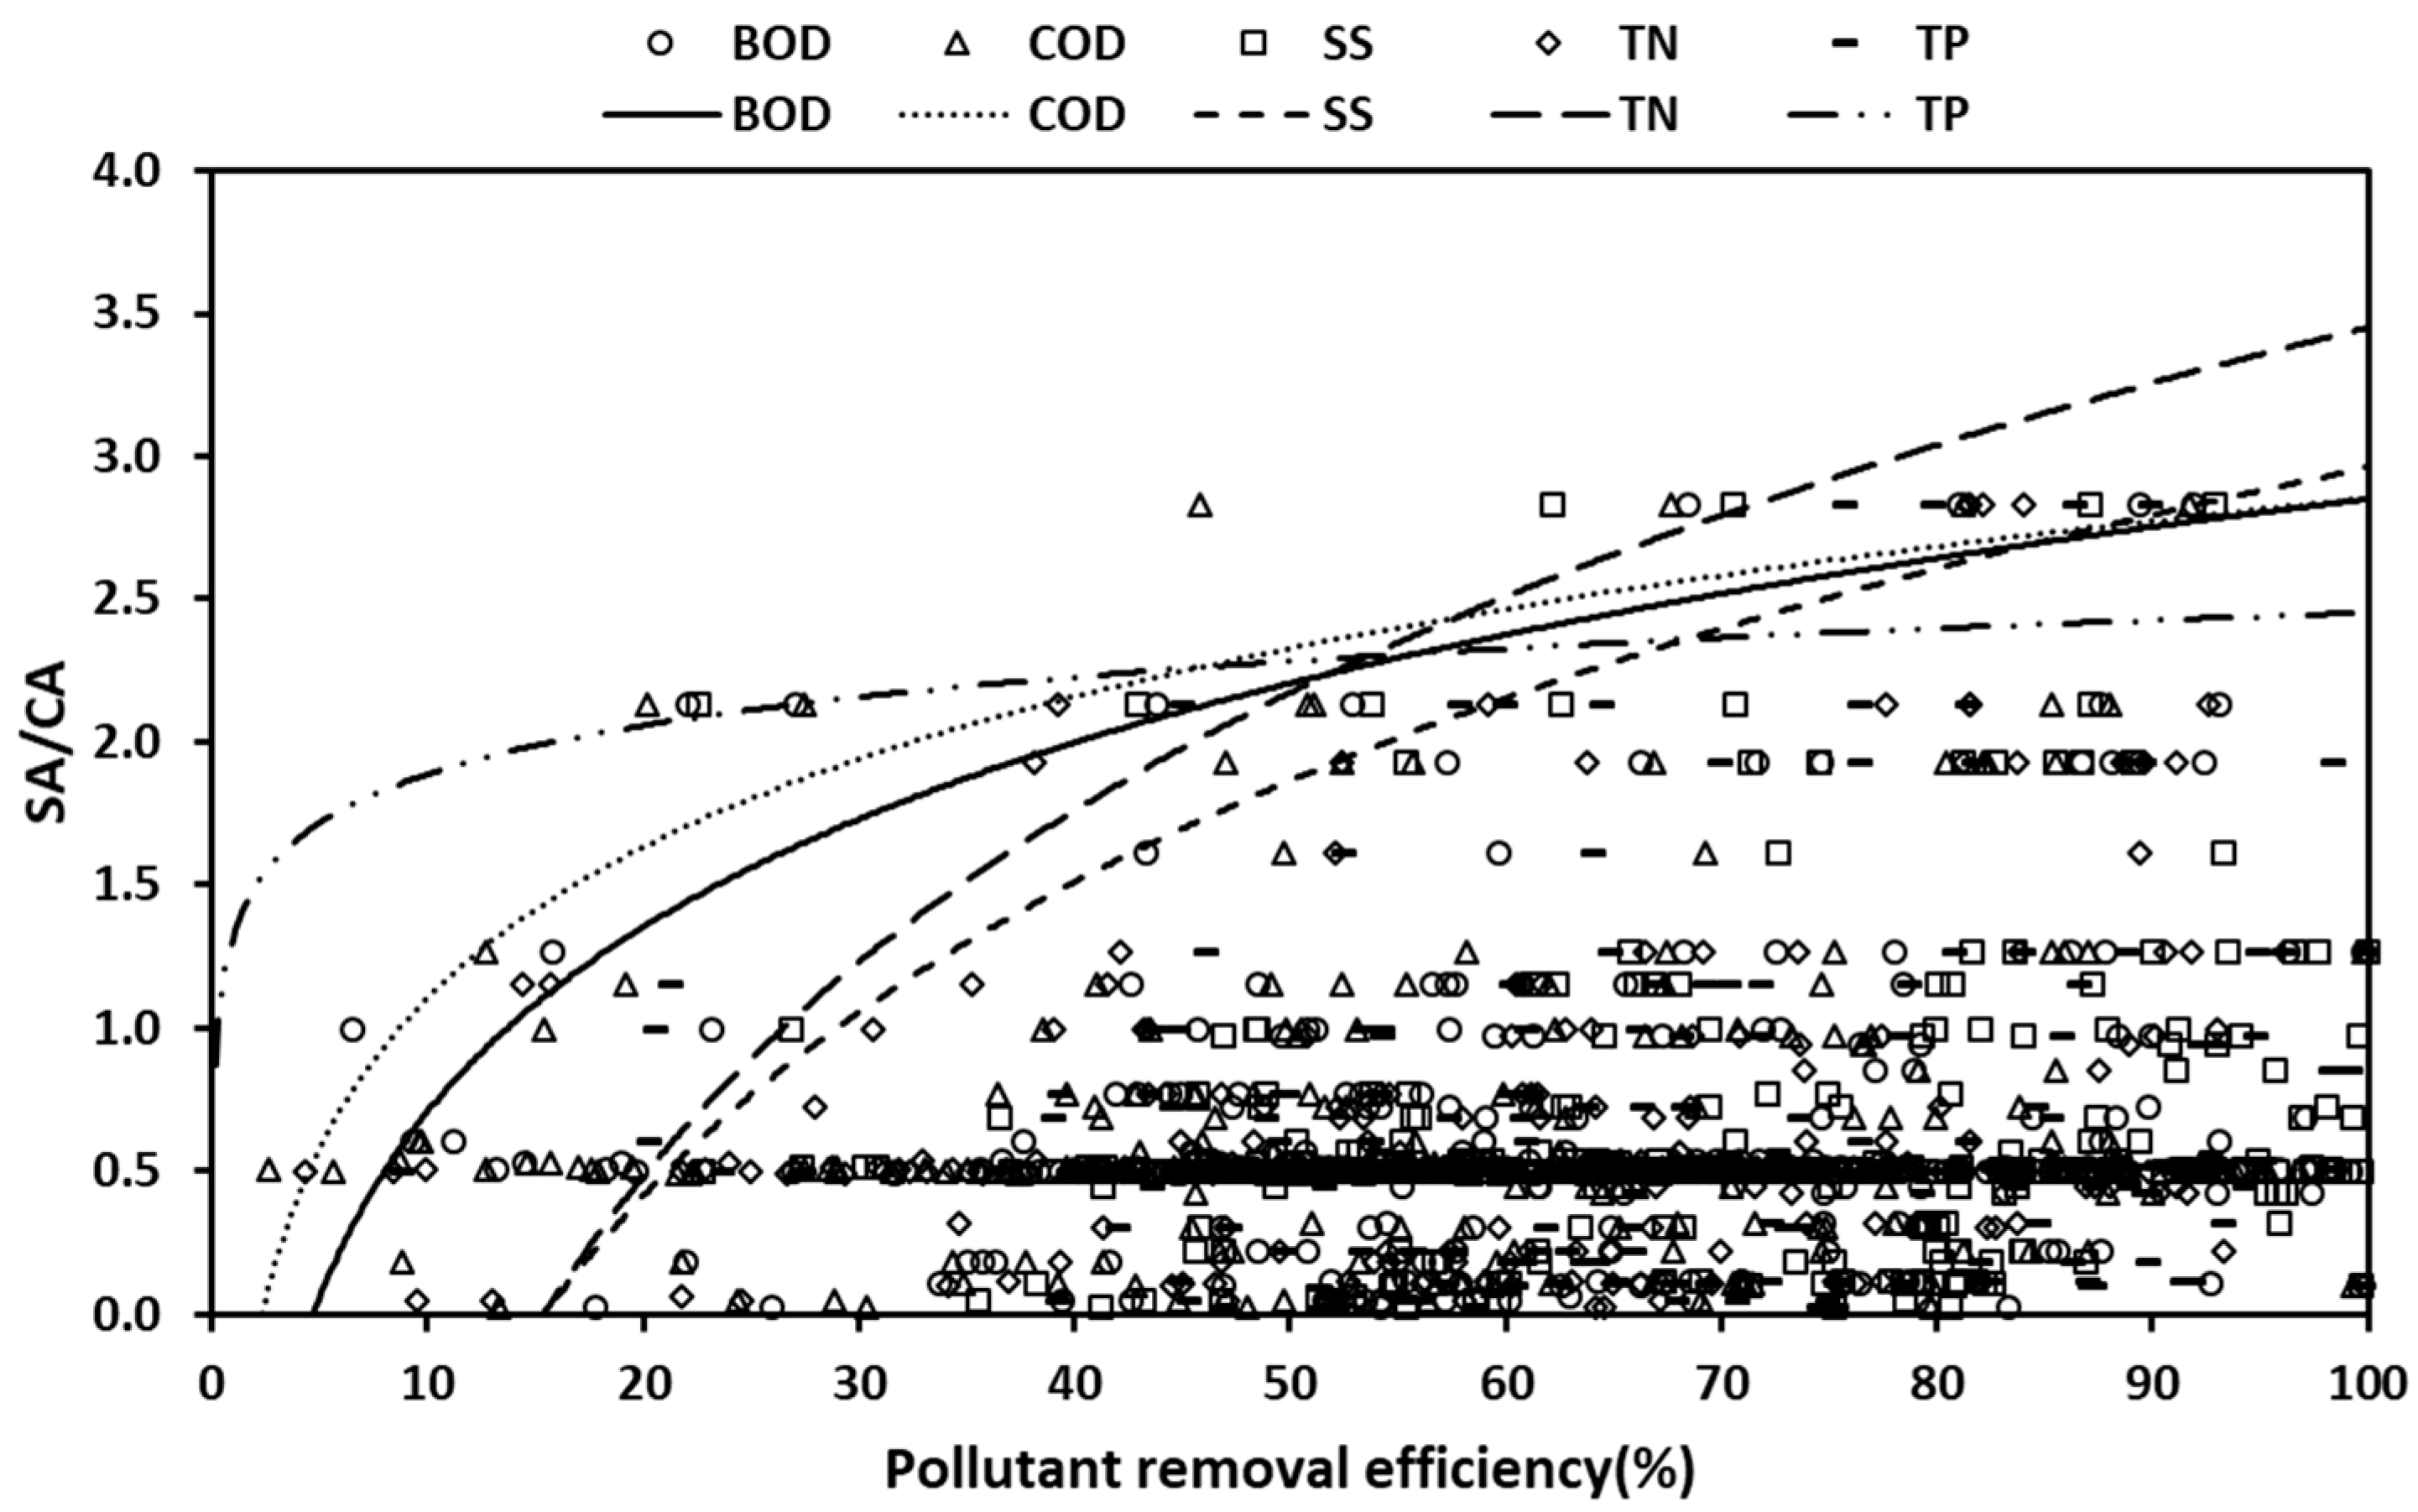
3.3.2. Effects of Facility Size in Pollutant Removal

The pollutant removal efficiency of constructed wetlands in relation to the SA/CA ratio is illustrated in Figure 6. Analyses revealed that the pollutant removal performance of the facilities is significantly correlated with the SA/CA ratio (R = 0.51, p < 0.01). The facilities with higher SA/CA ratios yielded greater efficiencies in reducing pollutant concentrations. Considering the target removal efficiency of 60%, the required SA/CA ratios for BOD, COD, SS, TN, and TP were 3.2, 2.5, 1.9, 2.5, and 2.3%, respectively. This implied that larger facility sizes are needed to achieve higher treatment efficiencies for organics as compared with nutrients and particulates. Moreover, relatively small facilities are sufficient to retain SS in the system. A study conducted by Choi et al. (2018) regarding the optimum SA/CA ratio for the adequate pollutant removal by constructed wetlands also showed comparable results. It was indicated that the optimum SA/CA ratio may vary depending on the constructed wetland type and influent water quality and thus, it is necessary to consider these factors to achieve the target pollutant reductions [62]. Hsu et al. (2011) also highlighted the benefits of constructed wetlands with a large surface area and high macrophyte coverage in achieving greater water quality improvement and biodiversity benefits. The size of constructed wetlands greatly impacted its water purification capabilities and the species richness of fishes and abundance of birds [63].

3.4. Development and Application of Comprehensive Evaluation Index for Constructed Wetlands

3.4.1. Assessment of Index Weights

The weights of indices utilized in the comprehensive evaluation are presented in Table 4. The items in the treatment efficiency index received the highest weights, indicating that pollutant removal and flow regulation were regarded as the most important functions of constructed wetlands. The role of constructed wetlands in preserving or improving the aquatic habitat and the operation and management conditions were found to be equally important considerations in evaluating the sustainability of constructed wetlands. In relation to its treatment function, constructed wetlands aid in the preservation of the aquatic ecosystem and biodiversity through its water purification capabilities. Operation and management are also important considerations since nature-based facilities require adequate maintenance to achieve optimum functionality and benefits. Among the indices, cultural efficiency had the least weight, implying that the function of constructed wetlands as a recreational facility was the least essential.

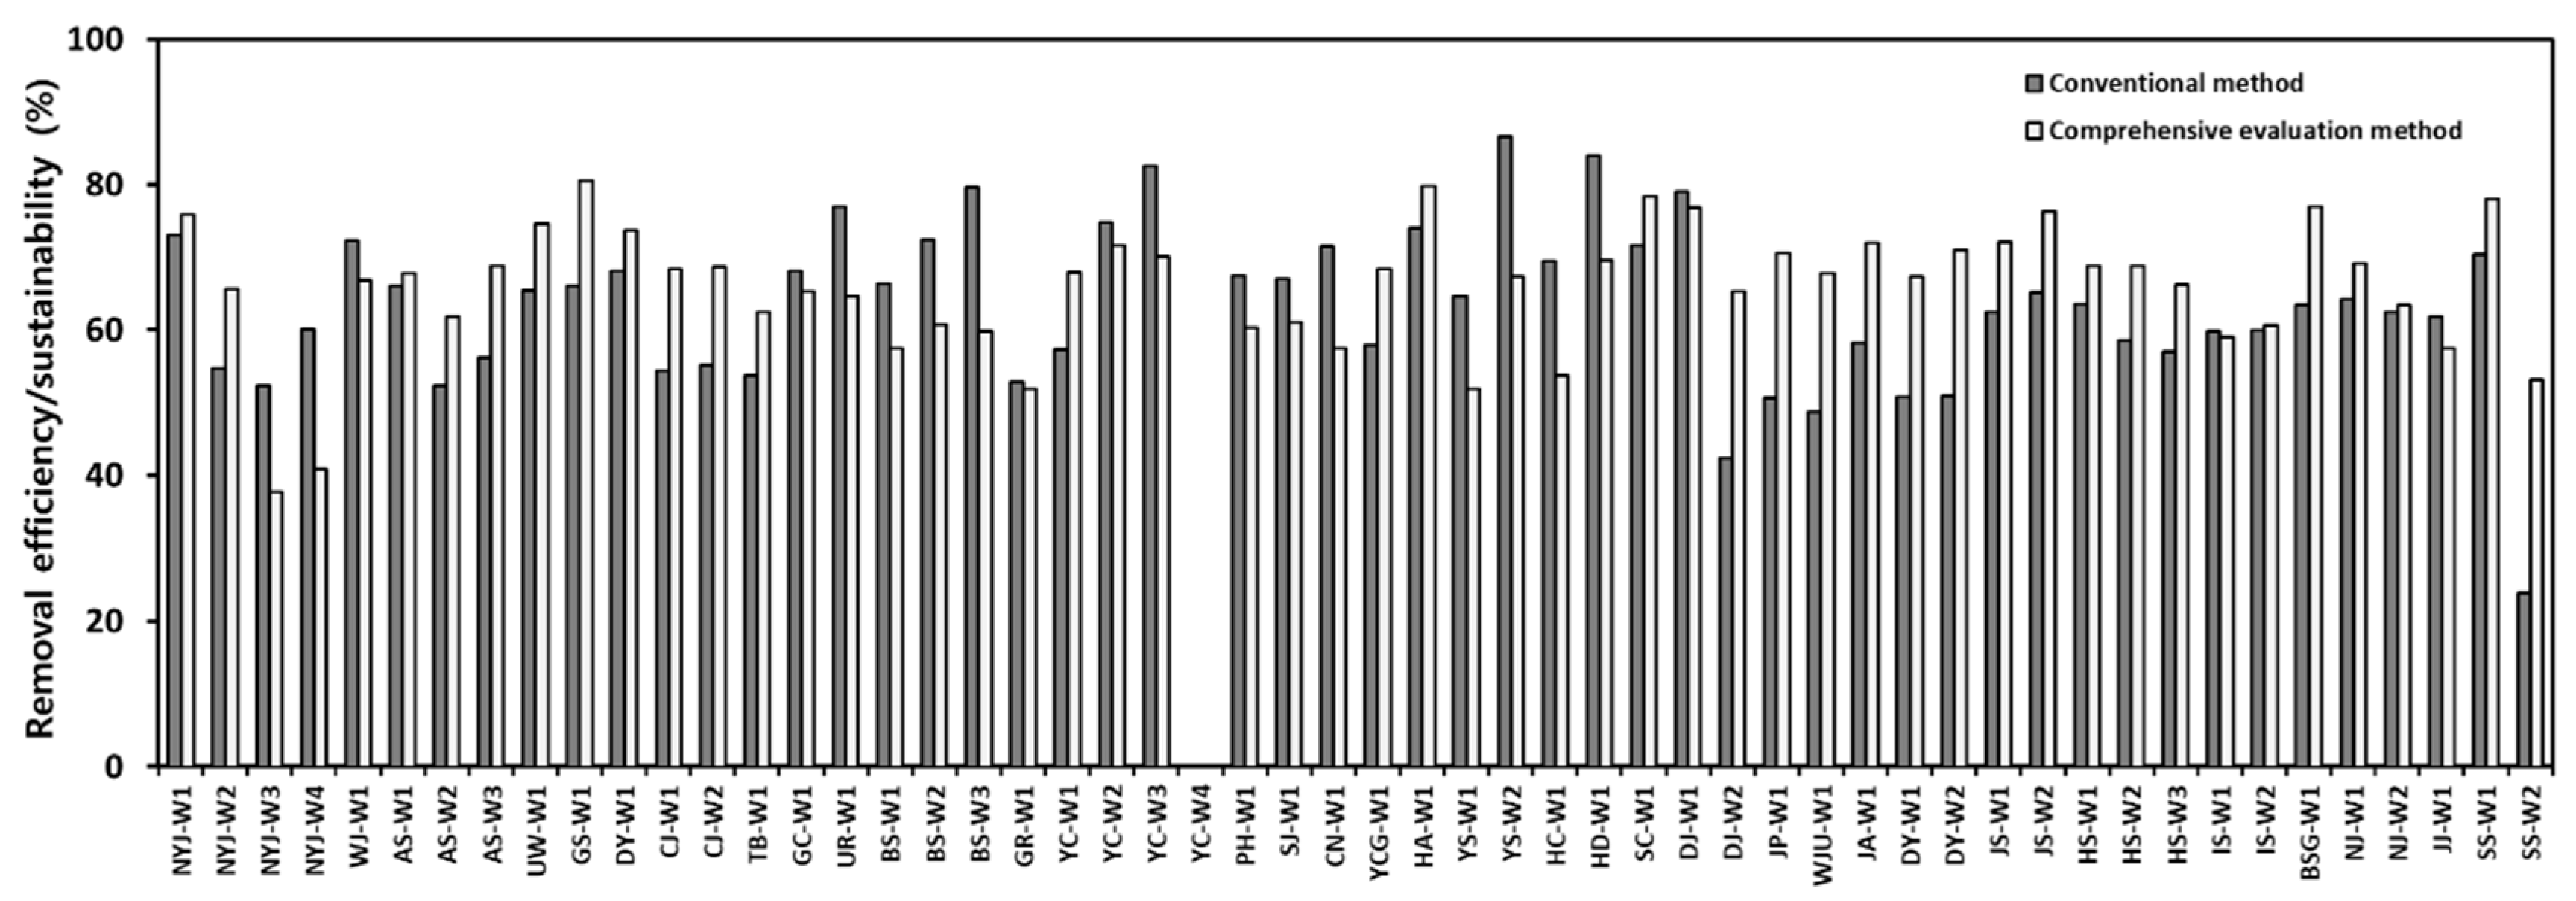
3.4.2. Application of the Developed Comprehensive Evaluation Indices to the Monitored Constructed Wetlands

The results presented in Figure 7 highlighted the comparison of the conventional constructed wetland assessment based on removal efficiency and the comprehensive evaluation method developed in this study. Using the comprehensive assessment method, only one facility was found to be in “Bad” condition, 10 had a “Normal” status, 41 were assessed to be in “Good” condition, and a single constructed wetland was categorized as “Very Good.” When the conventional method of constructed wetlands assessment was employed, the mean efficiencies of the monitored facilities were found to be 23.8 to 86.6%. On the other hand, the comprehensive assessment yielded sustainability scores ranging from 37.7 to 80.6%. A total of 31 facilities had higher overall efficiencies and 23 had lower overall efficiencies when the comprehensive evaluation method was employed. The inclusion of ecological function and landscape management status resulted in the increased overall sustainability of the 31 facilities. On the other hand, most facilities that had lower overall efficiencies after the comprehensive evaluation was affected by poor cultural efficiency (i.e., accessibility to the public and social benefits) and operation and landscape management (i.e., maintenance). In order to improve the overall constructed wetland efficiency and sustainability, it is, therefore, necessary to enhance the cultural functions of the facilities and conduct adequate landscape management.

4. Conclusions

Constructed wetlands serve as important nature-based facilities that aid in environmental restoration and sustainable development. This study evaluated the current status of various constructed wetlands installed across South Korea to determine the sustainability of these facilities in performing various ecosystem services. Constructed wetlands installed in agricultural and urban areas receive highly polluted runoff that can potentially degrade the receiving water bodies. Since the runoff from forested catchments contains relatively low pollutant concentrations, it is recommended to install the facilities in locations close to the point or non-point source pollution sources. The stabilization period of constructed wetlands usually takes four to five years to effectively treat the organics (i.e., BOD and COD) and approximately two to three years to achieve the adequate removal of the particulates and nutrients in the water. In terms of the constructed wetland type, hybrid systems were the most effective in the reduction in organics (61.8 to 70.6%), particulates (75.8%), and TP (69.2 to 69.8%), whereas the cell-type FWS constructed wetlands performed well in the removal of TN (59%). Considering the 60% pollutant removal efficiency and a fixed SA/CA ratio, the effectiveness in pollutant reduction was found to be in the order of organics > nutrients > particulates. As compared to the conventional pollutant removal-based efficiency evaluation, the comprehensive evaluation method provided a more strategic tool for identifying the facilities’ strengths and weaknesses. The results of this study can be used to make significant improvements in the current operating conditions of the facilities installed across South Korea. Moreover, the multi-criteria performance index developed in this inquiry can be utilized as a general tool for evaluating the sustainability of similar nature-based facilities.

Supplementary Materials

The following are available online at https://www.mdpi.com/article/10.3390/su131810410/s1, “Experts Survey on Constructed Wetlands (AHP)”.

Author Contributions

H.C.: Conceptualization, methodology, software, validation, formal analysis, investigation, resources, data curation, writing—original draft preparation, and visualization. N.J.D.R.: Methodology, investigation, writing—review and editing, visualization, and supervision. M.J.: Methodology and investigation. L.-H.K.: Conceptualization, writing—review and editing, supervision, project administration, and funding acquisition. All authors have read and agreed to the published version of the manuscript.

Funding

This research was funded by the Kongju National University in Korea Research Project 2021. The authors were grateful for their support.

Institutional Review Board Statement

Not applicable.

Informed Consent Statement

Not applicable.

Data Availability Statement

Not applicable.

Conflicts of Interest

The authors declare no conflict of interest.

References

  1. Findell, K.L.; Berg, A.; Gentine, P.; Krasting, J.P.; Lintner, B.R.; Malyshev, S.; Santanello, J.A.; Shevliakova, E. The impact of anthropogenic land use and land cover change on regional climate extremes. Nat. Commun. 2017, 8, 1–10. [Google Scholar] [CrossRef] [PubMed]
  2. Hasan, S.S.; Zhen, L.; Miah, M.G.; Ahamed, T.; Samie, A. Impact of land use change on ecosystem services: A review. Environ. Dev. 2020, 34, 100527. [Google Scholar] [CrossRef]
  3. Hennings, N.; Becker, J.N.; Guillaume, T.; Damris, M.; Dippold, M.A.; Kuzyakov, Y. Riparian wetland properties counter the effect of land-use change on soil carbon stocks after rainforest conversion to plantations. Catena 2021, 196, 104941. [Google Scholar] [CrossRef]
  4. Borrelli, P.; Robinson, D.A.; Panagos, P.; Lugato, E.; Yang, J.E.; Alewell, C.; Wuepper, D.; Montanarella, L.; Ballabio, C. Land use and climate change impacts on global soil erosion by water (2015–2070). Proc. Natl. Acad. Sci. USA 2020, 117, 21994–22001. [Google Scholar] [CrossRef]
  5. Wang, M.; Wang, S.; Zhao, J.; Ju, W.; Hao, Z. Global positive gross primary productivity extremes and climate contributions during 1982–2016. Sci. Total Environ. 2021, 774, 145703. [Google Scholar] [CrossRef]
  6. Hansen, M.C.; Potapov, P.V.; Moore, R.; Hancher, M.; Turubanova, S.A.; Tyukavina, A.; Thau, D.; Stehman, S.V.; Goetz, S.J.; Loveland, T.R.; et al. High-resolution global maps of 21st-century forest cover change. Science 2013, 342, 850–853. [Google Scholar] [CrossRef] [Green Version]
  7. De Rosa, M. Land use and land-use changes in life cycle assessment: Green modelling or black boxing? Ecol. Econ. 2018, 144, 73–81. [Google Scholar] [CrossRef]
  8. Lillesund, V.F.; Hagen, D.; Michelsen, O.; Foldvik, A.; Barton, D.N. Comparing land use impacts using ecosystem quality, biogenic carbon emissions, and restoration costs in a case study of hydropower plants in Norway. Int. J. Life Cycle Assess. 2017, 22, 1384–1396. [Google Scholar] [CrossRef]
  9. World Economic Forum (WEF). The Global Risks Report. 2020. Available online: http://www3.weforum.org/docs/WEF_Global_Risk_Report_2020.pdf (accessed on 20 June 2021).
  10. Bexell, M.; Jönsson, K. Responsibility and the United Nations’ sustainable development goals. In Forum for Development Studies; Routledge: London, UK, 2017; Volume 44, pp. 13–29. [Google Scholar]
  11. Ait-Kadi, M. Water for development and development for water: Realizing the sustainable development goals (SDGs) vision. Aquat. Procedia 2016, 6, 106–110. [Google Scholar] [CrossRef]
  12. Alcamo, J. Water quality and its interlinkages with the Sustainable Development Goals. Curr. Opin. Environ. Sustain. 2019, 36, 126–140. [Google Scholar] [CrossRef]
  13. Gain, A.K.; Giupponi, C.; Wada, Y. Measuring global water security towards sustainable development goals. Environ. Res. Lett. 2016, 11, 124015. [Google Scholar] [CrossRef]
  14. Lim, T.; Park, J. Koreas Experiences with Development: Revisiting MDGs from a Time Perspective. Korean J. Policy Stud. 2010, 25, 125–145. [Google Scholar]
  15. Cha, Y.J.; Shim, M.; Kim, S.K.; River, N. The Four Major Rivers Restoration Project. In Proceedings of the UN-Water International Conference, Zaragoza, Spain, 3–5 October 2011. [Google Scholar]
  16. Ministry of Environment (MOE). The 3rd Phase of the Comprehensive Non-Point Source Pollution Management Measures. Available online: https://www.environment.gov.rw/ (accessed on 20 June 2021).
  17. Kennedy, G.; Mayer, T. Natural and constructed wetlands in Canada: An overview. Water Qual. Res. J. 2002, 37, 295–325. [Google Scholar] [CrossRef]
  18. Simon, J.A.; Snodgrass, J.W.; Casey, R.E.; Sparling, D.W. Spatial correlates of amphibian use of constructed wetlands in an urban landscape. Landsc. Ecol. 2009, 24, 361–373. [Google Scholar] [CrossRef]
  19. Harrington, R.; Carroll, P.; Cook, S.; Harrington, C.; Scholz, M.; McInnes, R.J. Integrated constructed wetlands: Water management as a land-use issue, implementing the ‘Ecosystem Approach’. Water Sci. Technol. 2011, 63, 2929–2937. [Google Scholar] [CrossRef]
  20. Vymazal, J. Removal of nutrients in various types of constructed wetlands. Sci. Total Environ. 2007, 380, 48–65. [Google Scholar] [CrossRef]
  21. Vymazal, J.; Kröpfelová, L. Types of constructed wetlands for wastewater treatment. Wastewater Treat. Constr. Wetl. Horiz. Sub-Surf. Flow 2008, 14, 121–202. [Google Scholar]
  22. Zhuang, L.L.; Yang, T.; Zhang, J.; Li, X. The configuration, purification effect and mechanism of intensified constructed wetland for wastewater treatment from the aspect of nitrogen removal: A review. Bioresour. Technol. 2019, 293, 122086. [Google Scholar] [CrossRef] [PubMed]
  23. Giraud, F.; Guiraud, P.; Kadri, M.; Blake, G.; Steiman, R. Biodegradation of anthracene and fluoranthene by fungi isolated from an experimental constructed wetland for wastewater treatment. Water Res. 2001, 35, 4126–4136. [Google Scholar] [CrossRef]
  24. Sakadevan, K.; Bavor, H.J. Nutrient removal mechanisms in constructed wetlands and sustainable water management. Water Sci. Technol. 1999, 40, 121–128. [Google Scholar] [CrossRef]
  25. Jinren, J.G.N. Mechanisms of constructed wetland wastewater ecological treatment systems. Tech. Equip. Environ. Pollut. Control. 2004, 6. Available online: https://en.cnki.com.cn/Article_en/CJFDTotal-HJJZ200406017.htm (accessed on 20 June 2021).
  26. Snyder, B.F. The inclusion of ecosystem service valuations in bioenergy cost analysis: A case study of constructed wetlands in the neotropics. Ecol. Econ. 2019, 156, 196–201. [Google Scholar] [CrossRef]
  27. Pedersen, E.; Weisner, S.E.; Johansson, M. Wetland areas’ direct contributions to residents’ well-being entitle them to high cultural ecosystem values. Sci. Total Environ. 2019, 646, 1315–1326. [Google Scholar] [CrossRef]
  28. McInnes, R.J.; Everard, M. Rapid assessment of wetland ecosystem services (RAWES): An example from Colombo, Sri Lanka. Ecosyst. Serv. 2017, 25, 89–105. [Google Scholar] [CrossRef]
  29. Saaltink, R.M.; Dekker, S.C.; Griffioen, J.; Wassen, M.J. Vegetation growth and sediment dynamics in a created freshwater wetland. Ecol. Eng. 2018, 111, 11–21. [Google Scholar] [CrossRef]
  30. Ministry of Environment (MOE). Installation and Management Operation Manual for Non-Point Pollution Reduction Facilities. 2016. Available online: https://www.me.go.kr/home/web/policy_data/read.do?menuId=10259&seq=4070 (accessed on 20 June 2021).
  31. Reyes, N.J.; Geronimo, F.K.; Kim, L.H. Evaluation of the factors influencing the treatment performance of a livestock constructed wetland. Ecol. Eng. 2020, 149, 105811. [Google Scholar] [CrossRef]
  32. Park, J.H.; Wang, J.J.; Kim, S.H.; Cho, J.S.; Kang, S.W.; Delaune, R.D.; Seo, D.C. Phosphate removal in constructed wetland with rapid cooled basic oxygen furnace slag. Chem. Eng. J. 2017, 327, 713–724. [Google Scholar] [CrossRef]
  33. Seo, D.C.; DeLaune, R.D.; Park, W.Y.; Lim, J.S.; Seo, J.Y.; Cho, J.S.; Heo, J.S. Evaluation of a hybrid constructed wetland for treating domestic sewage from individual housing units surrounding agricultural villages in South Korea. J. Environ. Monit. 2009, 11, 134–144. [Google Scholar] [CrossRef]
  34. Youngchul, K.; Gilson, H.; Jin-Woo, L.; Je-Chul, P.; Dong-Sup, K.; Min-Gi, K.; In-Soung, C. Experiences with con-structed wetland systems in Korea. J. Ocean Univ. China 2006, 5, 345–350. [Google Scholar] [CrossRef]
  35. Lee, S.W.; Kim, J.H.; Cha, S.M. Analysis of the relation between pollutant loading and water depth flowrate changes in a constructed wetland for agricultural nonpoint source pollution management. Ecol. Eng. 2020, 152, 105841. [Google Scholar] [CrossRef]
  36. Shen, X.; Huang, D.; Zhang, C.; Hu, K. Performance evaluation of constructed wetlands treating wastewater treatment plant effluent in Taihu Lake, China. CLEAN–Soil Air Water 2018, 46, 1600442. [Google Scholar] [CrossRef] [Green Version]
  37. Maniquiz, M.C.; Lee, S.Y.; Choi, J.Y.; Jeong, S.M.; Kim, L.H. Treatment performance of a constructed wetland during storm and non-storm events in Korea. Water Sci. Technol. 2012, 65, 119–126. [Google Scholar] [CrossRef] [PubMed]
  38. Cheema, P.P.S.; Reddy, A.S.; Kaur, S. Characterization and prediction of stormwater runoff quality in sub-tropical rural catchments. Water Resour. 2017, 44, 331–341. [Google Scholar] [CrossRef]
  39. American Public Health Association. Standard Methods for the Examination of Water and Wastewater; American Public Health Association: Washington, DC, USA, 1915. [Google Scholar]
  40. Kim, L.H.; Lee, S. Characteristics of washed-off pollutants and dynamic EMCs in a parking lot and a bridge during storms. J. Korean Soc. Water Environ. 2005, 21, 248–255. [Google Scholar] [CrossRef] [PubMed]
  41. Maniquiz, M.C.; Lee, S.Y.; Kim, L.H. Long-term monitoring of infiltration trench for nonpoint source pollution control. Water Air Soil Pollut. 2010, 212, 13–26. [Google Scholar] [CrossRef]
  42. Clarkson, B.R.; Ausseil, A.G.E.; Gerbeaux, P. Wetland ecosystem services. In Ecosystem Services in New Zealand: Conditions and Trends; Manaaki Whenua Press: Lincoln, NE, USA, 2013; pp. 192–202. [Google Scholar]
  43. Handoko, D.; Mesran, M.; Nasution, S.D.; Yuhandri, Y.; Nurdiyanto, H. Application of Weight Sum Model (WSM) in Determining Special Allocation Funds Recipients. Int. J. Inform. Comput. Sci. 2017, 1, 31–35. [Google Scholar]
  44. Perdana, M.C.; Hadisusanto, S.; Purnama, I.L.S. Implementation of a full-scale constructed wetland to treat grey-water from tourism in Suluban Uluwatu Beach, Bali, Indonesia. Heliyon 2020, 6, e05038. [Google Scholar] [CrossRef]
  45. Land, M.; Granéli, W.; Grimvall, A.; Hoffmann, C.C.; Mitsch, W.J.; Tonderski, K.S.; Verhoeven, J.T. How effective are created or restored freshwater wetlands for nitrogen and phosphorus removal? A systematic review. Environ. Evid. 2016, 5, 1–26. [Google Scholar] [CrossRef] [Green Version]
  46. Hsueh, M.L.; Yang, L.; Hsieh, L.Y.; Lin, H.J. Nitrogen removal along the treatment cells of a free-water surface constructed wetland in subtropical Taiwan. Ecol. Eng. 2014, 73, 579–587. [Google Scholar] [CrossRef]
  47. Alias, N.; Liu, A.; Egodawatta, P.; Goonetilleke, A. Sectional analysis of the pollutant wash-off process based on runoff hydrograph. J. Environ. Manag. 2014, 134, 63–69. [Google Scholar] [CrossRef] [PubMed] [Green Version]
  48. Lee, S.; Maniquiz, M.C.; Kim, L.H. Characteristics of contaminants in water and sediment of a constructed wetland treating piggery wastewater effluent. J. Environ. Sci. 2010, 22, 940–945. [Google Scholar] [CrossRef]
  49. Choi, J.; Maniquiz, M.C.; Lee, B.; Jeong, S.; Kim, L.H. Characteristics of contaminant and phosphorus existence types in sediment of a constructed wetland. Desalination Water Treat. 2012, 38, 285–291. [Google Scholar] [CrossRef]
  50. Liu, A.; Egodawatta, P.; Guan, Y.; Goonetilleke, A. Influence of rainfall and catchment characteristics on urban stormwater quality. Sci. Total Environ. 2013, 444, 255–262. [Google Scholar] [CrossRef] [PubMed] [Green Version]
  51. Brix, H. Wastewater treatment in constructed wetlands: System design, removal processes, and treatment performance. In Constructed Wetlands for Water Quality Improvement; CRC Press: Boca Raton, FL, USA, 2020; pp. 9–22. [Google Scholar]
  52. Zheng, X.; Jin, M.; Zhou, X.; Chen, W.; Lu, D.; Zhang, Y.; Shao, X. Enhanced removal mechanism of iron carbon micro-electrolysis constructed wetland on C, N, and P in salty permitted effluent of wastewater treatment plant. Sci. Total Environ. 2019, 649, 21–30. [Google Scholar] [CrossRef] [PubMed]
  53. Molle, P.; Prost-Boucle, S.; Lienard, A. Potential for total nitrogen removal by combining vertical flow and horizontal flow constructed wetlands: A full-scale experiment study. Ecol. Eng. 2008, 34, 23–29. [Google Scholar] [CrossRef]
  54. Bang, W.H.; Jung, Y.; Park, J.W.; Lee, S.; Maeng, S.K. Effects of hydraulic loading rate and organic load on the performance of a pilot-scale hybrid VF-HF constructed wetland in treating secondary effluent. Chemosphere 2019, 218, 232–240. [Google Scholar] [CrossRef] [PubMed]
  55. Vymazal, J.; Březinová, T.D. Treatment of a small stream impacted by agricultural drainage in a semi-constructed wetland. Sci. Total Environ. 2018, 643, 52–62. [Google Scholar] [CrossRef] [PubMed]
  56. Slak, A.S.; Bulc, T.G.; Vrhovsek, D. Comparison of nutrient cycling in a surface-flow constructed wetland and in a facultative pond treating secondary effluent. Water Sci. Technol. 2005, 51, 291–298. [Google Scholar] [CrossRef]
  57. Liang, Y.; Zhu, H.; Bañuelos, G.; Yan, B.; Shutes, B.; Cheng, X.; Chen, X. Removal of nutrients in saline wastewater using constructed wetlands: Plant species, influent loads and salinity levels as influencing factors. Chemosphere 2017, 187, 52–61. [Google Scholar] [CrossRef]
  58. Bolton, L.; Joseph, S.; Greenway, M.; Donne, S.; Munroe, P.; Marjo, C.E. Phosphorus adsorption onto an enriched biochar substrate in constructed wetlands treating wastewater. Ecol. Eng. 2019, 1, 100005. [Google Scholar] [CrossRef]
  59. Baldovi, A.A.; de Barros Aguiar, A.R.; Benassi, R.F.; Vymazal, J.; de Jesus, T.A. Phosphorus removal in a pilot scale free water surface constructed wetland: Hydraulic retention time, seasonality and standing stock evaluation. Chemosphere 2021, 266, 128939. [Google Scholar] [CrossRef] [PubMed]
  60. Zhao, D.; Chen, C.; Lu, Q.; Zhang, M.; Zhang, H.; An, S. Combined use of cold-season and warm-season macrophytes in floating constructed wetlands to increase nitrogen removal in the early cold season. J. Clean. Prod. 2020, 254, 120054. [Google Scholar] [CrossRef]
  61. Roseen, R.M.; Ballestero, T.P.; Houle, J.J.; Avelleneda, P.; Wildey, R.; Briggs, J. Storm water low-impact development, conventional structural, and manufactured treatment strategies for parking lot runoff: Performance evaluations under varied mass loading conditions. Transp. Res. Rec. 2006, 1984, 135–147. [Google Scholar] [CrossRef]
  62. Choi, J.; Geronimo, F.K.F.; Park, B.; Hong, J.; Kim, L. Formulation of design guidelines for the cost-effectiveness of constructed wetlands in improving water quality. Desalination Water Treat. 2018, 101, 108–115. [Google Scholar] [CrossRef]
  63. Hsu, C.B.; Hsieh, H.L.; Yang, L.; Wu, S.H.; Chang, J.S.; Hsiao, S.C.; Lin, H.J. Biodiversity of constructed wetlands for wastewater treatment. Ecol. Eng. 2011, 37, 1533–1545. [Google Scholar] [CrossRef]
Figure 1. Schematic diagram of (a) Cell-FWS, (b) Flow-FWS, (c) Hybrid-SSF, and (d) Hybrid-FWS constructed wetlands.
Sustainability 13 10410 g001
Figure 2. Locations of monitored constructed wetlands.
Sustainability 13 10410 g002
Figure 3. Average inflow and outflow EMC of monitored facilities.
Sustainability 13 10410 g003aSustainability 13 10410 g003b
Figure 4. Pollutant removal performance of different constructed wetland types.
Sustainability 13 10410 g004
Figure 5. Pollutant removal performance of constructed wetlands with respect to the period of operation.
Sustainability 13 10410 g005
Figure 6. Pollutant removal performance considering facility size.
Sustainability 13 10410 g006
Figure 7. Comparison of conventional and comprehensive evaluation methods for assessing constructed wetlands.
Sustainability 13 10410 g007
Table 1. Characteristics of monitored constructed wetlands.
CodeRegionLand useCatchment Area (CA), haSurface Area (SA), haVolume Capacity, m3SA/CA (%)TypeYear Constructed
NYJ-W1NamyangjuUrban1610.8182000.5Flow-FWS2011
NYJ-W2NamyangjuCommercial123.40.6262000.5Cell-FWS2012
NYJ-W3NamyangjuAgricultural8.10.054870.6Flow-FWS2011
NYJ-W4NamyangjuAgricultural6.10.1313002.1Flow-FWS2011
WJ-W1WonjuLivestock45.60.4644301.0Flow-FWS2016
AS-W1AnseongLivestock83.70.4241800.5Flow-FWS2017
AS-W2AnseongLivestock125.71.0196900.8Flow-FWS2017
AS-W3AnseongUrban87.870.5350000.6Cell-FWS2017
UW-W1UiwangUrban6661.3314,7890.2Flow-FWS2013
GS-W1GoesanAgricultural50.58573211.5Flow-FWS2015
DY-W1DanyangAgricultural6140.6172000.1Hybrid-FWS2010
CJ-W1ChungjuAgricultural18.190.099600.5Flow-FWS2013
CJ-W2ChungjuAgricultural322.10.6459050.2Flow-FWS2013
TB-W1TaebackAgricultural60051.215,0000.02Flow-FWS2014
GC-W1GeochangUrban1540.7778620.5Flow-FWS2014
UR-W1UiryeongLivestock16.50.3131821.9Flow-FWS2014
BS-W1BusanUrban5880.5965400.1Flow-FWS2015
BS-W2BusanIndustrial4.730.3737007.8Flow-FWS2016
BS-W3BusanAgricultural15.910.4545002.8Cell-FWS2017
GR-W1GoryeongLivestock43.70.2221850.5Flow-FWS2014
YC-W1YeongcheonAgricultural6403.2033,0000.5Flow-FWS2013
YC-W2YeongcheonLivestock109.40.3335160.3Hybrid-FWS2013
YC-W3YeongcheonAgricultural96.80.3940800.4Hybrid-FWS2017
YC-W4YeongcheonAgricultural63.71.0810,6161.7Cell-FWS2017
PH-W1PohangUrban6263.1331,3000.5Cell-FWS2015
SJ-W1SeongjuUrban350.2524000.7Hybrid-FWS2016
CN-W1ChangnyeongAgricultural460.1820600.4Flow-FWS2017
YCG-W1YecheonAgricultural11.10.065550.5Hybrid-FWS2017
HA-W1HamanAgricultural454.861.3613,4750.3Cell-FWS2017
YS-W1YangsanAgricultural145.62.3323,5001.6Cell-FWS2018
YS-W2YangsanAgricultural53.320.4845400.9Hybrid-SSF2018
HC-W1HapcheonLivestock47.20.2424400.5Cell-FWS2018
HD-W1HadongAgricultural29.10.2627400.9Cell-FWS2017
SC-W1SeocheonUrban231.8618,7228.1Flow-FWS2012
DJ-W1DaejeonAgricultural55.20.7270021.3Flow-FWS2013
DJ-W2DaejeonAgricultural660.3333400.5Flow-FWS2013
JP-W1JeungpyeongUrban205.81.0310,5000.5Flow-FWS2013
WJU-W1WanjuCommercial750.7574501.0Flow-FWS2013
JA-W1JinanUrban2151.0810,7500.5Flow-FWS2016
DY-W1DamyangUrban50.50.2524850.5Cell-FWS2014
DY-W2DamyangUrban20.0441.001000.05Flow-FWS2014
JS-W1JangseongUrban31.94410.1616000.5Hybrid-SSF2014
JS-W2JangseongAgricultural55.96090.2828000.5Hybrid-SSF2014
HS-W1HwasunLivestock59.40.3032000.5Flow-FWS2013
HS-W2HwasunAgricultural5772.8929,0000.5Flow-FWS2015
HS-W3HwasunIndustrial15.60.1918001.2Hybrid-FWS2013
IS-W1ImsilIndustrial96.20.4848000.5Cell-FWS2013
IS-W2ImsilLivestock220.1111000.5Cell-FWS2017
BSG-W1BoseongAgricultural260.087950.3Flow-FWS2013
NJ-W1NajuCommercial870.6164030.7Cell-FWS2017
NJ-W2NajuAgricultural870.4441840.5Cell-FWS2017
JJ-W1JejuLivestock220.1515950.7Cell-FWS2013
SS-W1SeosanAgricultural248.50.2524840.1Cell-FWS2017
SS-W2SeosanAgricultural16141.6196000.1Flow-FWS2018
Table 2. List of indices and items used for the comprehensive evaluation of constructed wetlands.
IndexItemSub-IndicesNumber of Parameters
Treatment function
(2 items)
Water purification, α1SS, BOD, COD, TN, TP5
Flow regulation, α2Ease of inflow and outflow, stagnation2
Cultural function
(2 items)
Accessibility to the
public, β1
Adequate parking lots, proximity to roads, proximity to cities and residential areas3
Social benefits, β2Trails, utilities, and recreational facilities (i.e., rest areas, sports facilities, restrooms, etc.)2
Ecological function
(3 items)
Algal bloom, γ1Status of green algae occurrence1
Aquatic habitat, γ2Fish habitat, other living organisms (i.e., plants, benthic organisms, etc.)2
Terrestrial
ecosystem, γ3
Plants, terrestrial, and aerial animals2
Operation and landscape management status
(5 items)
Slope
Protection, δ1
Slope erosion, embankment protection2
Plant
Management, δ2
Removal of dead plants, landscaping and water management, weed control.3
Sediment/waste management, δ3Sediment management, soil dredging, waste management3
Facility maintenance, δ4Deck management, trail maintenance, amusement facilities management, etc.3
Odor control, δ5Occurrence of foul odor1
Table 3. Evaluation of constructed wetlands based on the developed weighted indices.
WS value0–1920–3940–5960–7980–100
EvaluationVery BadBadNormalGoodVery Good
Very bad: Significant improvements are necessary. Low scores were achieved for all four functions.
Bad: More than half of the functions were performed poorly. Intensive monitoring, maintenance, and facility improvements are required.
Normal: The facilities exhibited fair performance considering the four wetland functions; however, further improvements in the monitoring, maintenance, and facility structure should still be considered.
Good: All four functions were performed adequately. Continuous monitoring and maintenance must be conducted to verify and maintain efficiency.
Very Good: Optimum performance was observed in the facility in line with the current operation and maintenance efforts.
Table 4. Weights of indices for constructed wetlands evaluation.
IndexWeightItemWeightParameters
Treatment
Function
(TFi)
α
(0.5)
Water
purification
α 1
(0.4)
SS, BOD, COD, TN, TP, etc.
Flow regulation α 2
(0.1)
Ease of inflow and outflow, stagnation, etc.
Cultural
Function
(CFi)
β
(0.1)
Accessibility to the public β 1
(0.05)
Adequate parking lots, proximity to roads, proximity to cities and residential areas
Social
benefits
β 2
(0.05)
Trails, utilities, and recreational facilities (i.e., rest areas, sports facilities, restrooms, etc.)
Ecological
Function
(EFi)
0.2
( γ )
Algal bloom γ 1
(0.05)
Status of green algae occurrence
Aquatic habitat γ 2
(0.1)
Fish habitat, other living organisms (i.e., plants, benthic organisms, etc.)
Terrestrial ecosystem γ 3
(0.05)
Plants, terrestrial, and aerial animals
Operation and landscape management
Status
(OMi)
0.2
( δ )
Slope protection δ 1
(0.04)
Slope erosion, embankment protection, etc.
Plant management δ 2
(0.05)
Removal of dead plants, landscaping and water management, weed control, etc.
Sediment/waste management δ 3
(0.05)
Sediment management, soil dredging, waste management
Facility maintenance δ 4
(0.04)
Deck management, trail maintenance, amusement facilities management, etc.
Odor control δ 5
(0.02)
Occurrence of foul odor
Publisher’s Note: MDPI stays neutral with regard to jurisdictional claims in published maps and institutional affiliations.

