1. Introduction
Engineering, Procurement and Construction (EPC) is a form of contract in which a prime contractor guarantees the obligations of engineering, the procurement of materials and equipment, construction, and a warranty for a plant project, as a lump-sum turnkey base in most cases [
1]. An EPC contract is a general contract type implemented in large-scale and complex plant projects [
2]. EPC projects are uniquely characterized by their enormous scale, spanning various industries, including industrial plants, oil and gas mining, power plants, or extensive infrastructure [
3]. Project risk is increasing due to massive and complex EPC projects [
4]. Most EPC companies are experiencing difficulties carrying out their projects due to a large amount of data and complex decision-making processes. While the Dow Jones Industrial Average (DJIA) increased by more than 80% over the ten years from 2008 to 2018, the Dow Jones Construction Index fell by 30% over the same period [
5]. Due to low productivity growth, a low degree of digitalization, and low investment in research and development, the positive changes that other industries have shown over the past 10 to 20 years have not been seen in the EPC industry [
5]. In particular, the insufficient systematic management of the data generated during project execution causes reworks and additional costs, which in turn cause a loss of profits [
6]. In a plant project, data is generated at each stage of the entire project cycle, from the project planning stage to operation and maintenance (OM). The data generated during the project’s execution are classified as big data according to the volume, variety and speed of the data generation [
6]. In the fourth industrial revolution, the amount and form of such data increases rapidly [
7], and humans will face new technology, analysis systems, platforms, and cultural challenges related to the fourth industrial revolution.
A prediction-based decision-making approach using big data is currently used in various fields, such as establishing future national strategies, solving social issues, improving the efficiency of public enterprises, and strengthening the competitiveness of the private sector, e.g., through public service innovation [
8]. Along with the fourth industrial revolution, technologies using big data based on Artificial Intelligence (AI) are also required at construction sites [
9]. Therefore, it is necessary to study a system that analyzes risk factors by applying AI and big data technology to support the utilization of the engineering data generated in each stage of the EPC project and decision-making through it.
Machine Learning (ML) is a field that studies algorithms intended to predict and classify based on properties learned from Training Data [
10]. When data analysts input the collected data into a system with an embedded predictive model, the data is learned through the predictive model. When a user inputs a new document into the system in which such an ML model is embedded, the system that reflects all of this automatically analyzes and outputs the final prediction result. This study was carried out to predict and respond to potential risks in an EPC project cycle, such as bidding, design, construction, and OM. The study supports optimal decision-making by applying ML technology based on the data generated during the project cycle. The research team developed an integrated engineering ML platform, the
Engineering Machine-learning Automation Platform (
EMAP), that applies various ML models and AI algorithms for risk analysis at each stage of the bidding, design, construction, and OM. The authors analyzed the current level of technology development for research that applies artificial intelligence and ML technology to each stage of the plant project, and the development trend of the system to support the plant project. Based on previous studies, the architecture of
EMAP—an ML-based engineering integrated analysis system—was designed. There are five modules that make up
EMAP: (M1) Invitation to Bid (ITB) Analysis, (M2) Design Cost Estimation, (M3) Design Error Check, (M4) Change Order Forecast, and (M5) Equipment Predictive Maintenance. These five modules support the risk analysis for plant projects at each stage of bidding, design, construction, and OM. The algorithms constituting the five modules were introduced, and the performance of each model was quantitatively evaluated. The project data collected for this study were used for the training of the corresponding module of
EMAP with embedded machine learning model. Based on this training, it was designed to generate a final prediction when the user inputs a new document.
3. Framework of EMAP
3.1. EMAP Overview
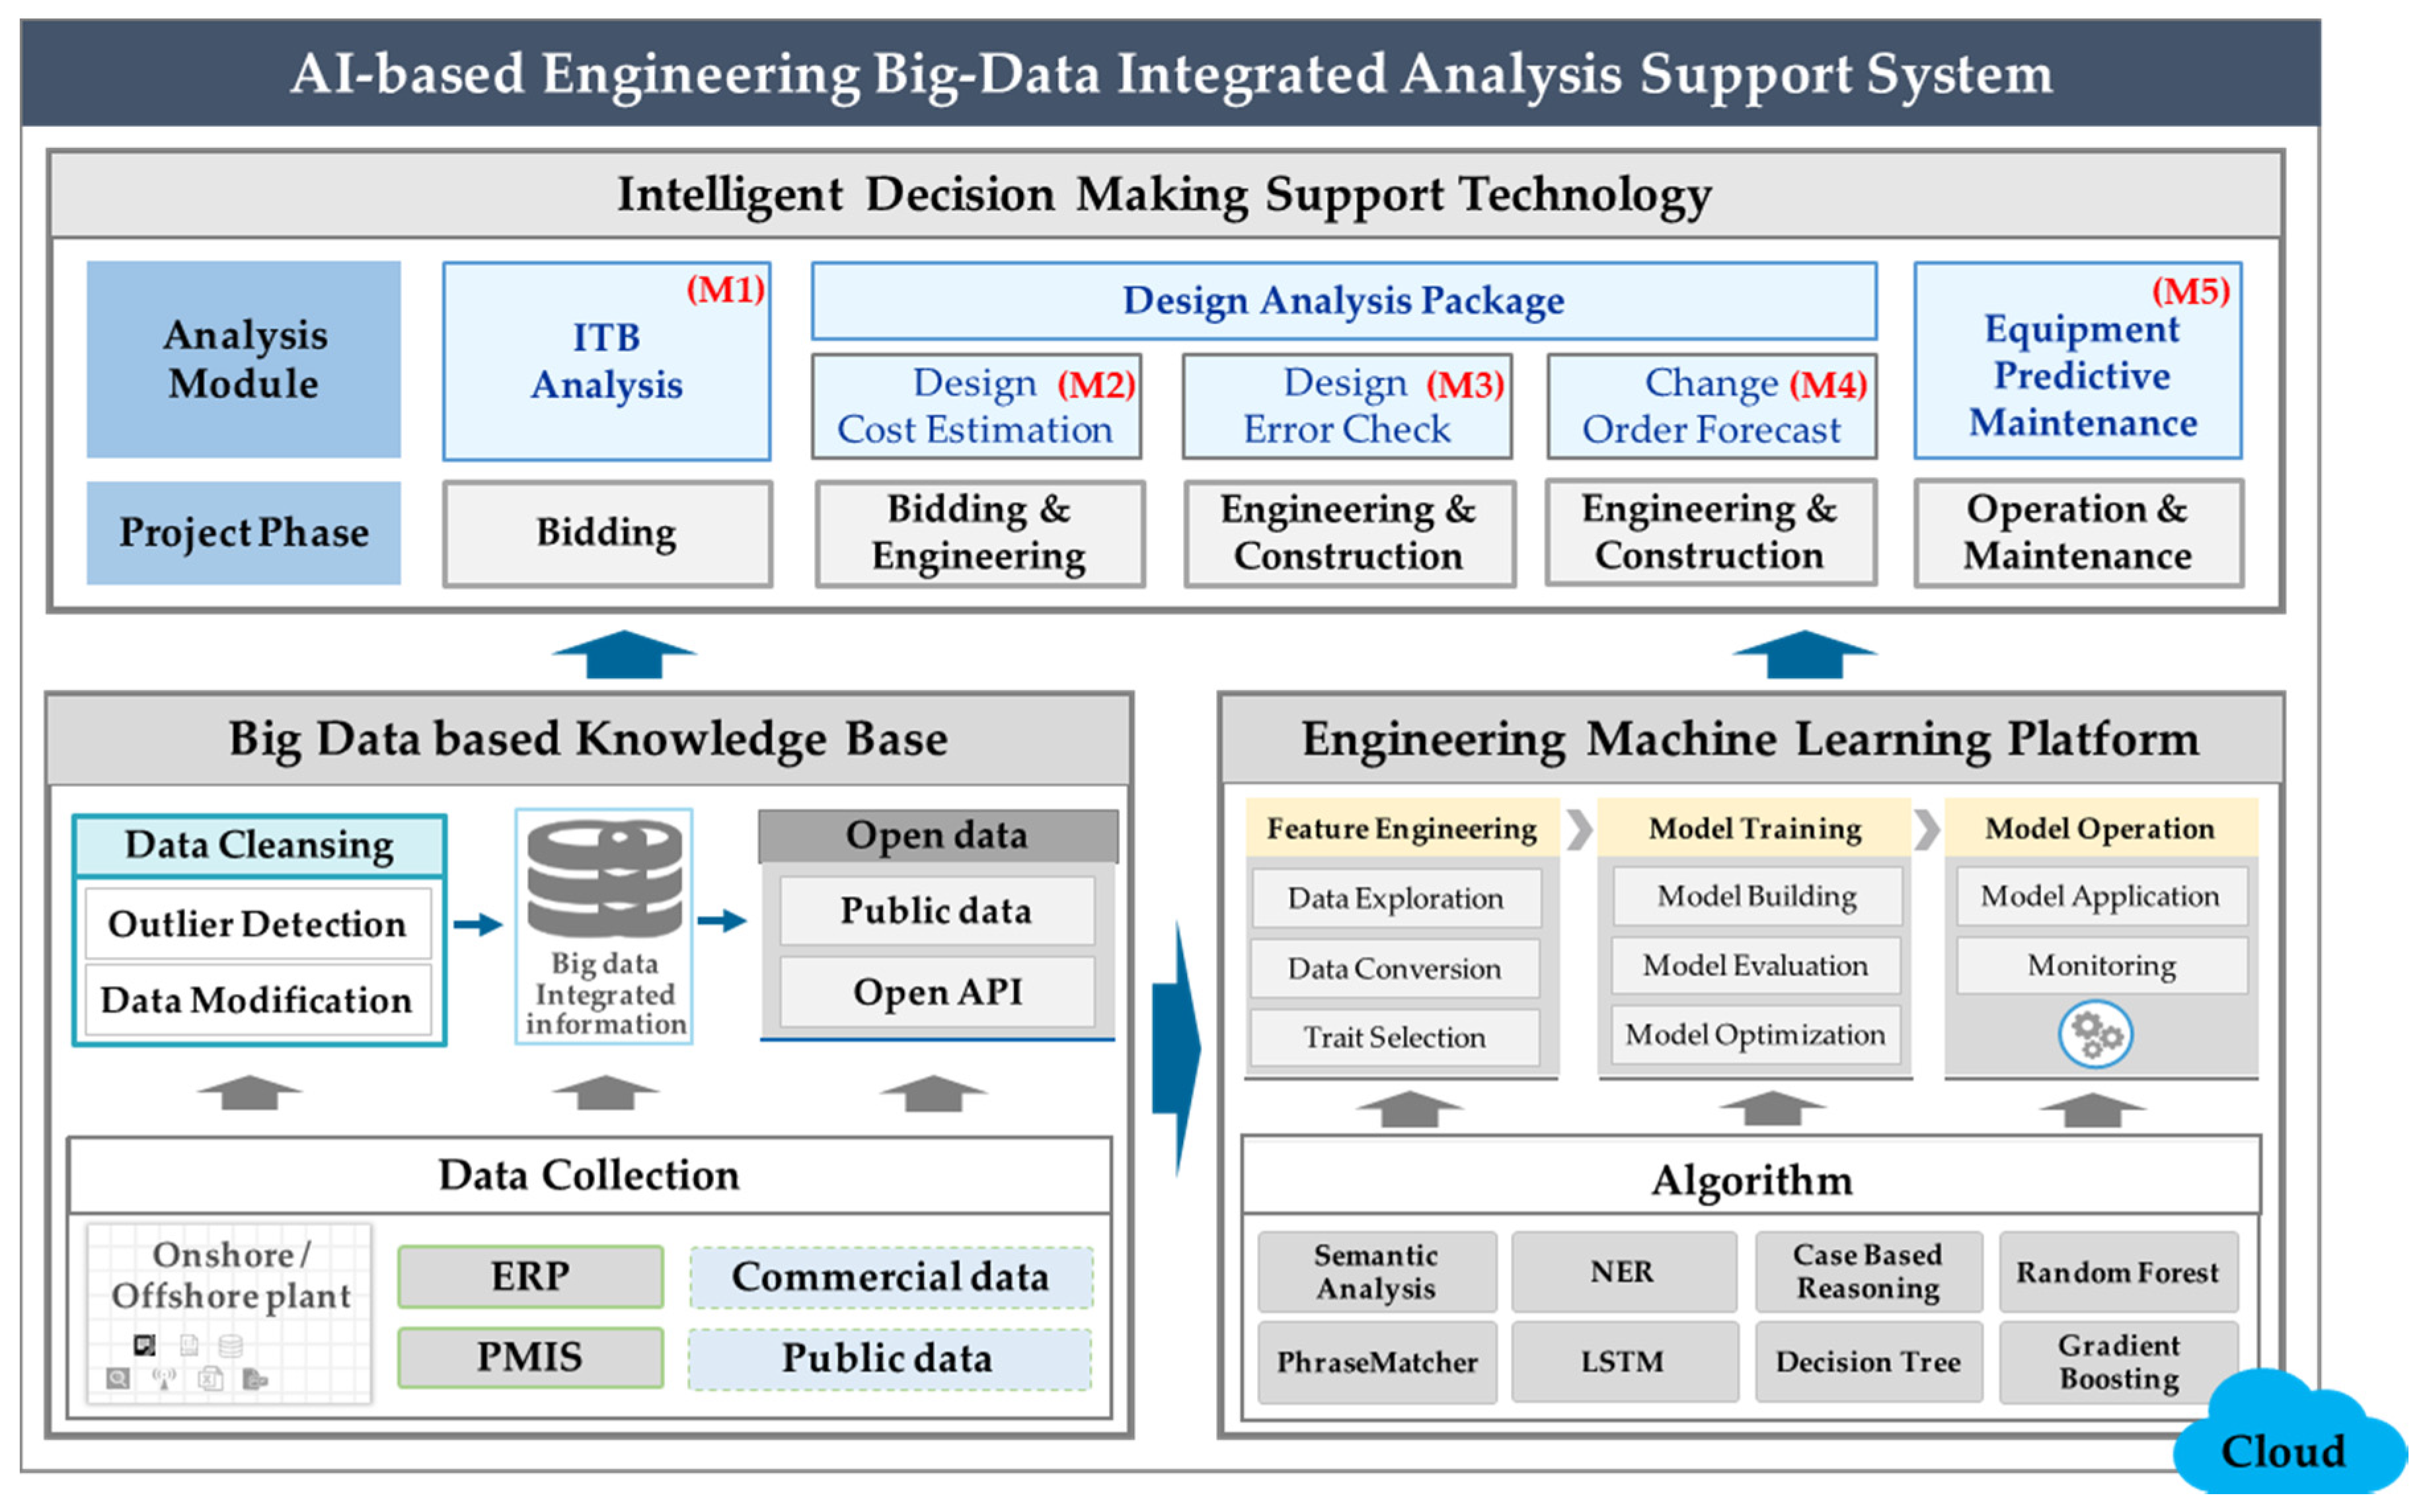
In this study, EMAP, which is a ML based engineering integrated analysis system, was developed based on data generated in the entire project cycle to analyze the risks of a plant project. EMAP was implemented in a cloud server, and it consists of a knowledge base for engineering data and an intelligent decision support system based on a ML platform. The decision support system, the core function of EMAP, consists of five modules: (M1) ITB Analysis, (M2) Design Cost Estimation, (M3) Design Error Check, (M4) Design Change Prediction, and (M5) Predictive Maintenance of Plant Equipment.
This system also has four main features, as described as below.
Engineering Machine Learning Platform: The existing machine learning process required experts due to the manual work by data analysts in all of the processes, including data input, data preprocessing, predictive model generation, and model management. On the other hand, this study’s engineering ML platform is an automated ML platform. If the user inputs the data they want to analyze, they can generate a predicted value with a few clicks, without a separate ML process. As a result, the model’s performance can be improved by quickly building an ML model, and the model created through the model learning can be applied as an optimal model.
Big-Data-based Knowledge Base: In this study, the engineering knowledge base refers to a DB storing expertise accumulated through the entire cycle of the engineering industry. The various data generated in the bidding, design, construction, and OM stages of a plant project were collected and formalized into a DB to be used as a knowledge base. The data were registered and managed in the Project Management Information System (PMIS) developed for this study.
Intelligent Decision-Making Support System: This system is an application for the extraction of the risks at each stage of an engineering project by applying ML algorithms to data generated in the entire project life cycle, and by predicting the degree of risk. It consists of five main modules: (M1) ITB Analysis, (M2) Design Cost Estimation, (M3) Design Error Check, (M4) Change Order Forecast, and (M5) Predictive Maintenance.
Cloud-based Integrated Platform: The cloud service refers to a service that stores data on the Internet and allows users to use it anytime and anywhere through Internet access without installing the necessary data on their computer [
40].
EMAP provides cloud-based support for five modules of decision support systems based on an automated ML platform specializing in the plant engineering industry. In this study, the cloud infrastructure was prepared through cloud services provided by cloud vendors.
Figure 1 shows the conceptual diagram of
EMAP’s system architecture.
In order to develop an ML-based integrated engineering analysis system, firstly, the framework of the entire system was established; the concepts, models and five modules from M1 to M5 were developed; and the overall system architecture was designed based on this framework.
EMAP was developed using this procedure and verified through case studies. This paper introduces the entire system architecture and development process of
EMAP, and it is valuable as an integrated paper introducing all five developed modules (M1–M5). Three other papers introducing the details of each module are being prepared, and among them, one paper on the submodules of the ITB Analysis module (M1) was published [
41], and two others are under review or in preparation. As Choi et al. [
41] described the details of M1, in this paper, the concept and model of M1 are briefly explained.
This paper presents a proof of concept (PoC) study that was used to develop the entire system architecture and development process of EMAP. Due to the limitations of the data availability, the data used for each module of M1–M5 of EMAP were collected, trained, and tested by selecting a specific object, not the entire discipline from the EPC projects. In addition, the EMAP system developed through this study was verified through several case studies aimed at Korean EPC contractors.
3.2. Architecture Details of EMAP
The intelligent decision support system and its five main modules mentioned above are the core components of
EMAP.
Table 1 briefly shows the functions and the algorithms of each module in the decision support system. This study divided the five modules into three categories: (1)
ITB Analysis, (2) the
Design Analysis Package, and (3)
Predictive Maintenance, according to the data types and the algorithm’s nature.
The ITB Analysis category applies NLP technology to automatically extract risk clauses from bid documents and analyze their impact on risks. Technologies such as NLP, IE, PhraseMatcher, NER, Semantic, and Bi-LSTM are applied here. The Design Cost Estimation predicts the design costs from the analysis of man-hour (M-H) input costs for engineers by applying ML algorithms. The Design Error Check module uses ML algorithms to predict the severity of possible design errors and schedule delays for each type of work by analyzing the design error data. Using ML algorithms, Change Order Forecast predicts the severity of cost overrun and schedule delay due to design changes by analyzing the design change data. Design Cost Estimation, Design Error Check and Change Order Forecast were integrated into the Design Analysis Package category. For the Predictive Maintenance category, the ML algorithms were applied to predict the maintenance cycles and part replacement demands by analyzing the sensor data and the maintenance records of the main facilities of a plant.
3.3. Model Developoment Process
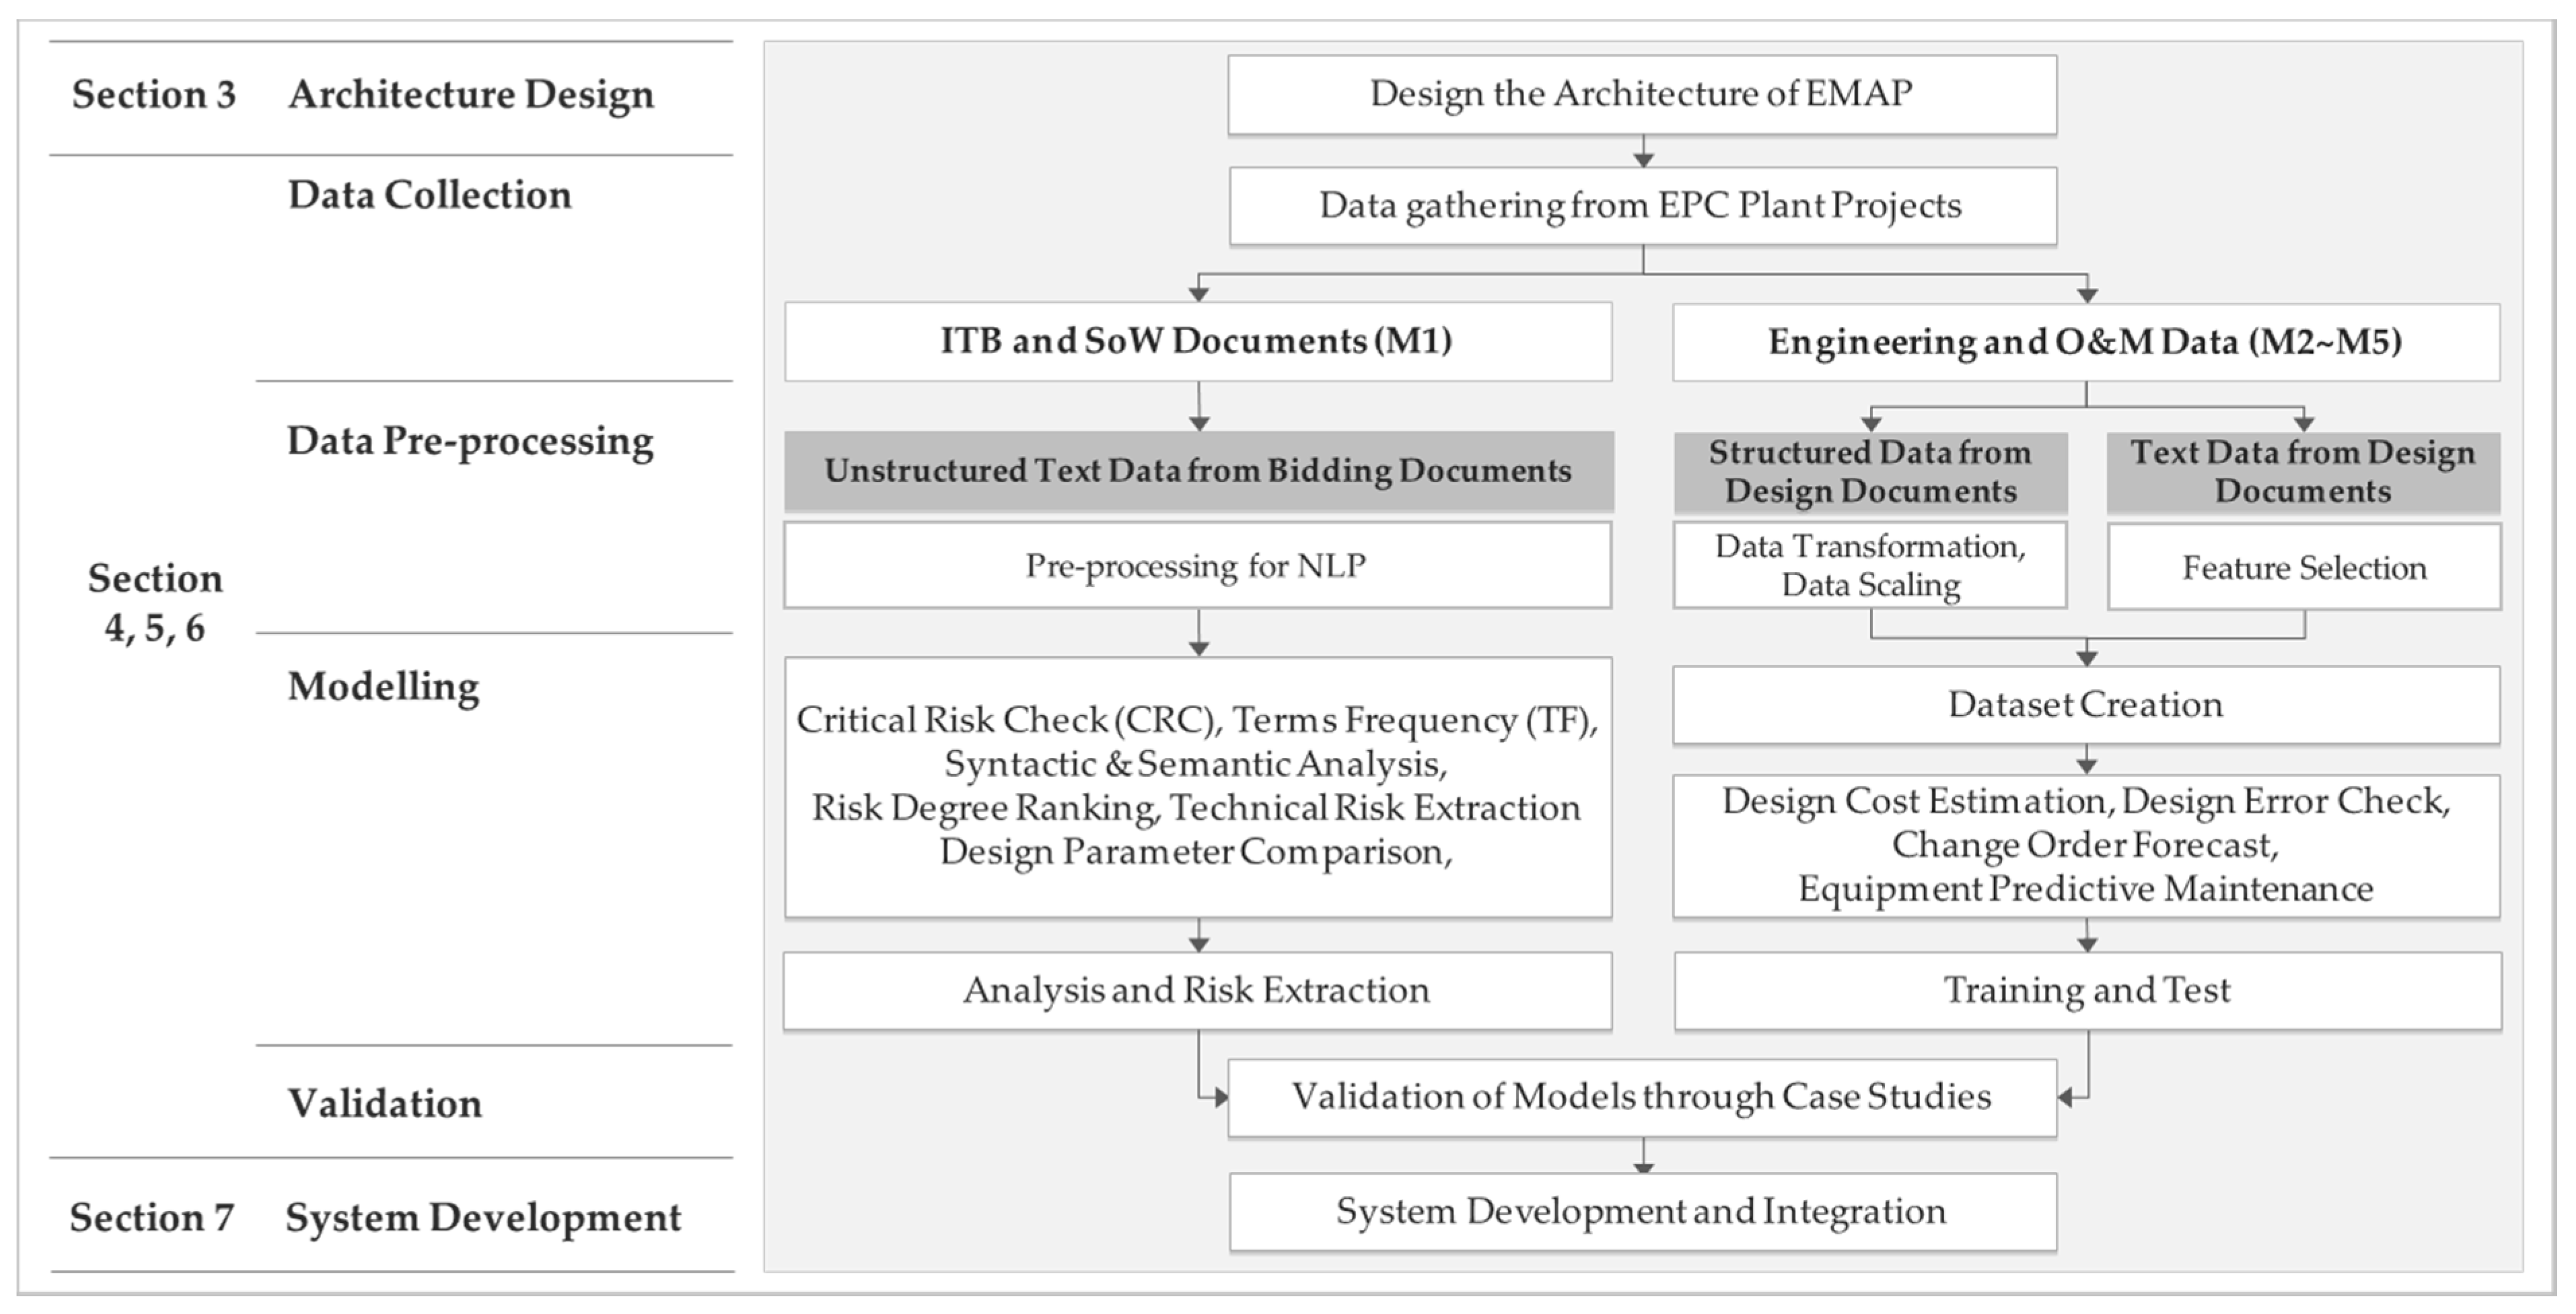
This study was conducted according to the following process. In
Section 3, the overall architecture for
EMAP’s design and development is described.
Section 4,
Section 5 and
Section 6 describe the main modules of the decision support system, which is the core of
EMAP. The purpose of each module, data collection, data pre-processing, model development and application algorithms are the core part of this study. These three sections also include the validation of the developed models through various evaluation indicators.
Section 7 describes the system development, and
Section 8 briefly describes the conclusions and limitations of this study.
Figure 2 shows the procedure of this study.
This study was conducted in order to respond to potential risks by analyzing and predicting risks using the data generated during the bidding, design, construction, and OM period of a plant project to analyze data. The data for this study included the unstructured text data and the sensor data, but excluded the drawings, tables, images and videos.
4. The ITB Analysis Module (M1)
The early detection of potential risk requirements in bid documents in the project bidding stage is a prerequisite for successful project execution within a limited period of time. The
ITB Analysis module aims to extract the critical risk clauses of the ITB, a bidding document, in the bidding stage of the plant project. The
ITB Analysis module was analyzed by dividing it into two groups: (1) Conditions of Contract analysis for contract risk extraction, and (2) Scope of Works (SoW) analysis for technical risk extraction. Most bidding documents, such as ITB, consist of unstructured text data. In order for it to be applied to AI, text data in a natural language form needs to be converted into a form that a computer can understand and analyze. In this module, NLP technology is applied for this purpose. NLP is a task that enables computers to understand human language through ML [
42].
The method of extracting information in a document can be divided into a rule-based approach and an ML approach [
13]. The
ITB Analysis module of this study applies both the rule-based approach and the ML approach. Algorithms Phrase Match [
43], NER [
15], Syntactic analysis [
13], Taxonomy-based Ontology [
44], Semantic analysis [
11], and a Bi-LSTM algorithm [
45] were applied. This module was implemented using Python, a programming language, and SpaCy—an open-source natural language processing library—was utilized.
Table 2 shows the functions of the
ITB Analysis module and its detailed configuration.
4.1. Data Collection of EPC Contracts
The
ITB Analysis module extracts the critical risks of ITB; for this purpose, ITB documents including the contract risks and technical risks of EPC projects were collected. A total of 19 plant contracts, including 11 onshore and 8 offshore projects, were collected for the contract risk extraction, and a total of 10 SoW documents, including eight onshore and two offshore projects, were collected for the technical risk extraction. These projects were carried out from 2000 to 2018 in the Middle East, South America, North America, West Africa, the North Sea, and Australia. These documents were pre-processed and converted into a DB.
Table 3 shows the summary of the EPC ITB documents collected for the
ITB Analysis module in consideration of the projects’ confidentiality.
Machine learning focuses on the prediction of the future after training from the current data [
10]. That is, the computer cannot automatically determine the data of situations that have not yet occurred or rarely occur. As a result, the prediction accuracy can be improved as it is trained with a large amount of data. In general, the training data embedded in the system for the training of ML models cannot be accessed by general users, and access is allowed only to related parties, such as developers and data analysts. Access to the contract and bid documents used for the development of the
EMAP system in this study was granted access only to the system developers and administrators.
4.2. Data Pre-Processing
Most of the data in the ITB of the EPC plant project selected as the target of analysis in this study are unstructured text data. For a computer to automatically recognize a document written in text form, it is necessary to pre-process, and thus structure, the data so that unnecessary information can be excluded [
13]. Various computing technologies, such as stopwords removal and stemming, are used for pre-processing for text data analysis [
46]. This pre-processing is to increase the accuracy of the sentence structure analysis. In this study, Text Tokenization, Lemmatization, POS Tagging and Dependency Parsing were applied. Tokenization refers to the process of dividing a text into meaningful pieces, and the divided pieces are called tokens [
47]. In the spaCy library, it is divided into meaningful pieces first through tokenization before NLP analysis using an artificial neural network.
Lemma, in linguistics, refers to the basic form of a specific word, as that is the basic form of ‘is’ and ‘are’. In this study using spaCy’s NLP model, a method was selected to determine the part-of-speech (POS) of each word through a statistical model—such as an artificial neural network—when performing the lemmatization, and to restore the lemma based on the information [
48]. After the tokenization was completed, the POS was predicted through the spaCy library, and POS tagging was performed, in which one word is assigned one piece of part-of-speech information [
49]. After the tokenization and POS tagging, dependency parsing was performed to identify the syntactic dependency between each word in a sentence [
50].
4.3. ITB Analysis Modelling
4.3.1. Critical Risk Check (CRC) Submodule
The
Critical Risk Check (CRC) module detects risks according to specific rules using PhraseMatcher. PhraseMatcher is a function of SpaCy, a Python open-source library that extracts the terms related to user-specified rules [
51]. In this study, the PhraseMatcher technique, which enables the automatic extraction of information through rules, was applied to check the existence of risk clauses in the contract.
First, pre-processing was performed to separate the sentences of ITB using SpaCy’s Part of Speech (POS) tagging and dependency parsing techniques prior to the main analysis. After pre-processing, ITB extracts risk clauses through CRC rules. For example, the rules were developed in this study to extract liquidated damages (LD). LD is one of the most critical risks in EPC projects [
2], a contract clause that compensates the client for their losses if the EPC contractor fails to meet the delivery date or performance promised in the contract. This study shows LD as an example when developing the rules for all of the submodules under the ITB Analysis module. Choi et al. [
41] explained CRC rule for ‘Liquidated Damages (LD)’ and the related keywords from the contract risk list for a CRC module. These rules were developed by analyzing the ITBs previously collected. The 35 CRC rules were configured from those EPC contracts. Among the list for CRC, Level 1 indicates major risk items in the contract, and Level 2 indicates the keywords’ associated risks. If a user wants to find a Level 1 risk clause called ‘Liquidated Damages’, the LD-related sentences are extracted when a sentence containing one of the keywords listed in Level 2. If the relevant risk clause does not exist, ‘No detected message’ is printed and displayed on the module interface [
41]. The CRC module was implemented to
EMAP using Python.
4.3.2. Terms Frequency (TF) Submodule
The
Terms Frequency (TF) module applies NER to tag risk terms in the relevant risk clauses in the contract, and reports their frequencies. NER is an information extraction technique that extracts and classifies the syntax of named entity types, such as PERSON, ORGANIZATION and LOCATION, in the text from the text [
15]. The TF module to which the NER model is applied can present the user with a risk, such as an LD-related clause that has not been found in a rule-base, such as PhraseMatcher. The training model to which NER is applied learns the entity label through the training dataset. After that, the training model can be used to analyze whether keywords belonging to the entity label exist. For the TF analysis, the critical risk words in the EPC contract were first designated as the NER level. After collecting the sentences with the corresponding level from the contract, it was written as a JavaScript Object Notation (JSON) file, which was used as the training data for the NER for learning entities. In total, 21,683 sentences were collected from 19 contracts for the TF module in this study. The TF module performed a pre-processing for the NER training. Furthermore, for the training of the NER model, the given data was divided into three training datasets—Train, Validation, and Test datasets—and used.
For the training of the NER model, the data for each risk entity were written in the JavaScript Object Notation (JSON) format and used as the learning data. There were about 20 entities used as NER training data, and at least 50 or more used sentences for each entity. Choi et al. [
41] introduced the detailed module description and development procedures of the TF modules in this section. This study implemented the TF algorithm applied NER using the Python programming language.
4.3.3. Semantic Analysis Submodule
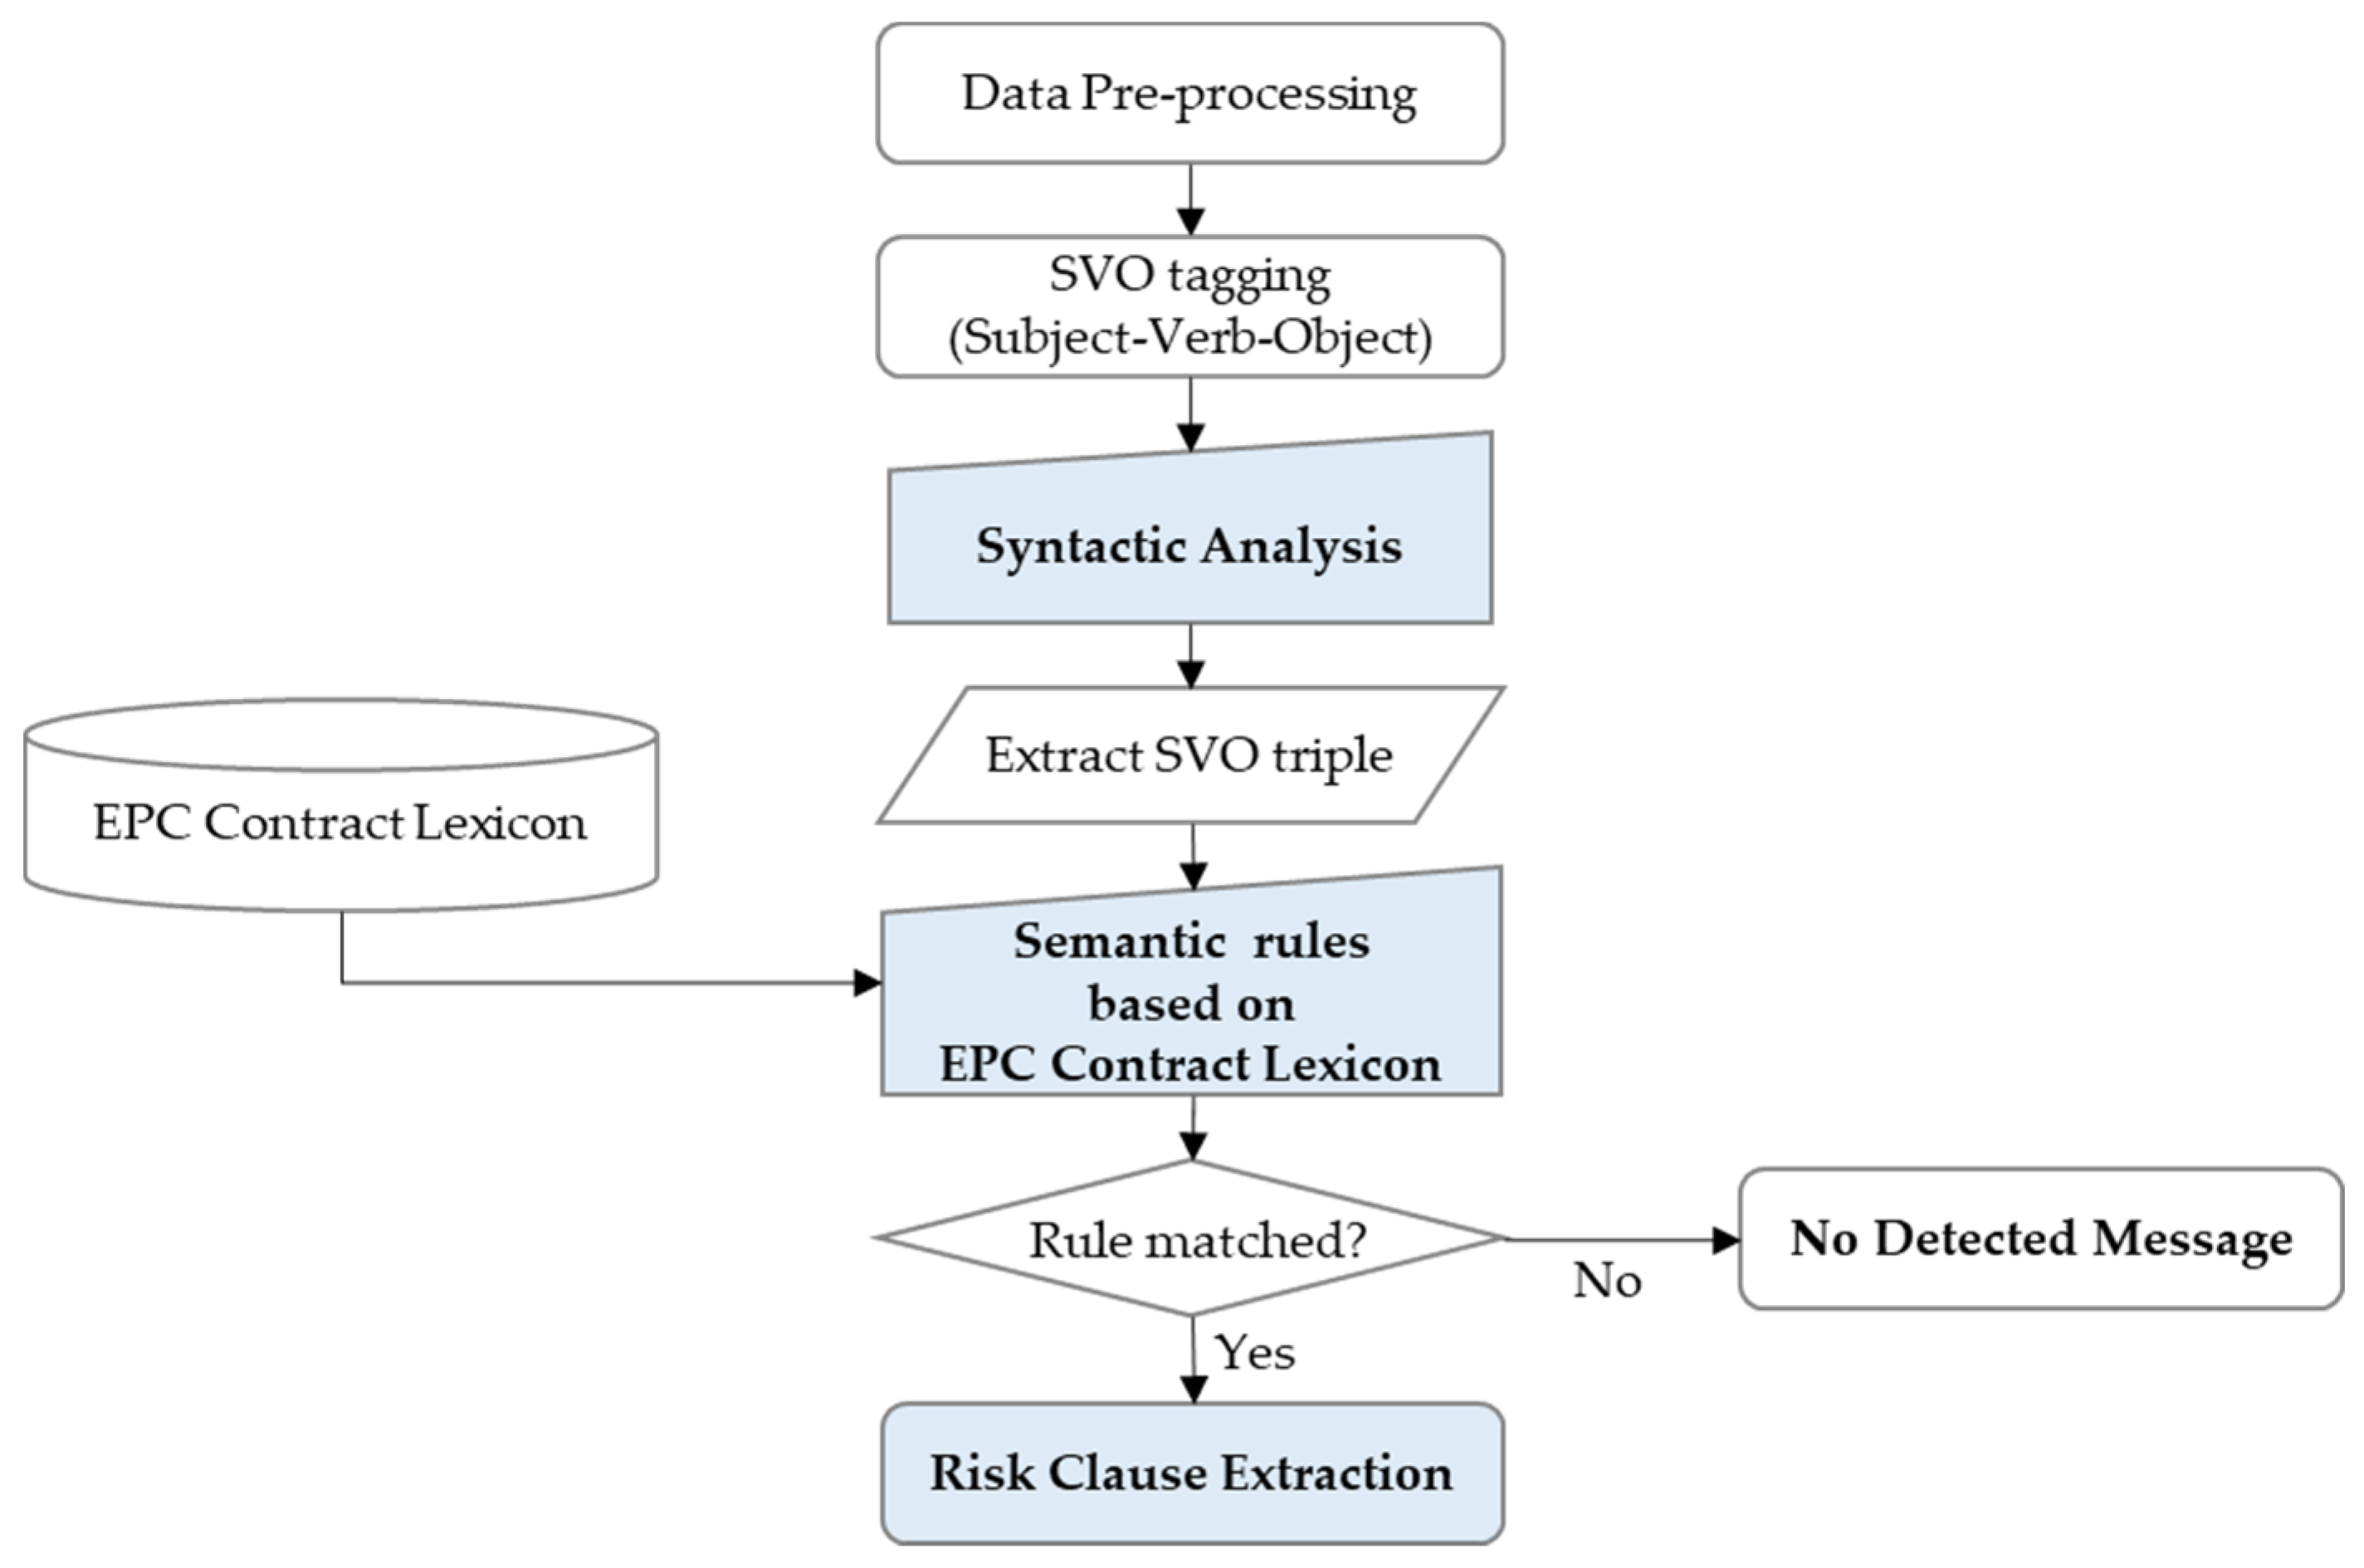
Semantic Analysis is a function that extracts the critical risk clauses of EPC contracts by applying NLP technology. Most of the risks in ITB can be extracted only by a keyword search through the PhraseMatcher function. However, there are risk clauses that cannot be extracted by a simple keyword-based risk search, such as fail-safe contract clauses. Semantic analysis extracts risk clauses that CRC or TF cannot search. Semantic Analysis is a syntactic analysis method to analyze sentence structure to extract risk by understanding the contextual meaning. The rule-based approach was chosen due to the practical difficulties of securing thousands of training datasets for the ML. In this study, the semantic rule, an automatic risk extraction rule, was developed by analyzing the information generation pattern of risk sentences based on 19 EPC project contracts. Based on these semantic rules and the EPC contract lexicon, an automatic contract risk extraction model was developed.
The semantic analysis module of this study follows the rule-based general NLP pipeline. That is, the pre-processing of the contract to be analyzed, syntactic analysis, lexicon development, semantic rule matching, and then risk extraction were performed in order.
Figure 3 shows the process for the semantic analysis model using the semantic rule.
For
Semantic Analysis, separate data pre-processing—such as text tokenization, lemmatization, POS tagging, and dependency parsing—was first performed. The pre-processed data were subjected to syntactic analysis to identify the sentence’s grammatical structure, and the Subject-Verb-Object (SVO) was extracted from the sentence. By applying the EPC contract lexicon to the extracted SVO triple, a semantic rule was developed, and then the risk was extracted according to whether it was matched with the rule. This module focuses on syntactic analysis, EPC contract lexicon, and semantic rule for risk extraction. In particular, for the development of the EPC contract lexicon, EPC contract experts and practitioners participated in the organization of the taxonomy to which the concept of ontology was applied [
44]. This semantic analysis algorithm was systemized in
EMAP using Python.
4.3.4. Risk Degree Ranking Submodule
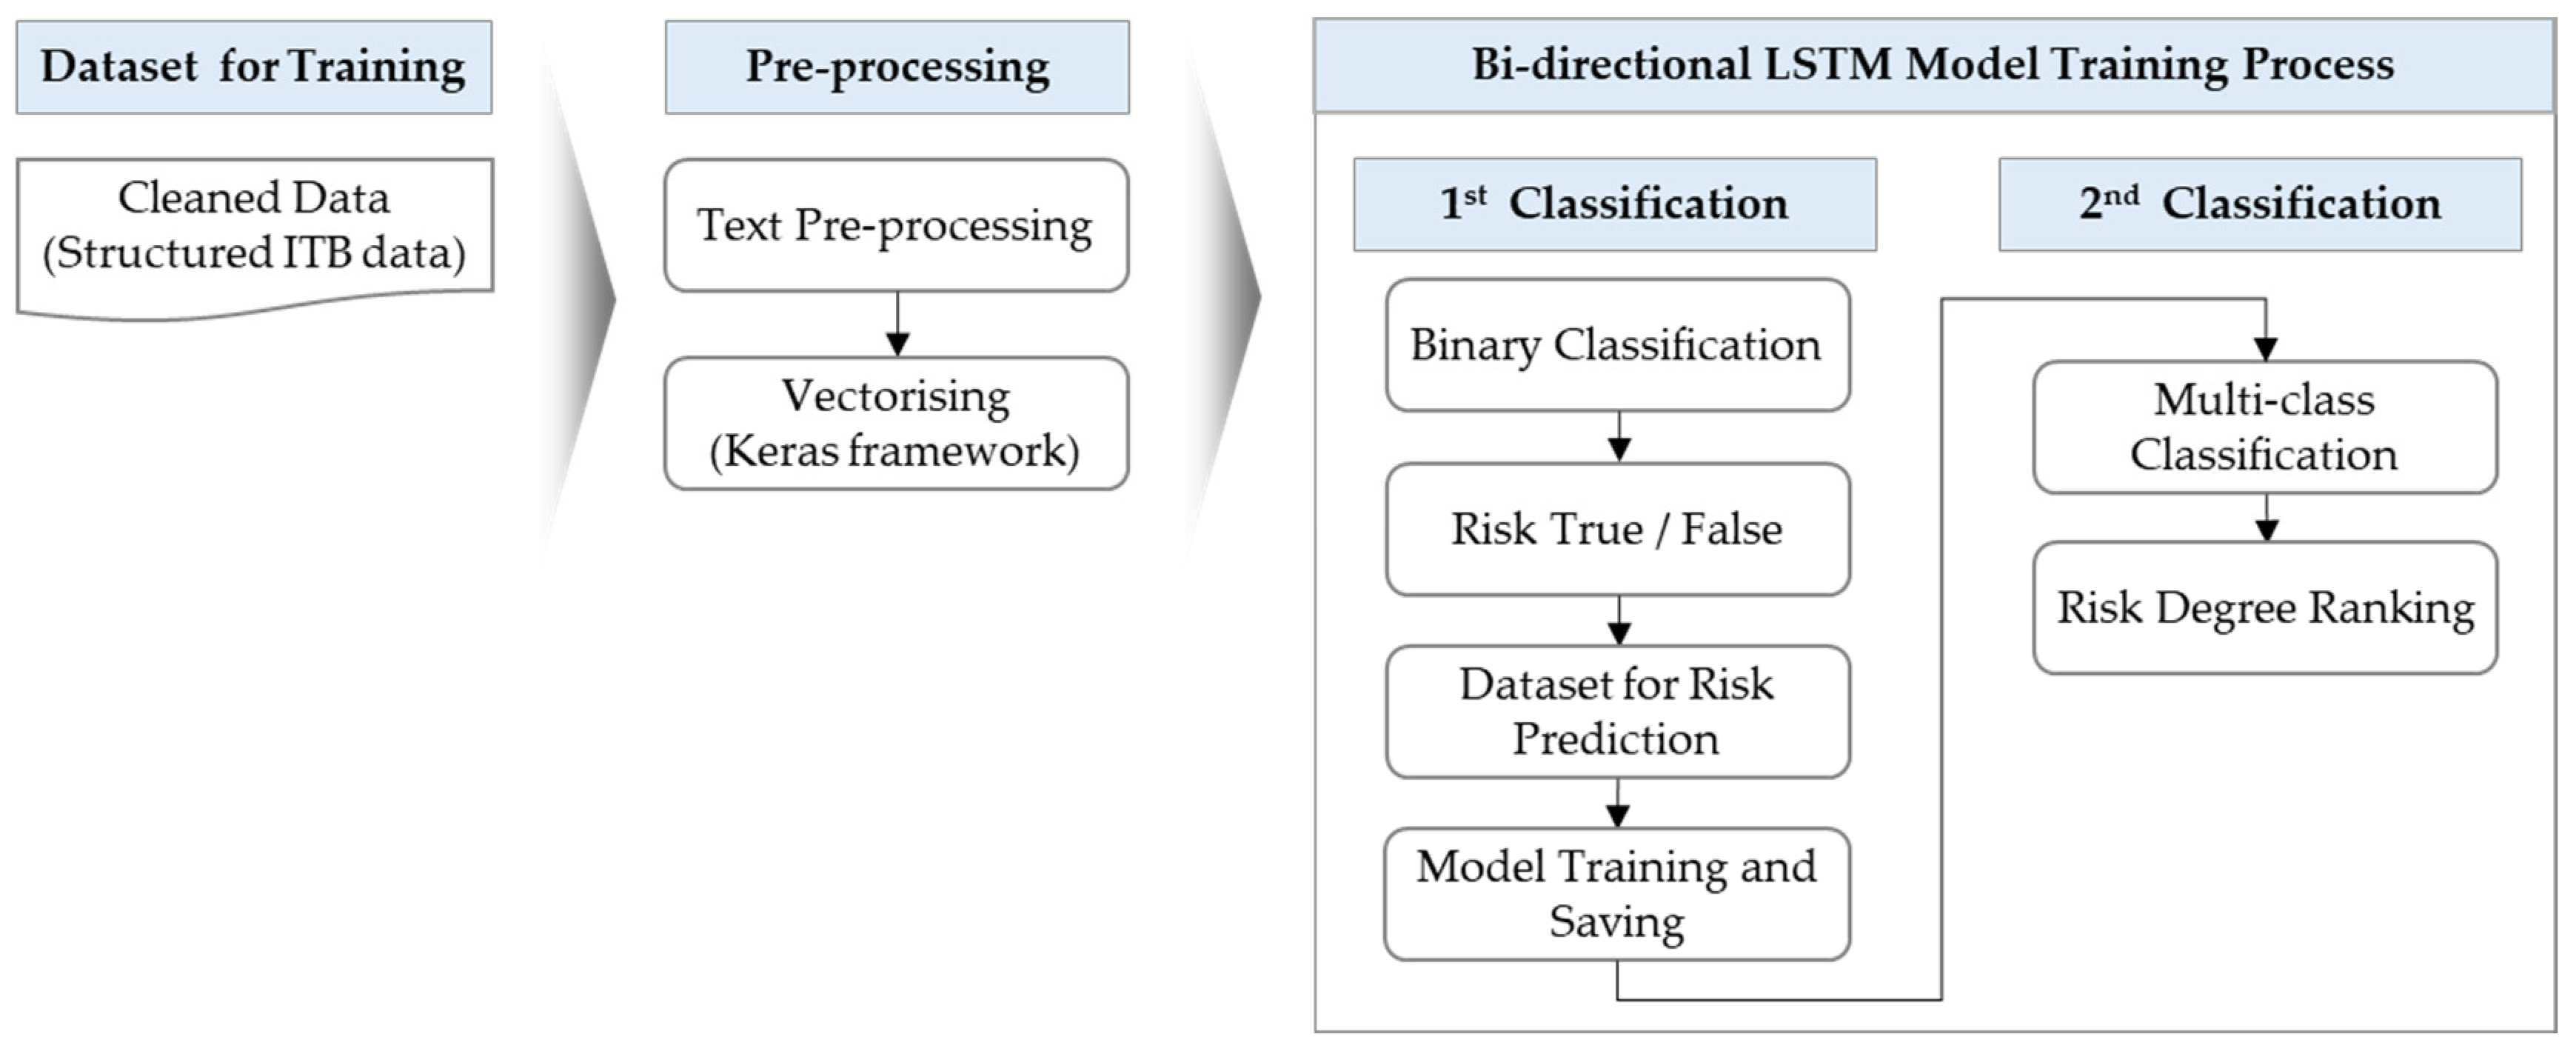
Risk Degree Ranking is a submodule that provides visualization results by classifying EPC contract sentences into five levels. The
Risk Degree Ranking module of this study predicted the risk grade of each sentence in the ITB by applying the bi-directional LSTM algorithm of deep learning. The powerful ability of LSTM to extract advanced text information plays an essential role in the text classification [
45]. Because unidirectional LSTM only sees the past input, it has the disadvantage of preserving only the past information [
52]. Schuster and Paliwal proposed Bi-LSTM to compensate for the shortcomings of unidirectional LSTM [
52]. The Bi-LSTM model has the advantage of exploiting both past and future information [
53] by demonstrating excellent performance in sequential modeling problems. It is widely used for classification [
45]. Text pre-processing, such as stop-word removal and word embedding, was performed prior to the risk rating of the contract clauses. The
Risk Degree Ranking module uses Bi-LSTM to perform the primary classification with a binary classification that gives true/false according to the presence of risk and the multi-level classification of sentences. Multi-class classification was performed as the secondary classification.
Figure 4 shows the algorithm for the classification of the risk level of contract sentences by applying Bi-LSTM.
For the training and testing of the Risk Degree Ranking module, 2380 sentences from a total of five ITBs were collected. In order to determine the risk grade of the ITB sentence, the data—classified into five risk levels—were organized into a dataset through the consultation of experts in the EPC contract field, such as EPC lawyers and ITB managers. The Keras framework was applied to implement the Bi-LSTM algorithm. The model was trained through the training dataset, and the model was implemented using Python.
4.3.5. Design Parameter Comparison Submodule
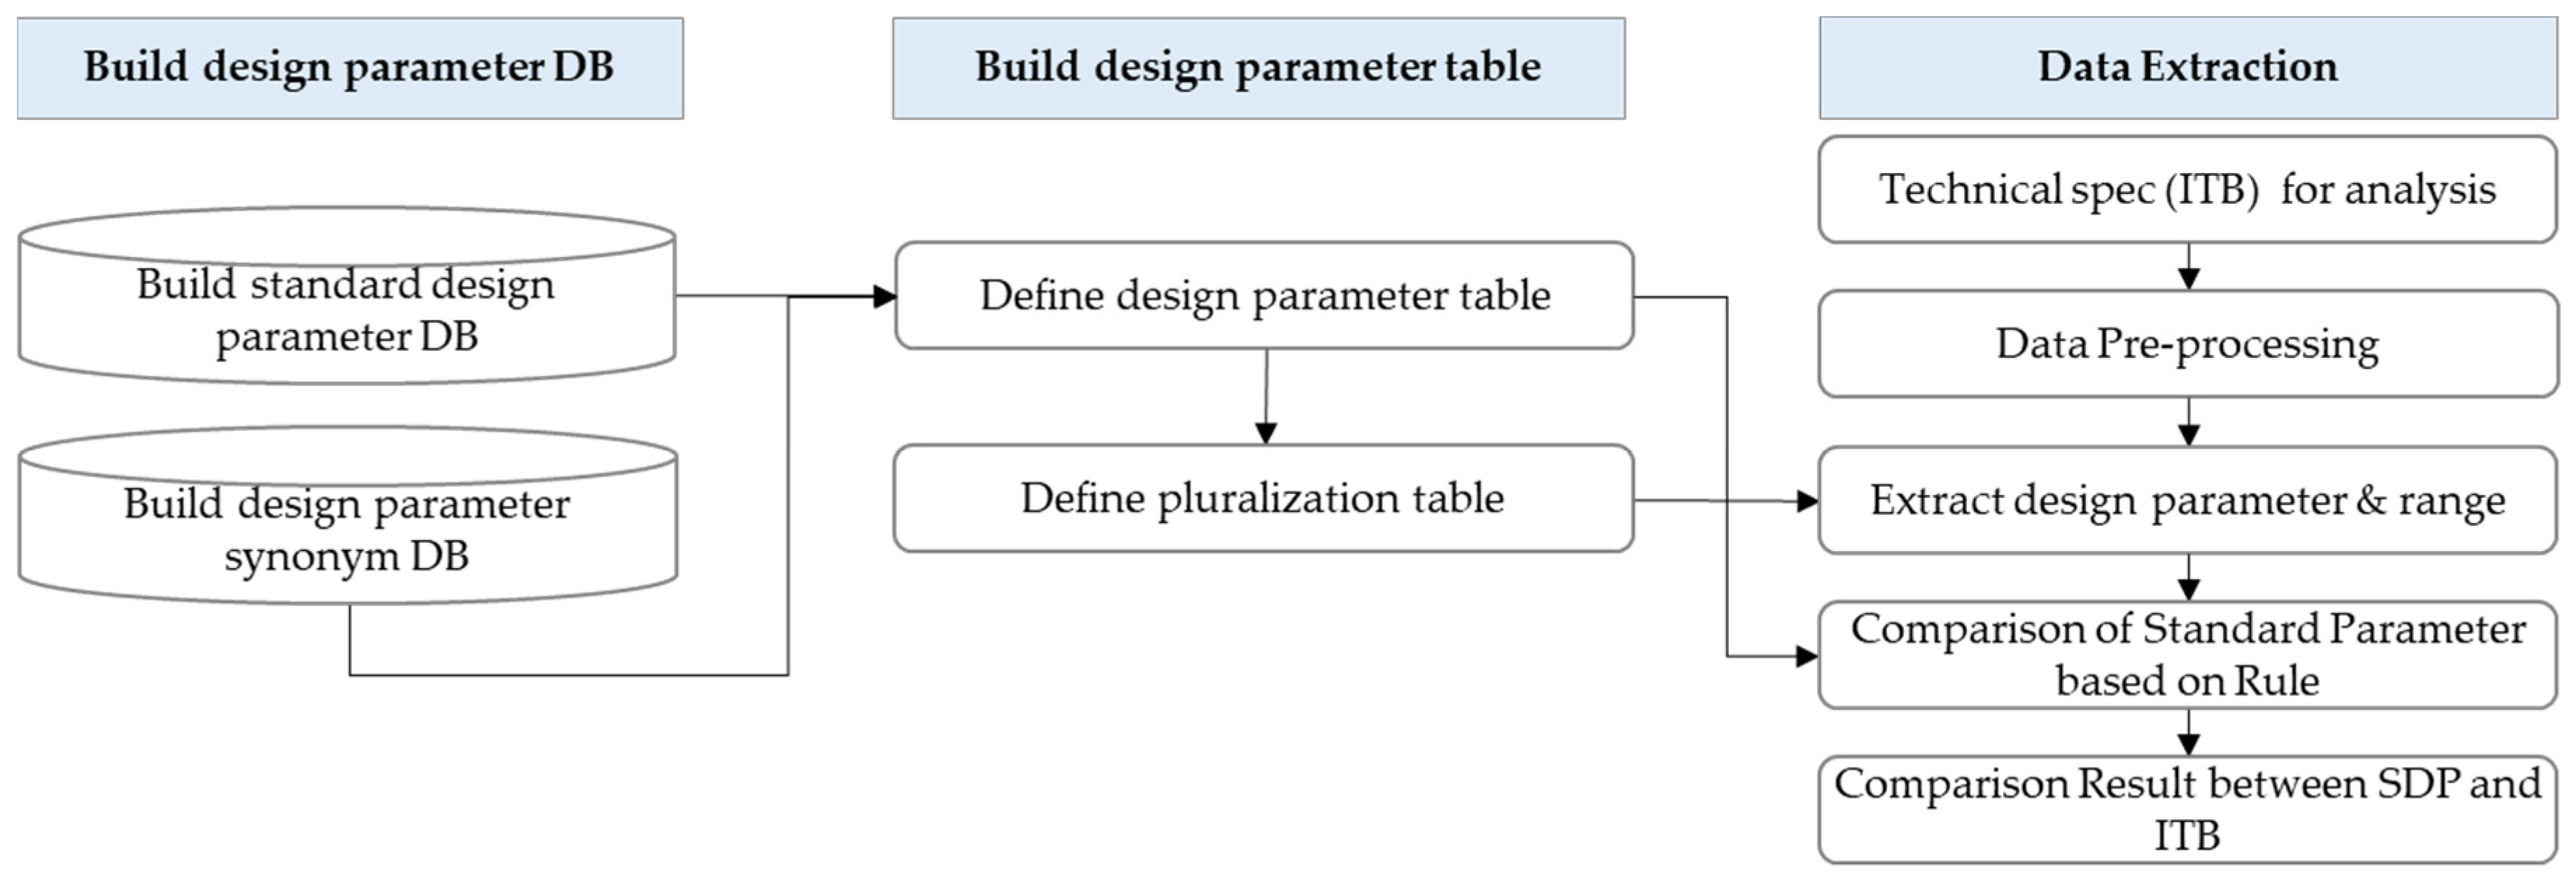
The
Design Parameter Comparison submodule targets SoW documents among the ITBs to be analyzed. By comparing the design parameter in the document with the standard of the design parameter inherent in
EMAP, the suitability of the parameters for each piece of equipment can be analyzed. The key to this module is to establish the parameters of the equipment by the plant work type, and to set its range. First, a DB of the standard design parameters for each piece of equipment used internationally in the EPC project was built, and synonyms for these design parameters were collected in order to develop a design parameter synonym DB. After that, the standard design parameter table was established by combining the synonym DB with the standard design parameter DB. For the design parameter extraction, parameters and ranges were set by experts for each plant work type. The preset design parameters and their ranges were organized into a standard design parameter table and embedded in
EMAP. The design parameter of the SoW to be analyzed through the comparison algorithm was compared with the design parameter embedded in the system, and a comparison rule was created for this purpose. This comparison rule makes it possible to identify which attribute each number represents. When the user inputs the analysis target ITB, the parameter range value of the analysis target is compared with the embedded parameter range. The design parameter comparison module was implemented using Python.
Figure 5 shows the overall process for the comparison of the global standard design parameters of the plant project with the design parameters of the ITB.
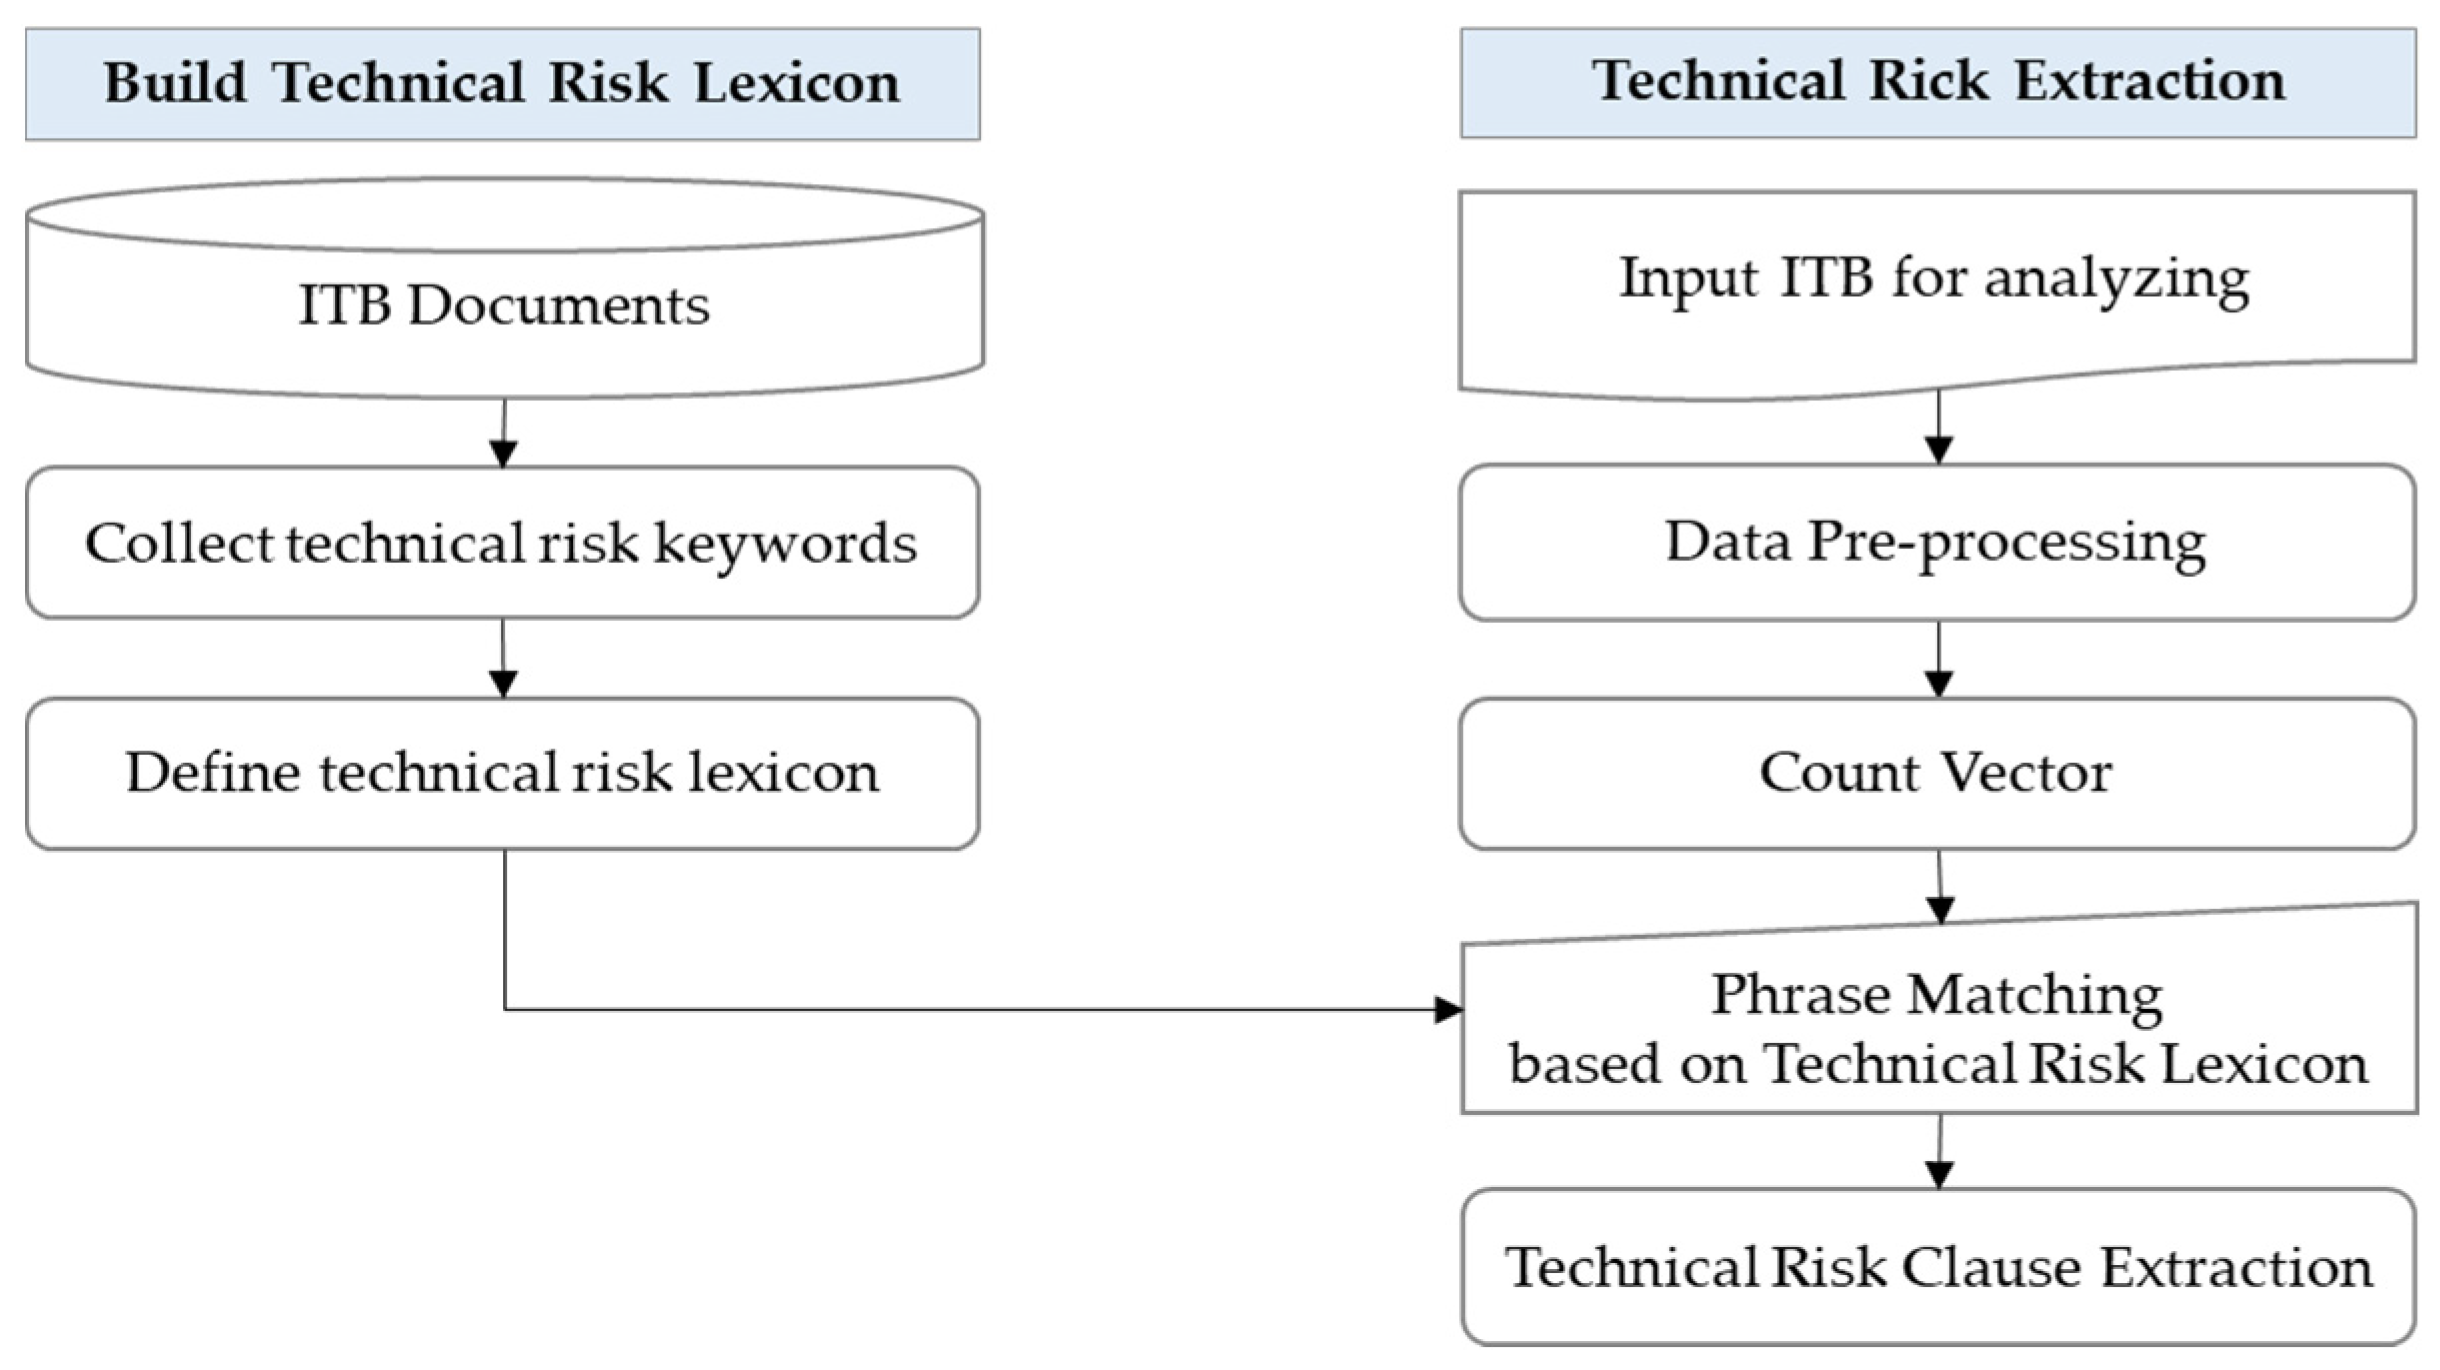
4.3.6. Technical Risk Extraction Submodule
Technical Risk Extraction is an algorithm for preemptively responding to risks by extracting technical risk clauses from technical specifications in the ITB. For this purpose, this study collected the risk clauses in the technical specifications of various EPC projects, such as offshore plants and chemical plants, and defined the risk keywords for them. The main risk keywords of the collected technical specification were classified by their severity criteria and classified into three groups: Strong impact, Moderate impact, and Weak impact. A score of 3 points for Strong impact, 2 points for Moderate impact, and 1 point for Weak impact was given, and the risk keyword group to which the impact level was assigned was named the technical risk lexicon.
Table 4 shows the risk keyword samples classified into three risk groups in the technical risk lexicon.
Technical Risk Extraction is a module that extracts the risk of the scope of works using the phrase-match technique of NLP. When the user inputs the technical specification to be analyzed, the severity score of the corresponding keyword is calculated when each vocabulary of SoW and the keyword on the lexicon are matched. In this process, by calculating the count vector for each sentence in SoW through the CountVectorizer, it is possible to extract the frequency of the risk keyword specified in the lexicon. Through this process, the risk evaluation score for each sentence is calculated. The listed results can support the ITB person in charge of analyzing the technical specifications by finding the highest risk clause and responding to the risk.
Figure 6 shows the Technical Risk Extraction process.
4.4. Validation for the ITB Analysis Module
In order to verify the applicability of the architecture and algorithm of
EMAP, as proposed in this study, actual data from the plant project was applied to
EMAP and tested. For information extraction result verification using NLP, a method that compares human extraction results with machine extraction results is widely used [
54,
55]. In order to validate the performance of the five submodules among the
ITB Analysis modules, excluding the
Risk Degree Ranking module, subject matter experts (SMEs) with more than 10 to 20 years of experience in the plant field were first subjected to the analysis of the ITB risk. Seven SMEs participated in the validation, consisting of EPC executives, academia, and EPC lawyers.
The most widely used method among the verification methods for studies applying NLP is the confusion matrix, which uses precision, recall, and the F-measure, as shown in
Table 5 below [
54,
55]. There are four variables in the confusion matrix: True Positive (TP), False Positive (FP), False Negative (FN), and True Negative (TN) [
54].
Table 5 shows the confusion matrix of previous studies for the risk extraction accuracy evaluation of the
ITB Analysis module, which was modified to fit this study.
The meaning of ‘Positive’ or ‘Negative’ in the above matrix is the presence or absence of risk in the extraction clause, respectively. In other words, if the extracted clause is a risk clause, it is ‘Positive’, and if it is not, it is ‘Negative’. ‘True’ and ‘False’ are whether the extraction result is consistent with an external judgment, that is, SMEs. Among the variables shown in the confusion matrix, FP and FN are the meaning of the error in the result.
Precision can be defined as the ratio of the risk clause output through the risk extraction model of the
ITB Analysis module and the clause identified as a risk by the SMEs, i.e., (Equation (1)).
Recall means the number of data that the
ITB Analysis module detects for which the actual risk clause of the contract to be analyzed is also true, i.e., (Equation (2)).
There is a trade-off between
precision and
recall. The
F-measure can be defined as a ‘harmonic mean’ between
precision and
recall [
54,
55], and can be defined as follows (Equation (3)):
Of the five submodules, the test set for three submodules for contract risk extraction—CRC, TF, and Semantic Analysis—was targeted for two offshore contracts: a total of 2886 records.
Table 6 shows the information on two datasets to verify the three submodules.
Among the
ITB Analysis modules, five risk extraction submodules, except for the Risk Degree Ranking submodule, were tested by applying a confusion matrix. As a result of the performance test, it was found that the CRC submodule showed the highest risk extraction performance with an F-measure of 87.1% among the three submodules for contract risk extraction. The submodule that recorded the lowest F-measure shows the F-measure result of 70.0% as the Terms Frequency. In particular, compared to the recall value of 99.3%, the meaning of 54.0% precision extracts most of the risk values specified by experts, but 45% of the extraction results can be interpreted as duplicate clauses. Among the results in
Table 7, ‘FP’ and ‘FN’ mean errors in risk clause extraction.
In order to verify the performance of the two submodules for technical risk extraction—Design Parameter Comparison and Technical Risk Extraction—one SoW of a refinery plant was selected as a test dataset. A separate dataset was applied to verify the performance of two submodules for the technical risk extraction among the five submodules. This dataset consists of a total of 1874 records. As a result of the verification for the Design Parameter Comparison submodule, a relatively balanced risk extraction accuracy can be seen, with Precision 87.7% and Recall 87.5%. As a result of the verification of the Technical Risk Extraction submodule, the F-measure of over 80% was analyzed to be highly consistent with the risk clause extraction result of the model and the risk of the SMEs.
Table 7 summarizes the performance test results for the five submodules of the
ITB Analysis module.
In the
ITB Analysis module, the Risk Degree Ranking submodule verified the extraction accuracy through training and testing by applying the Bi-LSTM model of deep learning. In this study, the cleaned data used for the Bi-LSTM model training consisted of a total of 2380 sentences, and the ratio of the training data and test data among the total data was 80:20.
Table 8 shows the test results for the primary and secondary classification through the Bi-LSTM model.
As a result of the validation test of the above five risk extraction submodules and one risk degree ranking submodule, there is a difference in risk judgment for each expert, and accordingly, the result cannot be considered perfect. Rule-based risk extraction also cannot develop all of the rules shown in the contract, and as a result, human judgement-like performance cannot be expected. The ITB analysis module supports the detection of risk clauses in the EPC bid documents, which can contribute to the reduction of the workload when analyzing a large number of bid documents, and has also built a technical system that can prevent human errors. In addition, it can be said that there are implications in the fact that the contract analysis study was attempted through artificial intelligence.
5. Design Analysis Package (M2–M4)
In the EPC project, design accounts for only 5% of the total cost, but affects the entire process, including construction, installation, maintenance, and repair [
56]. The design analysis module applies the ML algorithm to estimate the design cost through data generated in the design and construction phase of a plant project, and to predict the impact of cost over-run and schedule delay due to design errors and design changes. The Design Analysis Package consists of three modules:
Design Cost Estimation,
Design Error Check, and
Change Order Forecast modules. Each module performs model training using
EMAP’s ML platform. The engineering ML platform,
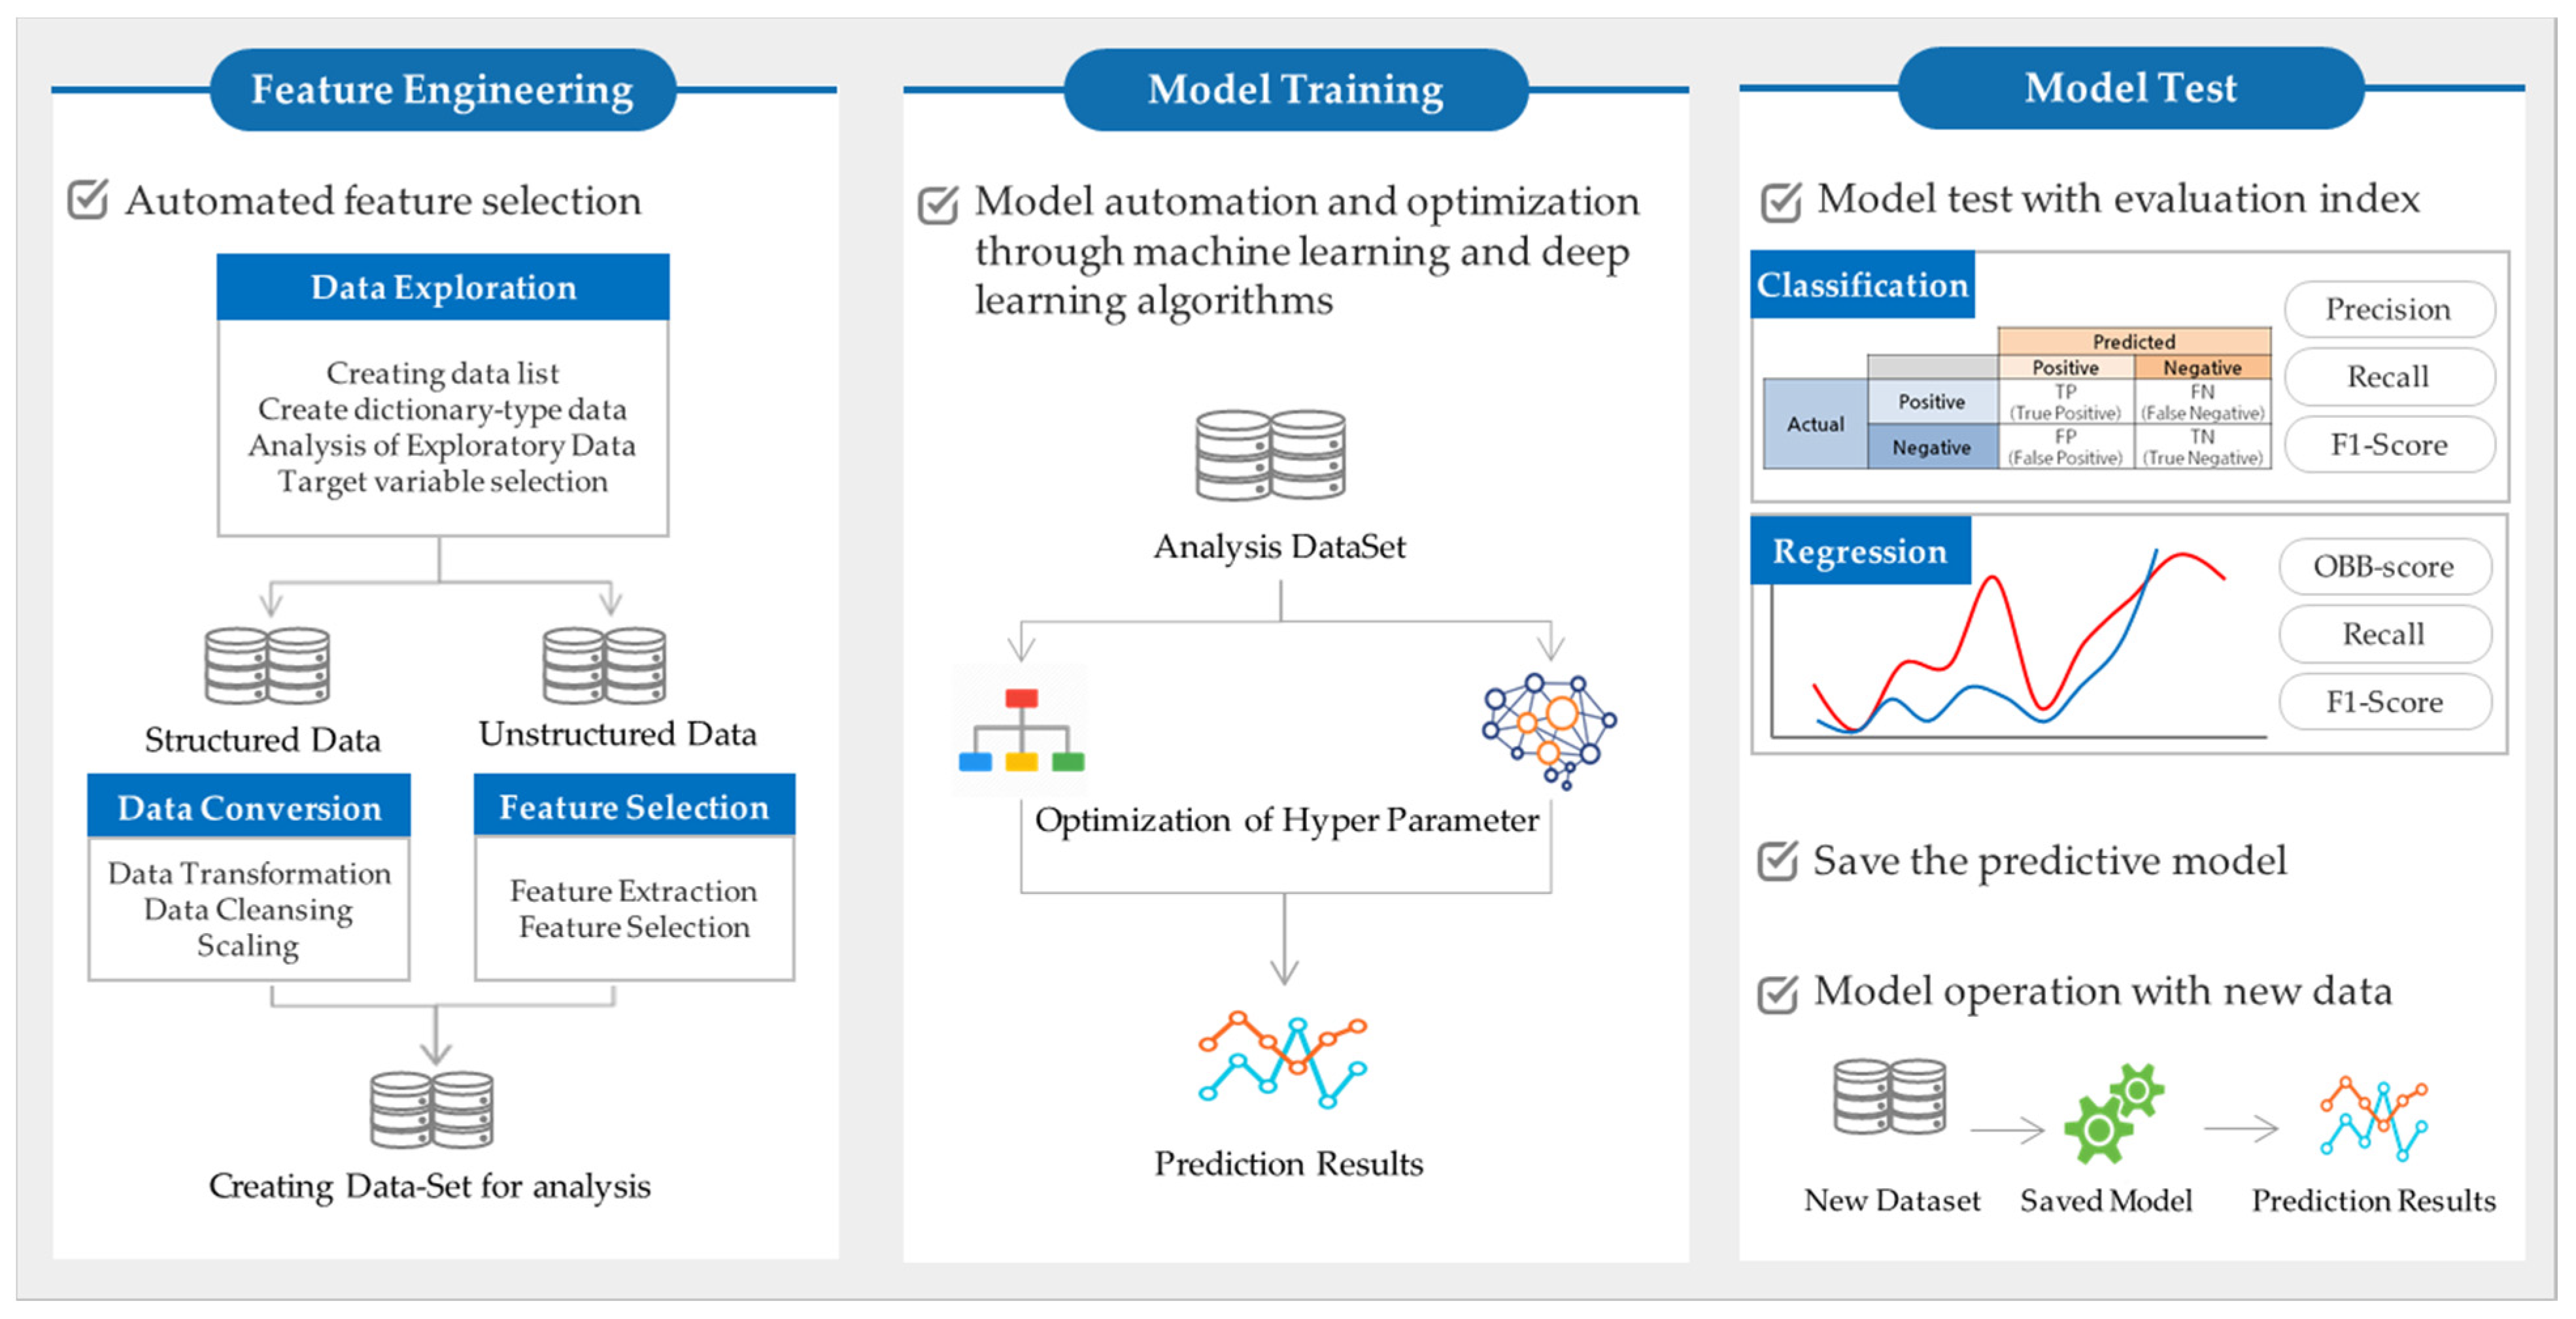
EMAP, is a system that delivers the integrated data stored in the knowledge base with the feature engineering, model training, and model operation.
Figure 7 shows an overview of the engineering ML platform developed in this study. These principles were applied to the
Design Analysis Package and
Predictive Maintenance modules among the decision support systems.
EMAP’s platform chooses a predictive model type for forecasting purposes through the engineering ML technique. Regression and deep-learning algorithms are chosen for a supervised learning approach, and clustering algorithms are chosen for an unsupervised learning approach.
EMAP provides Decision Tree, Random Forest, Gradient Boosting, and XGBoost as reference models for classification or regression algorithms.
Table 9 shows the various types of algorithms supported by the engineering ML platform and their functions.
The Design Cost Estimation module applies a regression algorithm for engineering M/H prediction, and the Equipment Predictive Maintenance module creates a predictive model using a regression algorithm for the RUL prediction of a turbo fan engine, the pump maintenance demand prediction of a wastewater treatment facility, and pump parts demand prediction. On the other hand, the Design Error Check and Change Order Forecast module, which applied the classification algorithm, developed an ML model using the classification algorithm because each target variable is categorical. This study also verified four modules (M2~M5) by applying Decision Tree, Random Forest, Gradient Boosting, and XGBoost algorithms that can be used for both regression and classification.
The
Design Analysis Package was developed from ML prediction and classification algorithms such as Decision Tree, Random Forest, Gradient Boosting, and XGBoost as reference models. The decision tree algorithm has the advantage of showing the decision-making process visually and explicitly, requiring little data processing and making it easy to interpret and understand the results [
57]. A decision tree has a faster learning and classification speed than other decision support tools, but has the disadvantage of being very vulnerable to overfitting problems [
57]. A method to solve this problem is a random forest. The basic goal of the random forest is to obtain the output candidates for the input data using multiple decision trees, and to derive the best result by combining the results [
57]. ML ensemble techniques include bagging and boosting. Representative models of bagging include Random Forest and Neural Network Ensembles, and representative models of boosting series include AdaBoost and Gradient Boost [
58]. In ML, boosting is a sequential ensemble learning technique [
59], which refers to a method of creating a more accurate and strong learner by combining a simple and weak learner [
60]. A Gradient Boosting Machine (GBM) is a predictive model that can perform regression or classification analysis and has the highest predictive performance among predictive ML algorithms [
61]. eXtra Gradient Boost (XGBoost) is an algorithm that achieves dramatic improvements in speed and performance by improving the disadvantages of gradient boosting, which takes a very long time to compute because parallel processing is not supported for large data [
61]. XGBoost supports both regression and classification problems, and is a popular algorithm because of its good performance and resource efficiency [
62].
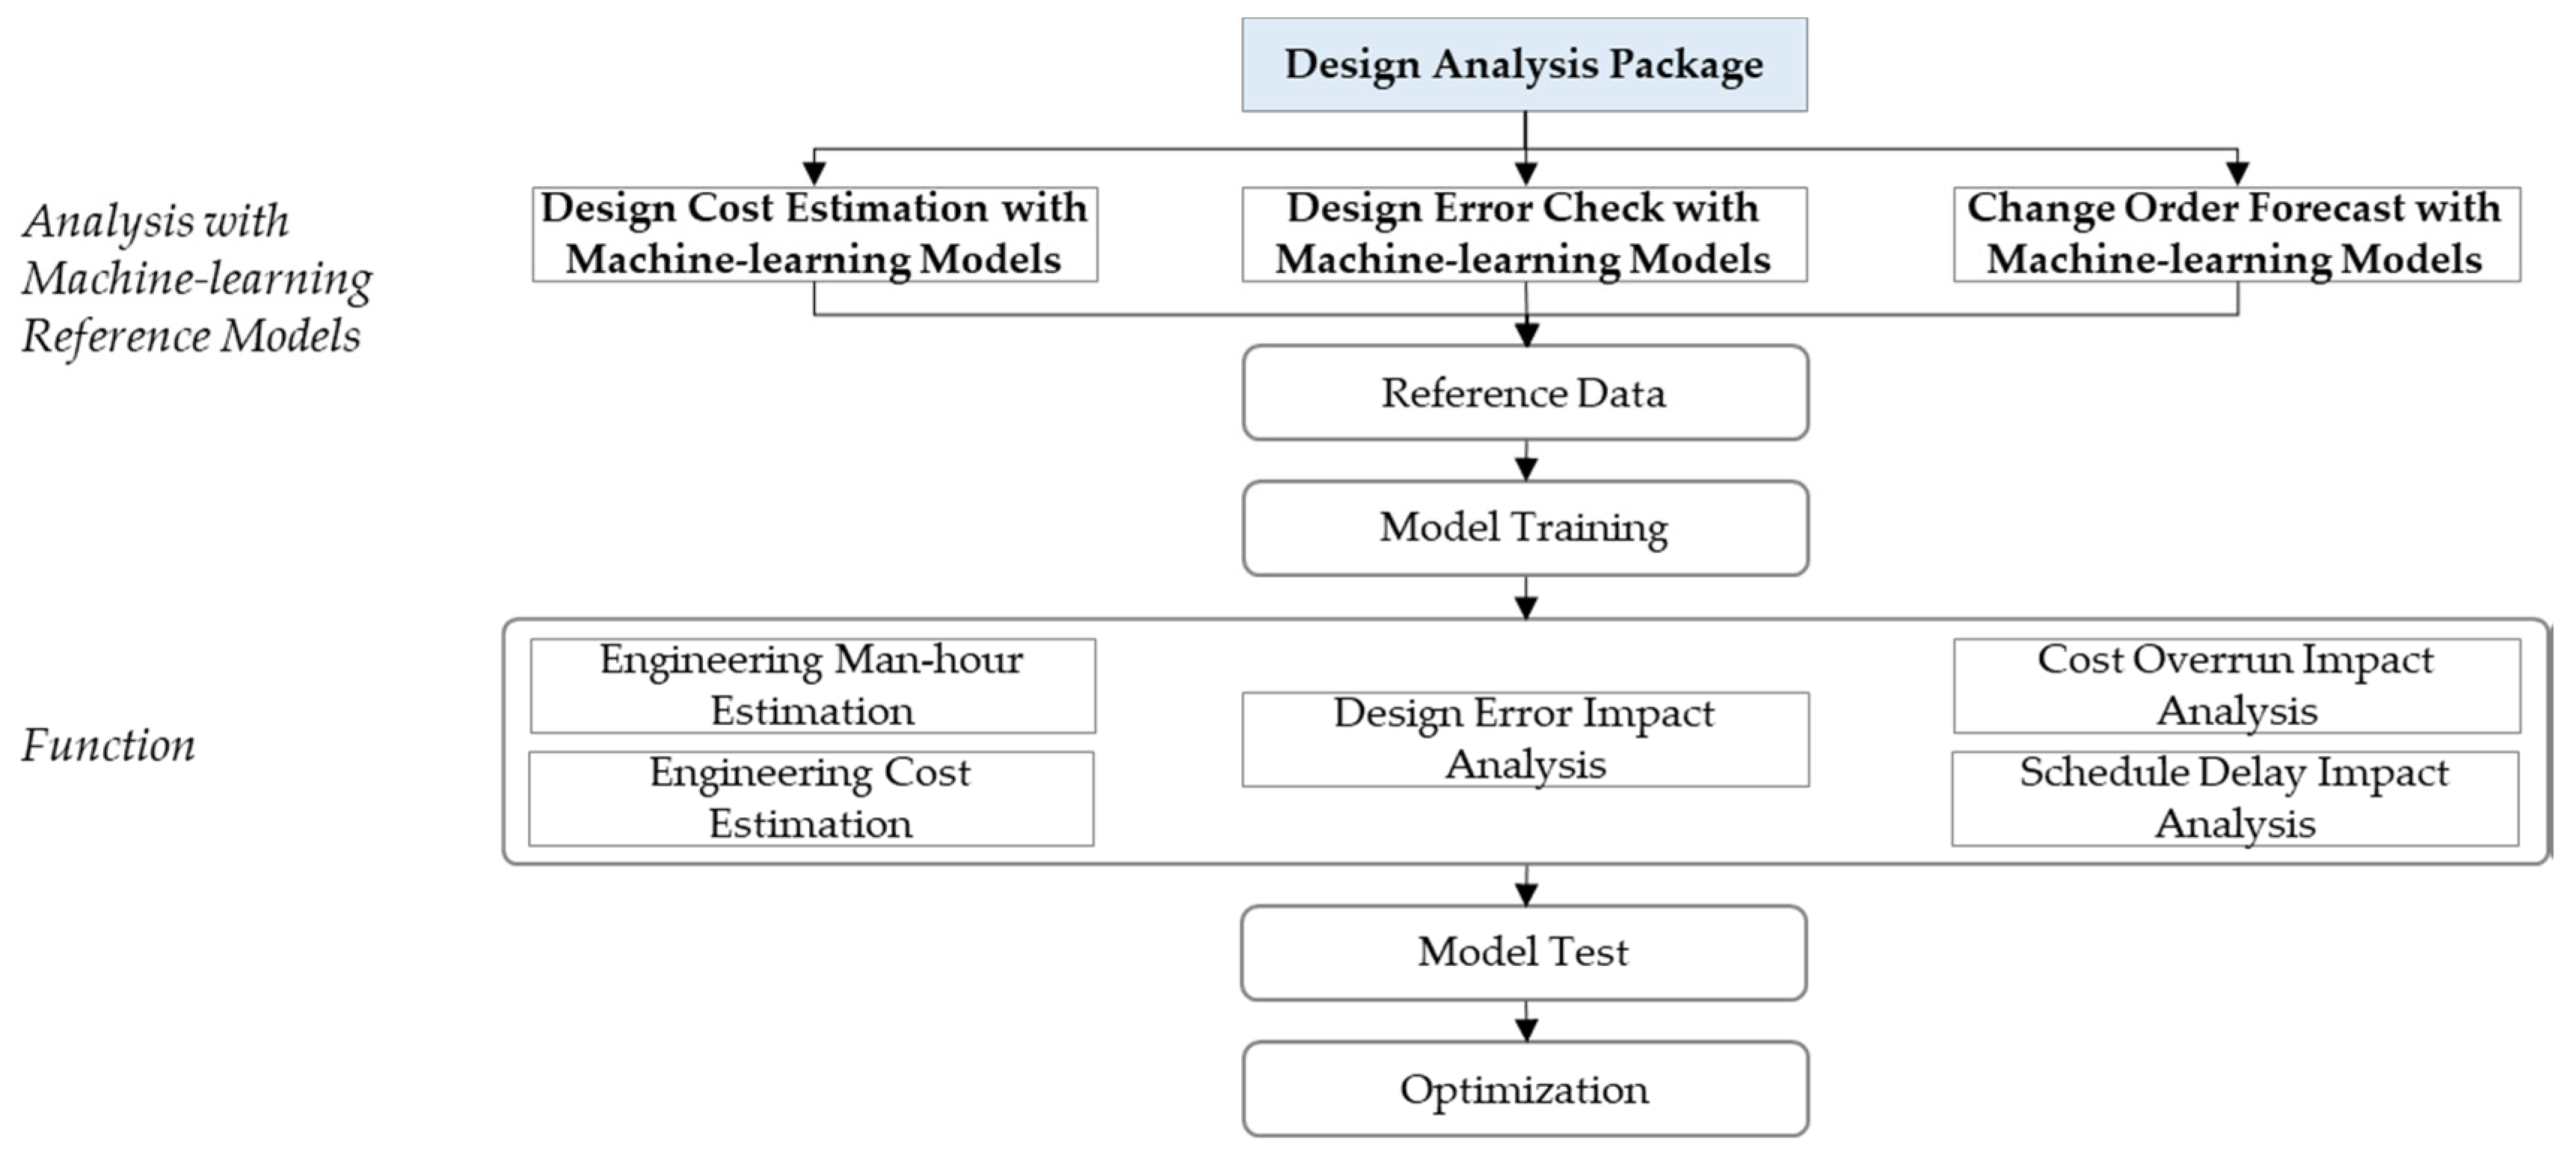
Figure 8 shows the composition and function of the Design Analysis Package. The collected design data is converted into reference data, and is then used for the ML model training for each module. The data entered by the user is analyzed through the trained ML model, and then the predicted values are provided. The user can select the model that provides the best prediction value.
The algorithms and analysis procedures used in the Design Analysis Package are applied to the Design Cost Estimation, the Design Error Check, the Change Order Forecast, and the Equipment Predictive Maintenance modules. The details are described in each module.
5.1. Design Cost Estimation Module (M2)
This module is to support the bidder’s decision making by predicting the ML-based design cost in EPC projects. The range of design cost estimation to be predicted in this study is limited to the number of design man hours (M-H) required from the bidding to the construction of the EPC project. For this study, design data of about 40 EPC projects in the past were collected from EPC contractors for onshore and offshore plants, and a model for the estimation of the design M-H was developed using this information.
5.1.1. Data Collection
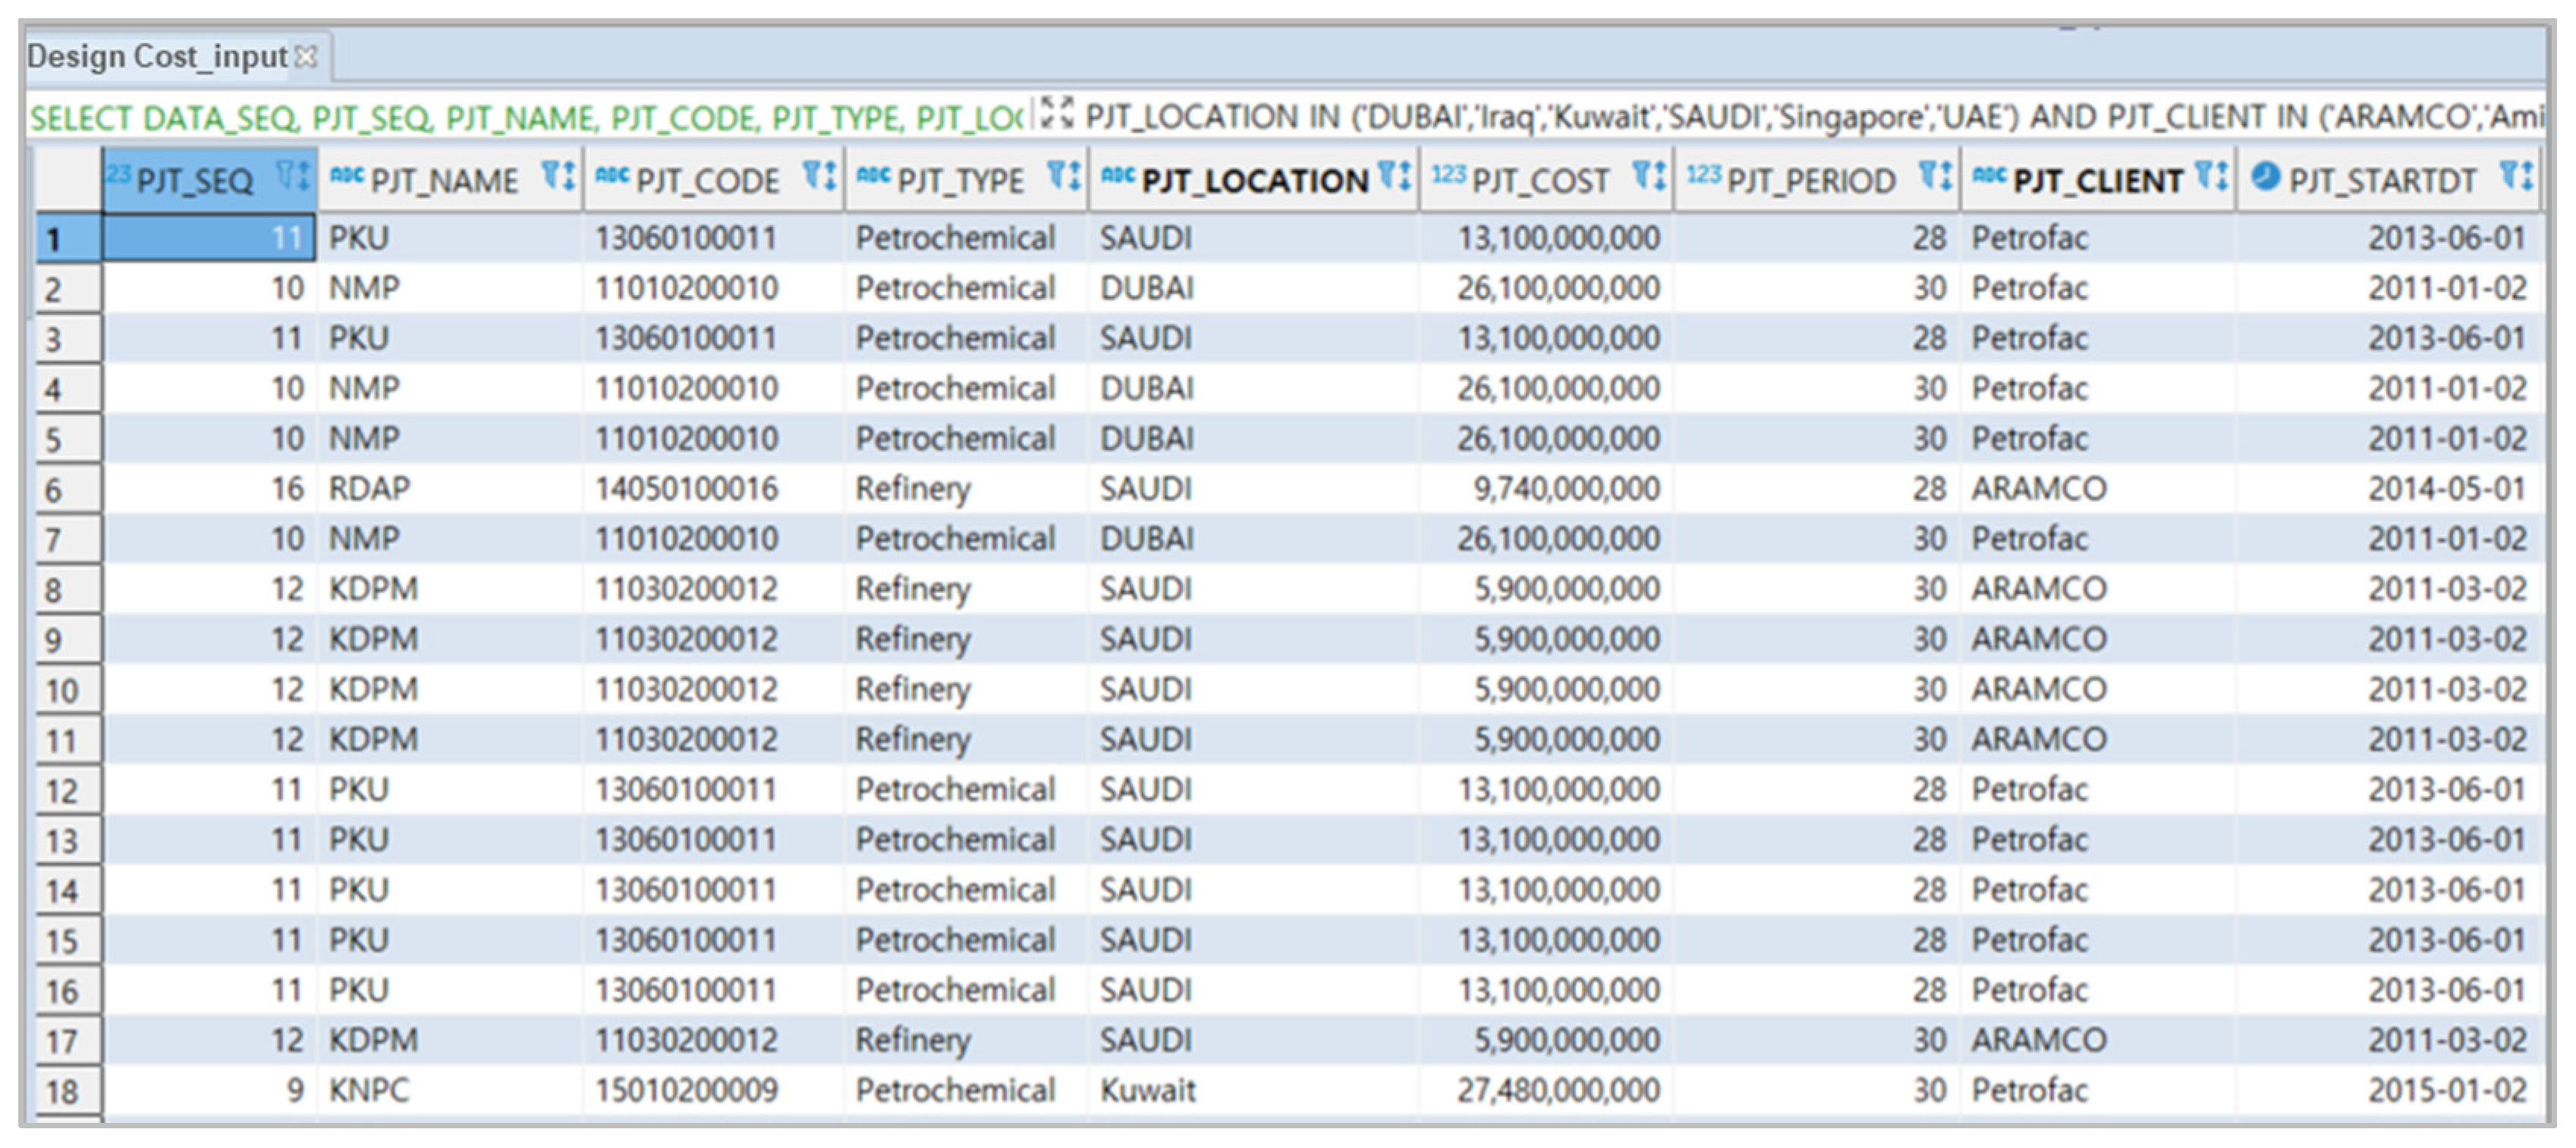
For this study, the project information—such as the project type, the contract amount, the contract period, the design cost, and the number of design hours—were collected, and a dataset for the application of the ML model was developed based on these data. The collected project data were converted into a table with the uniform-formatted fields, such as the project type, amount, scale, period, and ordering party in the DB. The DB data are divided into the plant type, project type, project field, project code, project name, site location, scale, period, ordering party, and others. The data were used as the reference data for the
Design Cost Estimation, the
Design Error Check and the
Change Order Forecast modules.
Figure 9 shows the DB for the design cost estimation.
5.1.2. Data Pre-Processing
The data pre-processing for the
Design Cost Estimation module was divided into the data transformation and feature scaling. The process of changing the format or structure of data so that it can be applied to an ML model is called data transformation [
63]. String data was converted to integer data, and continuous variables were standardized, normalized, and discretized. Feature scaling is a part of data pre-processing, and when the numerical scale of the values of each feature is different, it refers to the operation of adjusting the value range to a certain level [
63]. That is, it normalizes the size and range of the features.
The
Design Cost Estimation module performed the feature scaling of the data to apply the regression algorithm. The categorical variables were dummy, and numerical variables were scaled using four scalers: the Standard Scaler, Robust Scaler, MinMax Scaler, and MaxAbs Scaler. The above four scaling techniques were verified with three methods: a train-test data split, K-fold Cross-Validation, and Scikit Learn. A scaler with performance results was selected. The performance of the scaler was verified by applying the ElasticNet algorithm [
64], and the number of cross-validations was applied ten times. When verifying the four scalers, the performance evaluation indicators were the Mean absolute percentage error (MAPE) and R2 (R Square). MAPE shows the error rate for the predicted value, and it can be interpreted that the lower the value, the smaller the error, and the closer the R2 value is to 1, the greater the degree of linear correlation. When the selected model does not follow the data trend, the R2 value appears negative [
65]. As a result of comparing the MAPE and R2 values, the Standard Scaler shows the best results in most verifications.
Table 10 shows the verification results for the four scalers used in the
Design Cost Estimation module.
5.1.3. Design Cost Estimation Modelling
The Design Cost Estimation module can generate a predictive model using regression algorithms for the engineering of the M-H prediction. In this study, a predictive model was created using Decision Tree, Random Forest, Gradient Boosting, and XGBoost algorithms. Reference data scaled using Standard Scaler were used for the model training for design time prediction. The model training aims to optimize the model by improving the model performance through training, and it enables the optimal model to be applied when analyzing with actual data in the future. When a user inputs new data, it is applied to the trained and stored reference model, and after the model testing, the model with the most optimal performance can be selected and provided to the user.
5.1.4. Validation for the Design Cost Estimation Module
The ML model applied to the design package module and predictive maintenance module of this study was tested through the EMAP system, and due to the space limitation of this paper, the application results of all of the models appearing on the system are presented in a table in the validation for each module.
The evaluation of the predictive model for the design M-H estimation is the same as the scaling validation, training and test dataset split, K-fold Cross-Validation, Scikit Learn, and more. Three methods were applied. Twenty percent of the total data was used for the testing of the M-H estimation module, and the cross-validation fold for the prediction model evaluation was set as ten percent, and then tested repeatedly. MAPE, a performance evaluation index, is an index indicating the degree of error occupied by the prediction value, and is mainly used to verify the reliability of the regression model [
66]. MAPE has a percentage value, and it can be interpreted that the closer it is to 0, the better the performance of the regression model. The MAPE formula for the verification of the prediction model of the design M-H estimation is given in Equation (4).
Table 11, below, compares the performance of four prediction algorithms for the
Design Cost Estimation module.
As a result of the Cross-Validation, Decision Tree, a traditional ML algorithm, and XGBoost, as a result of Scikit-Learn validation, show the lowest prediction error rate. Also, as a result of split train and test set validation, random forest shows the lowest prediction error rate. According to
Table 8, a random forest with a prediction error rate of less than 15% can be provided to users as an optimal model.
5.2. Design Error Check Module (M3)
Due to the nature of the plant project, which requires the shortening of the construction period with a fast track, many design drawings must be prepared quickly, and as a result, design errors and omissions such as interference between construction types occur frequently. This design error is one of the major risk factors causing schedule delay and cost increase in the design stage and the subsequent stage of construction. The Design Error Check module aims to predict the impact of design errors and schedule delays by determining the design errors that frequently occur in plant projects in advance. To this end, it is a module that classifies design errors with a high frequency by applying an ML algorithm, and it predicts design errors and the impact of unavoidable delays.
5.2.1. Data Collection
For this study, the design error data, such as crash-report-based design drawing information generated from the 2D drawings and 3D modeling work of the past 32 plant projects and design error types, error reasons, and project description were collected. The detailed classification of the design error dataset was derived through consultation with EPC design experts, and it is divided into the design error type, the design error effect, and the schedule delay effect (refer to
Appendix A,
Table A1). The impact of design errors was classified based on the degree of the cost impact affecting the type of construction, and the impact of schedule delay was classified differently based on the total construction period of 26 months.
5.2.2. Data Pre-Processing
The data pre-processing for the Design Error Check module was divided into data scaling and feature selection. First, feature scaling was performed to control the distribution of the data values in order to improve the performance of the ML model for design error analysis. First, data cleansing was performed, such as removing duplicate values, correcting missing values, removing outliers, linking and integrating data, and changing data structures to create an optimal dataset. The design error check module scaled the data through four scalers, i.e., the Standard Scaler, Robust Scaler, MinMax Scaler, and MaxAbs Scaler, like the Design Cost Estimation module above, and the scaler showing the best performance was selected.
One of the important considerations when selecting an ML model is feature selection, that is, the selection of variables. Atypical text data, such as the reason for a design error, requires the selection of the characteristics for analysis, and in order to select characteristics from text variables, the formalization and integer vectorization of the text data must be conducted in advance [
67]. The formalization of the text data is to convert text data about the reason for the design error into data that can be analyzed [
42]. For this purpose, pre-processing—such as tokenization, stopword processing, and headword extraction—was performed first. In addition, integer vectorization was performed to correct the data imbalance problem. In this study, integer vectorization generates vectors by arranging pre-processed English and Korean text data from high to low frequency and then assigning integers to the words with low frequency. When the number of variables is large, in most cases, only a few of them are related to the target variable. In order to improve the analysis accuracy, the number of design error detections was set as a target variable and analyzed.
5.2.3. Design Error Checking Modelling
In the Design Error Check module, the number of design error detections, or the target variable of the design error data, is a categorical variable, so classification algorithms such as Decision Tree, Random Forest, Gradient Boosting, and XGBoost are applied to build an ML model. The training and testing were performed by dividing the training data and validation data in a ratio of 80:20. After learning the model, the prediction results were checked, and as a result, the best-performing model could be provided to the user.
5.2.4. Validation for the Design Error Check Module
The model evaluation for the
Design Error Check module was tested using the data scaled by the standard scalers of four ML models, i.e., as Decision Tree, Random Forest, Gradient Boosting, and XGBoost. In total, 80% of the data was used for the training models, and 20% was used for the evaluation of the trained models. Tenfold cross-validation was also used. The performance of the
Design Error Check model was evaluated by applying the Precision, Recall, and F-measure measurement methods, which are mainly used to evaluate the performance of the ML to which the classification algorithm is applied.
Table 12, below, is the result of the comparison of the performance of the classification model with the
Design Error Check module. All four models do not show much difference in their Precision and Recall values. Although the design error prediction rate of the four models is about 50%, performance improvements are expected after adding data in the future and for follow-up studies.
5.3. Change Order Forecast Module (M4)
Construction changes inevitably occur due to the large scale and complexity of the plant project. In practice, design changes are commonly referred to as change orders. This change order eventually affects the delay and cost increase due to reworking, and is a major cause of subsequent problems such as claims. The purpose of the Change Order Forecast module is to classify the causes of change orders to recognize the risks of change orders in advance, and to predict the impact on the cost and schedule due to change orders. The Designer Check module and the Change Order Forecast module are fundamentally similar modules in the analysis of the impact of design errors and change orders on the construction schedule and cost, semi-structured data, data pre-processing, and application algorithms. However, there is a slight difference in the details of the reference data for analysis, resulting in a different dataset.
5.3.1. Data Collection
The
Change Order Forecast module collects data such as the types of design change by their construction type, the reasons for the design change, the change order reports, the revision history, PIDs, and the plot plans of the 32 plant projects that have already been completed. The dataset for the change order analysis was defined by dividing the design change causes by type, cost overrun, and schedule delay effect due to design changes (refer to
Appendix A,
Table A2). The causes of design changes were presented in 12 types, and the detailed classification of the change order dataset was developed through the EPC design expert workshop.
5.3.2. Data Pre-Processing
The data pre-processing of the Change Order Forecast module was performed in the same way as the Design Error Check module. The data scaling was performed using four scaling methods: the Standard Scale, MinMax Scale, Robust Scale, and MaxAbs Scale. In order to improve the accuracy of the ML model, unnecessary variables, such as the design ID, PID and Plot plan drawing data, were deleted using regular expressions. A pretreatment was performed for the pre-processed text data, and feature selection was performed through normalization and integer vectorization of the text data in the same way as the Design Error Check module. The text data for which the feature selection has been completed enable the identification of 12 types of change orders based on the keywords frequently appearing in the reason for the change order. Among the change order data, the project name, which is the project identification information, was anonymized.
5.3.3. Change Order Forecasting Modelling
Because the cause of a change order, the target variable of a change order, is a categorical variable, an ML model was constructed using classification algorithms, such as Decision Tree, Random Forest, Gradient Boosting, and XGBoost. The cause of a change order was classified by applying a classification model based on the reason for a change order, and the effect on the cost and schedule was analyzed by constructing a model based on revision history data. After each model training, the model that showed the most optimal performance when inputting the user data was selected and provided to the user.
5.3.4. Validation for the Change Order Forecast Module
The model evaluation of the
Change Order Forecast module was validated using a classification-grouping model to which the Decision Tree, Random Forest, Gradient Boosting, and XGBoost algorithms were applied. Tenfold cross-validation was used in the validation. In the same way as the
Design Error Check, it was tested using data scaled with a standard scaler, and the training and the testing datasets were divided and applied at a ratio of 80:20. In order to evaluate the performance of the
Change Order Forecast module in this study, the precision, recall, and F-measure measurement methods used in the performance evaluation of classification algorithms, similar to the
Design Error Check module, were applied. In the result of the 10-fold cross-validation, the Random Forest algorithm showed the highest prediction rate of change order detection, with an F-measure of 66.5%. If change orders can be predicted by applying ML, it is expected to be highly useful as a breakthrough technology that can quickly supplement design data by detecting design errors.
Table 13 shows the performance evaluation results of the four forecasting models for the
Design Error Check module and the
Change Order Forecast module.
6. The Equipment Predictive Maintenance Module (M5)
Despite regular preventive maintenance and the replacement of parts to prevent equipment failure during plant operation, there is a limit to the prevention of sudden failure. The Predictive Maintenance module of this study uses the ML algorithm to predict the demand for plant equipment items requiring maintenance and to predict the maintenance cycle, thereby increasing the facility’s utilization rate and reducing operating costs. In this study, in consideration of the scalability of the facility to be analyzed in the future and the additional functions to the EMAP system, the analysis was performed on rotating machinery among plant facilities. The turbo fan engine of the aircraft and the wastewater treatment pump of the wastewater treatment facility were selected as the target facility for the analysis of the Predictive Maintenance module.
6.1. Data Collection
Due to the extreme control of plant equipment makers on the outflow of OM and the run-to-failure data of equipment, it is almost impossible to collect source data from industrial sites, and even if it is secured, a high cost must be paid [
68]. In particular, the types of OM data used in the data-driven predictive maintenance approach to which ML is applied are complex and diverse [
69], so it is important to identify the characteristics of the collected data, and to select an analysis method accordingly. For this study, the sensor and the maintenance data of plant facilities, which were publicly available, were collected and used to secure a sufficient amount of data for the ML model application. The ML model for predictive maintenance was designed and analyzed using the aircraft turbofan engine data provided by the Prognostics Data Repository of the National Aeronautics and Space Administration (NASA) [
70]. The Turbo fan engine dataset consists of 100 engines and the sensor data measured when these 100 engines are running. In addition, data on the pump maintenance of domestic wastewater treatment facilities were also collected. The pump in a wastewater treatment facility is the equipment for moving wastewater during wastewater treatment processes. The maintenance history data and the parts demand data for replacement were collected for the four types of pumps (inflow pumps, flow control pumps, treated water transport pumps, and sludge transport pumps) (refer to
Table A3 in
Appendix A). As it is customary not to store external environmental data in domestic wastewater treatment facilities, the environmental data was not reflected.
6.2. Dataset Generation
For the collected data, the data types were defined for each plant facility, and reference data for each facility was created based on the same type of data. This reference data was used as a dataset for the training and testing of the ML model after the pre-processing. NASA’s turbofan engine data is data generated by repeatedly operating the turbofan after setting different operating setting values until failure due to wear occurs in a total of 100 units (engines). The data was defined based on the operating setting value and the Remaining Useful Life (RUL) variable. NASA’s turbo fan engine dataset consists of the multivariate time series data collected until the system failures. Each time series was collected from a different turbo fan engine, and was considered to be from the same type of turbo fan engine. The dataset provides 20,631 data points for training, and 100 data points for testing. Because the dataset shows the pattern that the fault rates increase as the systems reach failures, the testing dataset that was chosen by the non-stratified random subsampling method was provided by NASA [
70,
71]. The testing dataset includes the time series data selected until a specific time prior to showing high fault rates by reaching system failures [
70]. These training and testing datasets were used in the data pre-processing steps, such as the data transformation, scaling, and normalization to improve the ML performance, as explained in detail in
Section 6.3.
The maintenance data collected from the four pumps of the wastewater treatment facility consist of pump operation and maintenance history data, and parts demand data. When constructing the pump dataset, the variables for the prediction of maintenance demand and variables for the prediction of parts demand were classified as shown in
Table A3 in
Appendix A. Among the maintenance data of the pump, 987 data points for maintenance demand forecasting and 54,795 data points for parts demand forecasting were composed.
6.3. Data Pre-Processing
The data used in the Predictive Maintenance module was pre-processed through data transformation, scaling, and normalization. In addition, in the case of data with potential security problems, confidential information leakage can be prevented through de-identification processing and transformation.
For the RUL prediction of the NASA turbofan engine, the maximum possible cycle (time) value per engine and for 24 sensor values were set as variables. Among the 25 variables (the maximum possible cycle and 24 sensor values), Principal Component Analysis (PCA) and Linear Discriminant Analysis (LDA), which are data dimension reduction methods, were used to extract the variables that significantly affect RUL. Input variable selection using PCA is a method of converting high-dimensional data, such as images, into low-dimensional data, and is used to reduce noise while minimizing data loss [
72]. LDA is an ML algorithm that projects data points so that data belonging to different classes can be classified linearly, and it is used for classification and dimensionality reduction [
72]. For the turbofan engine data, both of these methods were applied to determine the variable that has the most significant influence on the target variable, RUL.
For both the turbofan engine and the wastewater treatment pump data of the Predictive Maintenance module, scaling was performed to adjust the properties distributed in different ranges and sizes between the data to be distributed in a certain range. Standard Scaling, Min-Max Scaling, Max Abs Scaling, and Robust Scaling were applied to the scale. A Random Forest algorithm was applied to evaluate the performance of the original data and the data refined by the five scaling techniques. As a result of various scaling performance analyses of the turbofan engine data, 30% of the RMSE value was shown in the original dataset scaled with the Standard Scaler, which showed the highest performance.
6.4. Predictive Maintenance Modelling
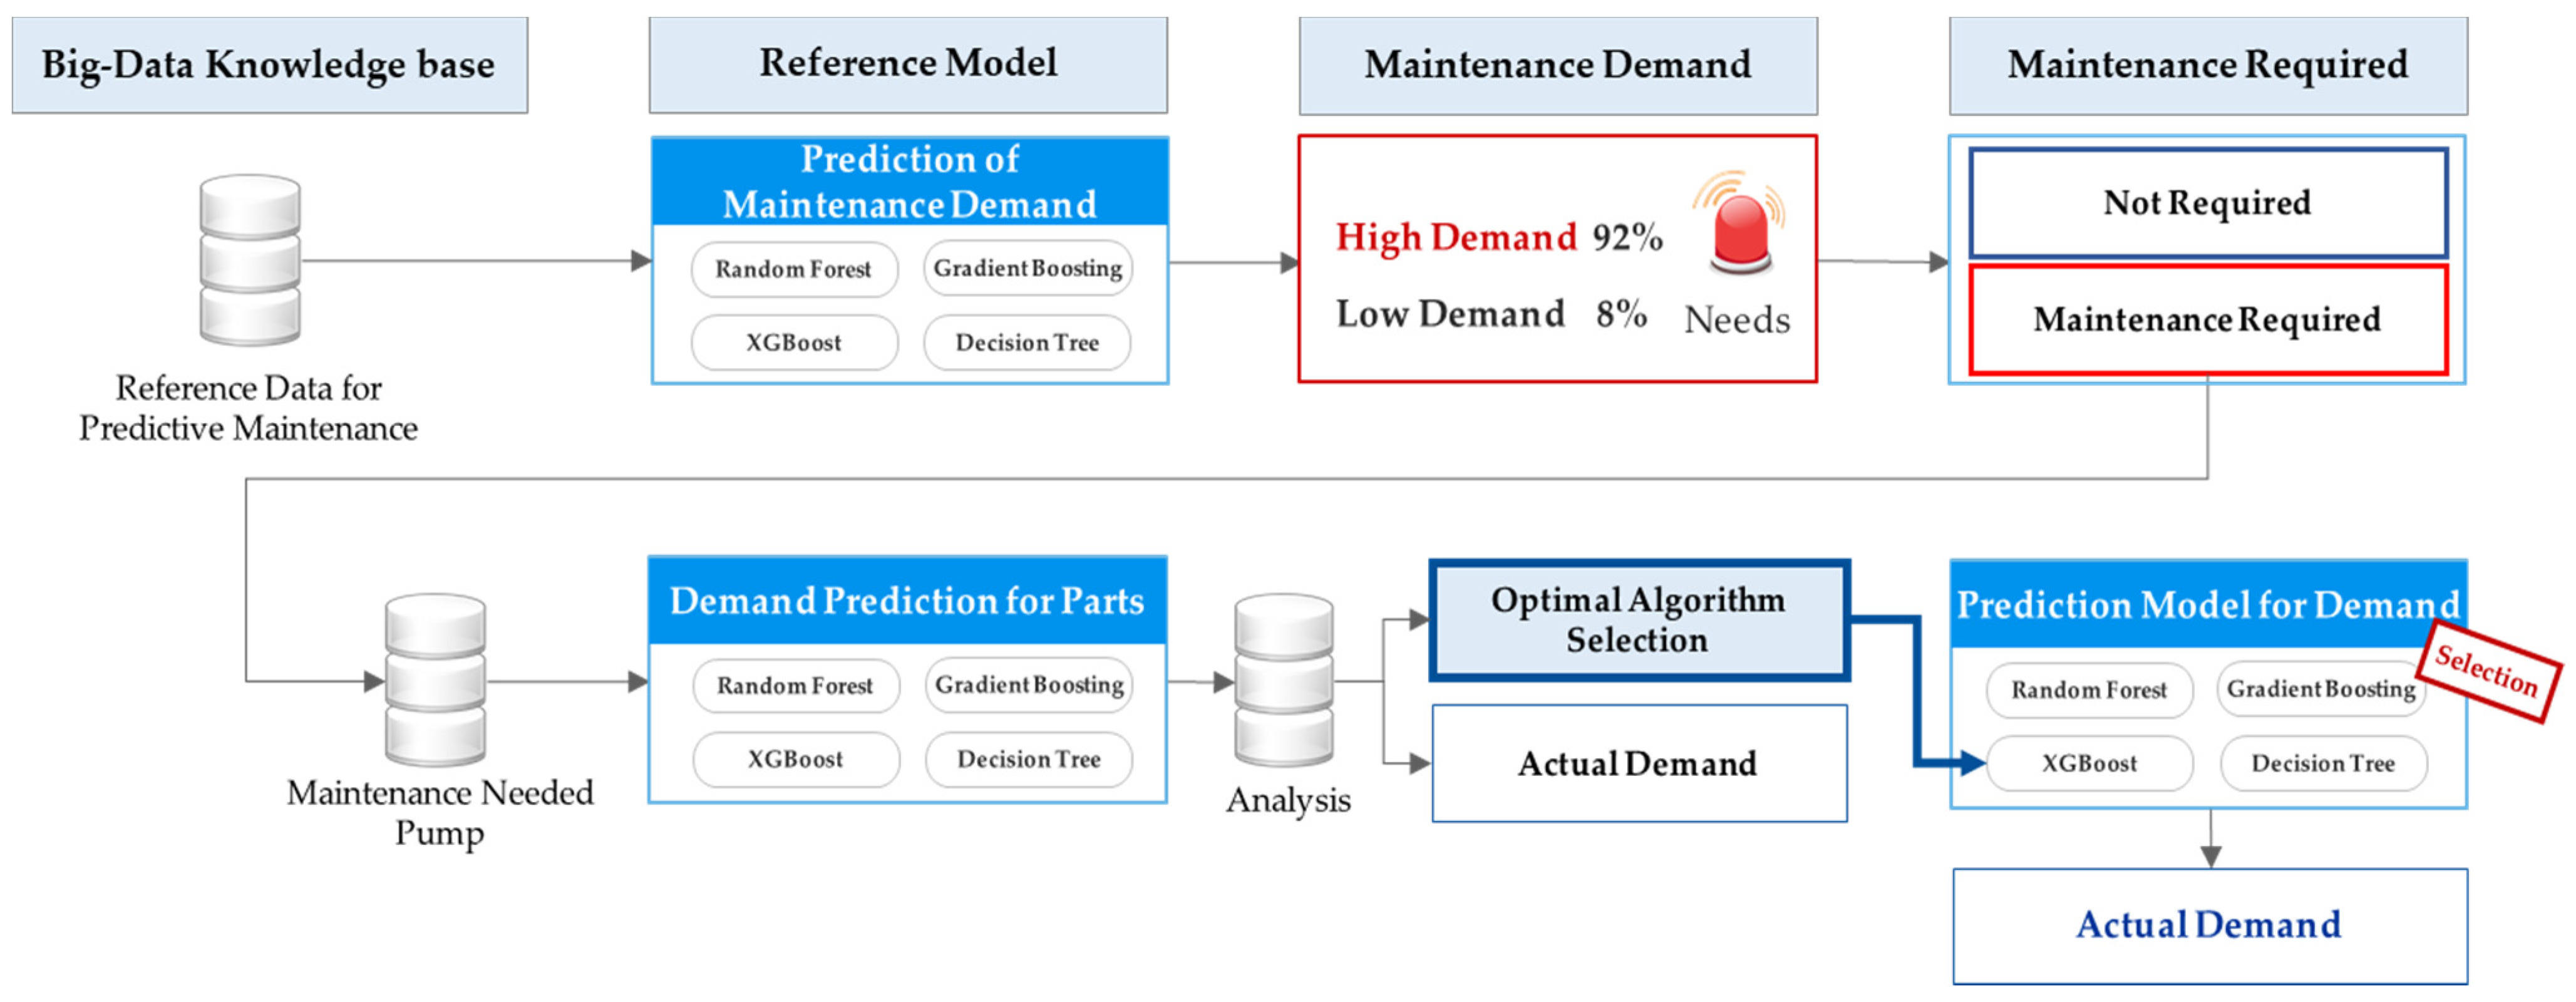
The RUL prediction of the turbofan engines, the pump maintenance demand prediction of the wastewater treatment facility, and the pump parts demand prediction were generated by applying regression algorithms (Decision Tree, Random Forest, Gradient Boosting, and XGBoost).
Figure 10, below, shows the analysis process for the prediction of the pump maintenance cycle and parts demand forecasting for wastewater treatment facilities.
6.5. Validation for the Predictive Mainetenance Module
The raw data used for training in the
Predictive Maintenance module numbered 20,631, and the original dataset scaled by the standard scaler was applied to the analysis. In ML, the datasets were divided into the training and the testing datasets in order to avoid overfitting, and to evaluate the models after eliminating bias from the datasets [
73]. In general, 20% of the original data were allocated to the test dataset [
73]. Because the turbo fan engine dataset was time series data, there was a possibility of bias when using the fraction of the data at a specific point in time for the test [
73]. In order to avoid containing this bias, the 100 data samples provided by NASA were used as a testing set instead of setting a new dataset by separating a part from the original dataset [
70].
Both the data for the prediction of the pump maintenance demand of the waste maintenance facility and the data for the prediction of the parts demand were divided into the training data and the evaluation data at a ratio of 80:20, and a performance test was performed after the model training. All of the data were applied to the test after scaling with a standard scaler.
The performance evaluation of a regression model, such as the RUL prediction of a turbofan engine, was tested by setting the Root Mean Square Error (RMSE) as an evaluation index. The RMSE is one of the most frequently applied indicators in regression model evaluation, and it is used as a measure to evaluate the difference between the actual value and the predicted value [
74]. The closer the RMSE value is to 0, the better the model is evaluated, as given by Equation (5):
The RUL prediction of the turbofan engines aims to predict the maintenance pattern and cycle by predicting the engine that will fail within 30 cycles among 100 engines (units). As a result of the evaluation of the performance of the RUL prediction model of the turbofan engine using RMSE as an evaluation index, XGBoost was evaluated as the best performing model, with an error rate of 20.78.
In order to verify the prediction accuracy of the model to which the XGBoost of the lowest RMSE value is applied, the accuracy of the Confusion Matrix was selected as an evaluation index and further tested. Accuracy, in this study, is a calculation of the ratio of the number of actual maintenance items adopted and the number of maintenance items detected, i.e., (Equation (6)).
The testing of the prediction accuracy of the turbofan engine failure by applying the XGBoost model, which has the best performance in RUL prediction, showed Precision 89.5%, Recall 68.0%, F-measure 77.3%, and Accuracy 90.1%. It can be analyzed that the prediction model applied with the XGBoost algorithm shows about 90% prediction accuracy for turbofan engine failure.
The maintenance demand prediction and parts demand prediction model of the wastewater treatment facility pump was created by applying the Decision Tree, Random Forest, Gradient Boosting, and XGBoost algorithms. The performance tests were performed by selecting Accuracy as an evaluation index. As a result of the performance evaluation, the XGBoost model was found to have the best predictive rate, with an F-measure value of 91.1% and an Accuracy of 83.9%.
Table 14 shows the performance test results for each predictive model for the predictive maintenance of the pump. In the
Predictive Maintenance module, the RUL prediction of the turbofan engine, maintenance demand prediction of wastewater treatment facility pump, and parts demand prediction were all analyzed to find the best performance of the prediction model applied with XGBoost.
7. Application Systems on the Cloud Service Platform
This chapter describes the system implementation of the framework proposed in this study.
EMAP is a cloud-based engineering data analysis system that integrates ML platforms and decision support systems to provide for its users. In order to implement
EMAP as an integrated analysis support system, cloud computing, development S/W, and system linkage are key. The integrated analysis system requires a variety of various S/W. Various S/Ws, such as text analysis tools for text analysis, a Web Application Server (WAS), an engineering ML platform, a decision support system, and a data open system, etc., have been developed and integrated. WAS is a combination of a web server and a web container, and the web container creates a result through an internal program when there is a client’s request, and then returns it to the client [
75]. In this study, Tomcat, which can implement open-source software for Java Servlet and Java Server Pages technologies, was applied [
76]. As
EMAP’s ML automation platform provides an engineering reference model, it has the advantage of being able to obtain predictive values without going through the separate code work required for ML analysis by simply inputting the data in a specific format. In other words, the tasks previously performed by data analysts can be performed at once through the integrated analysis support system. The decision support system was built based on the ML algorithm provided by the engineering ML platform. The five main modules of the decision support system were developed using the Python programming language. Python is one of the most widely used object-oriented programming languages; it has many features, such as easy parsing when implementing NLP, which can be easily read and understood by others, and is highly extensible [
77]. The integrated analysis system was developed using HTML, a Cascading Style Sheet (CSS), and JavaScript.
User convenience, which is an advantage of
EMAP, comes from cloud computing technology. The cloud computing in this study was built by a cloud specialist. The cloud specialists provided the infrastructure for cloud services such as cloud storage and basic security. The analysis process of the decision support technology was serviced by a cloud built by a cloud specialist. The system-to-system linkage used an Application Programming Interface (API). “API” refers to an interface made to control the functions provided by an operating system or programming language so that it can be used by an application program [
78]. It mainly provides interfaces for file control, window control, image processing, text control, and the like. When the data is linked, data is exchanged in JSON format.
The intelligent decision support system, which is the core of EMAP, consists of five main modules: (M1) ITB Analysis, (M2) Design Cost Estimation, (M3) Design Error Check, (M4) Change Order Forecast, and (M5) Equipment Predictive Maintenance. When a user inputs data, such as ITB or design data, the analysis results from these five modules are displayed. The user management screen and UI were designed, and the analysis results, such as design errors and design changes, were expressed in charts or graphs to visualize the results quickly and intuitively. The analysis results of each module can be downloaded in a specific standardized format, such as a CSV or an Excel file.
8. Conclusions and Future Works
8.1. Conclusions
This study was conducted in order to predict the risk of EPC projects and support decision-making by using ML technology. A cloud-based Engineering Machine-learning Automation Platform (EMAP) was developed as the outcome of this study. The EMAP developed through this study has the following characteristics. First, it is an intelligent decision support system intended to respond to risks by extracting risk clauses at each stage of an EPC project and predicting the resulting risks. Second, it is a big-data knowledge base that utilizes the data generated throughout the entire project cycle, including bidding, engineering, construction, and OM. Third, it is an ML platform developed by applying various algorithms and techniques of artificial intelligence, such as ML, deep learning, and NLP. Fourth, a cloud-based integrated platform was developed so that the users could easily access the five modules through EMAP. The decision support system is the core of EMAP, and it consists of five main modules: ITB Analysis, Design Cost Estimation, Design Error Check, Change Order Forecast, and Equipment Predictive Maintenance. The ITB Analysis module applied NLP techniques, such as syntactic and semantic analysis, NER, and PhraseMatcher, to extract the risk clauses from the bidding documents and analyze the risk impact. The Design Cost Estimation module predicts the design cost by analyzing the engineer’s M-H by applying the ML prediction algorithm. The Design Error Check module detects the data associated with design errors by the ML algorithm, and then predicts possible design errors for each type of work and the impact on the schedule delay. The Change Order Forecast module analyzes the data causing the design changes, and predicts the impact on the cost overrun and schedule delay due to the design change using the ML algorithm. After analyzing the sensor data and maintenance data of the equipment, the Equipment Predictive Maintenance module predicts the equipment maintenance and parts demand through the ML model. Each major module is implemented using Python. In addition, in order to verify the model applied to each module, a performance test was performed through a case study.
As a result of the performance test for the risk clause extraction of the
ITB analysis module, the F-measure of the CRC submodule was 87.1%, indicating the highest risk extraction performance. The TF, Semantic Analysis, Design Parameter Comparison, and Technical Risk Extraction submodules yielded F-measures of 70.0, 86.8, 87.6, and 88.4%, respectively. Considering that most of the performance of NLP technology is at the 80% level, it shows improved performance compared to previous studies [
13]. In particular, compared to a previous study [
13] in which only 1.6% of the sentences were extracted, this study showed a higher extraction rate and accuracy, with a sentence extraction rate of 10% and an F-measure of 86.8%. As a result of the performance evaluation of the
Design Cost Estimation and
Equipment Predictive Maintenance modules to which the regression algorithm was applied, the Random Forest model for the
Design Cost Estimation module and the Gradient Boosting model for the
Equipment Predictive Maintenance module were evaluated to be the most optimal models. As a result of the performance test of the
Design Error Check and
Change Order Forecast module to which the classification algorithm was applied, the Random Forest model showed the highest detection accuracy compared to the other classification algorithms in both modules. If design errors or equipment maintenance can be detected by applying ML, higher usability can be expected, along with a faster response.
As a result of this study, it is expected to have practical functions, such as the improvement of management tasks through the risk response of EPC projects. The contributions of this study are as follows:
It improved convenience by integrating it into a single system, rather than an individual system for each EPC project stage.
It broke away from the existing risk management method centered on statistical analysis by using big data generated throughout the entire project cycle, such as the bidding, design, construction, and OM of EPC projects.
It presented a support model for preemptive response to future risks by identifying risks in each stage of the project in advance.
It improved user accessibility by developing a cloud-based integrated platform.
It implemented an automated ML platform that does not require the support of ML developers.
It contributed to the scalability of research in related fields through an ITB Analysis research attempt applying AI technology to the EPC project.
It reduced the time and workload through the preemptive review of contractual risks when analyzing large amounts of bidding documents.
It reinforced omission prevention and risk response functions when reviewing contracts and technical specifications.
It prevented errors and improved the work accuracy of the person in charge of the design through the systematic management of a project that depended only on the experience of engineers.
It contributed to the development of the engineering industry through the convergence of big data and AI technologies.
8.2. Limitations and Further Works
The limitations drawn from this study and the discussion points for further research in the future are as follows.
First, there are limitations in the sufficient data collection. This study is a big-data-based ML integration platform that targets the entire plant project cycle, and thus the data for the ML application is important. The collection of the data throughout the entire plant project phase was one of the most significant challenges in conducting the research. In particular, the contracts and cost data were difficult due to legal restrictions according to corporate confidentiality regulations. In addition, there was a limitation that all of the previously secured data could not be disclosed, as the security of the items that correspond to the project confidentiality of the data provider was required. In order to resolve this, the data provider and the researcher concluded upon a non-disclosure agreement (NDA) to solve the legal requirements.
Second, in the
ITB Analysis of this study, only unstructured data such as text were analyzed, excluding tables and drawings in the scope of the works. Although tables and drawings occupy a significant portion of the documents, the accuracy of table or drawing recognition is still insufficient in the existing analysis techniques [
79]. In the future, active research on the improvement of the accuracy of table or drawing recognition is needed. If various unstructured data —such as tables, drawings, images and videos—can be integrated and analyzed along with the text information, big data-driven research will be possible.
Third, the Design Analysis Package and Equipment Predictive Maintenance module (M2-M5) in this study do not include the life cycle cost analysis at each stage. It is difficult to generalize life cycle cost estimation processes because the maintenance frequencies and cost of each project are different, depending on the plant type. Furthermore, there are limitations due to data availability and confidentiality. However, if the cost data can be collected according to plant type in the future, research on system development that can estimate construction and maintenance costs throughout the project life cycle will be necessary.
Fourth, in order to develop an integrated engineering analysis system based on ML, this study established the concept and process for each of M1–M5, as well as the system architecture, and then developed the
EMAP system. In each module development process, a case study was performed by selecting a specific part of the engineering discipline as the PoC, but the size of the training dataset used for each module was limited due to the data availability. The analysis results of the
Design Analysis Package (M2-M4) and
Equipment Predictive Maintenance Module (M5) may not be directly applicable, depending on the plant type, except for M1, which was introduced in a separate paper [
41]. Therefore, it is limited to generalize the
EMAP system to all types of plant projects. Nevertheless, further studies are expected to be carried out to overcome the limitations, extend the compatibility by plant type, and enhance the generalization. It is also expected that the results of this study can be applied to EPC contractors in overseas countries other than South-Korea.


