
Formulation and Prioritization of Sustainable New Product Design in Smart Glasses Development


Abstract
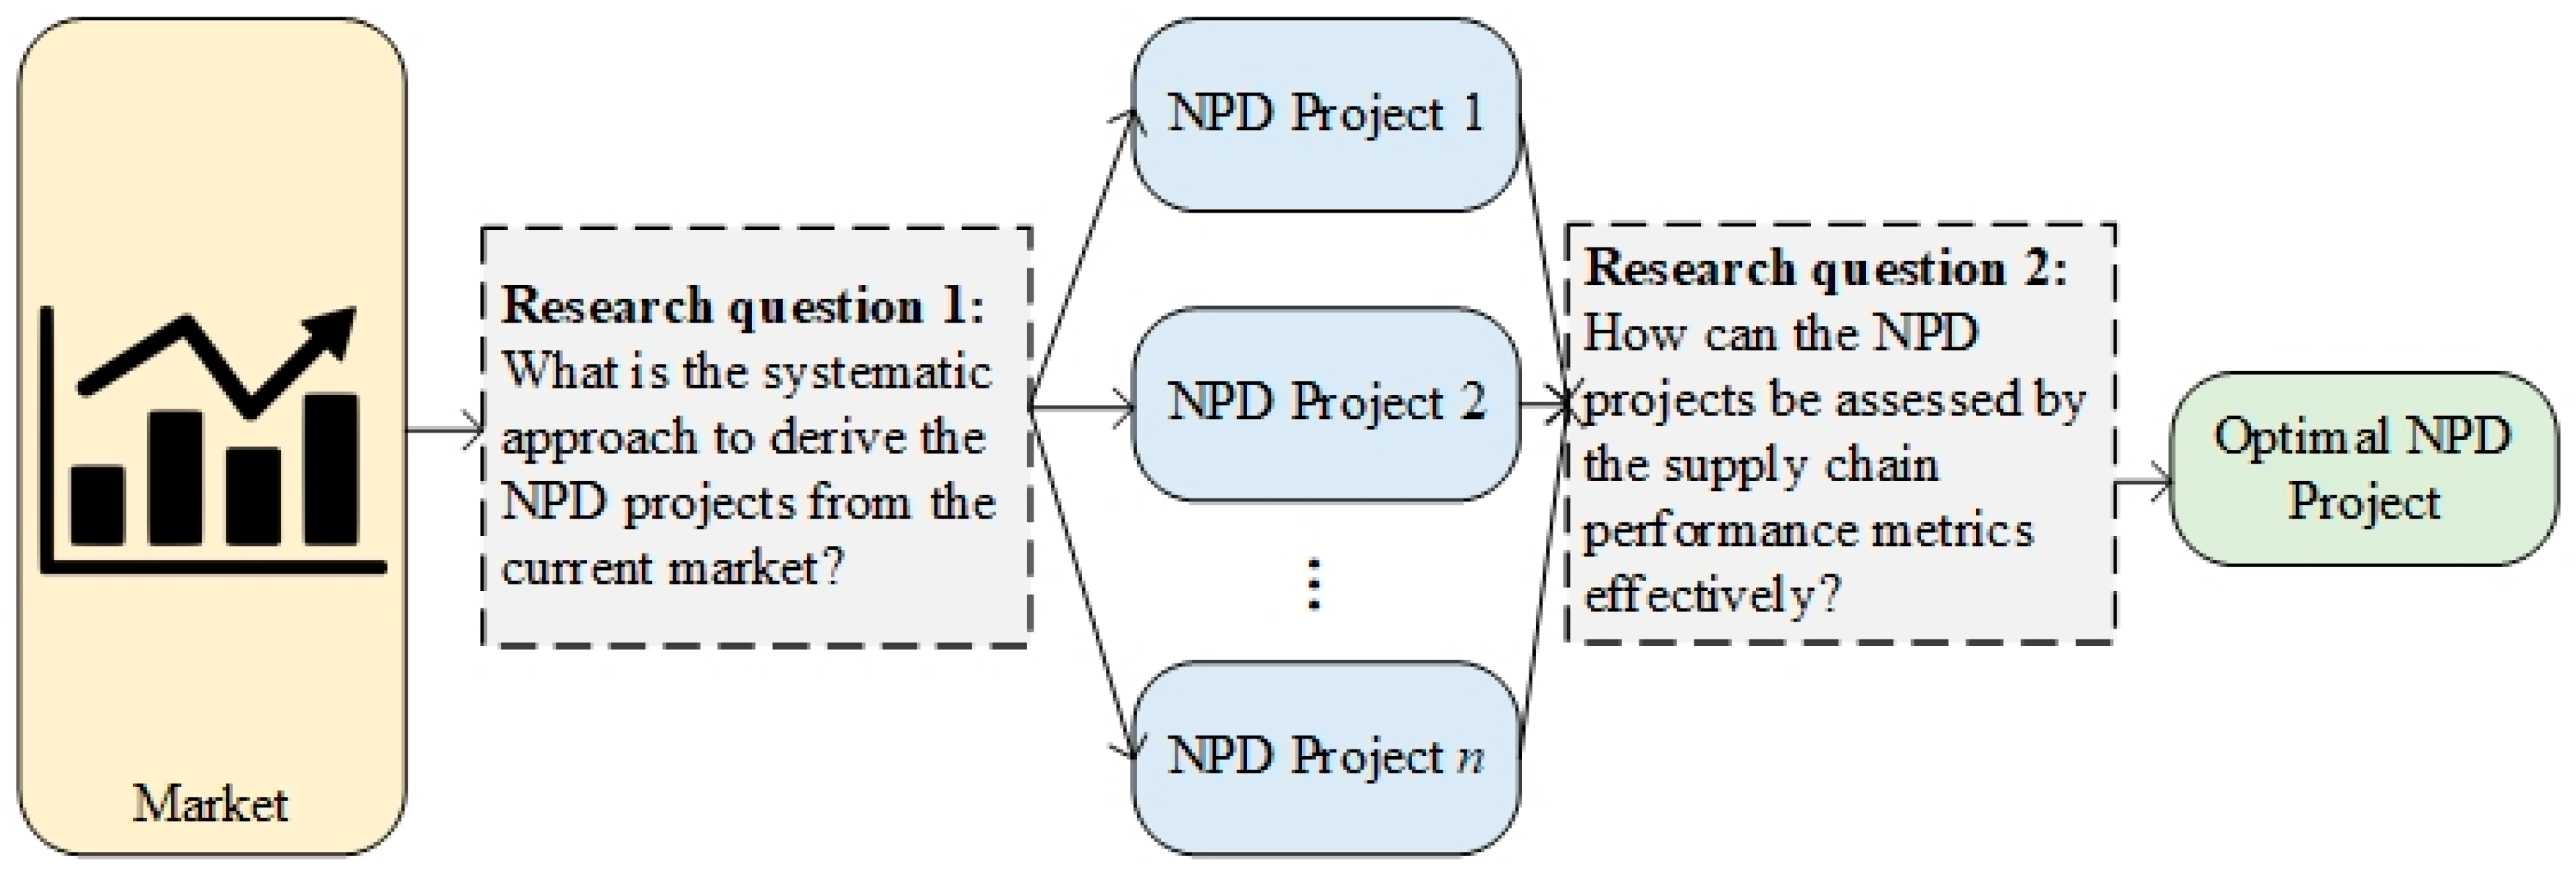
:1. Introduction
2. Literature Review
2.1. New Product Development and Project Portfolio Management
2.2. Multi-Criteria Decision-Making Approaches
2.3. Summary of the Literature Review
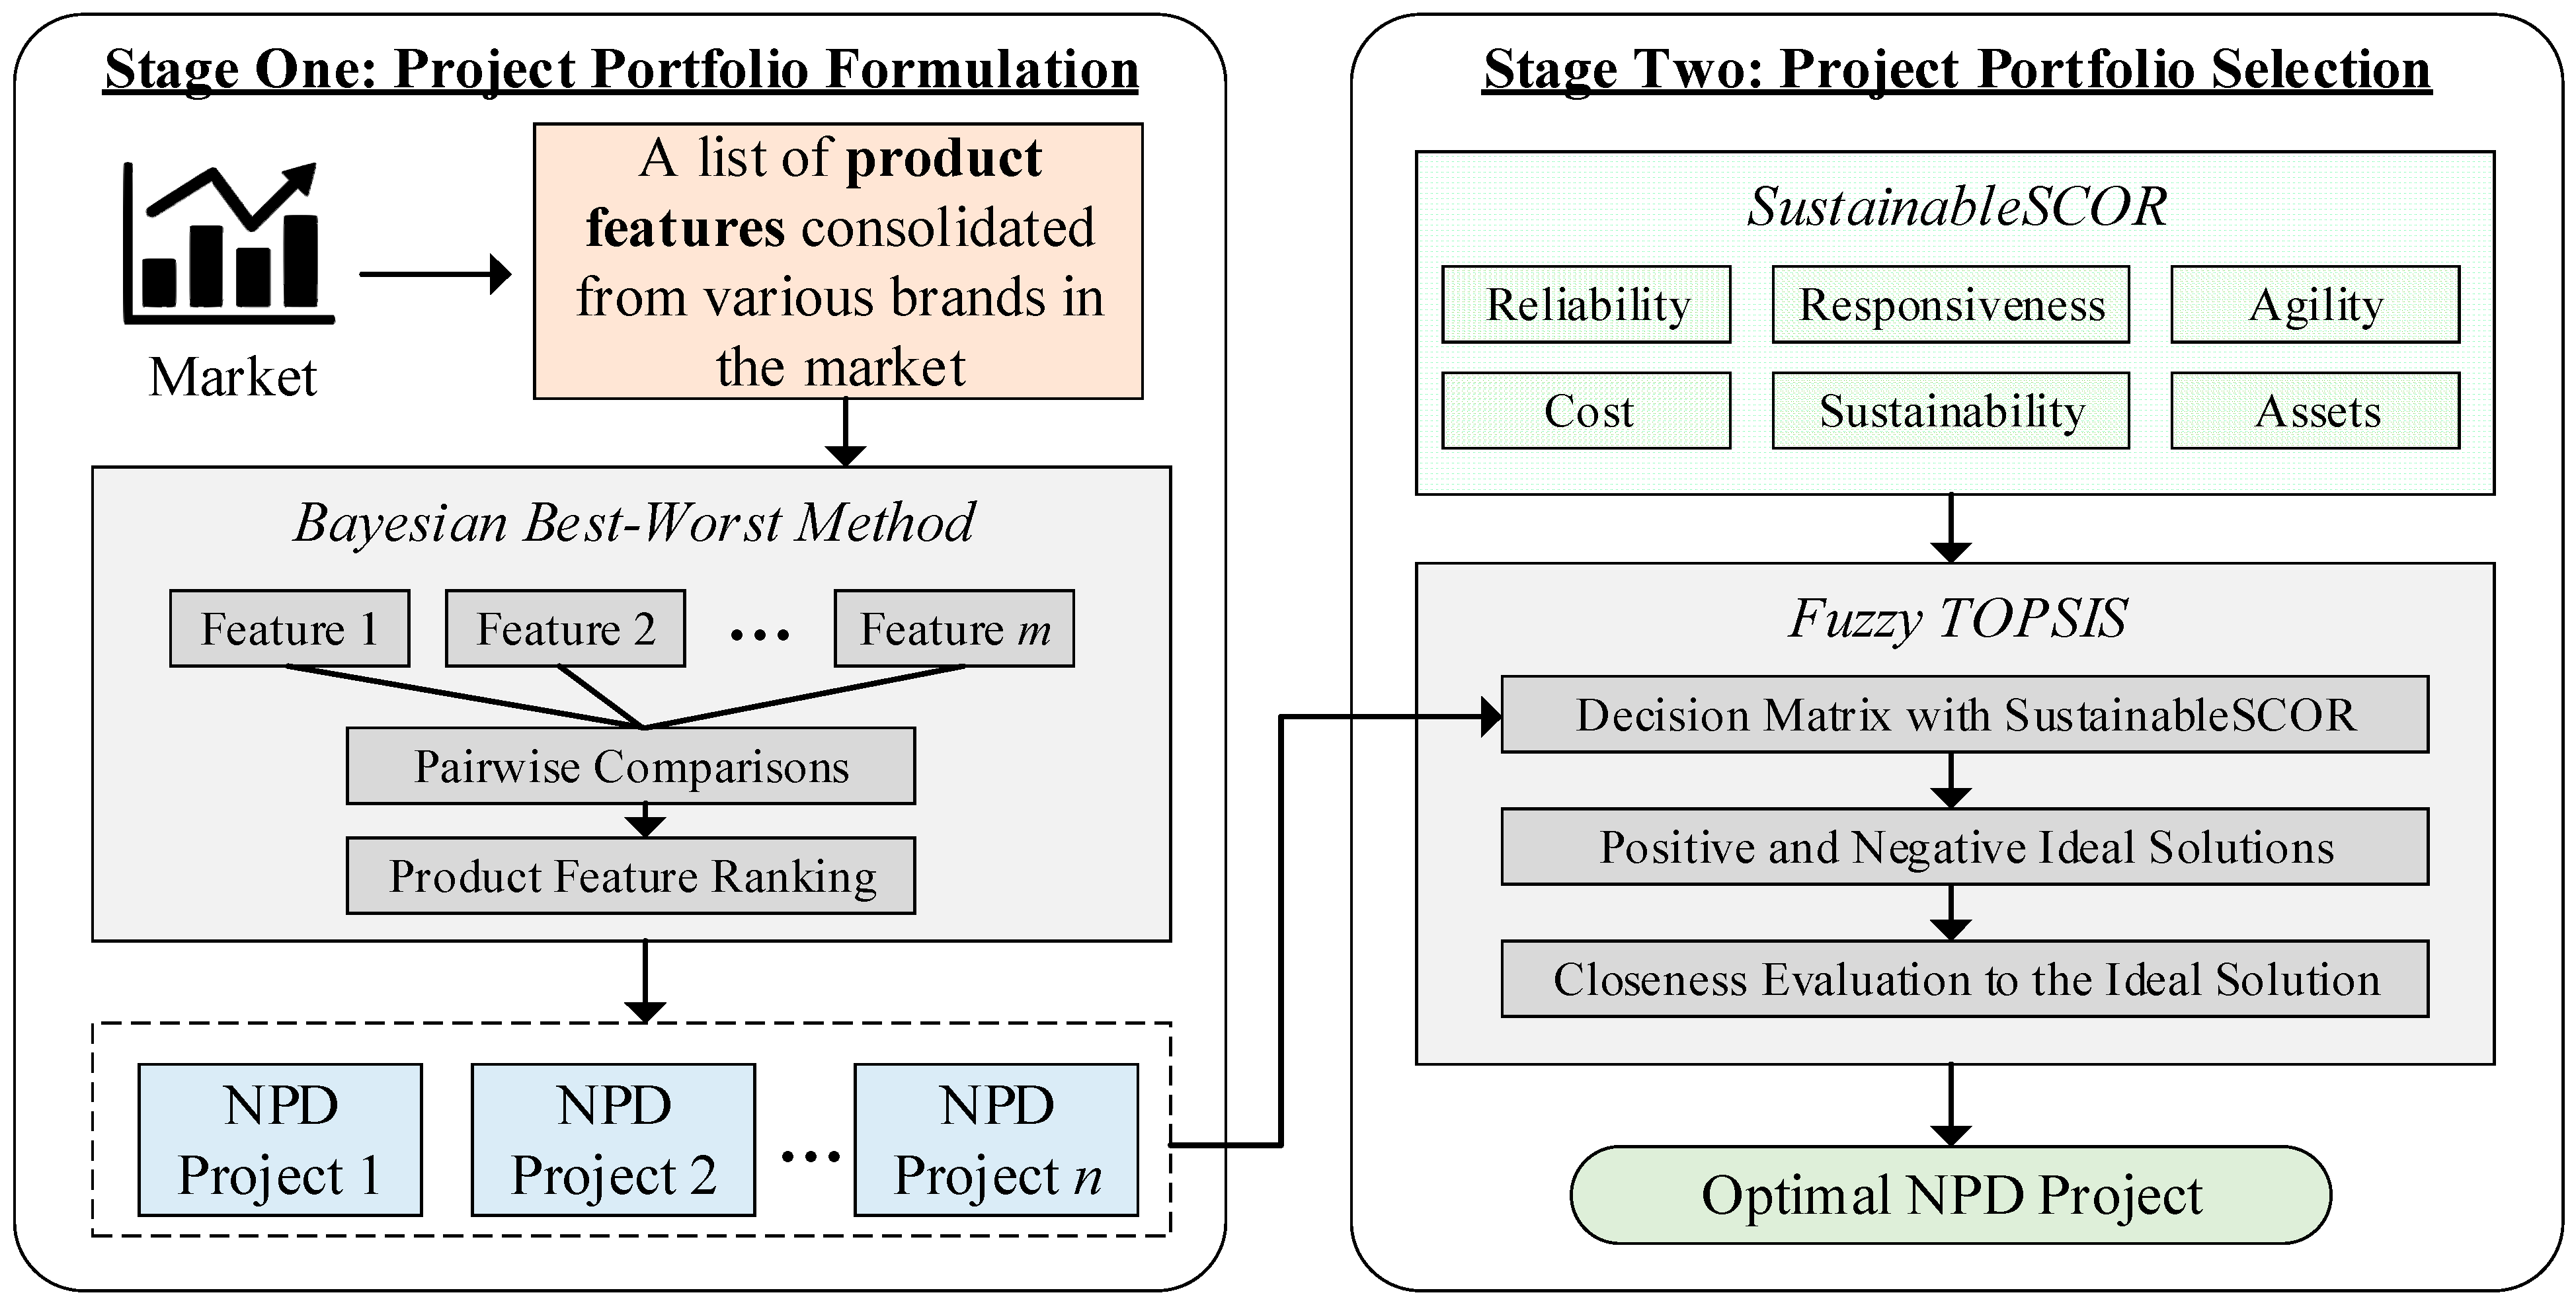
3. Methodology
3.1. Stage One: Project Portfolio Formulation
3.2. Stage Two: Project Portfolio Selection
4. Case Study
4.1. Overview of the Smart Glasses Market
4.2. Implementation and Data Collection of the Proposed Methodology for AR Smart Glassess
5. Results
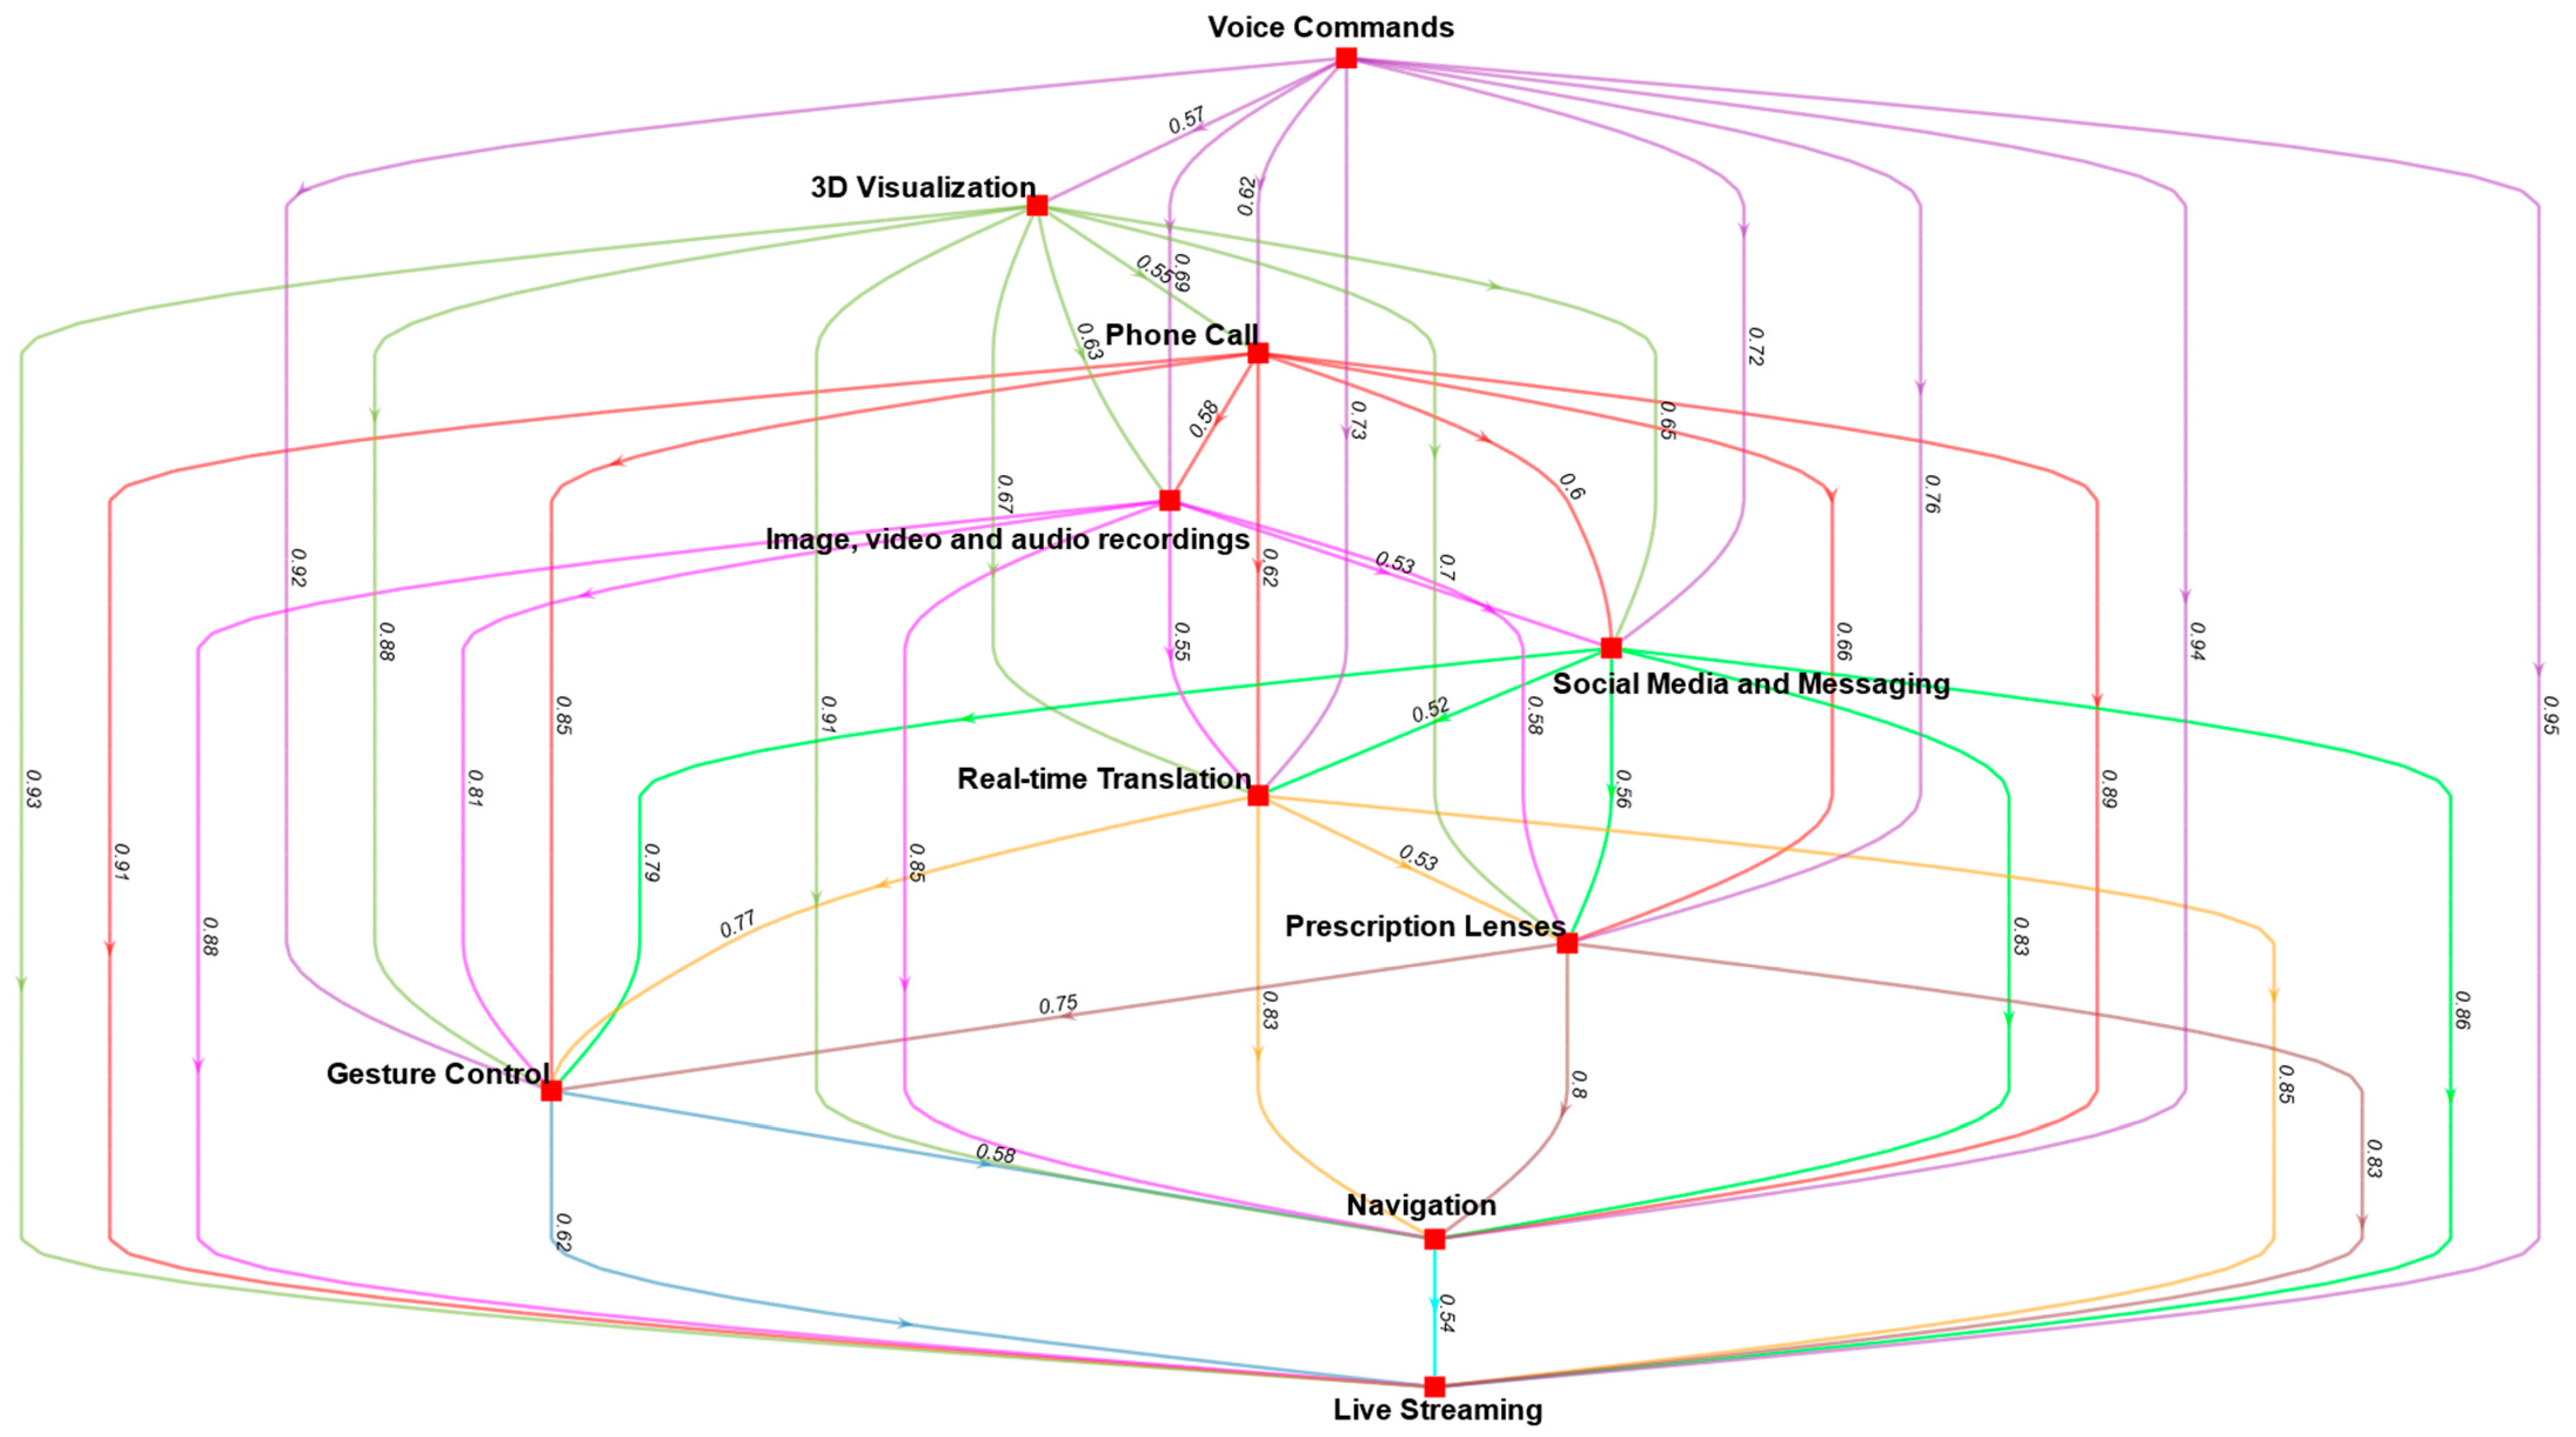
5.1. Feature Ranking and Project Formulation of AR Smart Glasses
- Navigation (F1): This provides routing directions in real time by obtaining position data. Smart glasses allow digital objects, such as traffic signals, to be augmented on the glasses.
- Phone Calling (F2): This allows users to contact someone via a telephone network.
- Social Media and Messaging (F3): This refers to social media websites and applications, such as Facebook, Instagram, and MeWe. These allow users to widely share their opinions and engage with the public. Messaging services, such as Whatsapp, Wechat, and Line, allow users to send texts or other formats of content with friends/relatives anywhere and anytime.
- Live Streaming (F4): This refers to online streaming applications that record and broadcast simultaneously in real time, such as Twitch and Instagram, such that an audience can be reached online.
- Real-time Translation (F5): Multilingual technology allows users to record audio or typed texts for translation into other languages to establish an efficient way of communicating with foreign-language speakers.
- Prescription Lenses (F6): These are developed for users who have varying degrees of short-sightedness, long-sightedness, and astigmatism. Customization services for users with prescription lenses are provided for smart glasses by optical professionals.
- Gesture Control (F7): Hand-tracking sensors are embedded to capture the user’s hand gestures and control the devices.
- Voice Commands (F8): This allows users to control the smart glasses using voice only, which is a hands-free mode. With the help of built-in virtual assistants, such as Alexa and Siri, voice commands can be given to order smart glasses to perform specific tasks.
- Image, video, and audio recordings (F9): Each smart glass component has an embedded camera, which allows users to capture images and videos, as well as to record audio for entertainment.
- 3D Visualization (F10): Smart glasses are equipped to visualize three-dimensional (3D) objects such that users can watch and modify 3D objects smoothly in the smart glasses’ environment.
5.2. NPD Project Portfolio Selection of AR Smart Glasses
6. Discussion
6.1. Discussion on Smart Product Innovation
6.2. Research and Industrial Implications
7. Conclusions
Author Contributions
Funding
Institutional Review Board Statement
Informed Consent Statement
Data Availability Statement
Acknowledgments
Conflicts of Interest
Appendix A

| Attribute | Description |
|---|---|
| Name | NPD 1 |
| Weight | Headset: ~88 g; computing unit: ~140 g; detachable controller: ~20 g |
| Camera | 5MP RGB camera SLAM camera |
| Optics | Birdbath |
| CPU | Qualcomm Snapdragon 845 |
| Display resolution | 1980 × 1020 |
| Storage | 128 GB |
| Video Playback | 1080 |
| OS | Android OS |
| RAM | 8 GB |
| Battery Capacity | 7100 mAh |
| Audio | Dual speakers Dual microphones |
| Field of View | 52 degrees |
| Degrees of Freedom (DoF) | Headset: 6DoF Controller: 3DoF |
| Connectivity | USB Type-C |
| Sensor | IMU 9-axis (accelerometer/gyroscope) Ambient light sensor Proximity sensor |
| Attribute | Description |
|---|---|
| Name | NPD 2 |
| Weight | ~98 g |
| Camera | 5MP RGB camera 5MP IR detector camera |
| Optics | LCoS optical engine |
| Display resolution | 1280 × 720 with dual see-through display |
| Video Playback | 1080 |
| Audio | Built-in stereo speaker Built-in microphone |
| Field of View (FOV) | 45 degrees |
| Connectivity | USB-C (DisplayPort) |
| Sensor | 3-axis gyroscope 3-axis accelerometer 3-axis magnetometer |
| Attribute | Description |
|---|---|
| Name | NPD 3 |
| Weight | ~80 g |
| Camera | 8MP RGB camera |
| Optics | Waveguide |
| CPU | Qualcomm Snapdragon 870 |
| Display resolution | 1920 × 1080 |
| Storage | 128 GB |
| Video Playback | 1080 |
| OS | iOS and Android |
| RAM | 8 GB |
| Battery Capacity | 8000 mAh |
| Audio | Microphones |
| Field of View | 90 degrees |
| Degrees of Freedom (DoF) | 6DoF |
| Connectivity | USB Type-C |
| Sensor | IMU 9-axis (accelerometer/magnetometer/gyroscope) Ambient light sensor Proximity sensor |
| Attribute | Description |
|---|---|
| Name | NPD 4 |
| Weight | ~500 g |
| Camera | 8MP camera and eye tracking |
| Optics | Waveguide |
| CPU | Qualcomm Snapdragon 850 |
| Display resolution | 2048 × 1080; 3D visualization |
| Storage | 64 GB |
| OS | Android |
| Battery | 3 h of active use |
| Audio | Microphones |
| Field of View | 90 degrees |
| Degrees of Freedom (DoF) | 6DoF |
| Connectivity | WIFI, Bluetooth |
| Sensor | Accelerometer, gyroscope, magnetometer Head tracking with cameras |
| Attribute | Description |
|---|---|
| Name | NPD 5 |
| Weight | ~40 g |
| Camera | / |
| Optics | Anti-blue light lenses |
| CPU | / |
| Display resolution | / |
| Storage | / |
| OS | iOS/Android |
| Battery | 3 h of active use |
| Audio | Whisper Audio with multi-microphones |
| Field of View | / |
| Degrees of Freedom (DoF) | / |
| Connectivity | Bluetooth 5.0 BLE |
| Sensor | 9-axis full motion sensors |
References
- Dou, R.L.; Li, W.; Nan, G.F. An integrated approach for dynamic customer requirement identification for product development. Enterp. Inf. Syst. 2019, 13, 448–466. [Google Scholar] [CrossRef]
- 10 Recent Product Design Failures and What We Can Learn from Them. Available online: https://www.forbes.com/sites/blakemorgan/2019/09/09/10-recent-product-design-failures-and-what-we-can-learn-from-them/?sh=6763f81e46f1 (accessed on 14 December 2020).
- How & Why Google Glass Failed. Available online: https://www.investopedia.com/articles/investing/052115/how-why-google-glass-failed.asp (accessed on 7 April 2021).
- Jeff Bezos to Exec after Product Totally Flopped: ‘You Can’t, for One Minute, FEEL BAD’. Available online: https://www.cnbc.com/2020/05/22/jeff-bezos-why-you-cant-feel-bad-about-failure.html (accessed on 7 April 2021).
- Facebook Home Is a Flop: Employees Know It and Users Don’t Like It. Available online: https://www.businessinsider.com/facebook-home-is-a-flop-2013-5 (accessed on 7 April 2021).
- Schiffels, S.; Fliedner, T.; Kolisch, R. Human behavior in project portfolio selection: Insights from an experimental study. Decis. Sci. 2018, 49, 1061–1087. [Google Scholar] [CrossRef]
- Ma, J.; Harstvedt, J.D.; Jaradat, R.; Smith, B. Sustainability driven multi-criteria project portfolio selection under uncertain decision-making environment. Comput. Ind. Eng. 2020, 140, 106236. [Google Scholar] [CrossRef]
- Elsbach, K.D.; Stigliani, I. Design thinking and organizational culture: A review and framework for future research. J. Manag. 2018, 44, 2274–2306. [Google Scholar] [CrossRef] [Green Version]
- Fargnoli, M.; Sakao, T. Uncovering differences and similarities among quality function deployment-based methods in Design for X: Benchmarking in different domains. Qual. Eng. 2017, 29, 690–712. [Google Scholar] [CrossRef]
- Rihar, L.; Kušar, J. Implementing Concurrent Engineering and QFD Method to Achieve Realization of Sustainable Project. Sustainability 2021, 13, 1091. [Google Scholar] [CrossRef]
- Salonitis, K. Design for additive manufacturing based on the axiomatic design method. Int. J. Adv. Manuf. Technol. 2016, 87, 989–996. [Google Scholar] [CrossRef]
- Chakraborty, K.; Mondal, S.; Mukherjee, K. Analysis of product design characteristics for remanufacturing using Fuzzy AHP and Axiomatic Design. J. Eng. Des. 2017, 28, 338–368. [Google Scholar] [CrossRef]
- Tsang, Y.P.; Wu, C.H.; Lin, K.Y.; Tse, Y.K.; Ho, G.T.S.; Lee, C.K.M. Unlocking the power of big data analytics in new product development: An intelligent product design framework in the furniture industry. J. Manuf. Syst. 2021. [Google Scholar] [CrossRef]
- Zhang, M.; Zeng, W.; Tse, Y.K.; Wang, Y.; Smart, P. Examining the antecedents and consequences of green product innovation. Ind. Mark. Manag. 2021, 93, 413–427. [Google Scholar] [CrossRef]
- Li, S.M.; Chan, F.T.S.; Tsang, Y.P.; Lam, H.Y. New Product Idea Selection in the Fuzzy Front End of Innovation: A Fuzzy Best-Worst Method and Group Decision-Making Process. Mathematics 2021, 9, 337. [Google Scholar] [CrossRef]
- Costantino, F.; Di Gravio, G.; Nonino, F. Project selection in project portfolio management: An artificial neural network model based on critical success factors. Int. J. Proj. Manag. 2015, 33, 1744–1754. [Google Scholar] [CrossRef]
- Wang, X.-Y.; Li, G.; Tu, J.-F.; Khuyen, N.T.T.; Chang, C.-Y. Sustainable Education Using New Communication Technology: Assessment with Analytical Hierarchy Process (AHP). Sustainability 2021, 13, 9640. [Google Scholar] [CrossRef]
- Rezaei, J. Best-worst multi-criteria decision-making method. Omega-Int. J. Manag. Sci. 2015, 53, 49–57. [Google Scholar] [CrossRef]
- Peng, C.; Feng, D.; Guo, S. Material Selection in Green Design: A Method Combining DEA and TOPSIS. Sustainability 2021, 13, 5497. [Google Scholar] [CrossRef]
- Mohammadi, M.; Rezaei, J. Bayesian best-worst method: A probabilistic group decision making model. Omega-Int. J. Manag. Sci. 2020, 96, 102075. [Google Scholar] [CrossRef]
- Palczewski, K.; Sałabun, W. The fuzzy TOPSIS applications in the last decade. Procedia Comput. Sci. 2019, 159, 2294–2303. [Google Scholar] [CrossRef]
- Daghfous, A.; Zoubi, T. An Auditing Framework for Knowledge-Enabled Supply Chain Management: Implications for Sustainability. Sustainability 2017, 9, 791. [Google Scholar] [CrossRef] [Green Version]
- Rauschnabel, P.A.; Brem, A.; Ivens, B.S. Who will buy smart glasses? Empirical results of two pre-market-entry studies on the role of personality in individual awareness and intended adoption of Google Glass wearables. Comput. Hum. Behav. 2015, 49, 635–647. [Google Scholar] [CrossRef]
- Schütze, S.; Irwin-Schütze, A. New Realities in Audio: A Practical Guide for VR, AR, MR and 360 Video; CRC Press: Boca Raton, FL, USA, 2018. [Google Scholar]
- Cipresso, P.; Giglioli, I.A.C.; Raya, M.A.; Riva, G. The past, present, and future of virtual and augmented reality research: A network and cluster analysis of the literature. Front. Psychol. 2018, 9, 2086. [Google Scholar] [CrossRef] [Green Version]
- Wolfartsberger, J. Analyzing the potential of Virtual Reality for engineering design review. Autom. Constr. 2019, 104, 27–37. [Google Scholar] [CrossRef]
- Wiederhold, B.K.; Miller, I.T.; Wiederhold, M.D. Using virtual reality to mobilize health care: Mobile virtual reality technology for attenuation of anxiety and pain. IEEE Consum. Electron. Mag. 2017, 7, 106–109. [Google Scholar] [CrossRef]
- Hu-Au, E.; Lee, J.J. Virtual reality in education: A tool for learning in the experience age. Int. J. Innov. Educ. Bus. 2017, 4, 215–226. [Google Scholar] [CrossRef] [Green Version]
- Industry 5.0. Available online: https://ec.europa.eu/info/research-and-innovation/research-area/industrial-research-and-innovation/industry-50_en (accessed on 30 July 2021).
- Electronic Waste Generated Worldwide from 2010 to 2019 (in Million Metric Tons). Available online: https://www.statista.com/statistics/499891/projection-ewaste-generation-worldwide/ (accessed on 8 September 2021).
- Abalansa, S.; El Mahrad, B.; Icely, J.; Newton, A. Electronic Waste, an Environmental Problem Exported to Developing Countries: The GOOD, the BAD and the UGLY. Sustainability 2021, 13, 5302. [Google Scholar] [CrossRef]


| Dimension | Description | Metrics to Be Considered |
|---|---|---|
| Reliability | The degree of yielding consistent supply chain performance to satisfy the market demand. |
|
| Responsiveness | The degree of responding purposefully to requests and changes in the market. |
|
| Agility | The degree of adjusting supply chain tactics and operations to address demand volatility. |
|
| Cost | The degree of capital resources used in investment, transportation, procurement, production, and inventory. |
|
| Assets | The degree of asset utilization in supply chain activities and asset liquidity for companies. |
|
| Sustainability | The degree of environmental, social, and economic impacts throughout the whole product lifecycle. |
|
| Linguistic Terms (Label) | Triangular Fuzzy Number |
|---|---|
| Very Low (VL) | (1, 1, 3) |
| Low (L) | (1, 3, 5) |
| Average (A) | (3, 5, 7) |
| High (H) | (5, 7, 9) |
| Very High (H) | (7, 9, 9) |
| # | Gender | Age | Post Title | Work Duration in the Case Company (Years) |
|---|---|---|---|---|
| D1 | Male | 36–45 | Operation Director | 6 |
| D2 | Male | 36–45 | Product Development Engineer | 2 |
| D3 | Female | 36–45 | Project Manager | 0.2 |
| D4 | Male | 36–45 | Electric Engineering Manager | 3 |
| D5 | Male | 36–45 | Software Engineer | 4 |
| D6 | Male | 36–45 | Product Development Engineer | 4 |
| D7 | Female | 26–35 | Project Manager | 0.5 |
| D8 | Male | 36–45 | Supply Chain Specialist | 1.5 |
| D9 | Male | 26–35 | Product Structural Engineer | 2 |
| Brand | ||||||
|---|---|---|---|---|---|---|
| Features | A | B | C | D | E | F |
| Navigation (F1) | O | O | O | √ | √ | O |
| Phone Calling (F2) | O | O | O | √ | O | |
| Social Media and Messaging (F3) | O | O | O | √ | √ | O |
| Live Streaming (F4) | O | O | O | |||
| Real-time Translation (F5) | O | √ | O | |||
| Prescription Lenses (F6) | √ | √ | √ | √ | √ | √ |
| Gesture Control (F7) | O | O | ||||
| Voice Commands (F8) | O | O | O | √ | √ | O |
| Image, video and audio recordings (F9) | O | √ | √ | √ | O | |
| 3D Visualization (F10) | O | O | O | |||
| Features | ||||||||||
|---|---|---|---|---|---|---|---|---|---|---|
| F1 | F2 | F3 | F4 | F5 | F6 | F7 | F8 | F9 | ||
| Best-to-Others | D1 | 3 | 1 | 5 | 5 | 3 | 5 | 5 | 5 | 5 |
| D2 | 1 | 1 | 3 | 3 | 2 | 1 | 2 | 1 | 1 | |
| D3 | 7 | 7 | 6 | 5 | 5 | 9 | 5 | 8 | 6 | |
| D4 | 6 | 1 | 3 | 1 | 3 | 1 | 3 | 6 | 1 | |
| D5 | 3 | 4 | 2 | 5 | 1 | 9 | 6 | 1 | 7 | |
| D6 | 1 | 1 | 1 | 1 | 1 | 1 | 1 | 1 | 1 | |
| D7 | 1 | 3 | 3 | 3 | 3 | 3 | 3 | 3 | 3 | |
| D8 | 7 | 4 | 1 | 6 | 7 | 1 | 3 | 7 | 7 | |
| D9 | 4 | 1 | 2 | 6 | 6 | 1 | 6 | 4 | 2 | |
| Others-to-Worst | D1 | 9 | 9 | 7 | 5 | 7 | 7 | 1 | 7 | 7 |
| D2 | 1 | 1 | 2 | 1 | 2 | 9 | 3 | 9 | 2 | |
| D3 | 5 | 5 | 5 | 5 | 5 | 1 | 5 | 5 | 5 | |
| D4 | 1 | 9 | 7 | 9 | 7 | 9 | 9 | 9 | 9 | |
| D5 | 2 | 5 | 7 | 6 | 8 | 1 | 3 | 9 | 2 | |
| D6 | 1 | 3 | 3 | 3 | 2 | 3 | 5 | 5 | 9 | |
| D7 | 4 | 1 | 3 | 4 | 4 | 4 | 4 | 4 | 4 | |
| D8 | 7 | 7 | 4 | 4 | 7 | 7 | 1 | 7 | 7 | |
| D9 | 9 | 9 | 9 | 1 | 9 | 9 | 9 | 9 | 9 | |
| Dimensions in the SustainableSCOR Model | ||||||
|---|---|---|---|---|---|---|
| C1 | C2 | C3 | C4 | C5 | C6 | |
| D1 | (7, 9, 9) | (5, 7, 9) | (5, 7, 9) | (7, 9, 9) | (3, 5, 7) | (5, 7, 9) |
| D2 | (5, 7, 9) | (5, 7, 9) | (5, 7, 9) | (3, 5, 7) | (5, 7, 9) | (5, 7, 9) |
| D3 | (7, 9, 9) | (7, 9, 9) | (5, 7, 9) | (7, 9, 9) | (5, 7, 9) | (7, 9, 9) |
| D4 | (5, 7, 9) | (5, 7, 9) | (3, 5, 7) | (3, 5, 7) | (3, 5, 7) | (3, 5, 7) |
| D5 | (5, 7, 9) | (7, 9, 9) | (7, 9, 9) | (5, 7, 9) | (5, 7, 9) | (5, 7, 9) |
| D6 | (5, 7, 9) | (5, 7, 9) | (5, 7, 9) | (3, 5, 7) | (3, 5, 7) | (5, 7, 9) |
| D7 | (5, 7, 9) | (3, 5, 7) | (3, 5, 7) | (5, 7, 9) | (7, 9, 9) | (7, 9, 9) |
| D8 | (5, 7, 9) | (5, 7, 9) | (5, 7, 9) | (5, 7, 9) | (5, 7, 9) | (5, 7, 9) |
| D9 | (5, 7, 9) | (5, 7, 9) | (5, 7, 9) | (3, 5, 7) | (3, 5, 7) | (5, 7, 9) |
| Average | (5, 7.4, 9) | (3, 7.2, 9) | (3, 6.8, 9) | (3, 6.6, 9) | (3, 6.3, 9) | (3, 7.2, 9) |
| Dimensions in the SustainableSCOR Model | ||||||
|---|---|---|---|---|---|---|
| C1 | C2 | C3 | C4 | C5 | C6 | |
| NPD 1 | (3, 6.78, 9) | (3, 6.78, 9) | (3, 6.56, 9) | (3, 6.56, 9) | (3, 6.56, 9) | (3, 6.78, 9) |
| NPD 2 | (3, 7.22, 9) | (3, 7.22, 9) | (3, 7, 9) | (3, 6.78, 9) | (3, 7, 9) | (3, 7.44, 9) |
| NPD 3 | (3, 7.22, 9) | (3, 6.78, 9) | (3, 7, 9) | (3, 6.78, 9) | (3, 6.56, 9) | (3, 7.22, 9) |
| NPD 4 | (3, 7, 9) | (3, 7, 9) | (3, 7, 9) | (3, 6.33, 9) | (3, 6.78, 9) | (3, 7.22, 9) |
| NPD 5 | (1, 5.89, 9) | (1, 6.11, 9) | (1, 6.33, 9) | (1, 6.33, 9) | (1, 6.11, 9) | (1, 6.56, 9) |
| Rank | ||||
|---|---|---|---|---|
| NPD 1 | 2.36 | 2.49 | 0.5134 | 4 |
| NPD 2 | 1.16 | 3.16 | 0.7315 | 1 |
| NPD 3 | 1.66 | 2.83 | 0.6303 | 3 |
| NPD 4 | 1.55 | 2.93 | 0.6540 | 2 |
| NPD 5 | 3.14 | 1.16 | 0.2698 | 5 |
Publisher’s Note: MDPI stays neutral with regard to jurisdictional claims in published maps and institutional affiliations. |
© 2021 by the authors. Licensee MDPI, Basel, Switzerland. This article is an open access article distributed under the terms and conditions of the Creative Commons Attribution (CC BY) license (https://creativecommons.org/licenses/by/4.0/).
Share and Cite
Lee, C.-K.-M.; Lui, L.; Tsang, Y.-P. Formulation and Prioritization of Sustainable New Product Design in Smart Glasses Development. Sustainability 2021, 13, 10323. https://doi.org/10.3390/su131810323
Lee C-K-M, Lui L, Tsang Y-P. Formulation and Prioritization of Sustainable New Product Design in Smart Glasses Development. Sustainability. 2021; 13(18):10323. https://doi.org/10.3390/su131810323
Chicago/Turabian StyleLee, Carman-Ka-Man, Lucas Lui, and Yung-Po Tsang. 2021. "Formulation and Prioritization of Sustainable New Product Design in Smart Glasses Development" Sustainability 13, no. 18: 10323. https://doi.org/10.3390/su131810323
APA StyleLee, C.-K.-M., Lui, L., & Tsang, Y.-P. (2021). Formulation and Prioritization of Sustainable New Product Design in Smart Glasses Development. Sustainability, 13(18), 10323. https://doi.org/10.3390/su131810323