Article

Experimental Analysis of CO2 Concentration Changes in an Apartment Using a Residential Heat Recovery Ventilator

1
Korea Institute of Civil Engineering & Building Technology, 283 Goyangdae-ro, Ilsanseo-gu, Goyang-si 10223, Korea
2
Department of Architecture & Architectural Engineering, Yonsei University, Seoul 03772, Korea
*
Author to whom correspondence should be addressed.
Sustainability 2021, 13(18), 10302; https://doi.org/10.3390/su131810302
Submission received: 4 August 2021 / Revised: 7 September 2021 / Accepted: 13 September 2021 / Published: 15 September 2021
(This article belongs to the Collection Air Pollution Control and Sustainable Development)

Abstract

:
Korean law requires at least three levels of control for apartment ventilation systems, including 0.5 air change per hour (ACH). When this law was enacted, it was believed that a 0.5 ACH air flow rate would be sufficient for apartments following building completion. However, ventilation systems cause different air qualities in each space within a unit, depending on infiltration rate and number of occupants. In addition, the current ventilation rate standard is based on an apartment unit’s total area, assuming that all room doors are open. In this study, changes in CO2 concentration were experimentally analyzed based on the number of occupants and various ventilation frequencies with closed doors to analyze air quality differences among rooms in a typical 85 m2 apartment unit in Korea. When the 0.5 ACH ventilation was performed, maintaining 1000 ppm or less was difficult if four people stayed for more than two hours in the living room or two people stayed for more than one hour in the bedroom with closed doors. Our results indicate that it is challenging to maintain a CO2 concentration of 1000 ppm when doors are closed as standards are calculated based on a unit’s total area. Therefore, ventilation systems should be required to provide different air volumes for each room.

1. Introduction

According to the facility standard rules for buildings in Korea [1], housing ventilation systems must be able to provide a ventilation rate of at least 0.5 air change per hour (ACH). This corresponds to an air volume of approximately 100 m3/h for the national housing scale with an area of 85 m2 and ceiling height of 2.3 m, as defined in the Housing Law [2]. This air volume is similar to that calculated based on ASHRAE 62.2 [3]. Because the volume is based on all rooms in an apartment unit, it assumes that all room doors are open. However, when the room doors are closed, the appropriate ventilation rate can vary.
Although there are various methods to obtain the appropriate ventilation rate for maintaining indoor CO2 concentration requirement, 1000 ppm [4,5,6], it can be calculated using the difference between the CO2 concentration generated by the occupants and the external CO2 concentration. According to the climate change monitoring information provided by the Korean Meteorological Administration, the external CO2 concentration has been increasing since 1984 [7].
Applying the average CO2 concentration in Anmyeondo, Korea in December 2019 (421 ppm) [7] and the CO2 expiratory flow generated during the normal activities of one adult (18 L/h) [8], a ventilation rate of approximately 31 m3/h was calculated. This means that approximately 124 m3/h is required when a four-member family resides in an 85 m2 house. In addition, the 0.5 ACH ventilation rate of a bedroom with an area of 9 m2 [9] was calculated to be 10.4 m3/h. A typical small room in Korean housing where a single bed and a wardrobe are installed has an area of 9 m2 and a ceiling height of 2.3 m. This corresponds to 33.5% of 31 m3/h, which is the ventilation rate required per person for one hour. Although the results could vary depending on the room’s infiltration rate, the fact that CO2 concentrations ranging from 2000 to 3000 ppm have been discovered in field surveys of existing houses indicates that this issue is difficult to solve by only considering infiltration differences [10,11].
In many previous studies related to CO2 concentration control in residential buildings, various demand-controlled ventilation strategies were provided, and their results were analyzed through simulations [12,13,14,15,16]. Some studies presented control methods using CO2, humidity, and occupancy sensors, and compared them through simulations [12,13,14]. Other work presented control methods using CO2 and total volatile organic compounds sensors and compared them using a simulation [15]. There have also been studies that investigated control methods using only occupancy conditions and compared them to simulations [16,17]. Although various conditions can be analyzed using simulations, the results may differ from real-world situations.
In terms of field experiments, a study adjusted the ventilation rate in two steps by examining the presence of occupants using the difference between the indoor and outdoor CO2 concentrations [18]. Field experiments were performed for a typical four-member family house in Denmark, but the target house had a larger area (140 m2) than a typical house in Korea, and the standard ventilation rate applied in the experiment was also higher.
Mechanical ventilation systems installed in Korean apartments generally provide the same ACHs to all rooms in three steps. This is because Korean law requires at least three levels of control for mechanical ventilation system performance, including 0.5 ACH. When the law was enacted, it was believed that the risk of sick building syndrome would decrease following building completion. As such, at present the minimum ventilation level of 0.5 ACH is used as an intermediate step and a 20–100% smaller or larger air volume has been provided for the three-step control. However, it is challenging to determine whether an appropriate air volume is provided in each situation [19]. Therefore, such systems are highly likely to result in different air qualities within each space, depending on the infiltration rate and/or the number of occupants.
In this study, the CO2 concentration was experimentally analyzed based on the number of occupants and various ventilation rates to analyze the differences among the rooms in an actual 84 m2 apartment unit, which is the typical apartment size in Korea. In addition, case studies were conducted to investigate the effectiveness of apartment ventilation systems.

2. Materials and Methods

2.1. Experimental Sequence

An analysis was conducted in the following sequence to examine the CO2 concentrations in 85 m2 apartment units and the degree of CO2 removal was assessed based on ventilation frequency.
Step 1: Analysis of residence time for each room
According to a 2019 survey conducted by Statistics Korea [20], a four-member family generally resides in an 85 m2 house. Thus, in this study, the number of residents in the target house was assumed to be four, including a couple and two adult children, and the residence time for each room was analyzed thoroughly.
Step 2: Experimental analysis of the infiltration rate in each room
Because the infiltration rate affects the change in CO2 concentration, the infiltration rate of each room in the target house was measured using the method proposed by KS F 2603 [21], when room doors were closed.
Step 3: Experimental analysis of the CO2 increment for each room
The infiltration rates confirmed in the field experiments were applied to a formula that can obtain the pollutant removal results for each ventilation rate. Field experiments were performed for the residence time and the number of occupants classified in Step 1. The error range was identified through a comparison with the CO2 concentrations obtained through the formula.
Step 4: CO2 analysis at various ventilation frequencies
The CO2 concentration was examined based on the number of occupants and various ventilation frequencies, using the formula and error range verified in Step 3.

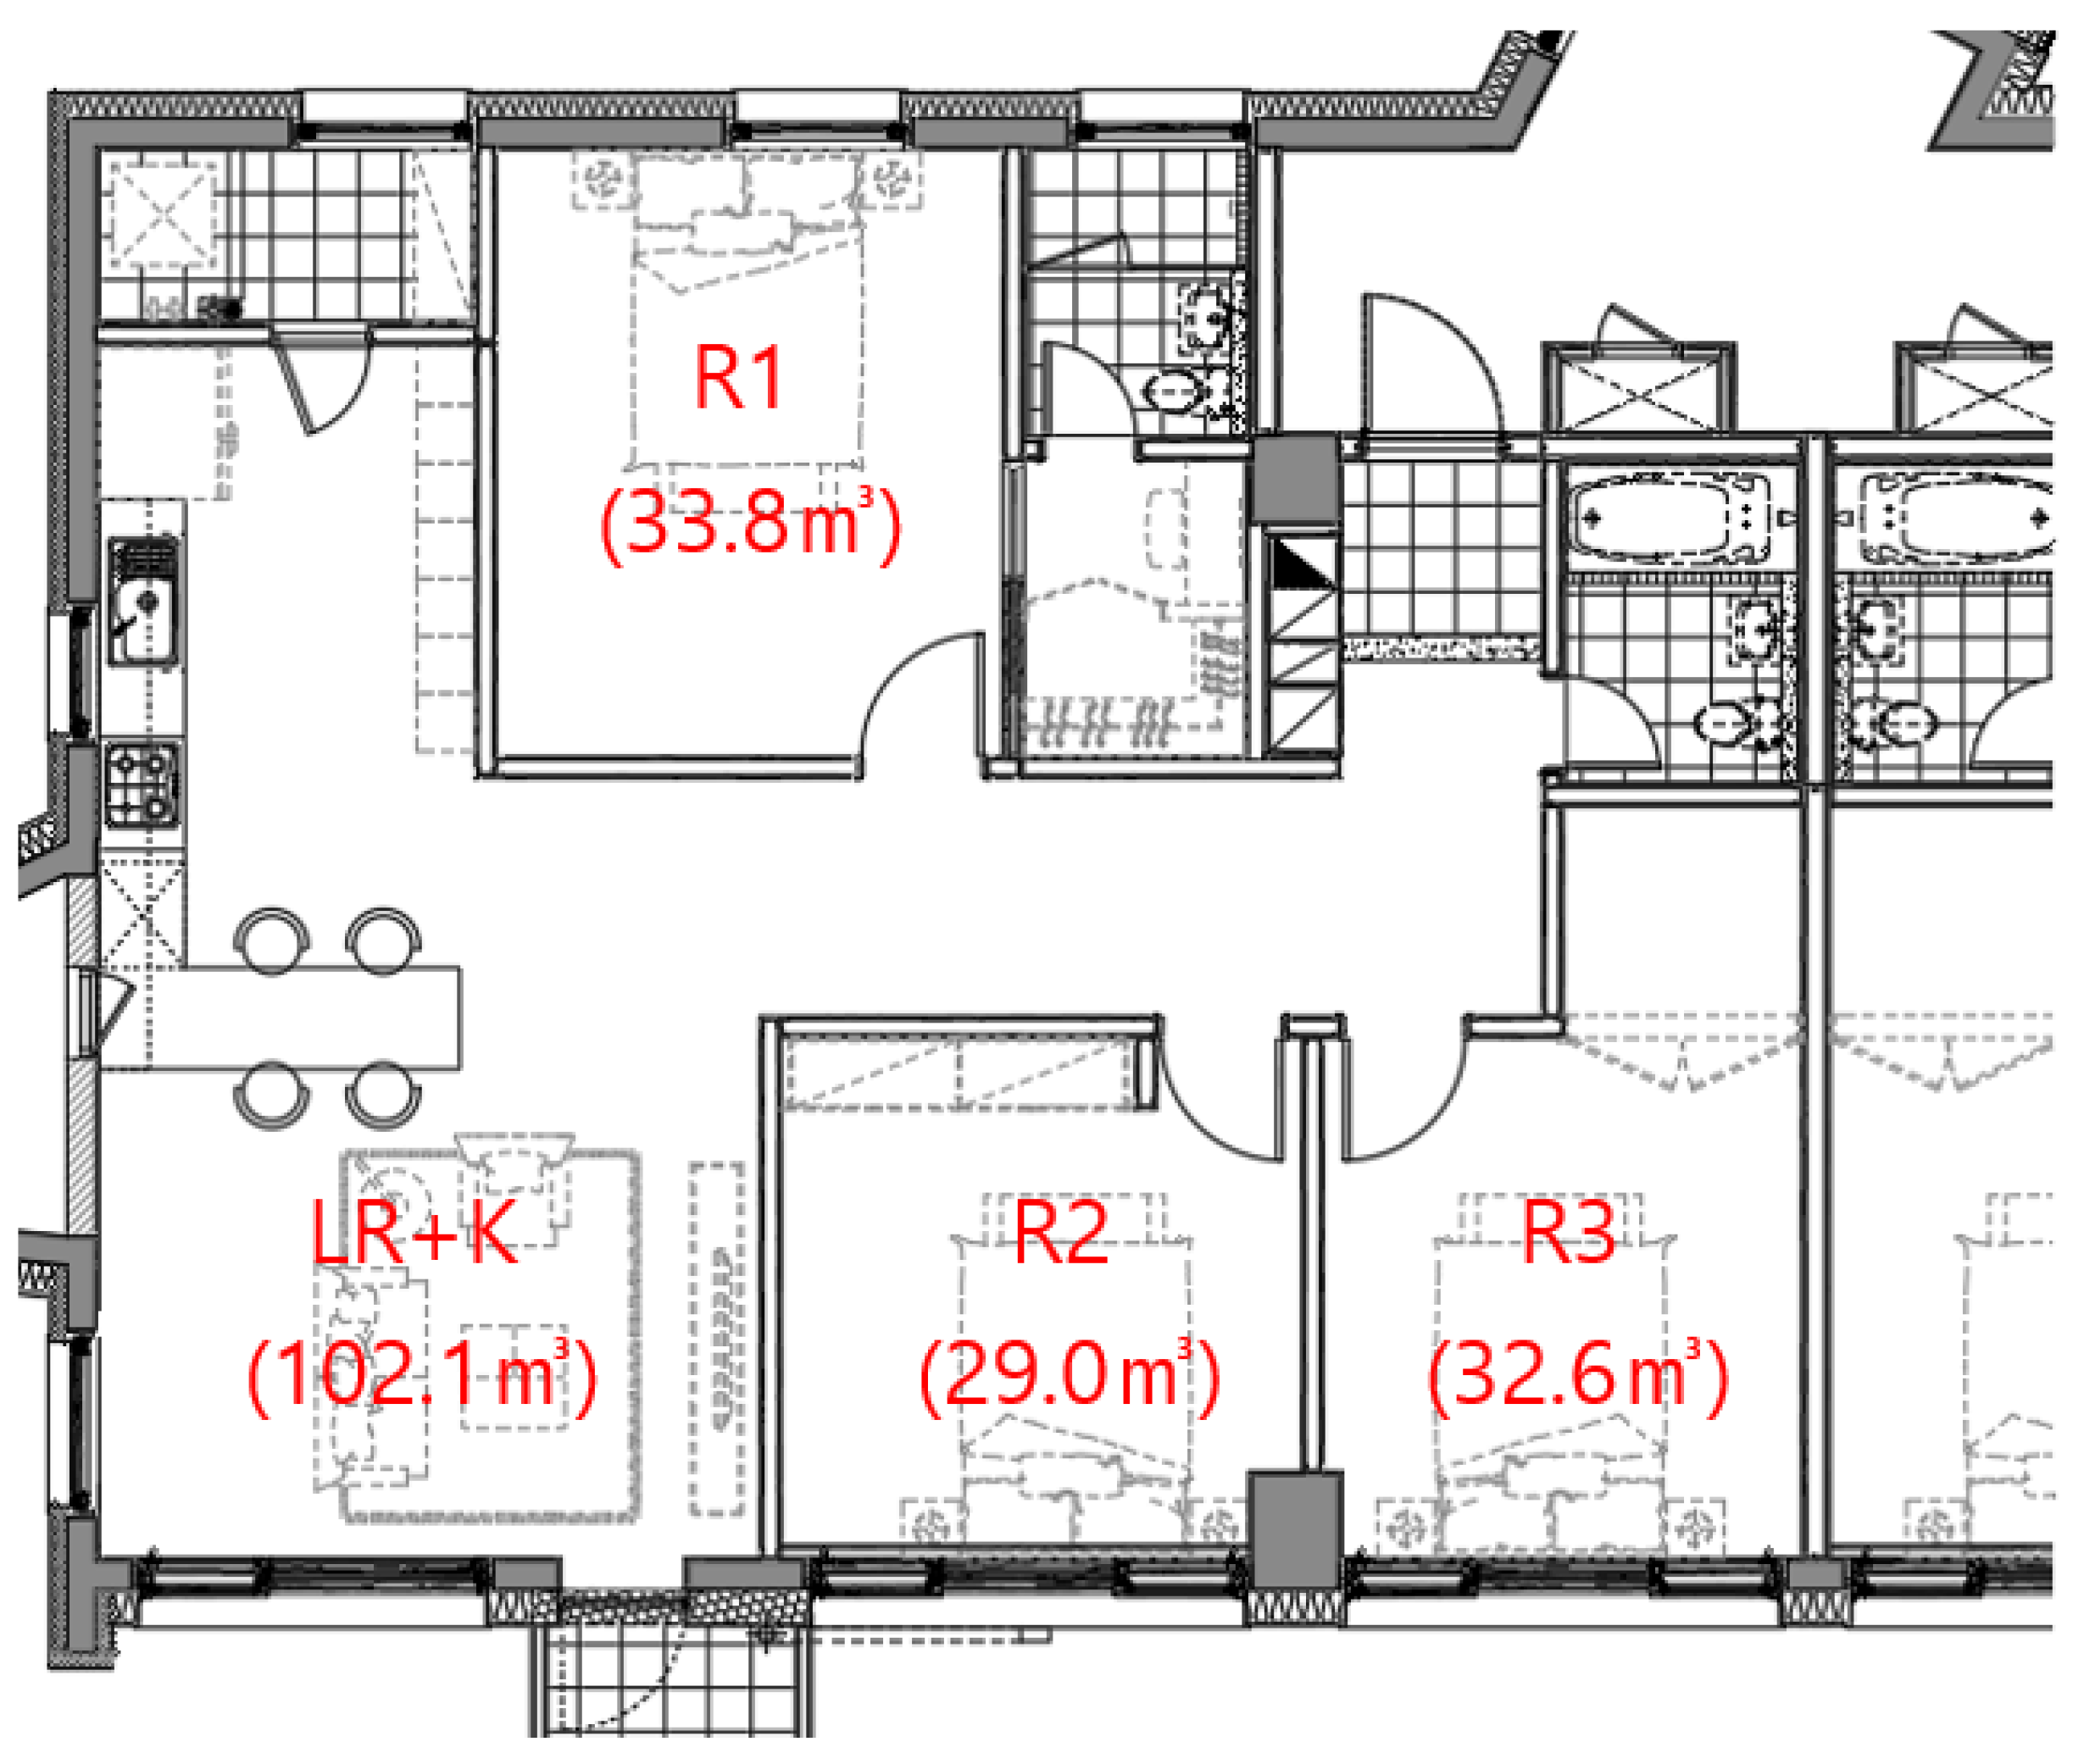
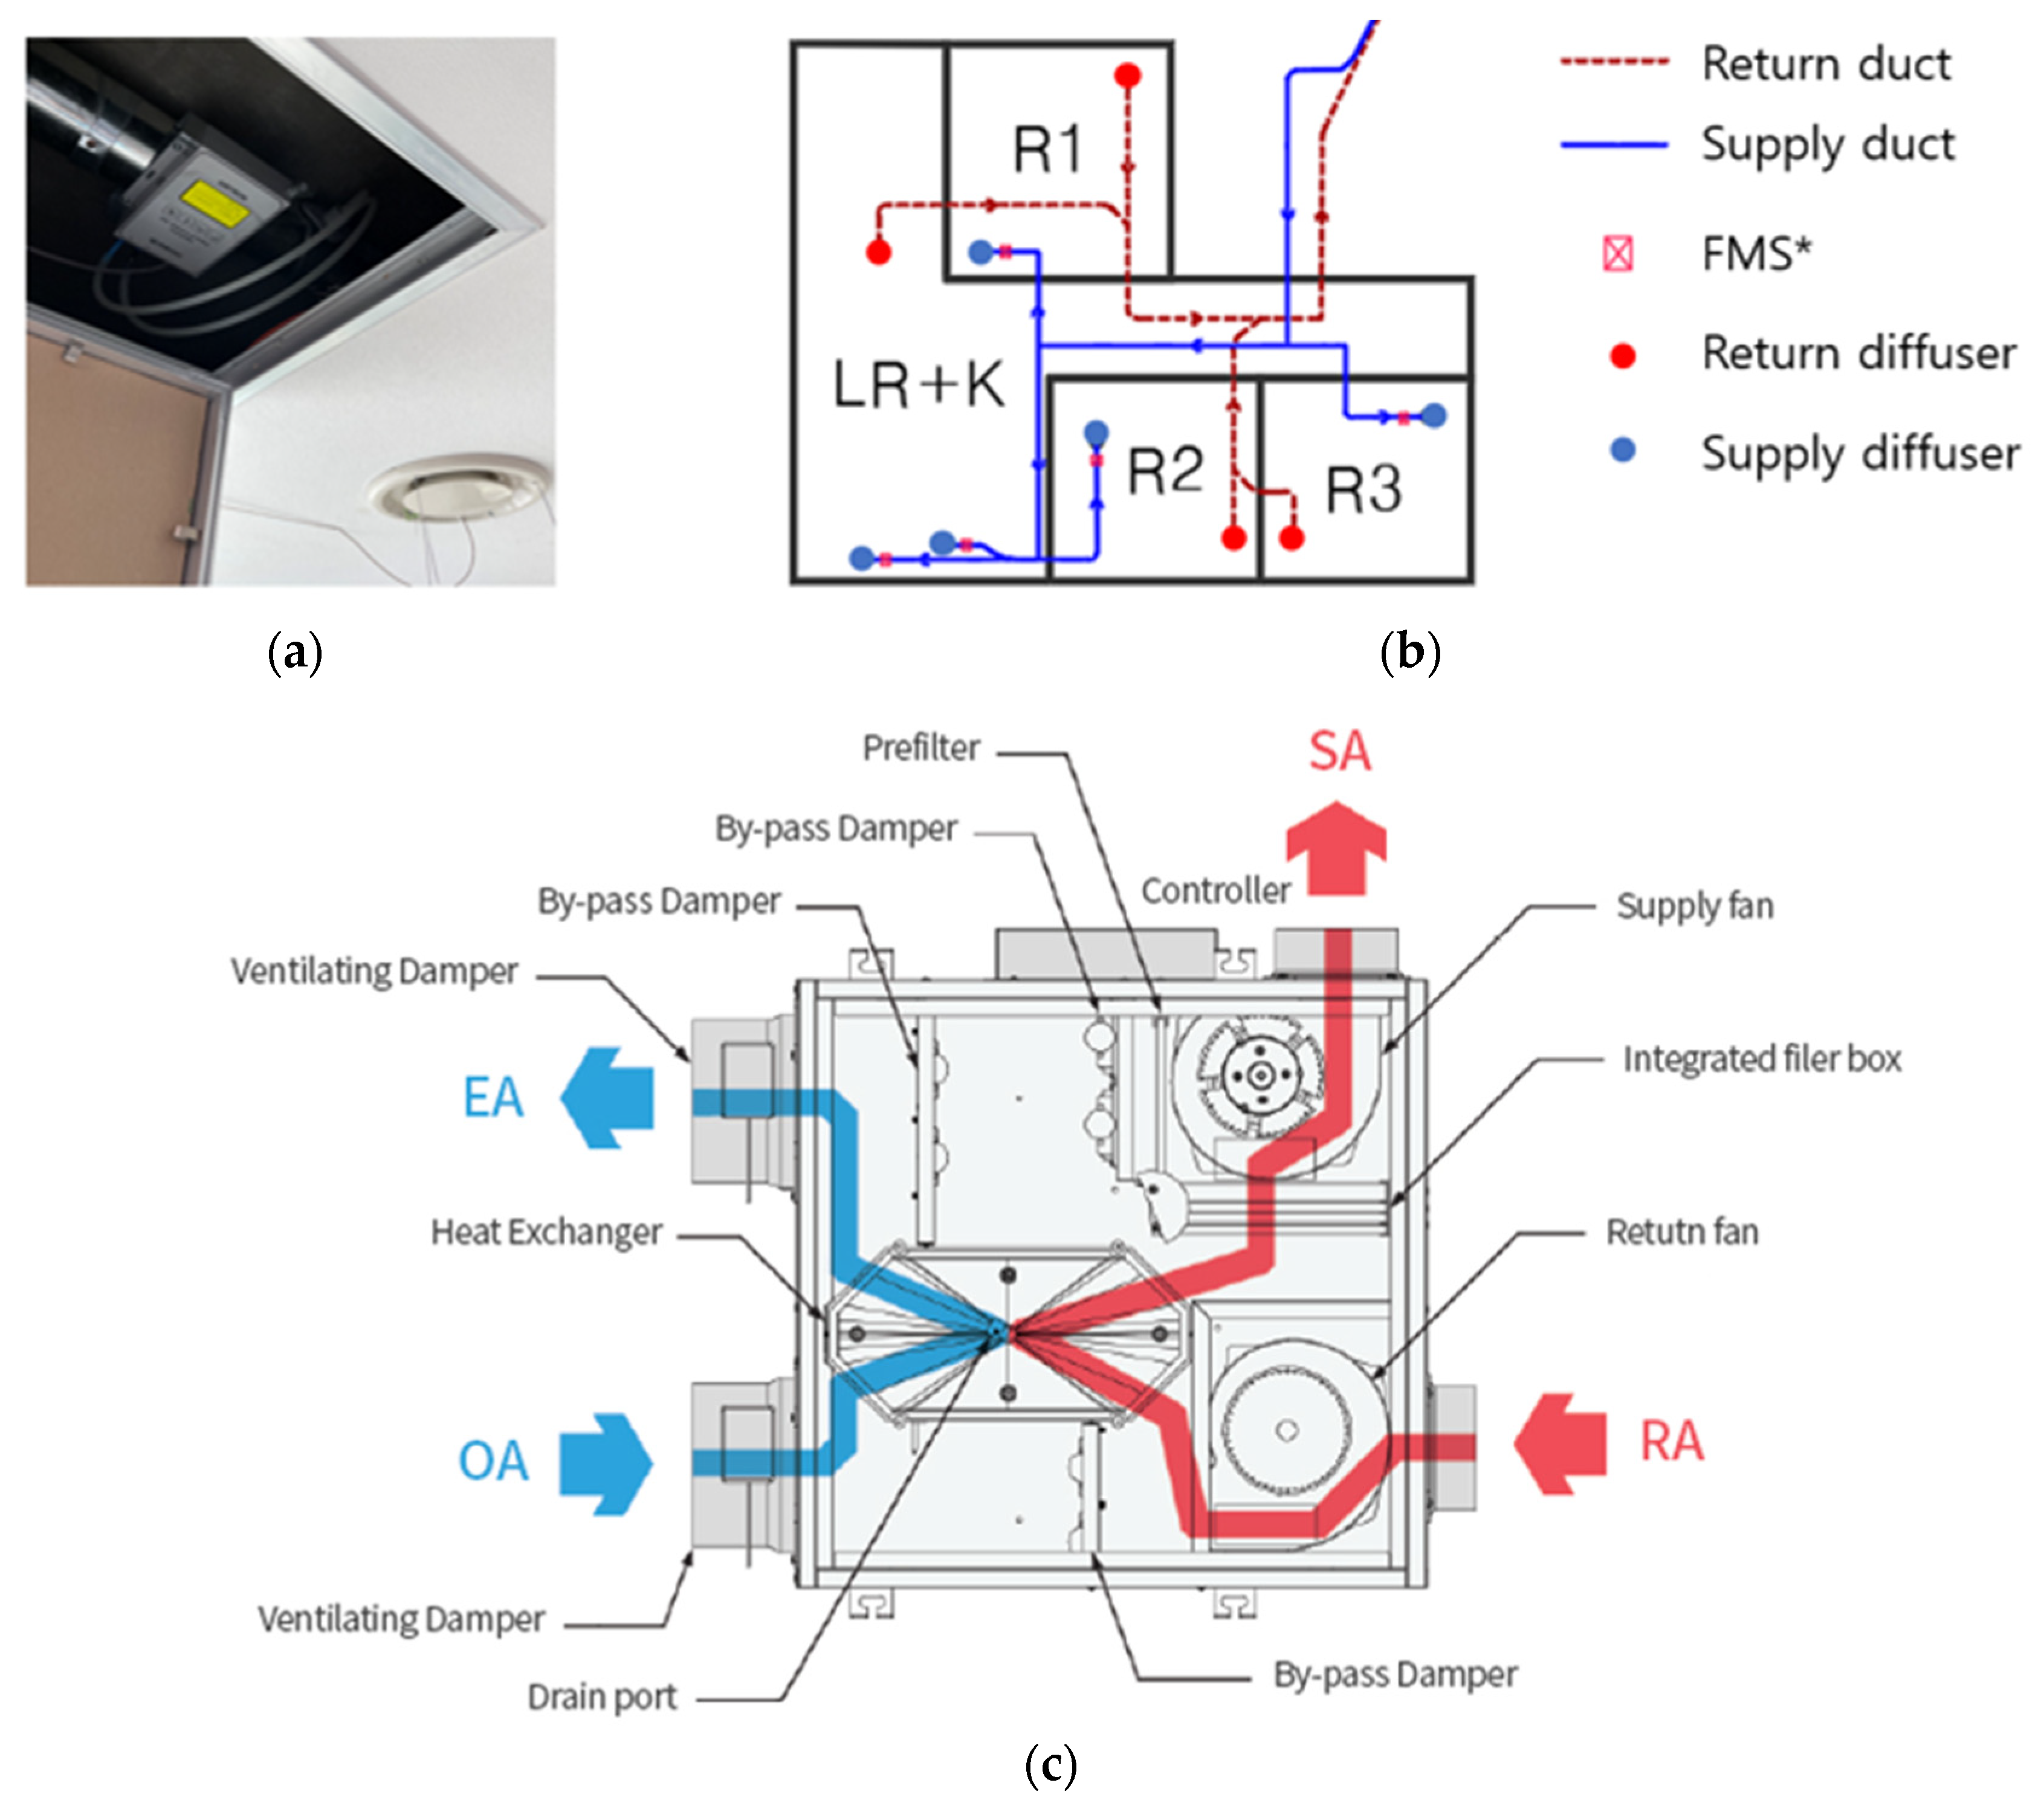
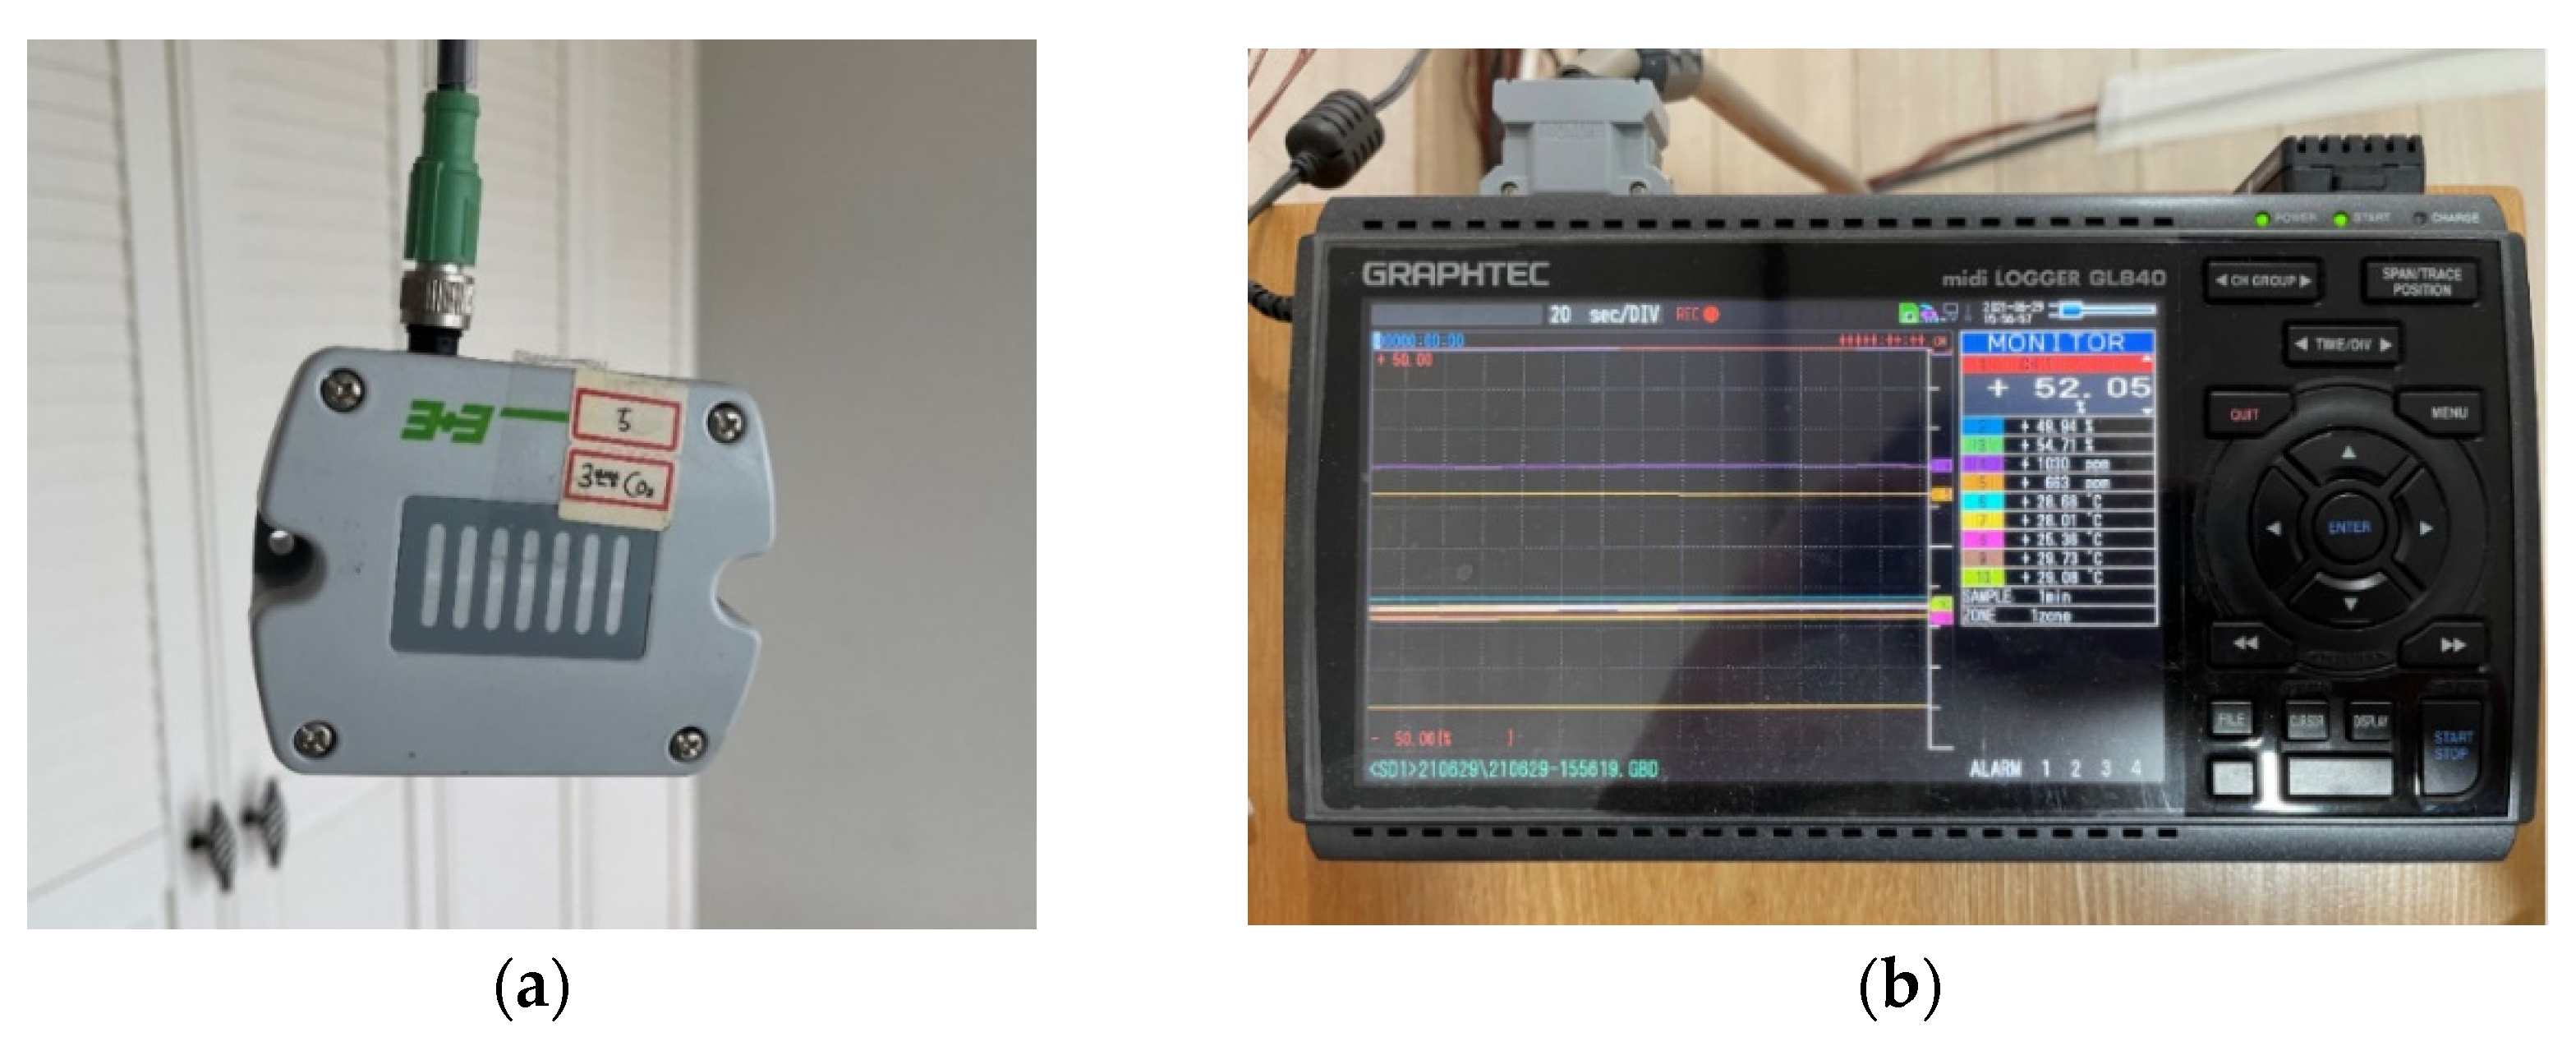
2.2. Experiment Space and Measurement Equiptment

The experiment apartment in this study consisted of one living room and three additional rooms. The living room and two other rooms were placed on the southern side and one room was placed on the northern side.
Figure 1 shows the floor plan of the apartment unit used for the experiments. The volume of each room and the positions of the windows and doors are illustrated. R2 and R3 (children’s bedrooms) had windows on the southern side, and R1 (couple’s bedroom) had a small window on the northern side and a sliding door to the dressing room. The sliding door had a rail at the top and no frame at the bottom. All doors to the living room had a hinged structure with the top and bottom frames. An exhaust air duct system from the bathroom in Figure 1 is separate and not included in this experiment.
Figure 2 shows the positions of the supply and return diffusers and the heat recovery ventilator as well as the flow metering system (FMS, Taehung M&C, Anyang-si, Korea) that measures the air volume for each room. The FMS measured the static pressure of the duct and calculated the air volume based on the value of the self-averaging multi-pitot tube. The diffusers were motorized and used to adjust the ventilation rate. They enabled multi-step adjustment from complete closing (an opening rate of zero) to complete opening (an opening rate of 3000).
The CO2 concentration was measured by connecting the EE820 sensor (E + E Elektronik) for CO2 (Figure 3a) to the Graphtec data logger (Figure 3b). The measurement range of the EE820 sensor provided by the manufacturer was 0–10,000 ppm, with error ranges of approximately 2%. The air volume measured at the end of each duct was divided by the room volume to calculate the air change per hour for each room. This was displayed on a separate monitor to minimize errors.

3. Results

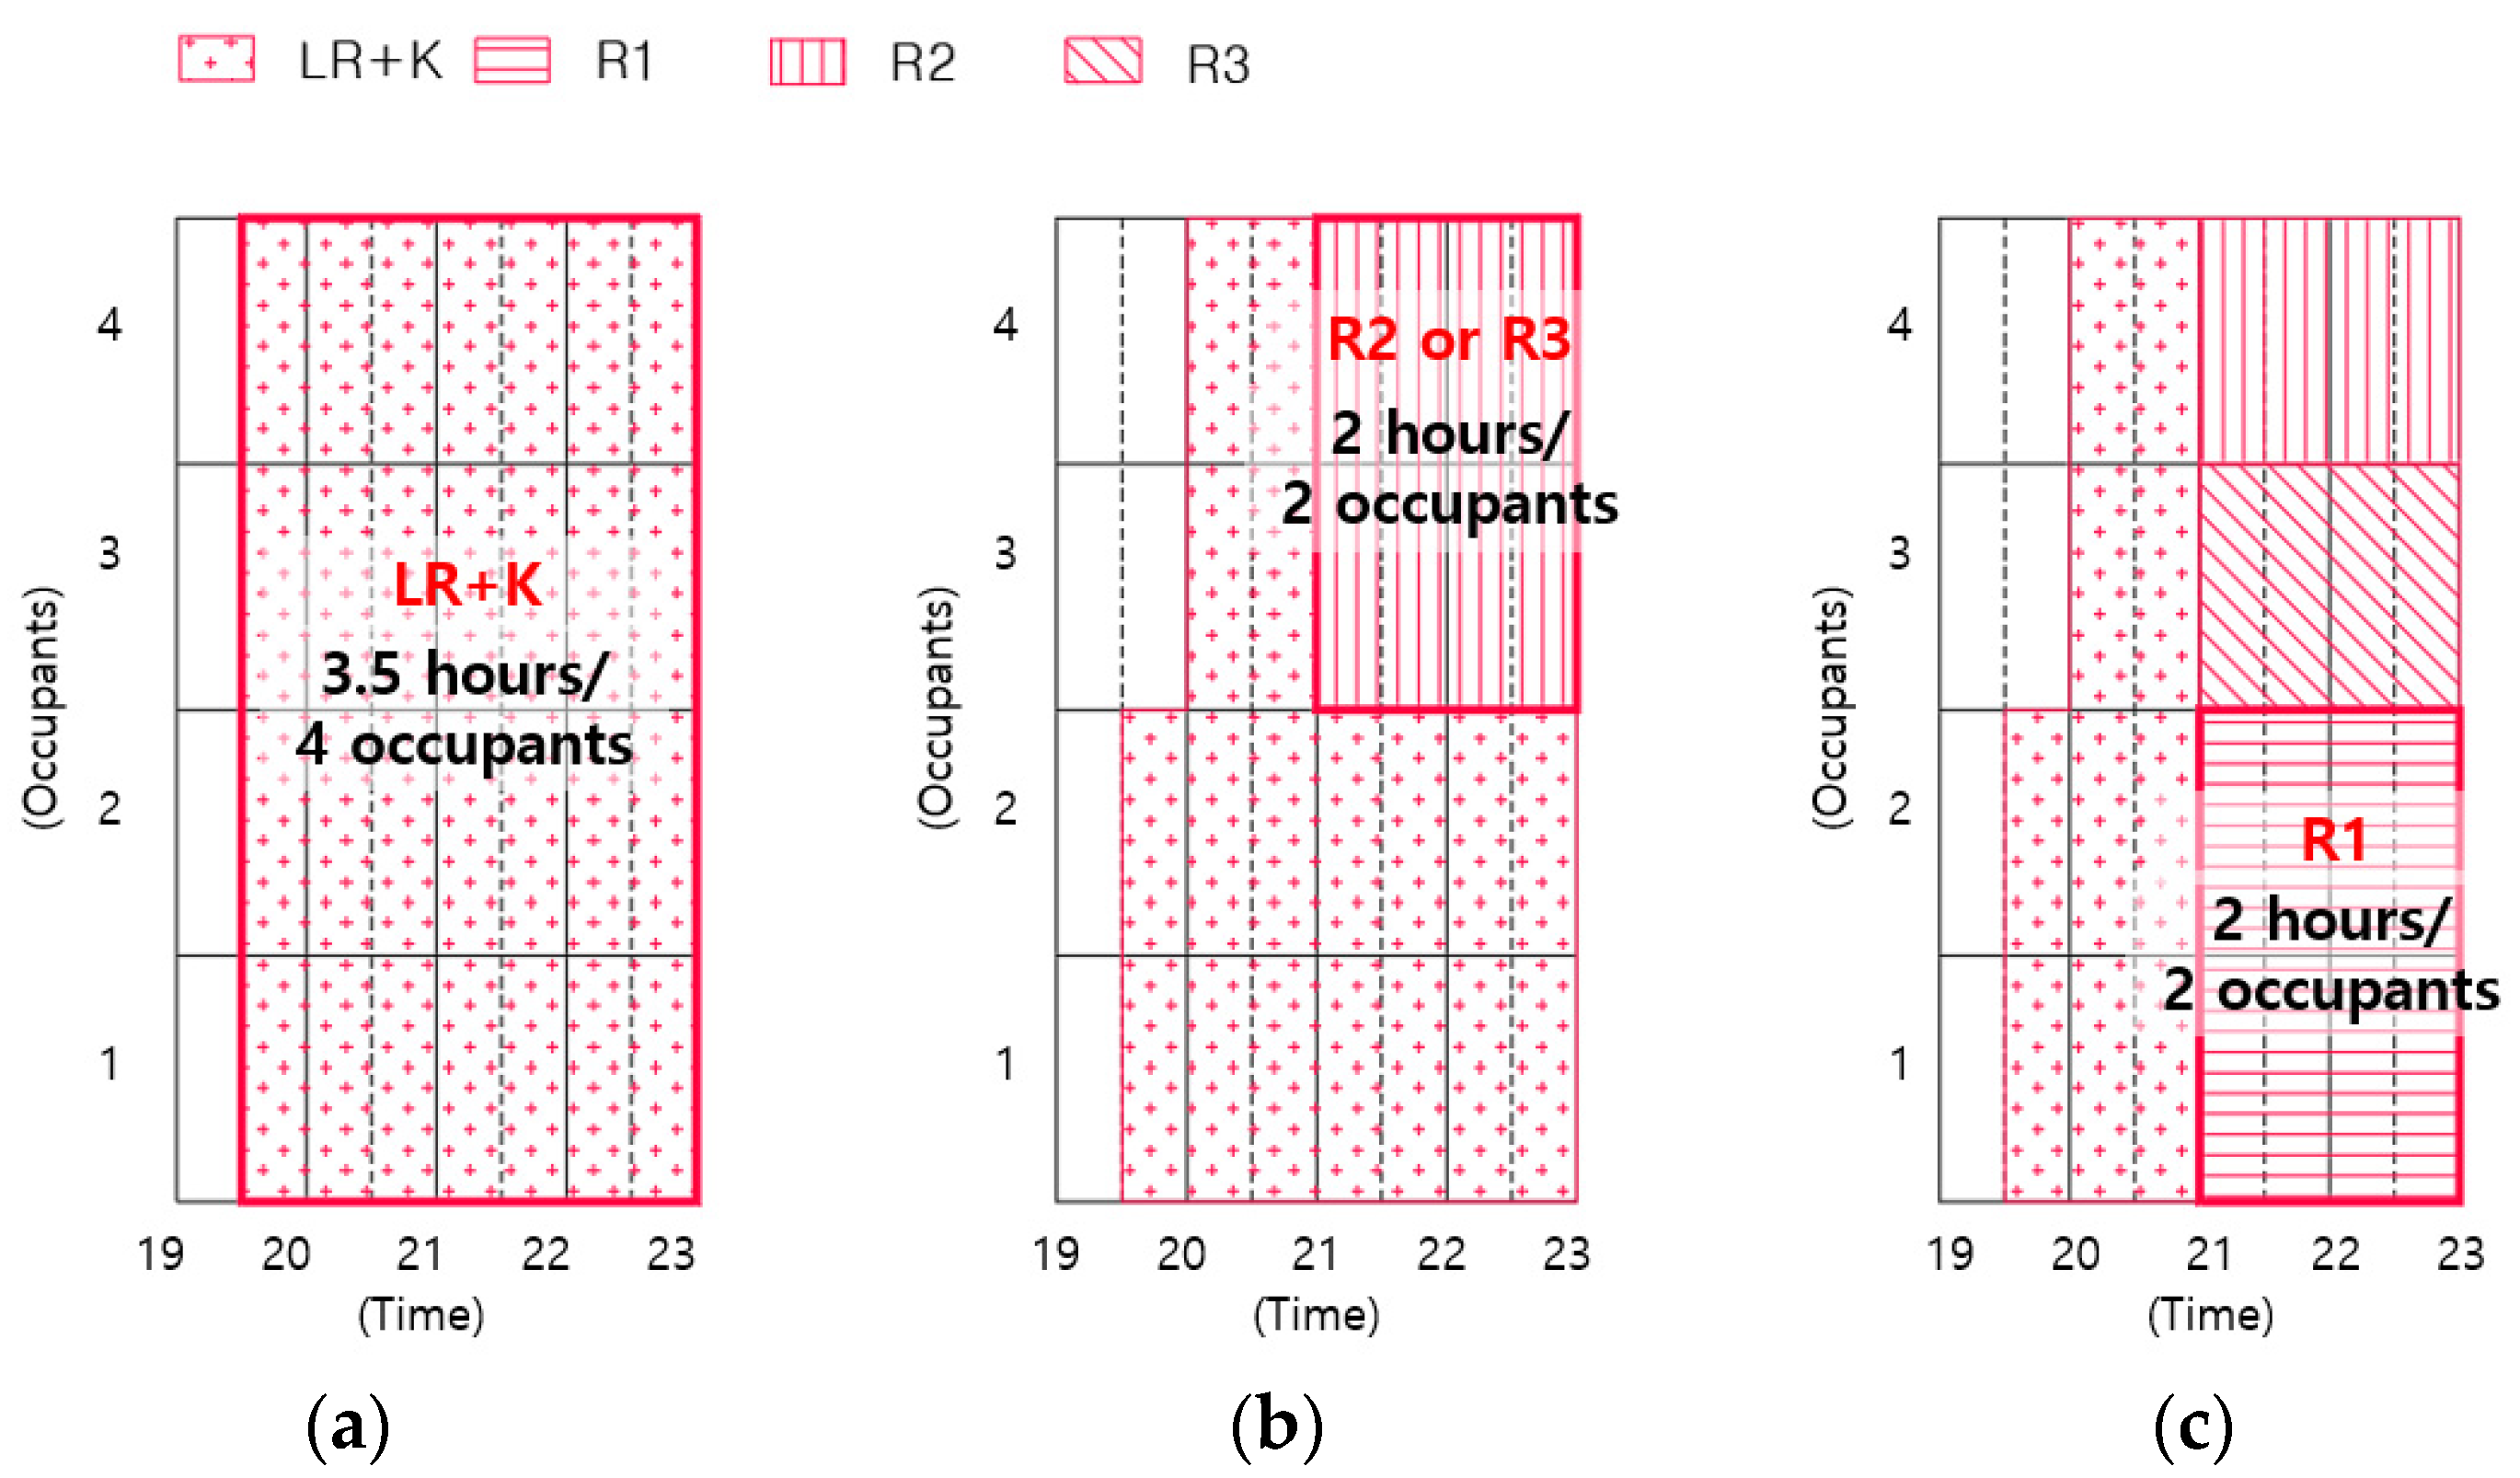
3.1. Analysis of the Residence Time for Each Room

To construct experimental cases, the actual usage schedule was examined based on the results of the 2019 Residential Status Survey conducted by Statistics Korea [21]. For the convenience of analysis, the time unit of behavior was divided into 30 min. Key survey results incorporated in this study included:
  • The average bedtime for Korean people was 23:22 and the average wake-up time was 06:55, resulting in an average sleeping time of 7 h and 27 min. The average sleeping time of people older than 40 was 1 h less than that of their children. In other words, in the case of a four-member family, it was assumed that the couple slept for 7 h and the two children for 8 h each.
  • Meal time ranged from 25 to 35 min, resulting in an average of 30 min. The preparation time for dressing and a shower before meals was assumed to be 30 min.
  • School and working hours were from 09:00 to 18:00, and the average commute time was 1 h and 16 min. In this study, the commute time was assumed to be 1 h and 30 min.
Reflecting the results of the Residential Status Survey we also assumed:
  • The couple goes to bed at 23:00 and wakes up at 06:00; the children wakes up at 07:00.
  • The family leaves from home at 07:30 and works or studies from 09:00 to 18:00. They return to home at 19:30.
  • The family has dinner for 30 min after a 30-min preparation allotment for dressing, and shower by approximately 20:30.
  • Assuming that they spend 30 min to 1 h out of 2 h and 30 min before bedtime (23:00) with other family members, the practical continuous residence time in each room was estimated to be less than 2 h.
  • As the target space is indoors, only light activities were assumed.
Based on the various schedules from 19:30 to 23:00 considered using the above conditions, the maximum number of occupants and residence time in each room could be obtained, as shown in Figure 4. The maximum residence time that occurred most frequently was 2 h, and the maximum number of occupants was four people in the living room, one person in R2 and R3, and two people in R1.

3.2. Analysis of the Infiltration Rate of Each Room

To calculate the infiltration rates of the living room + kitchen (LR + K), couple bedroom (R1), room 2 (R2), and room 3 (R3) (Figure 1), measurements were performed in accordance with KS F 2603 [22]. Equation (1) was specified in KS F 2603 (2016) to calculate the infiltration rate of a space using CO2 reduction data.
Q = 2.303 V t log 10 C 1 C 0 C t C 0
where Q is the supply air volume (m3/h), V is the space volume (m3), t is the time (h), C1 is the initial CO2 level (m3/m3), Ct is the CO2 concentration after hours (m3/m3), and C0 is the CO2 concentration in supply air (m3/m3).
Notably, the infiltration rate may vary depending on the season [23]; the infiltration rate calculation experiment in this study was conducted in March and April when the CO2 experiment was performed for each occupant. To examine the infiltration rate of each room with the door closed, CO2 gas was injected until its concentration reached 2000 ppm, and then natural attenuation was allowed. The experiment was repeated five times within 30 min, in accordance with KS F 2603 (2016). Table 1 shows experiment results for the maximum, minimum, and average infiltration rates of each room.

3.3. Mass Conservation Equation to Examine Indoor Air Pollution

Based on the mass balance equation, the indoor pollution concentration after time t can be obtained using Equation (2): The error from the experimental values was analyzed as follows:
  • With no separate ventilation, Q can be considered as the infiltration volume.
  • When mechanical ventilation was performed, the value obtained by adding the mechanical ventilation rate to the natural infiltration volume by the heat recovery ventilator was applied to Q. In this instance, the supply and return volumes were set to be equal by adjusting the speed of the supply and return fans before the start of the experiment. The values were examined using FMS in each room to minimize the influence of additional pressurization or decompression.
  • In Equation (2), the amount of CO2 generated (G) was calculated to be 18 L/h for adult males and 16 L/h for adult females, in accordance with ASHRAE 62.1 (2019) and KS F 2603 (2016).
V C T = Q C 0 Q C i + G
where V is the space volume (m3), T is the time (h), Q is the air change volume (m3/h), C represents CO2 level (mg/m3), C0 represents CO2 level outside (mg/m3), Ci represents CO2 level inside (mg/m3), and G is the CO2 generation (mg/h).
Three cases of ventilation rates were set as follows:
  • No ventilation
  • 0.5 ACH, which is the minimum ventilation frequency required by law
  • 1.0 ACH, which is twice as high as the minimum required ventilation frequency
Each LR + K, R1, R2, and R3 with different infiltration rates was occupied by occupants for 2 h; the experiment was conducted based on the above three ventilation rates and the number of occupants as variables. In addition, the measured CO2 concentrations (E.V.s) were compared to the calculated values (C.V.). The data are summarized in Table 2.
As shown in Table 2, the calculated values differed by −6 to +5% from the experimental values under the no ventilation condition. In the 0.5 and 1.0 ACH ventilation rates, which are the experimental results during mechanical ventilation, the experimental value also differed by −11 to +6% from the calculated values.
The maximum number of occupants was analyzed as four for LR + K and two for R1, R2, and R3, as shown in Figure 4.
As a result of the experimental case analyses, R1, 2, and 3 showed CO2 concentrations exceeding 1000 ppm even with the highest ventilation case, 1.0 ACH. Accordingly, CO2 concentrations in the 1.5 ACH cases were additionally analyzed according to the formula, and the possible error ranges were indicated. In addition, the calculation results that expanded the analysis range considering the maximum residence time and maximum number of occupants are shown in Figure 5 and Figure 6 with the possible error ranges.
Figure 5 shows the increase in CO2 concentration in LR + K depending on the number of occupants and ventilation frequency, and the error ranges considering the experimental values are also expressed. The analysis results that considered these error ranges were as follows:
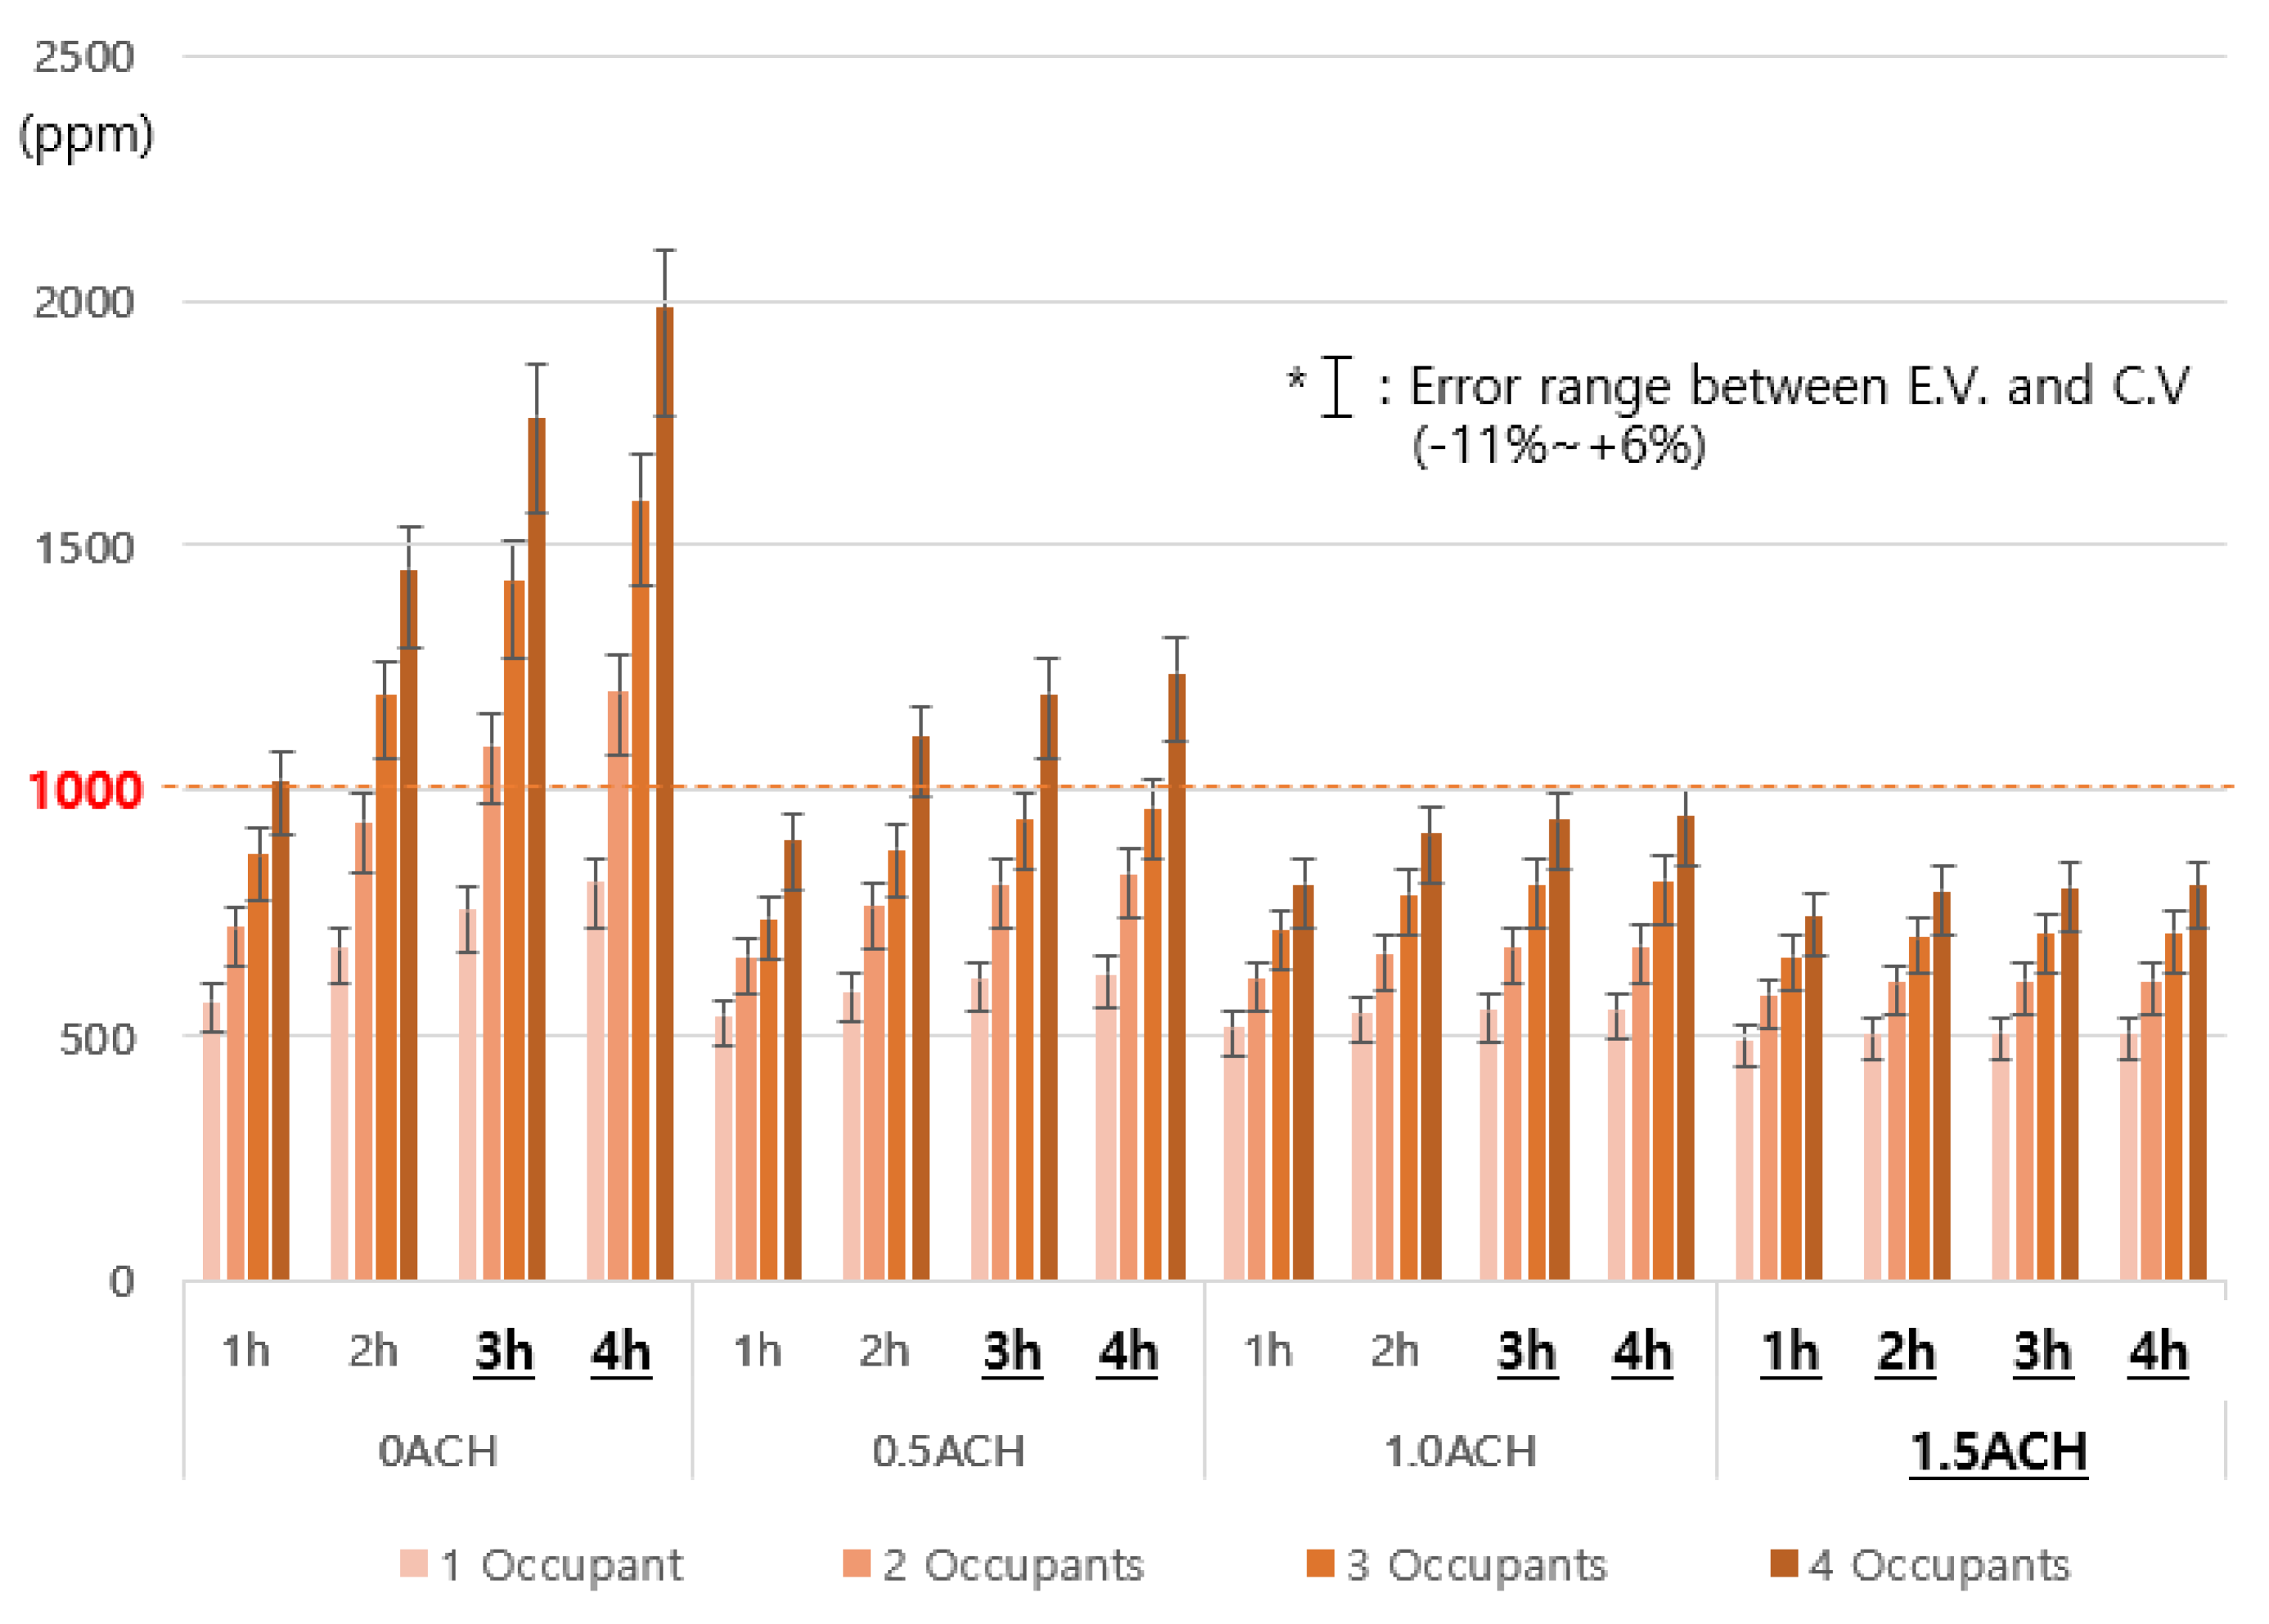
  • With no ventilation in LR + K (0 ACH), the CO2 concentration could exceed 1000 ppm, if four people stayed for more than 1 h or two people stayed for more than 3 h.
  • When a mechanical ventilation of 0.5 ACH was performed, the CO2 concentration could also exceed 1000 ppm, if four people stayed for more than 2 h.
Figure 6 shows increases in the CO2 concentration in R1, R2, and R3 based on the number of occupants and ventilation frequency. The key results were as follows:
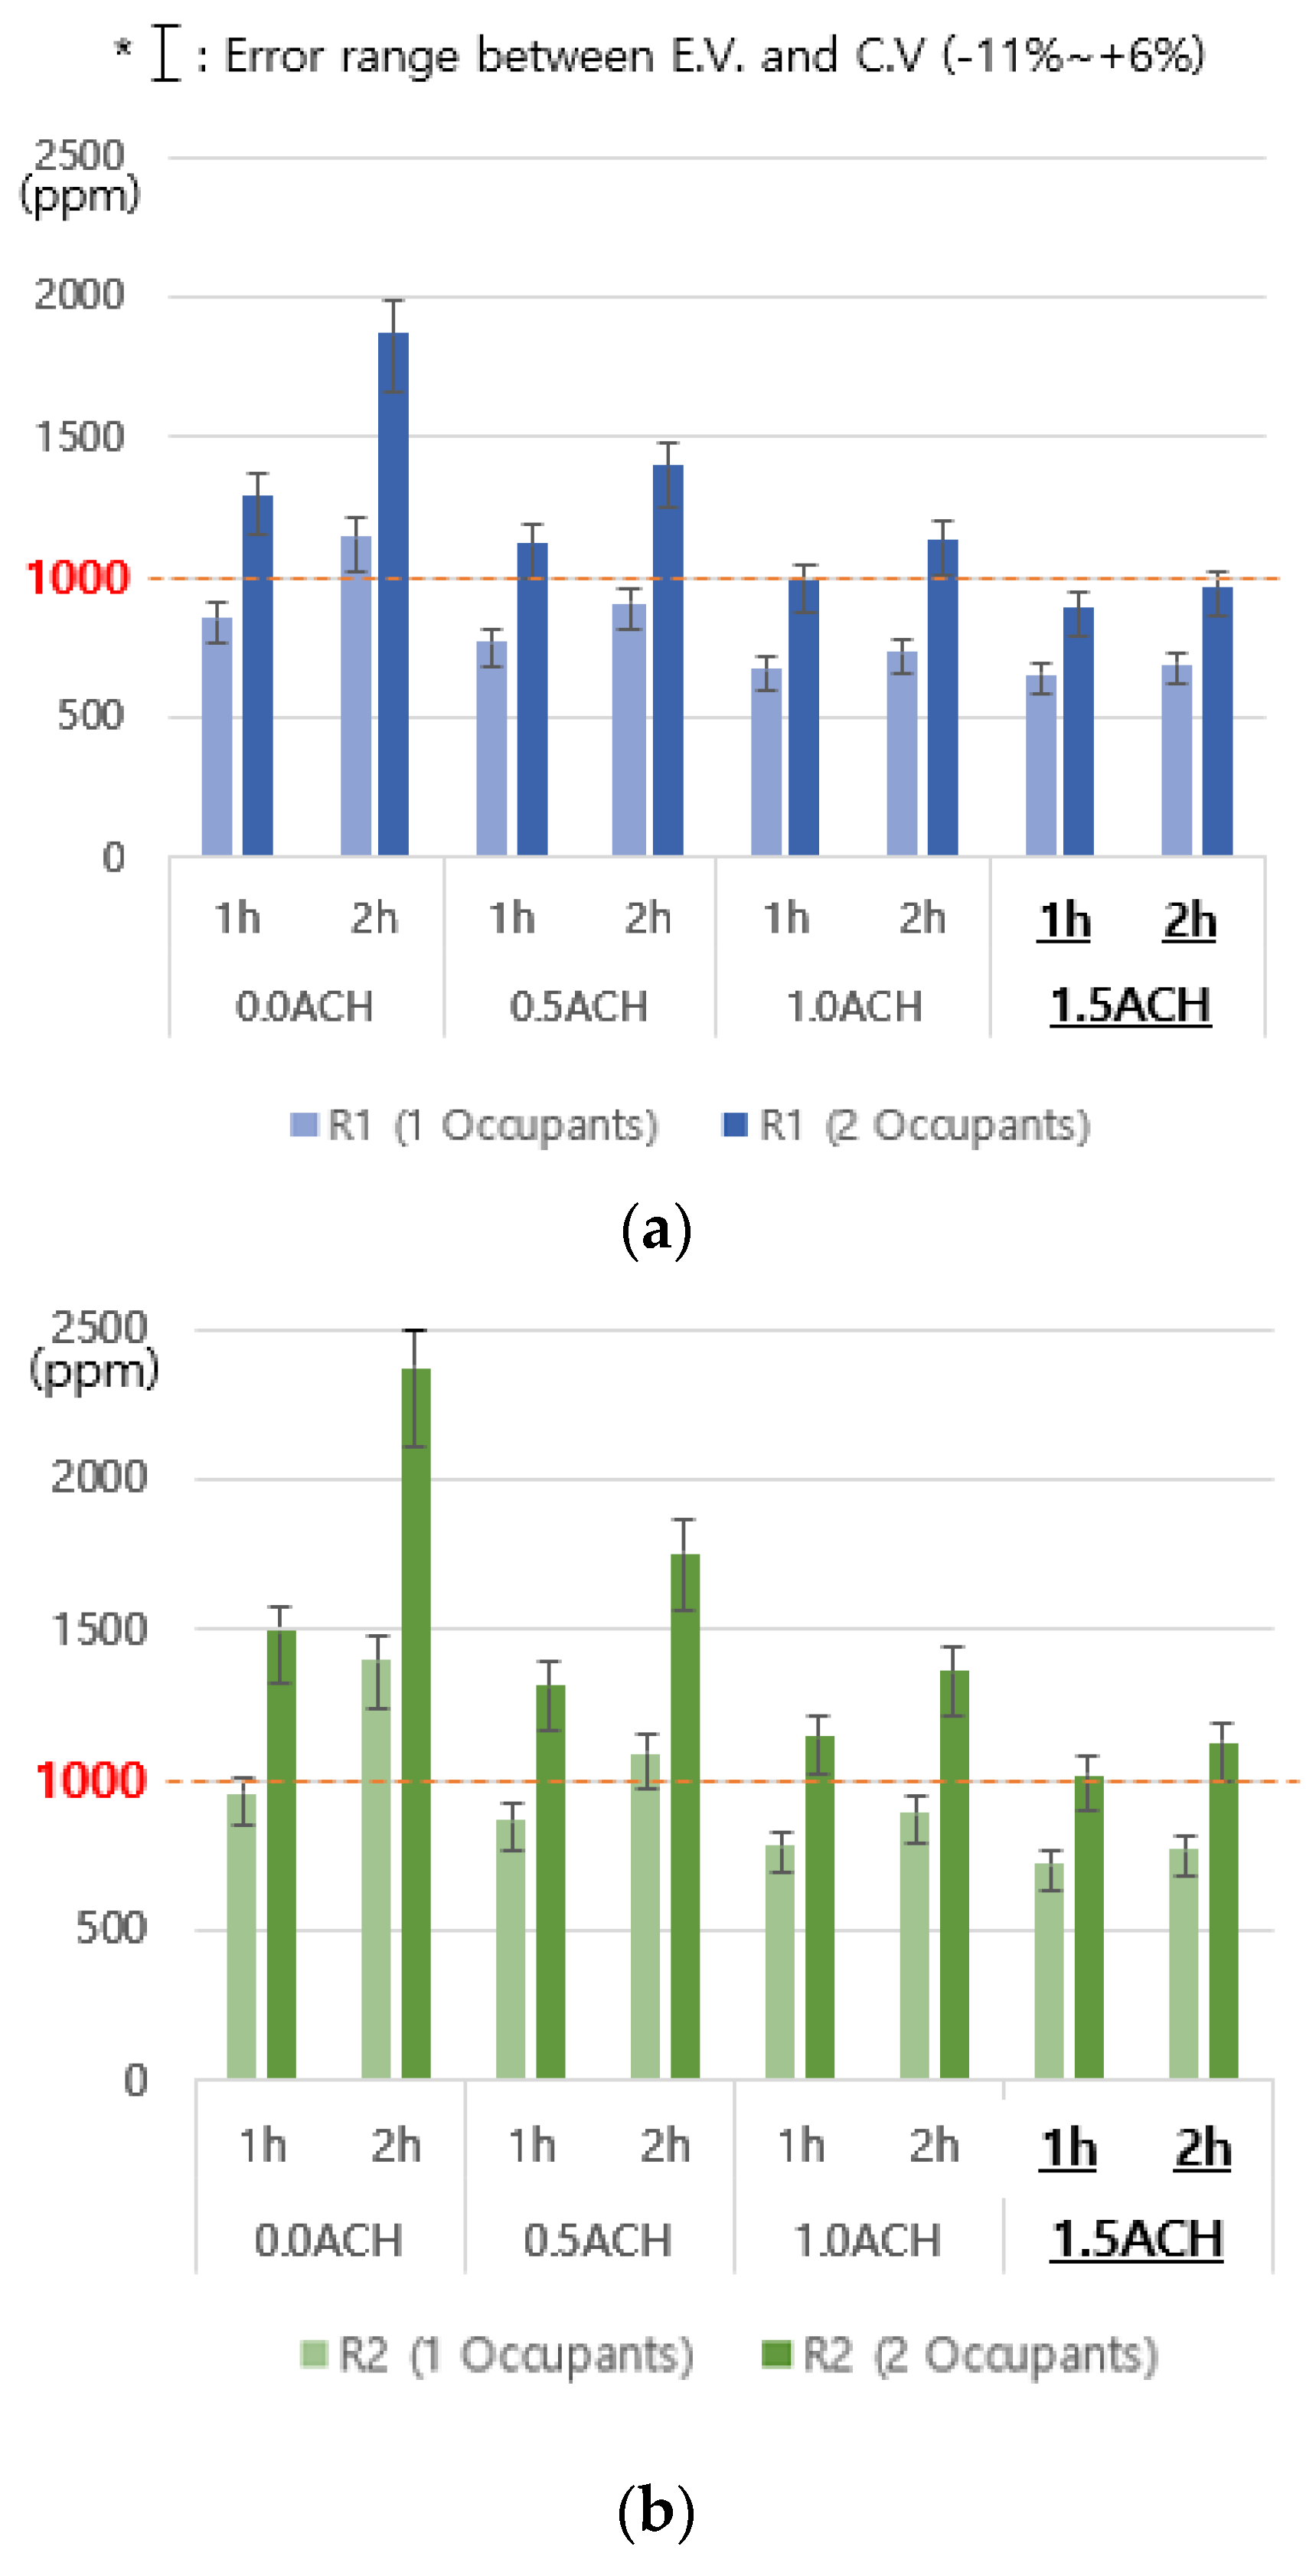
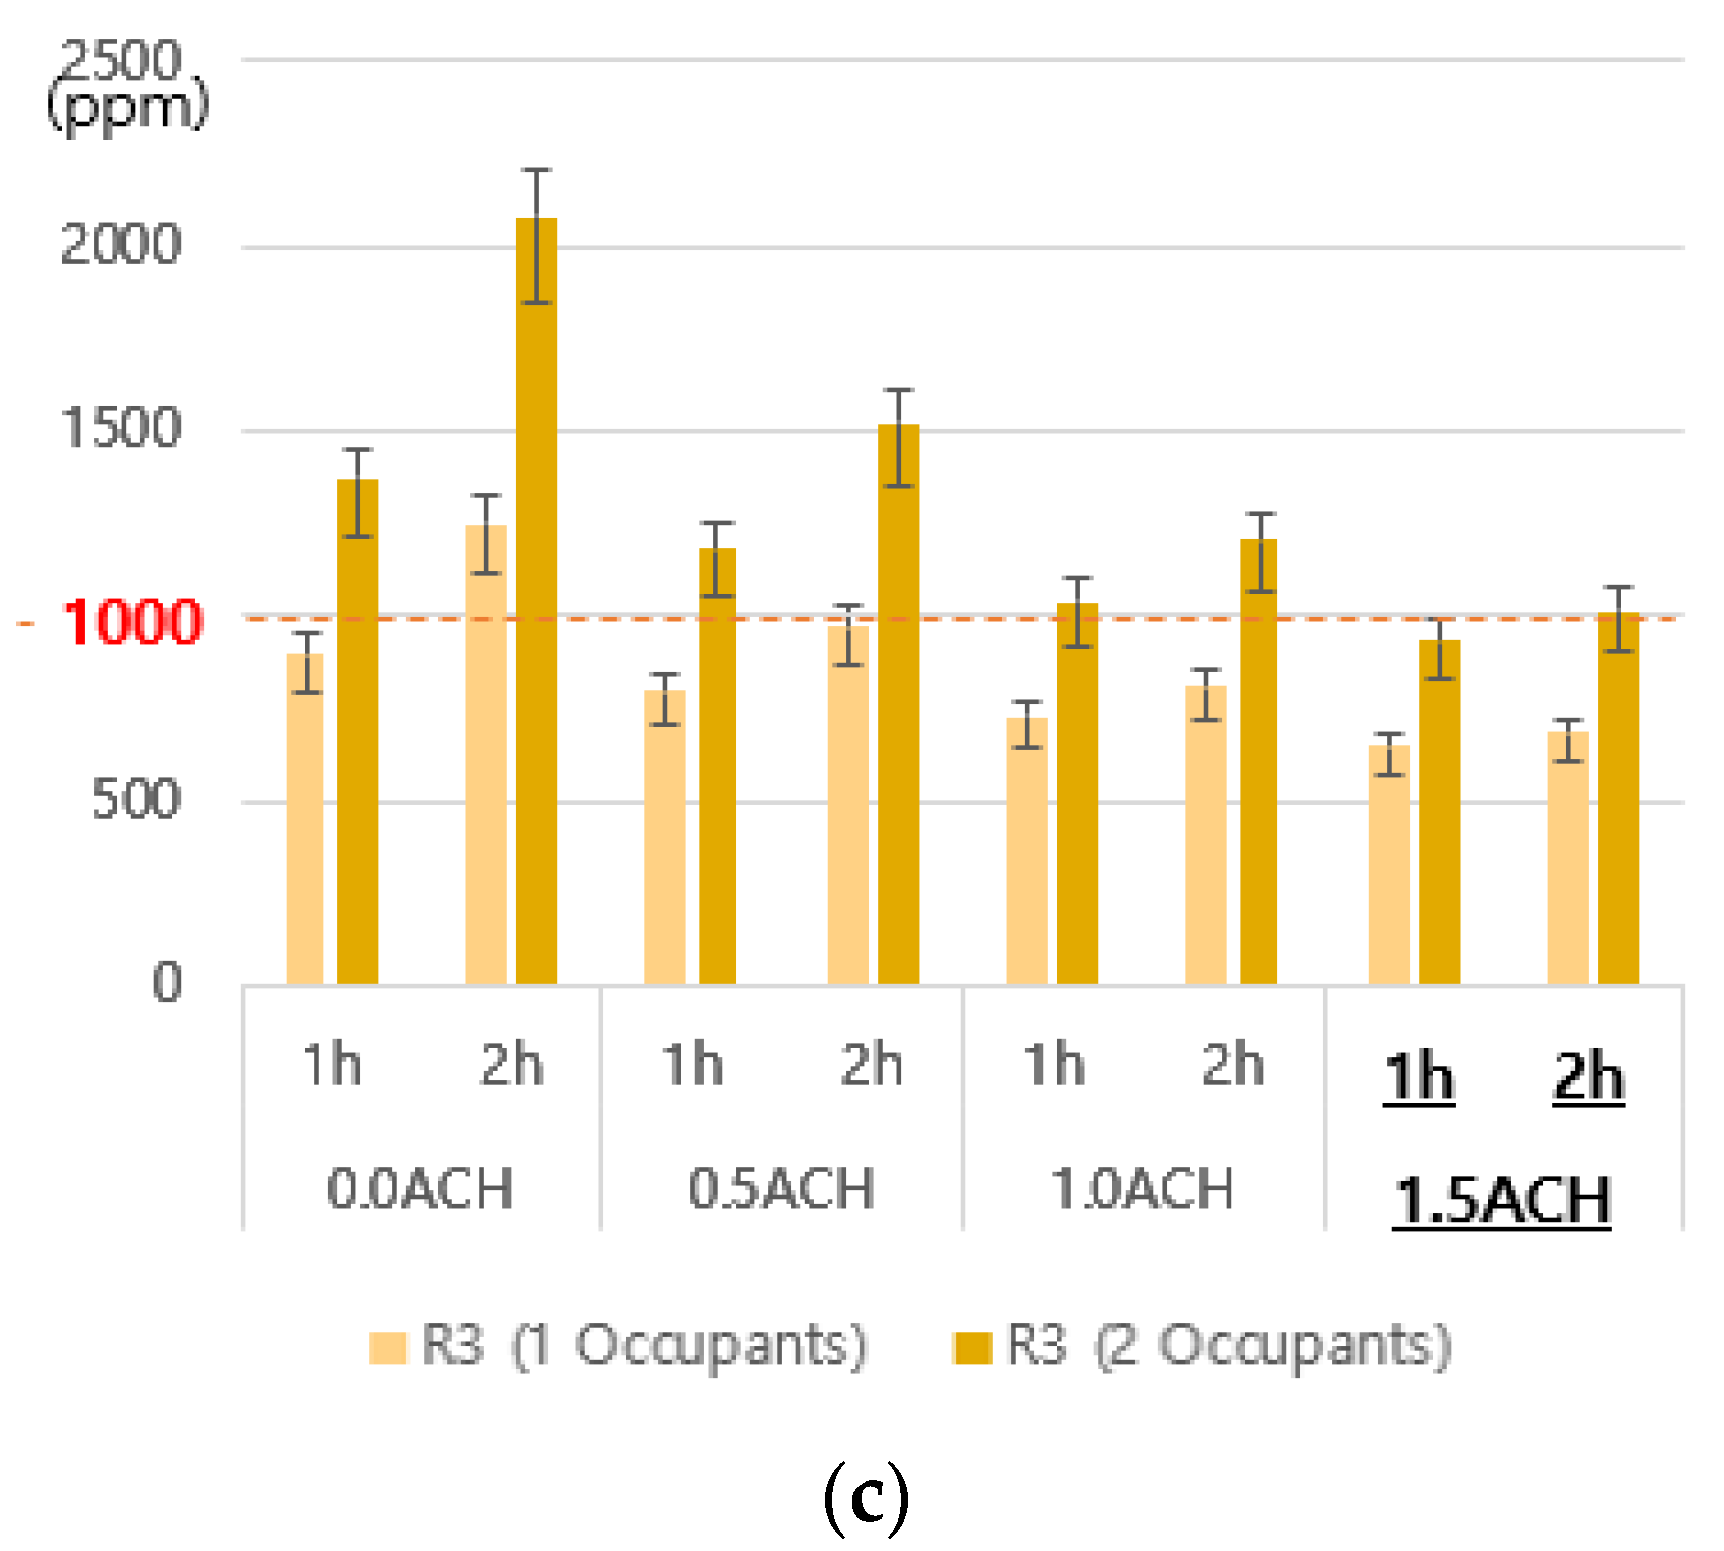
  • With no ventilation, the CO2 concentration could exceed 1000 ppm under all conditions except when one person stayed for less than 1 h. In the case of R2 and R3, the CO2 concentration could exceed 2000 ppm, if two adult males stayed for 2 h.
  • When the minimum required 0.5 ACH ventilation was performed, the CO2 concentration in R2 with the lowest infiltration rate increased to 1089 ppm if one adult male stayed for 2 h and to 1757 ppm if two adult males stayed for 2 h. In particular, the CO2 concentration in R1, R2, and R3 exceeded 1000 ppm, if two adult males stayed for only 1 h.
  • When a 1.5 ACH ventilation was performed, CO2 concentration could be maintained at a level lower than 1000 ppm in R1, R2, and R3, even if one occupant stayed for more than 2 h. However, the CO2 concentrations in R1, R2, and R3 exceeded 1000 ppm and reached 1130, 1361, and 1206 ppm, respectively, if two occupants stayed for 2 h.
  • With a ventilation of 1.5 ACH, the indoor CO2 concentration ranged from less than 1000 ppm to slightly higher than 1100 ppm. The latter values occurred if two occupants stayed for 2 h, the most severe among the experimental conditions.

4. Discussion

In this study, the occupancy conditions of residents were examined in an 85 m2 apartment unit, which is the representative apartment size in South Korea. In addition, the improvement in indoor air quality based on occupancy condition and ventilation frequency was examined, with a focus on CO2 concentration.
The experiment and analysis results of this study can be summarized as follows:
  • The room occupancy scenarios of a four-member family living in an 85 m2 apartment unit were examined using statistical data, and the residence time schedule for each room was prepared. The maximum number of occupants and the maximum residence time were found to be four people and 4 h, respectively, for LR + K, and two people and 2 h, respectively, for each of R1, R2, and R3.
  • The infiltration rate for each room was obtained using the CO2 reduction method in accordance with KS F 2603. The CO2 concentration equation was then constructed for each case using the mass balance equation that combined these infiltration rates, and the error range was calculated by performing experiments under several conditions. In addition, the CO2 concentration was analyzed for various cases using this equation.
  • For the minimum required ventilation of 0.5 ACH, analysis results showed that it was difficult to maintain 1000 ppm or less if four people stay for more than 2 h in LR + K and if two people stay for more than 1 h in R1, R2, and R3, which is the minimum ventilation frequency by law.
  • Ventilation of 1.0 ACH or more was required for two people to stay in a bedroom for more than 1 h. Furthermore, 1.5 ACH or more was required for two people to stay for more than 2 h while maintaining a CO2 concentration of approximately 1000 ppm.
Overall, the findings from this study indicate that it is difficult to maintain a standard CO2 concentration of 1000 ppm when doors are closed as housing ventilation rates in domestic and overseas standards were calculated based on an apartment unit’s total area. In addition, results indicate that ventilation systems that can provide different air volumes for each room should be required in houses. However, increasing the capacity of fans or ventilating the total area at a high air volume for this purpose may result in high energy consumption. Therefore, research on energy-saving technologies is also required. In this study, only weekday results were analyzed, where residents have a general life pattern, and in cases except for other activities with higher emissions of CO2 e.g., exercise. During holidays, residence time tends to increase, which leads to a further increase in CO2 concentration when compared to the results of the present study. Future research should include various scenarios, such as holidays and various activity cases, and analysis should be conducted through simulations and field experiments. In addition, strategies to maintain indoor air quality using individual room control should be presented to provide an optimal indoor air environment with minimal energy use.

Author Contributions

K.C. performed the experiments, analyzed the data, and wrote the original draft; D.C. and T.K. carried out the project administration and reviewed the paper. All authors have read and agreed to the published version of the manuscript.

Funding

This study is part of a research project conducted with funding from the Ministry of Trade Industry and Energy in Korea (grant number 20009795).

Institutional Review Board Statement

Not applicable.

Informed Consent Statement

Not applicable.

Data Availability Statement

The data supporting the reported results in the present study will be available on request from the corresponding author or the first author.

Conflicts of Interest

The authors declare no conflict of interest.

References

  1. Ministry of Land, Infrastructure and Transport (MLIT). Korean MLIT Decree No.704, Rules on the Facility Standards of Buildings; MLIT: Seoul, Korea, 2020.
  2. MLIT. Law No. 17921, Law for Apartment Housing; MLIT: Seoul, Korea, 2021.
  3. American Society of Heating, Refrigerating and Air-Conditioning Engineers (ASHRAE). Ventilation and Acceptable Indoor Air Quality in Residential Buildings; Standard 62.2; ASHRAE Inc.: Atlanta, GA, USA, 2019. [Google Scholar]
  4. National Research Council. Carbon Dioxide. In Spacecraft Maximum Allowable Concentrations for Selected Airborne Contaminants; National Academies Press: Washington, DC, USA, 2008; pp. 112–124. [Google Scholar]
  5. Health Canada. Indoor air quality in office buildings: A technical guide. In A Report of the Federal-Provincial Advisory Committee on Environmental and Occupational Health; Health Canada: Ottawa, ON, Canada, 1995. [Google Scholar]
  6. Ministry of Environment (MOE). Enforcement Rules of Indoor Air Quality Control; Korean MOE Decree No.918; Ministry of Environment: Seoul, Korea, 2021.
  7. Total Climate Change Monitoring Data, CO2 Concentration in Korea. Available online: http://www.climate.go.kr/home/09_monitoring/ghg/co2_global_trend (accessed on 21 March 2021).
  8. ASHRAE Inc. Ventilation for Acceptable Indoor Air Quality; ASHRAE Standard 62.1; ASHRAE Inc.: Atlanta, GA, USA, 2019. [Google Scholar]
  9. Read by Area and Analyzed by Space. Available online: https://www.sciencetimes.co.kr/news (accessed on 24 April 2021).
  10. Nam, K.; Lee, Y. An analysis on HCHO, TVOC, CO2, concentration of existing housing indoor air in summer. KIEAE J. 2016, 16, 115–122. [Google Scholar] [CrossRef] [Green Version]
  11. Nam, K.; Lee, Y.; Choi, B. A comparative analysis on concentration of pollutants in housing indoor air between winter and summer. KIEAE J. 2017, 17, 125–131. [Google Scholar] [CrossRef]
  12. Pavlovas, V. Demand controlled ventilation: A case study for existing Swedish multifamily buildings, Energy Build. REHVA Sci. 2004, 36, 1029–1034. [Google Scholar]
  13. Jreijiry, D.; Husaunndee, A.; Inard, C. Numerical study of a hybrid ventilation system for single family houses. Sol. Energy 2007, 81, 227–239. [Google Scholar] [CrossRef]
  14. Laverge, J.; Bossche, N.V.D.; Heijmans, N.; Janssens, A. Energy saving potential and repercussions on indoor air quality of demand controlled residential ventilation strategies. Build. Environ. 2011, 46, 1497–1503. [Google Scholar] [CrossRef] [Green Version]
  15. Seong, N. Energy requirements of a multi-sensor based demand control ventilation system in residential buildings. In Proceedings of the 31st AIVC Conference “Low Energy and Sustainable Ventilation Technologies for Green Buildings, Seoul, Korea, 26–28 October 2010. [Google Scholar]
  16. Mortensen, D.K.; Walker, I.S.; Sherman, M.H. Optimization of Occupancy Based Demand Controlled Ventilation in Residences. Int. J. Vent. 2011, 10, 49–60. [Google Scholar] [CrossRef] [Green Version]
  17. Hesaraki, A.; Holmberg, S. Demand-controlled ventilation in new residential buildings: Consequences on indoor air quality and energy savings. Indoor Built Environ. 2013, 24, 162–173. [Google Scholar] [CrossRef] [Green Version]
  18. Nielsen, T.R.; Drivsholm, C. Energy efficient demand controlled ventilation in single family houses. Energy Build. 2010, 42, 1995–1998. [Google Scholar] [CrossRef]
  19. Kim, K.; Kim, M.; Kwon, O.; Seok, Y.; Jeong, J. Application of Demand Controlled Ventilation in Multifamily Houses Meeting the Current Korean Ventilation Standards. J. KIAEBS 2009, 3, 192–200. [Google Scholar]
  20. Statistics Korea. Life Time Survey Results; Social Statistics Bureau Social Statistics Planning Division: Seoul, Korea, 2019.
  21. Statistics Korea. Residential Status Survey. 2019. Available online: https://kostat.go.kr (accessed on 5 February 2021).
  22. Korean Standard. KS F 2603. In Standard Test Method for Measuring Indoor Ventilation Rate (Carbon Dioxide Method); Korean Standard: Seoul, Korea, 2016. [Google Scholar]
  23. Wallace, L.; Emmerich, S.; Howard-reed, C. Continuous measurements of air change rates in an occupied house for 1year: The effect of temperature, wind fans, and windows. J. Exp. Anal. Environ. Epidemiol. 2002, 12, 296–306. [Google Scholar] [CrossRef] [PubMed] [Green Version]
Figure 1. Apartment unit plan and room sizes for experiments.
Sustainability 13 10302 g001
Figure 2. (a) Flow metering system (*FMS) and supply diffuser; (b) duct plan diagram; (c) heat recovery ventilator.
Sustainability 13 10302 g002
Figure 3. Equipment for experiments: (a) CO2 Sensor; (b) data logger.
Sustainability 13 10302 g003
Figure 4. Maximum residence for three cases: (a) LR + K; (b) R2 + R3; (c) R1.
Sustainability 13 10302 g004
Figure 5. Calculated CO2 concentration rates of LR + K, based on the experimental conditions with error ranges. * The bold text cases are analyzed by numerical calculations and error ranges without experiments in Table 2.
Sustainability 13 10302 g005
Figure 6. Calculated CO2 concentration rates of (a) R1, (b) R2, and (c) R3, based on the experimental conditions with error ranges. * The bold text cases are analyzed by numerical calculations and error ranges without experiments in Table 2.
Sustainability 13 10302 g006aSustainability 13 10302 g006b
Table 1. Infiltration rate analyzed by measurements.
CaseLR + KR1R2R3
Max0.370.610.250.41
Min0.250.230.150.23
Average0.330.410.200.30
Volume (m3)102.133.829.032.6
Table 2. Experimental results.
ACH_O *LR + K
E.V. (C.V.)
(ppm)
Dif.
(%)
R1
E.V. (C.V.)2
(ppm)
Dif.
(%)
R2
E.V. (C.V.)
(ppm)
Dif.
(%)
R3
E.V. (C.V.)
(ppm)
Dif.
(%)
0ACH_1602(669)−61002(1066)−61459(1396)+51231(1326)−7
0ACH_2931(966)−11875(1873)−12385(2372)+12389(2458)−3
0.5ACH_1582(603)−3806(856)−6980(1088)−10982(1096)−10
0.5ACH_2710(756)−61488(1400)+61732(1757)−11651(1772)−7
1.0ACH_1520(530)−2693(736)−6747(838)−11860(903)−5
1.0ACH_2630(667)−51002(1130)−111476(1361)+61361(1385)−2
* ACH: air change per hour, O: occupants (person), E.V.: experimental values, C.V.: calculated values, Dif.: difference between E.V. and C.V.
Publisher’s Note: MDPI stays neutral with regard to jurisdictional claims in published maps and institutional affiliations.

