
A Novel Non-Intrusive Vibration Energy Harvesting Method for Air Conditioning Compressor Unit


 ,
, 
Abstract
1. Introduction
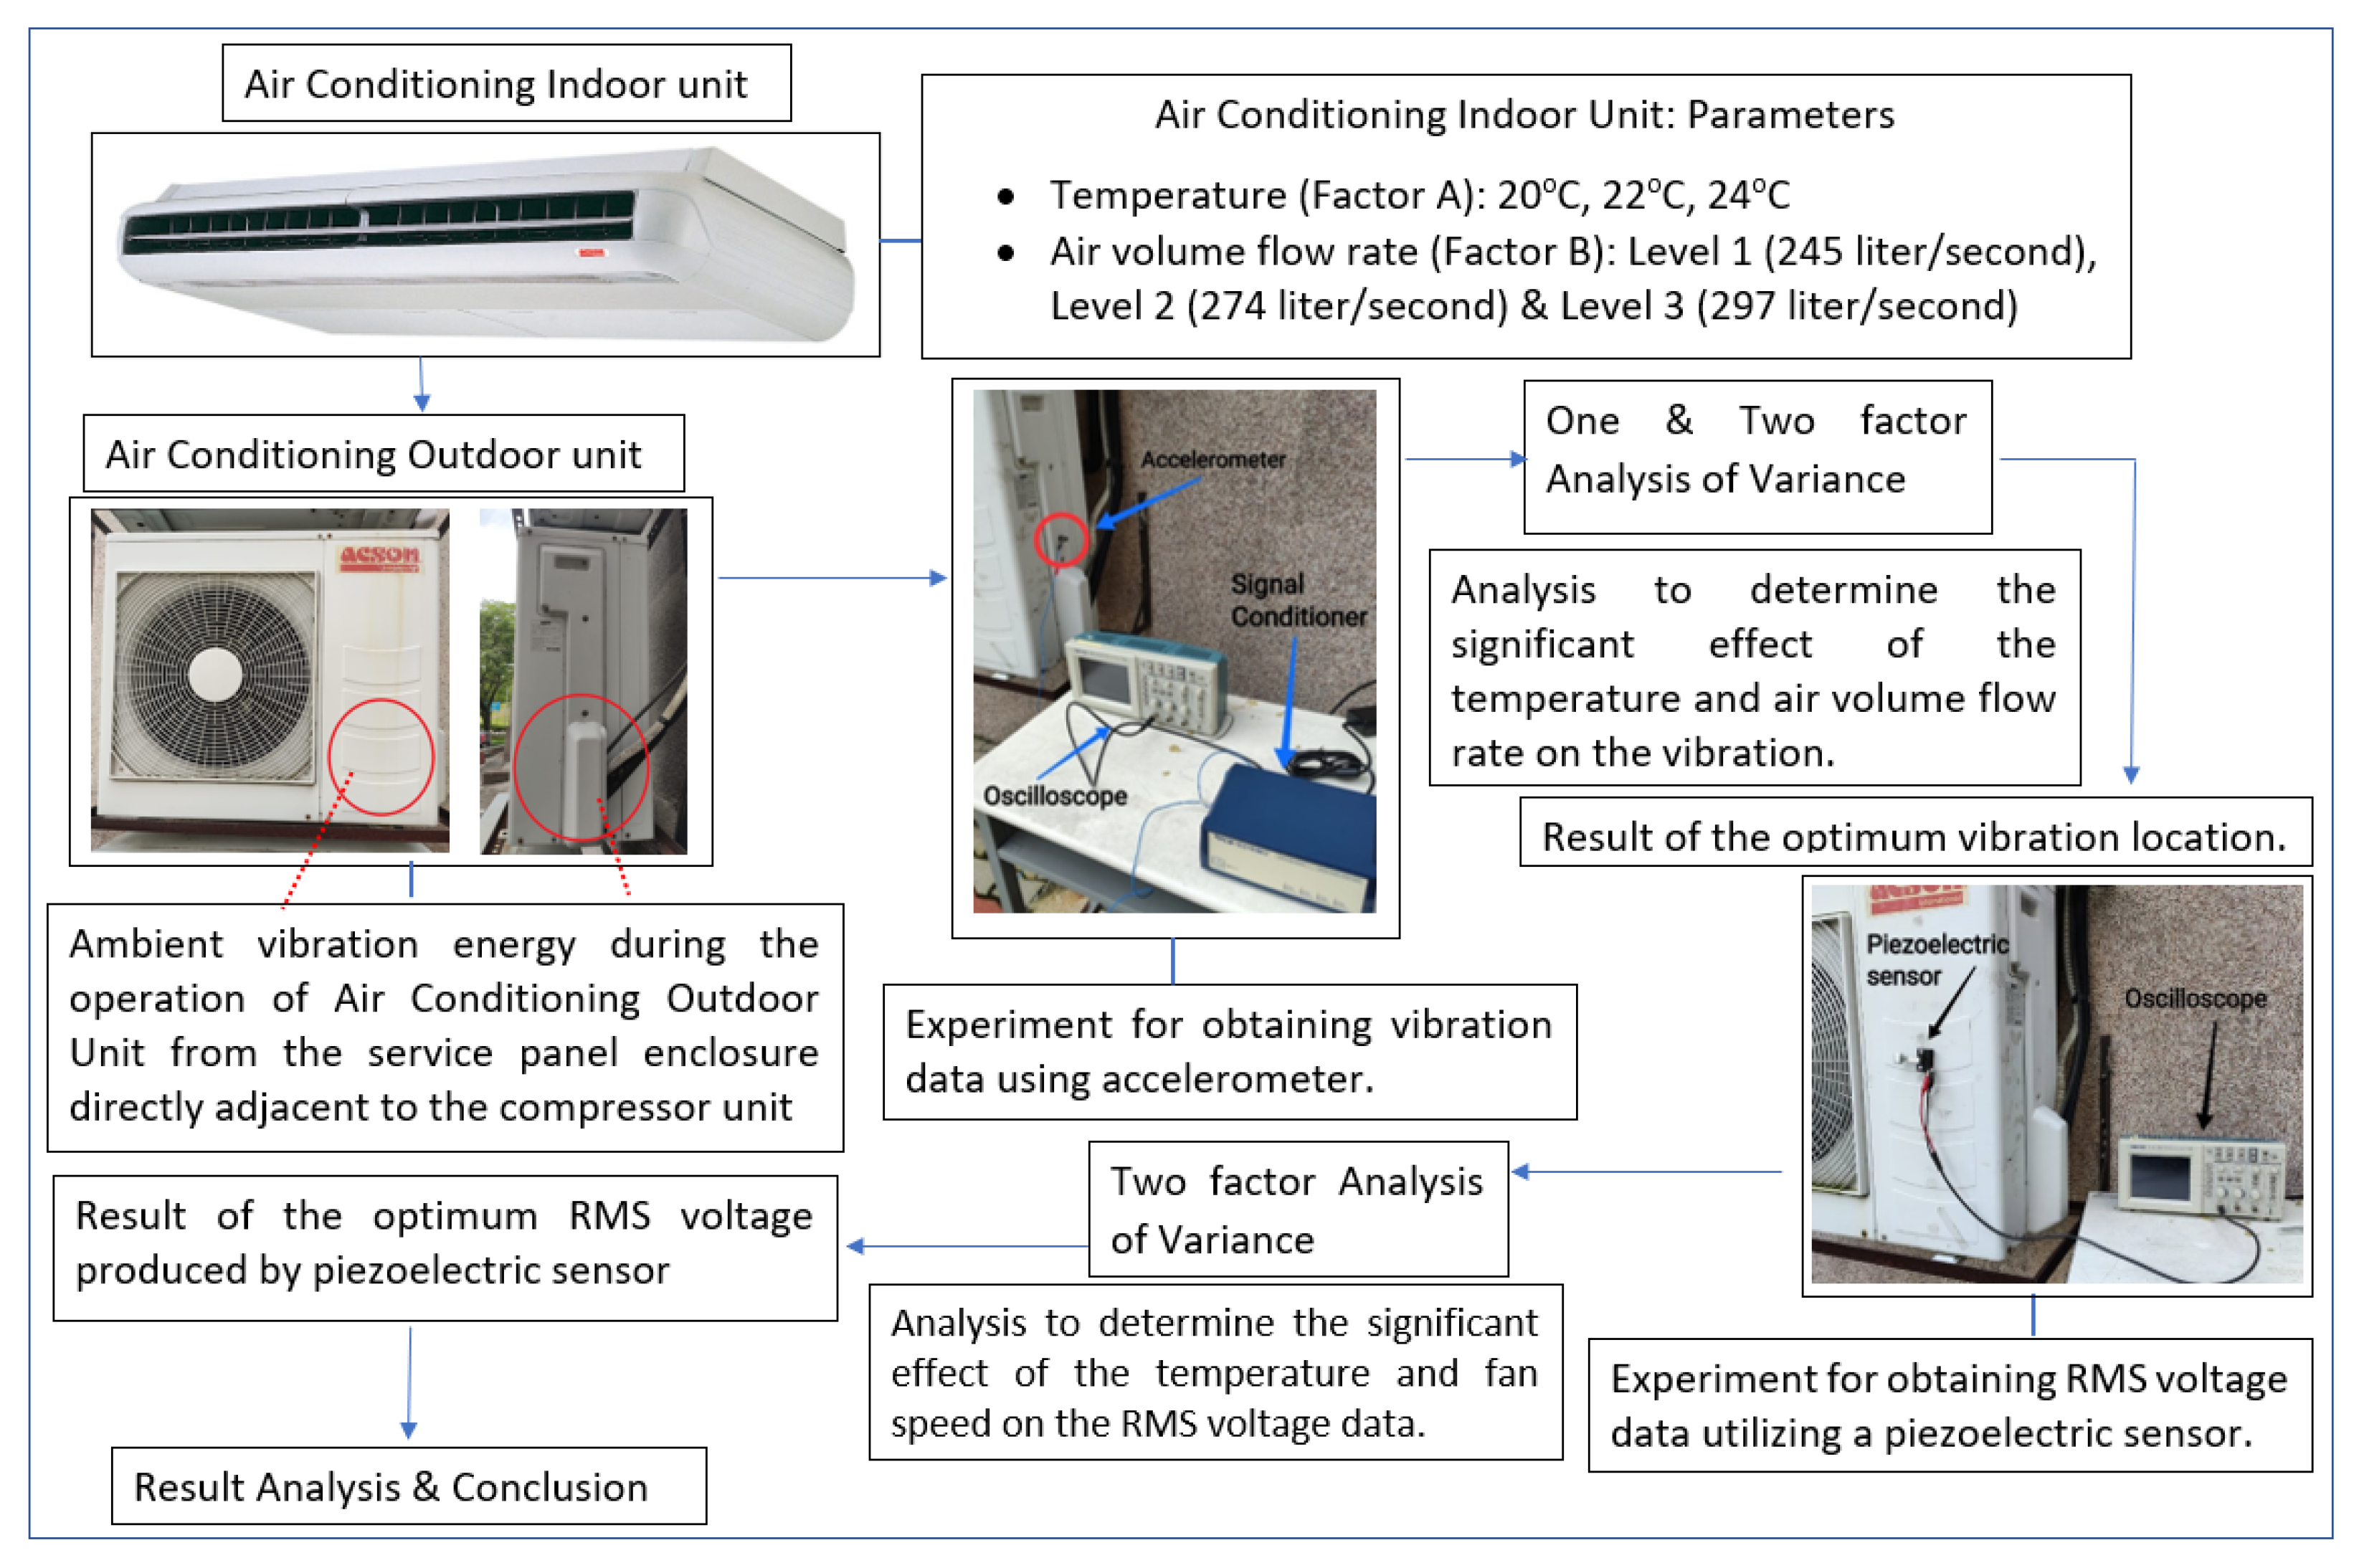
2. Materials and Methods
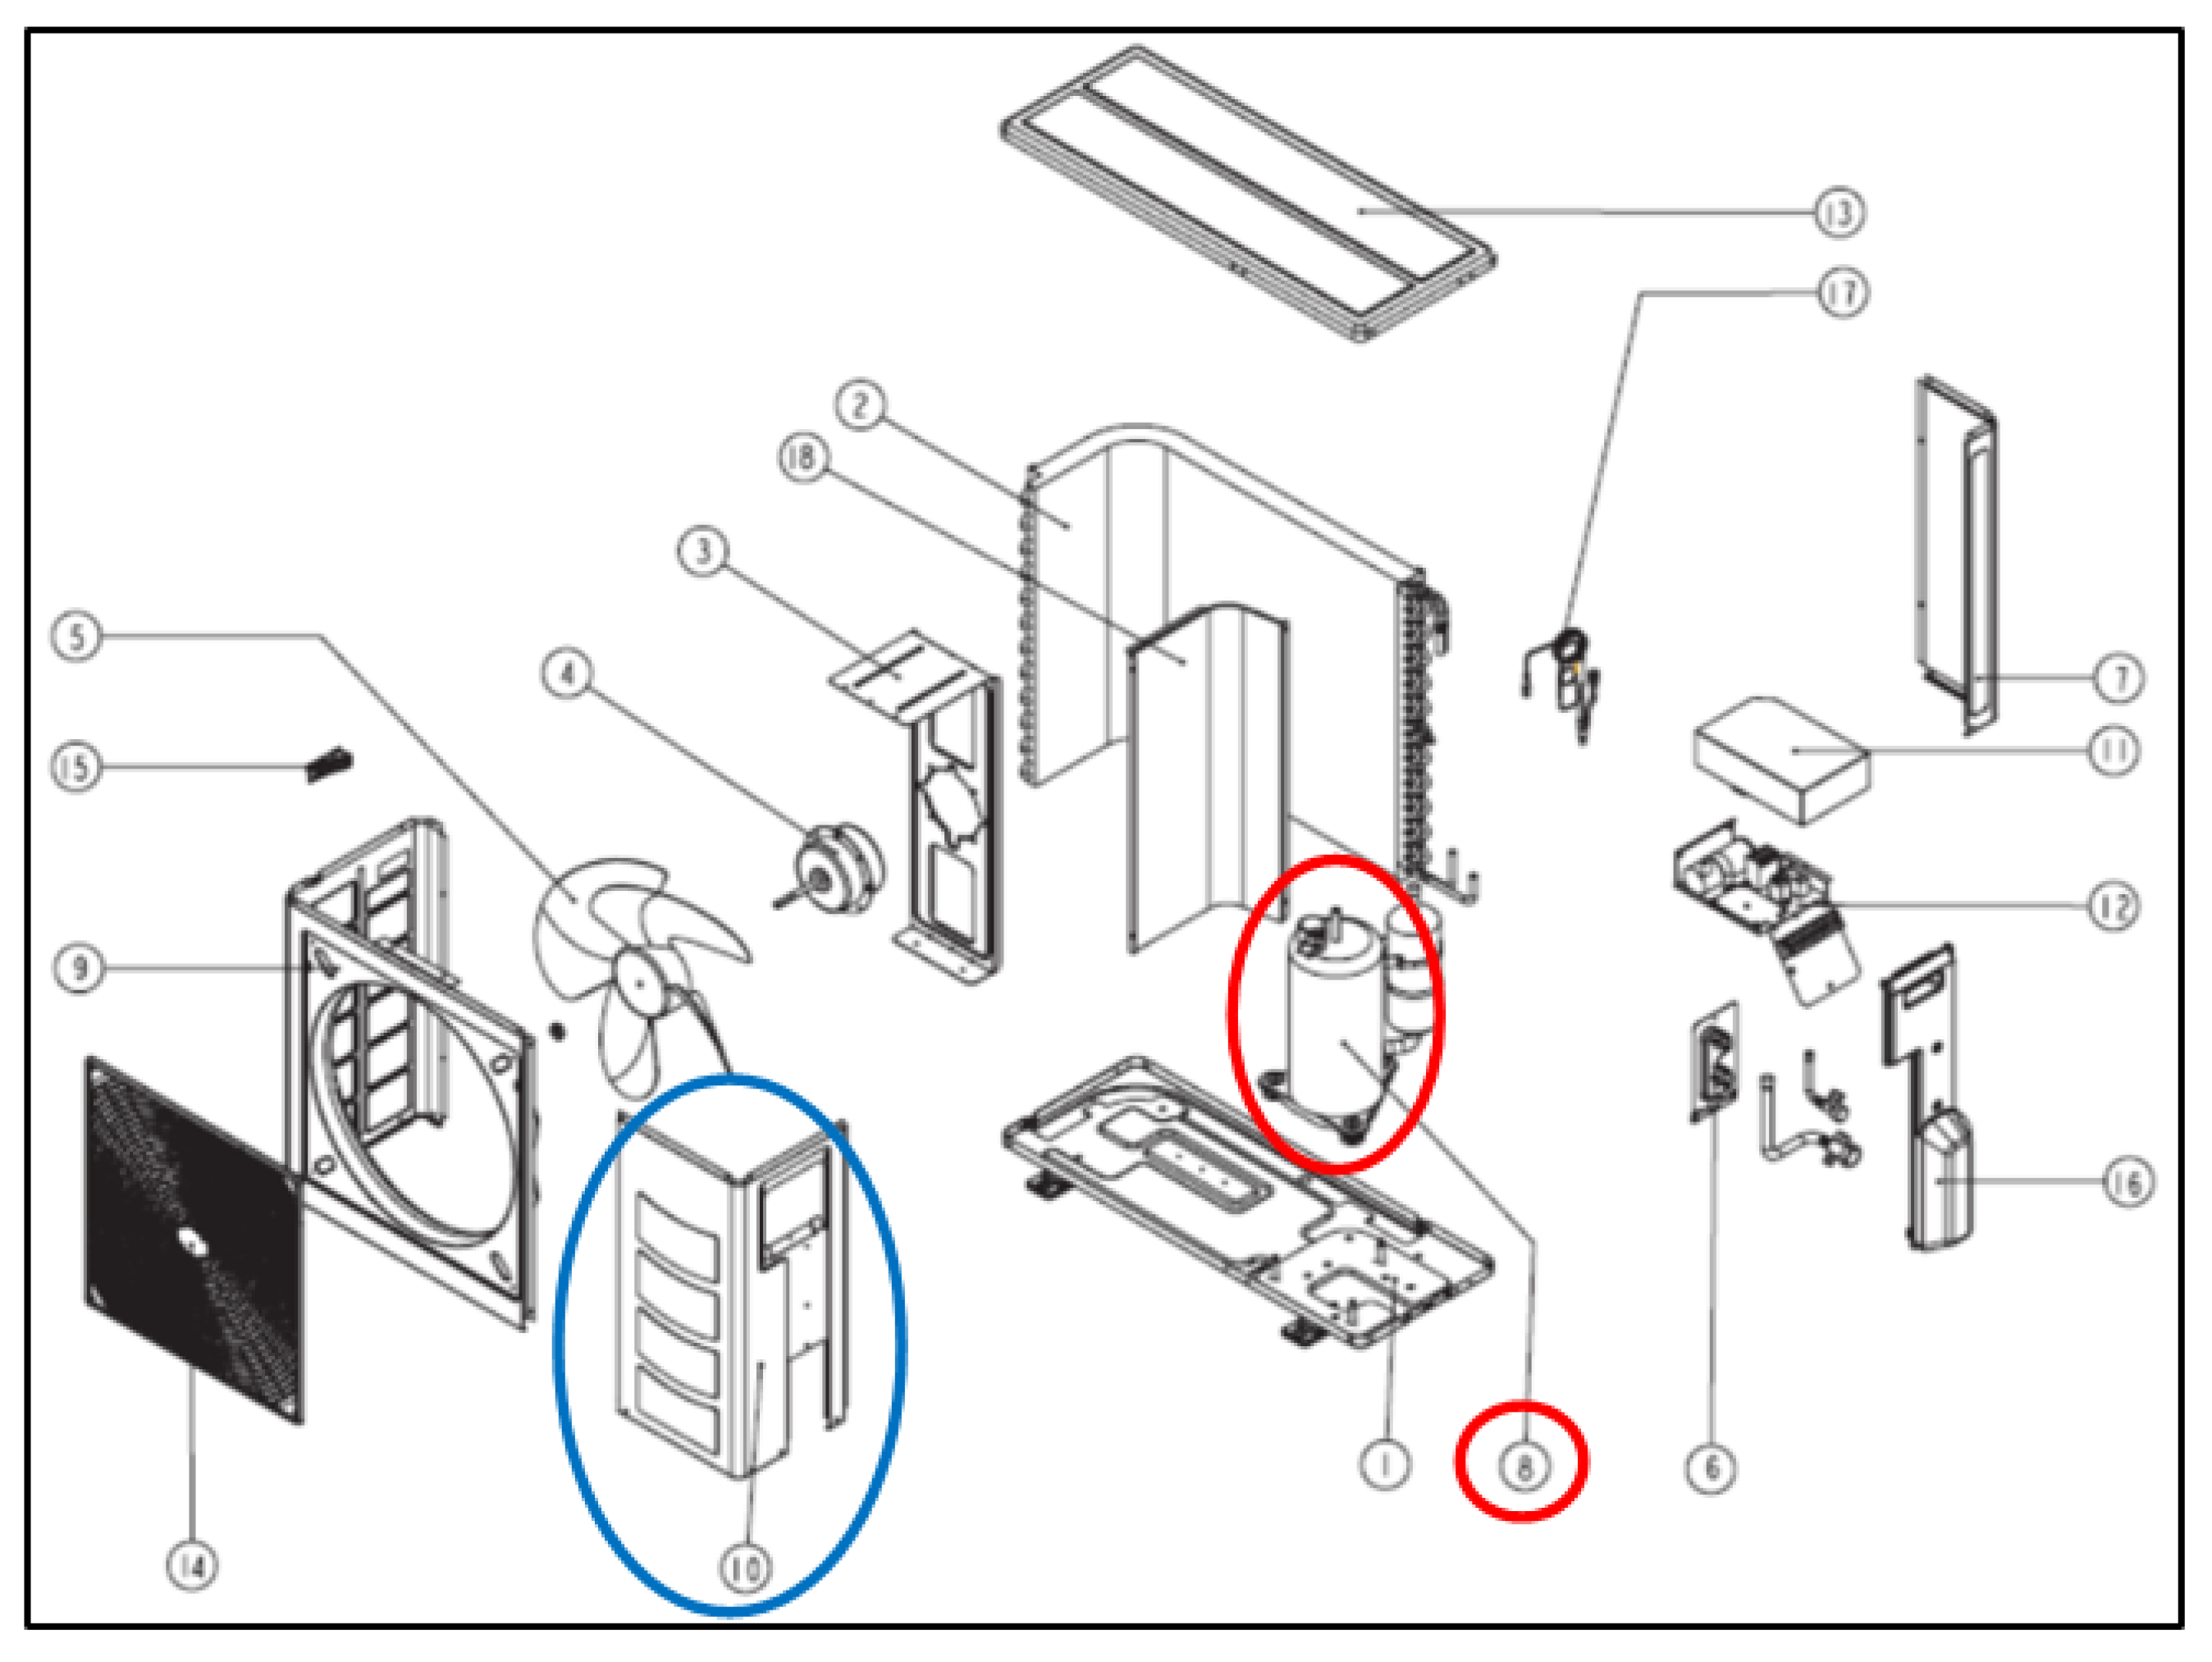
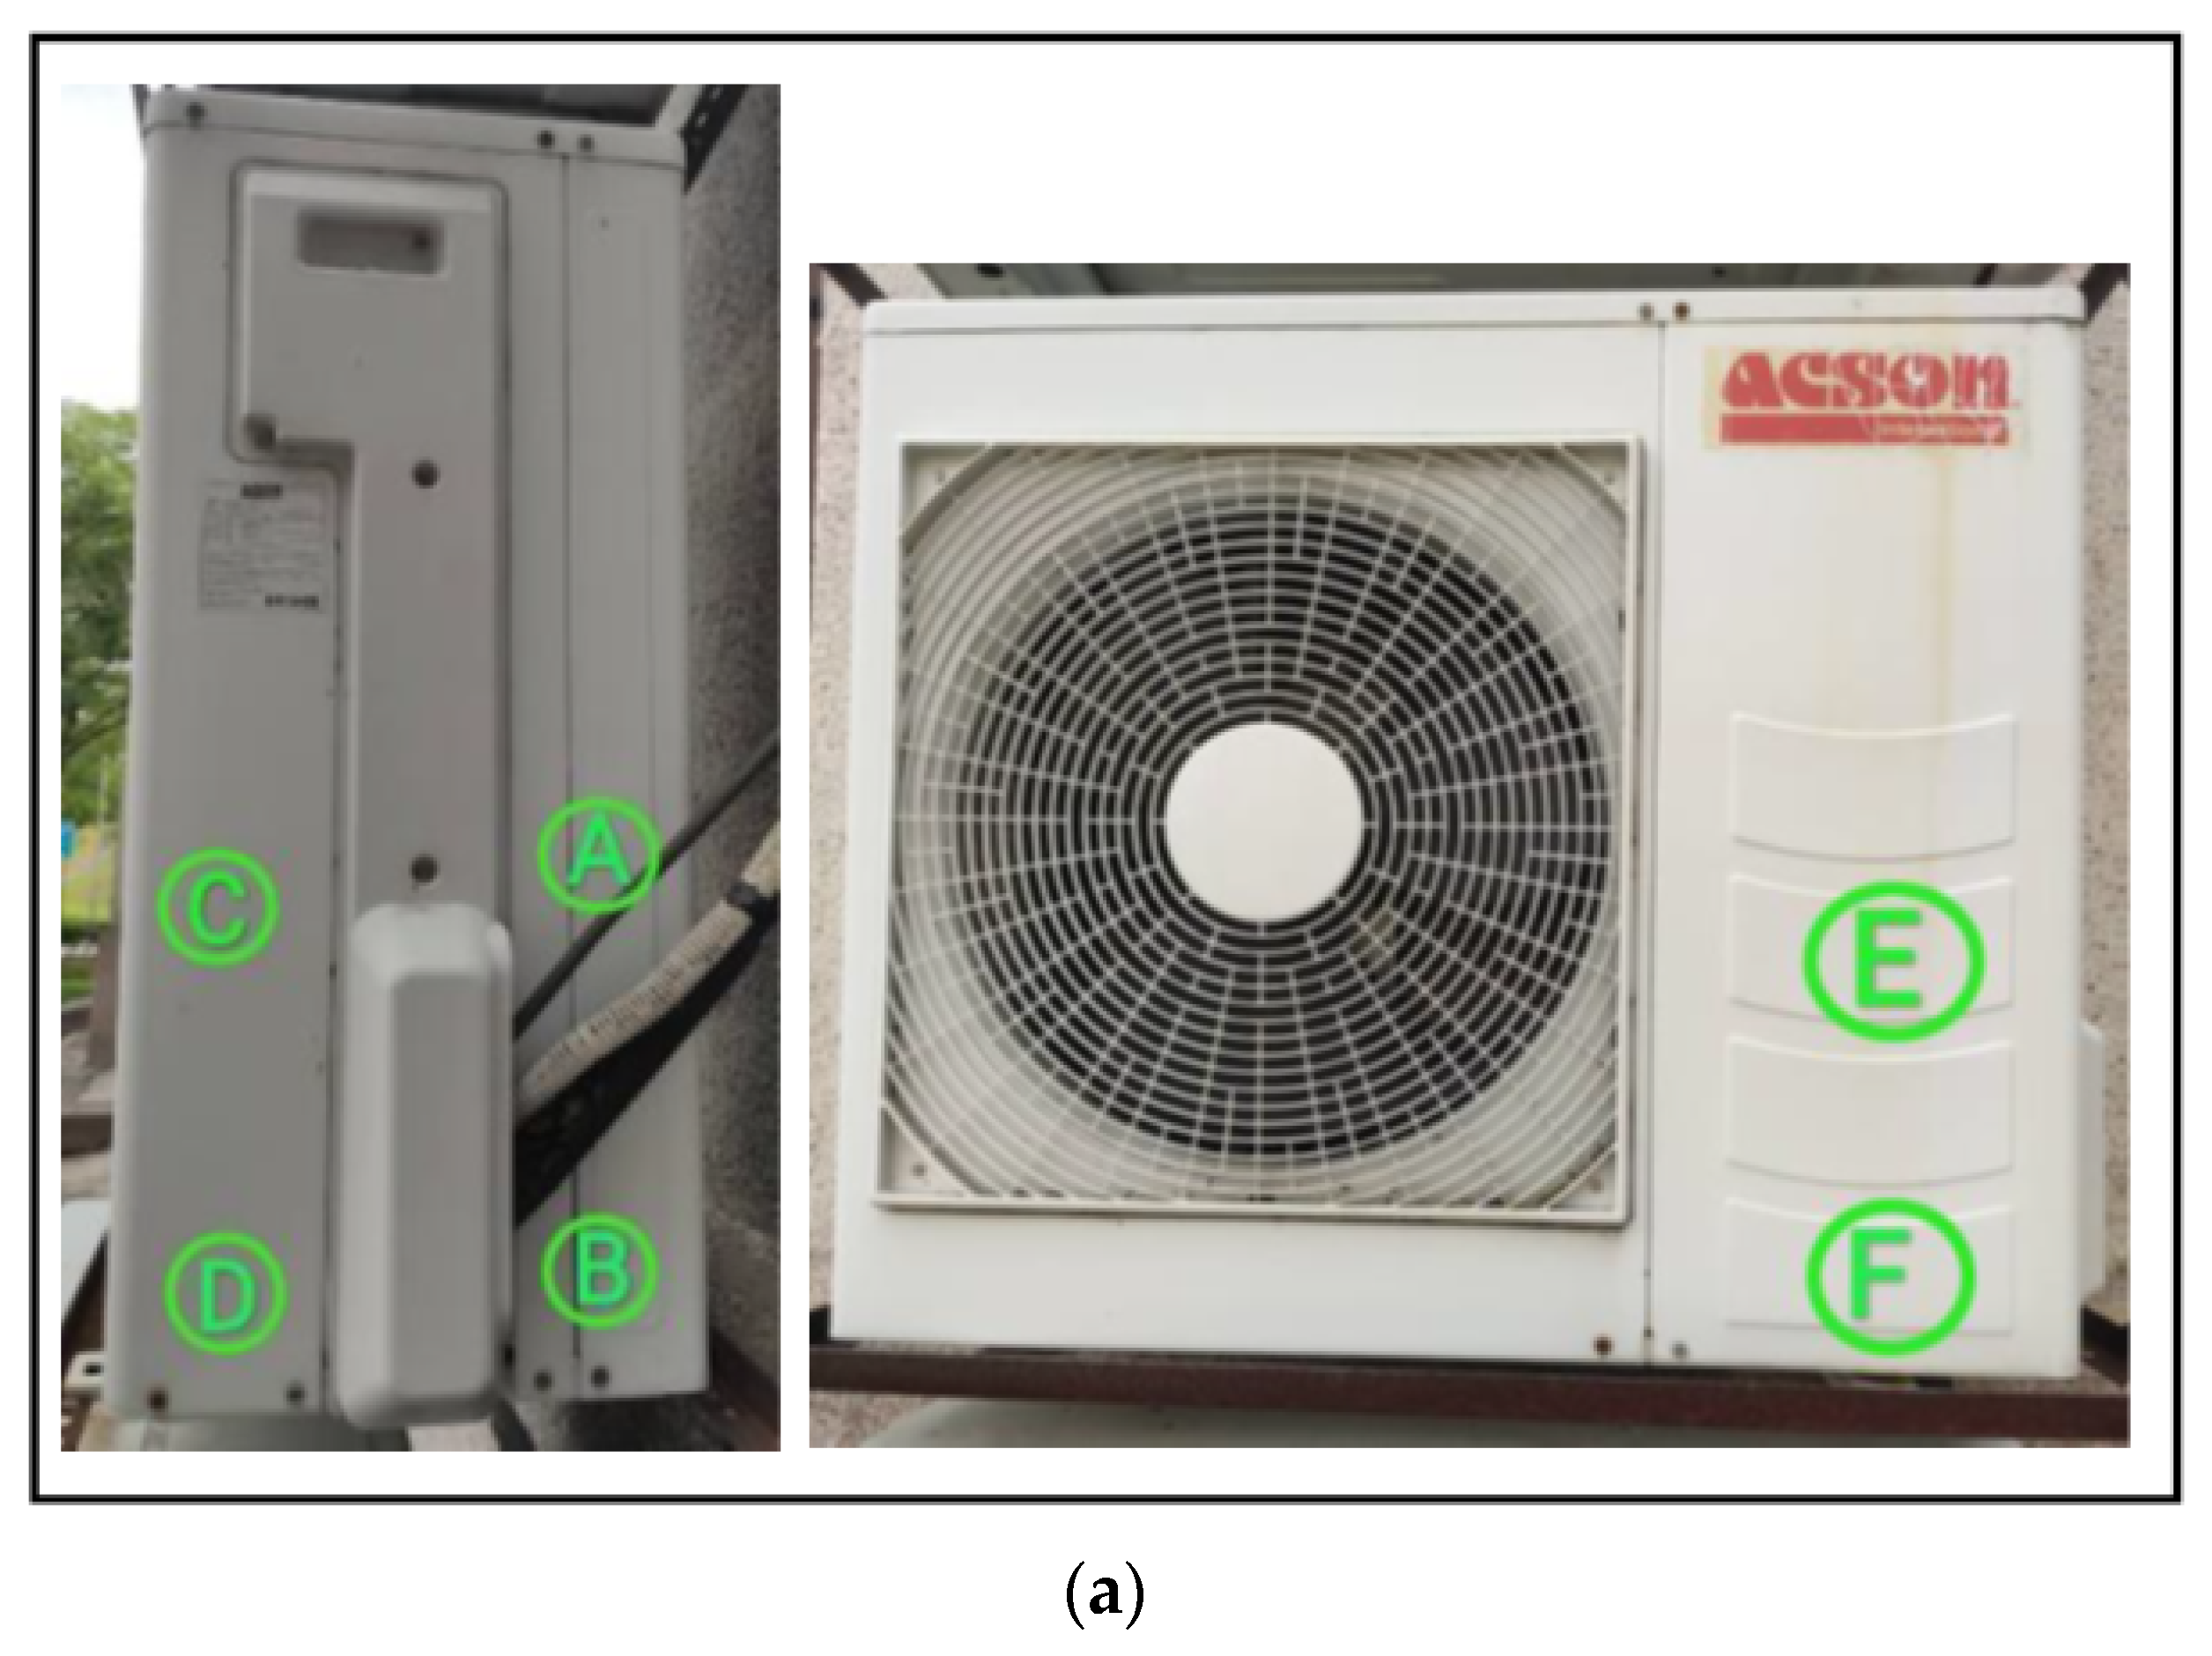
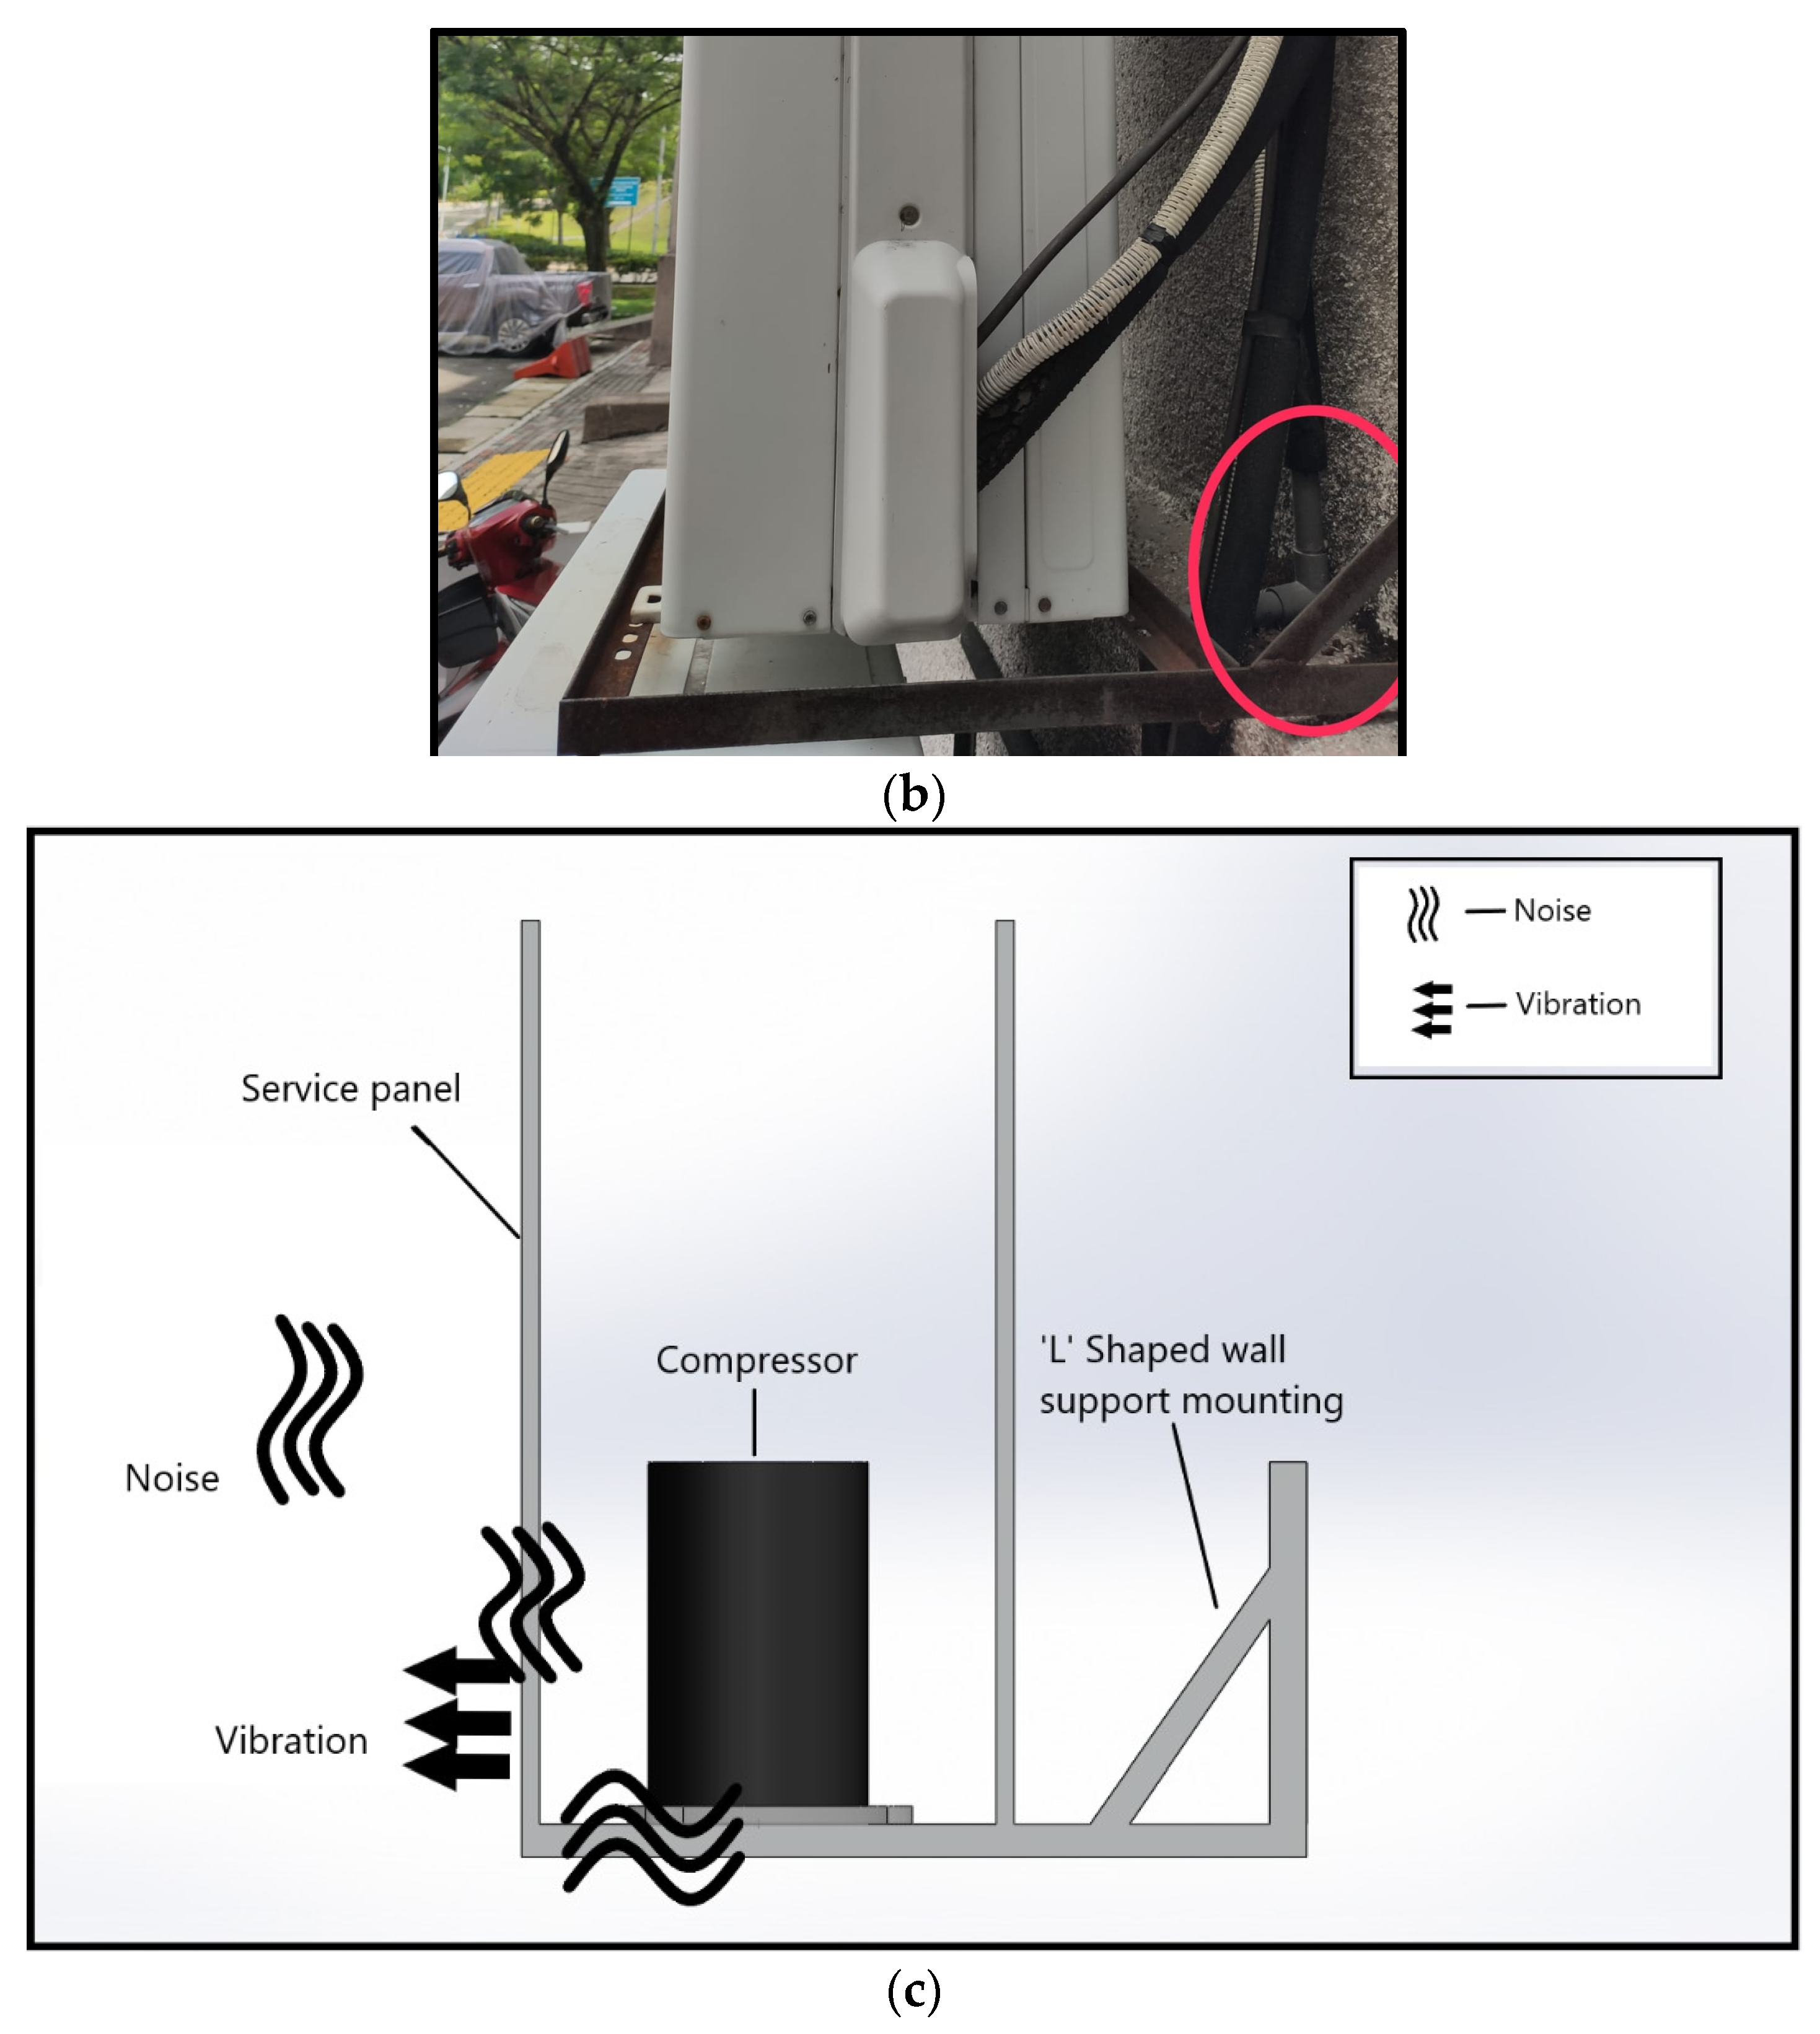
2.1. Air Conditioning Outdoor Unit
2.2. Air Conditioning Indoor Unit
2.3. Accelerometer
2.4. Piezoelectric Sensor
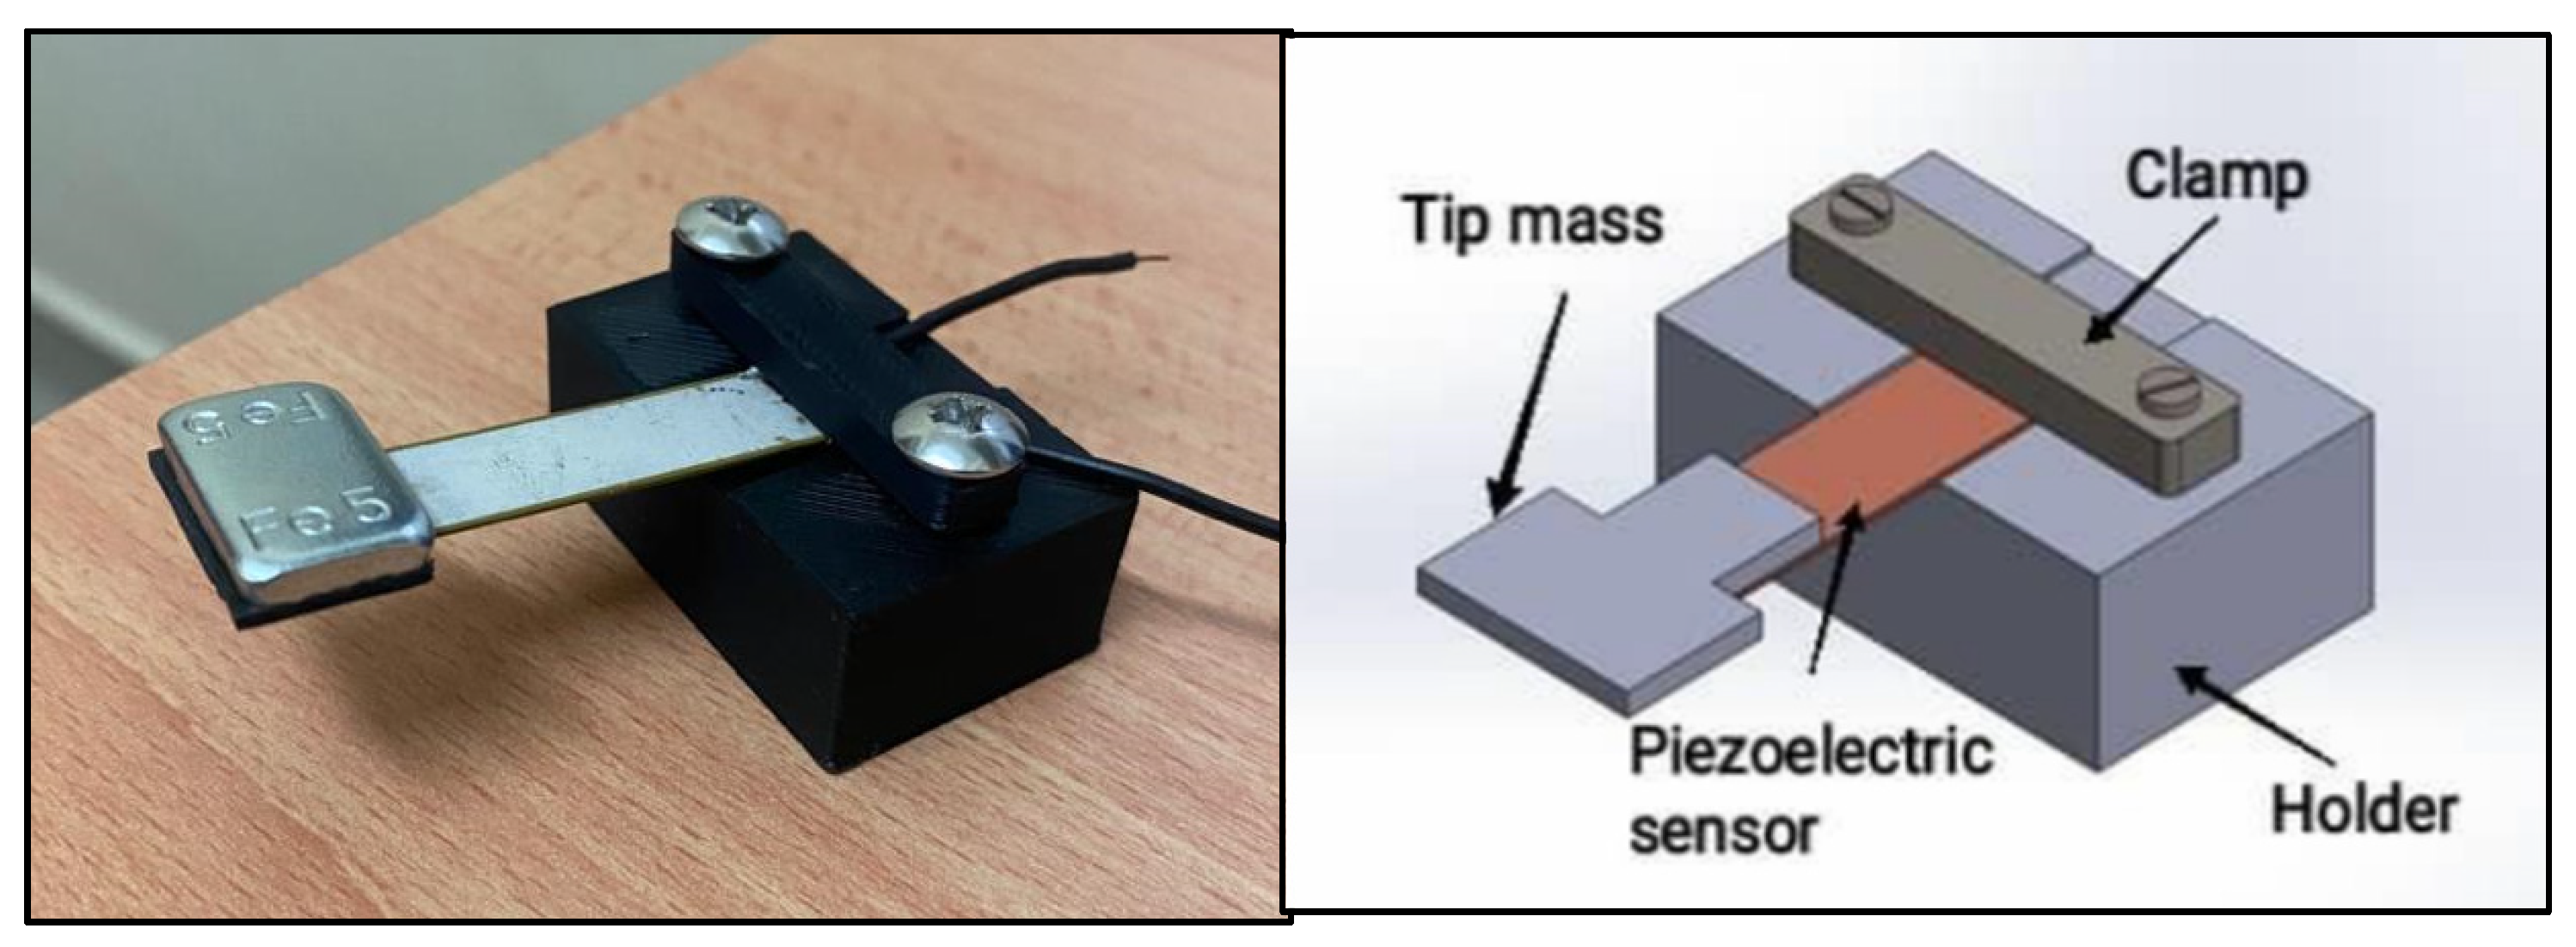
2.5. 3D Printed and Custom-Made Mounting for Piezoelectric Sensor
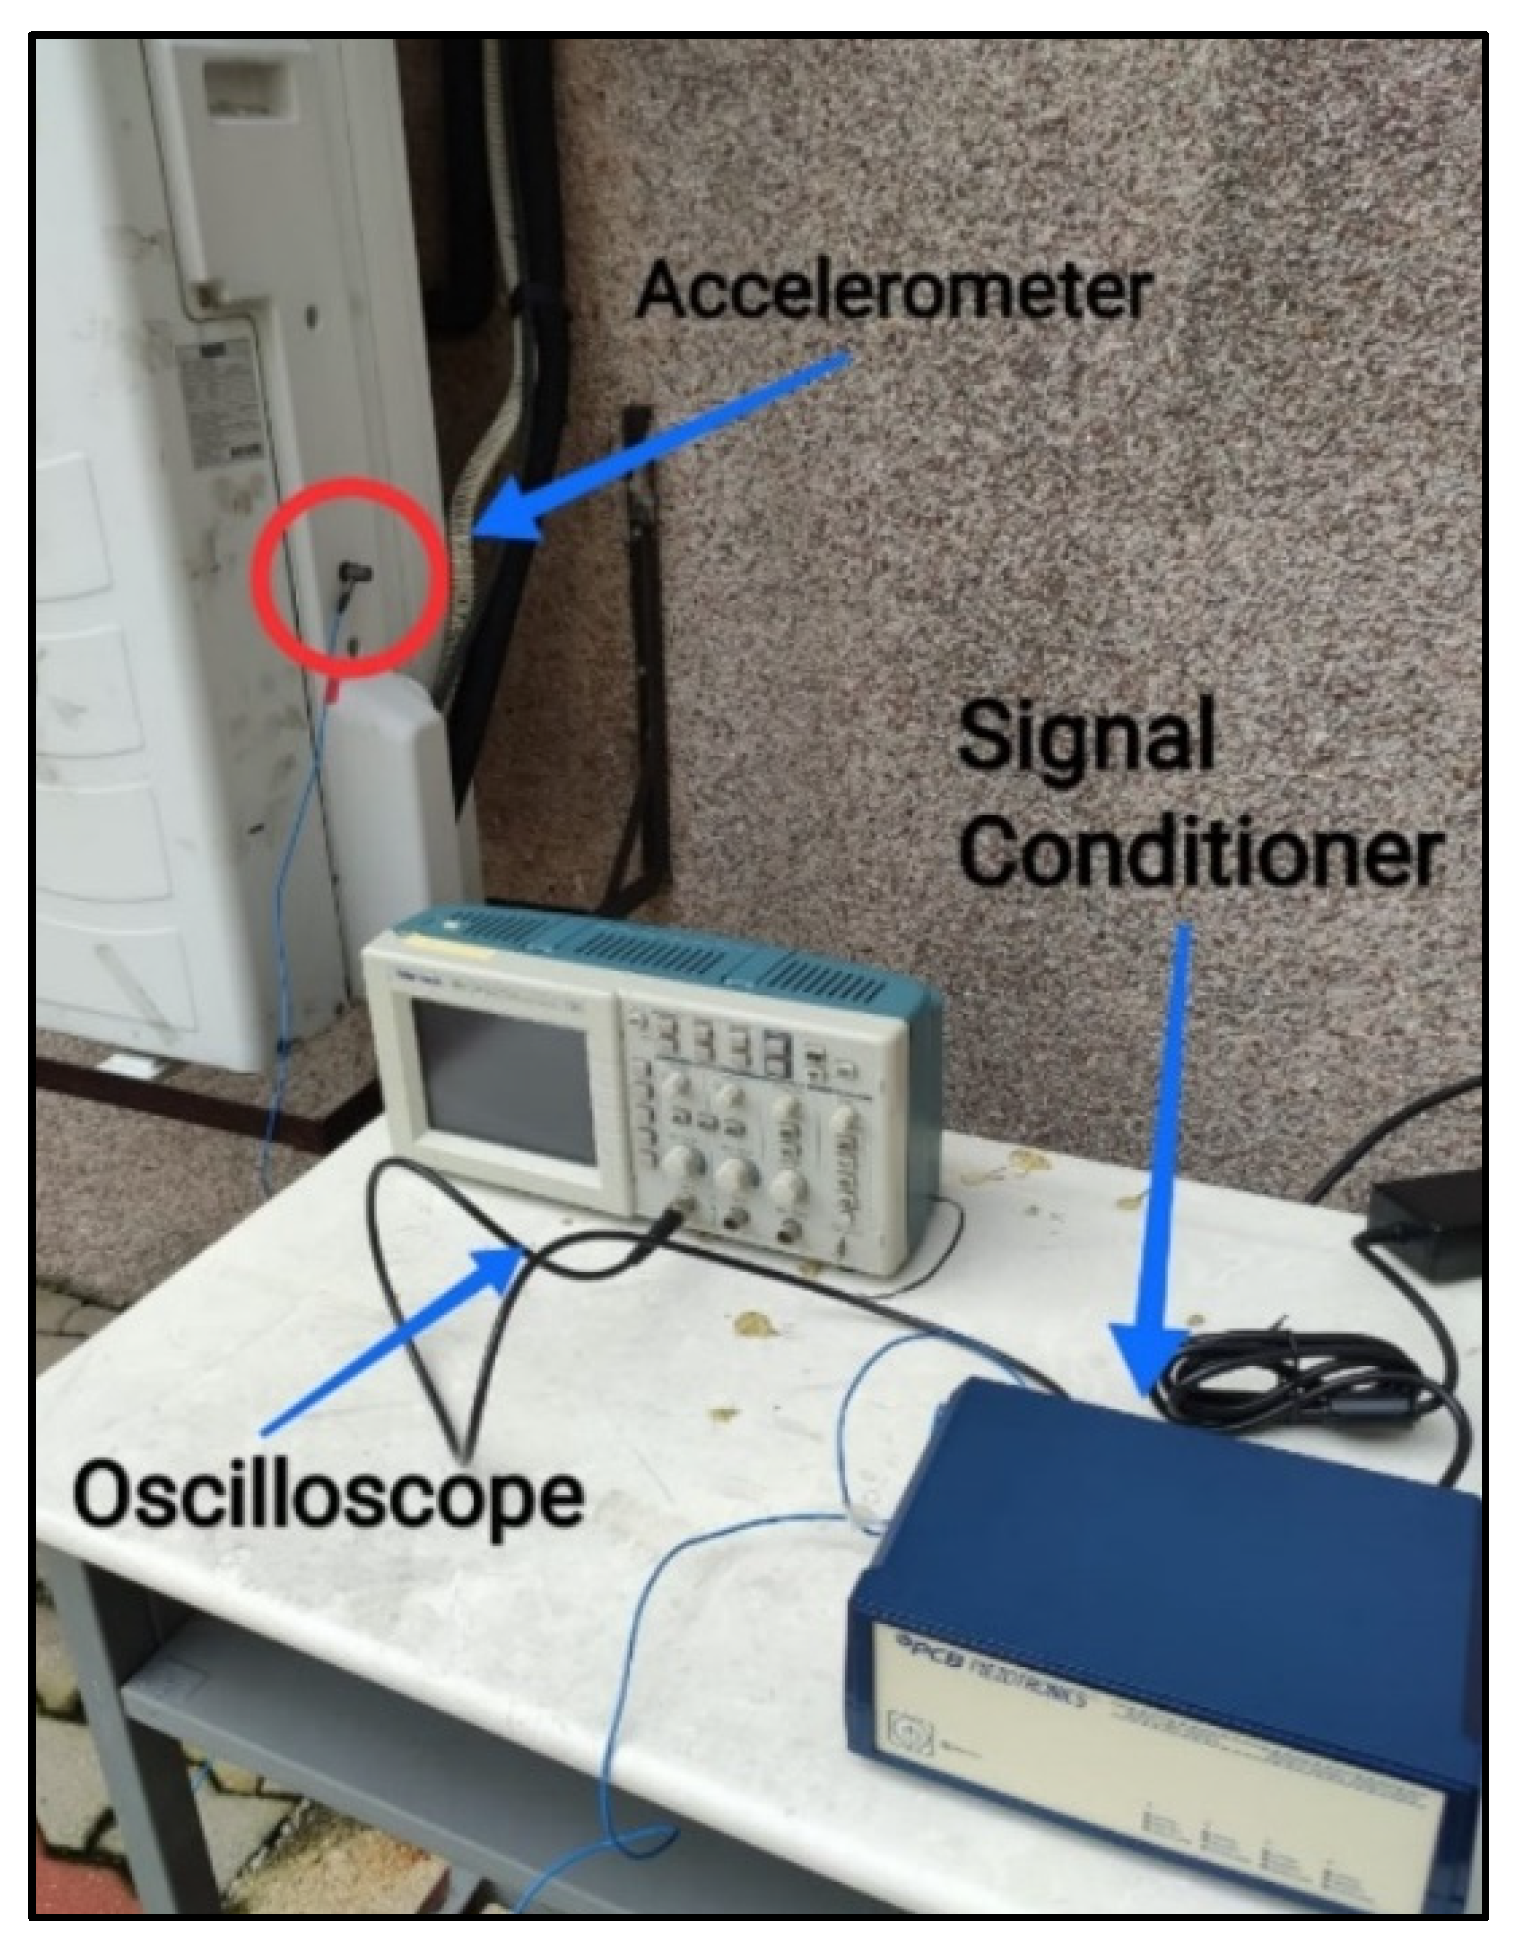
2.6. Experimental Setup to Obtain Vibration Data
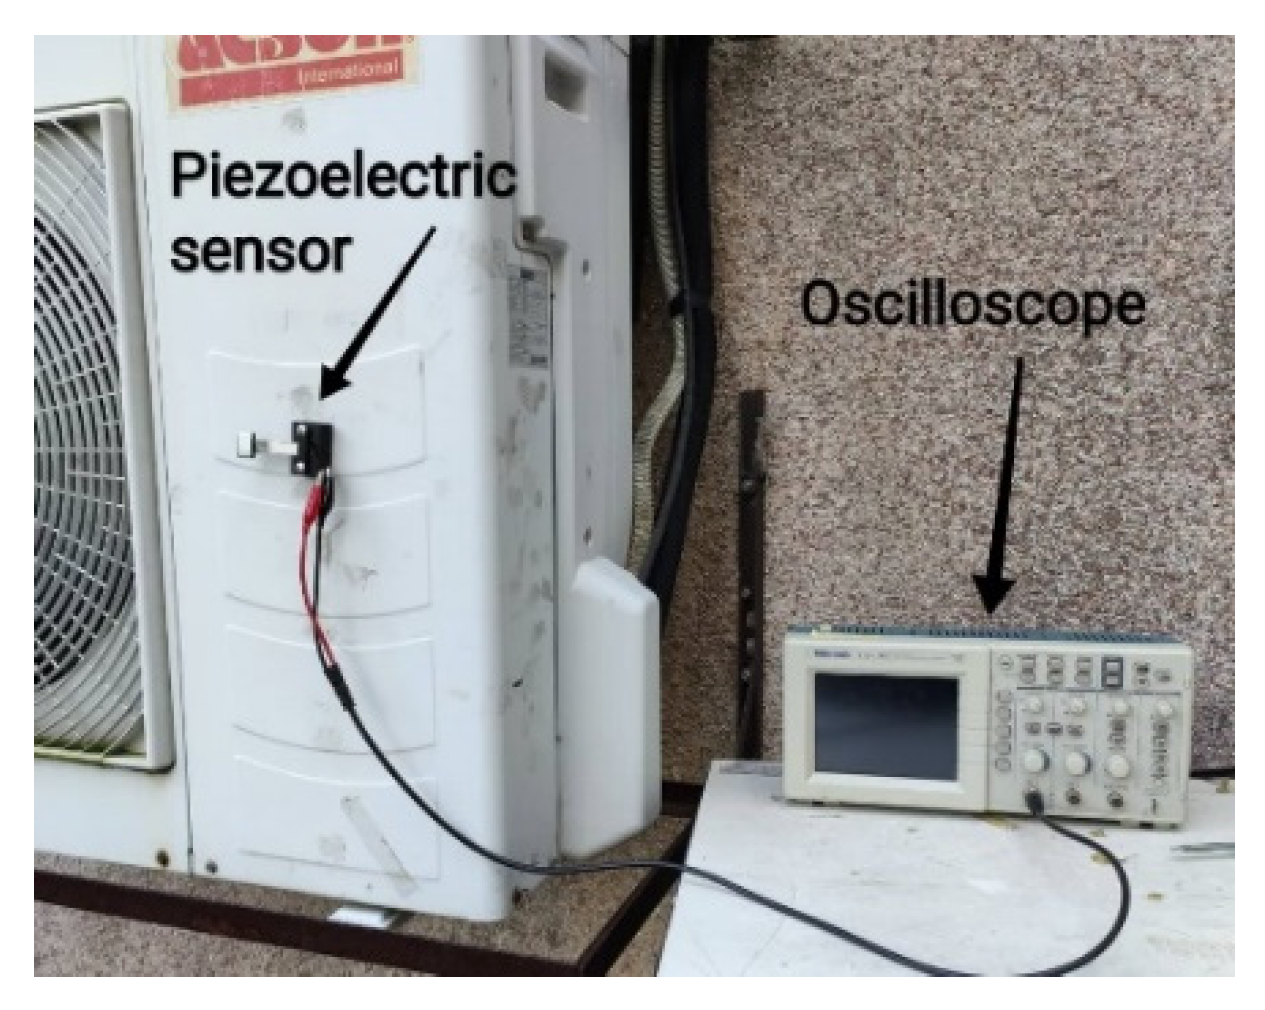
2.7. Experimental Setup for Piezoelectric Sensor
2.8. RMS Voltage Calculation
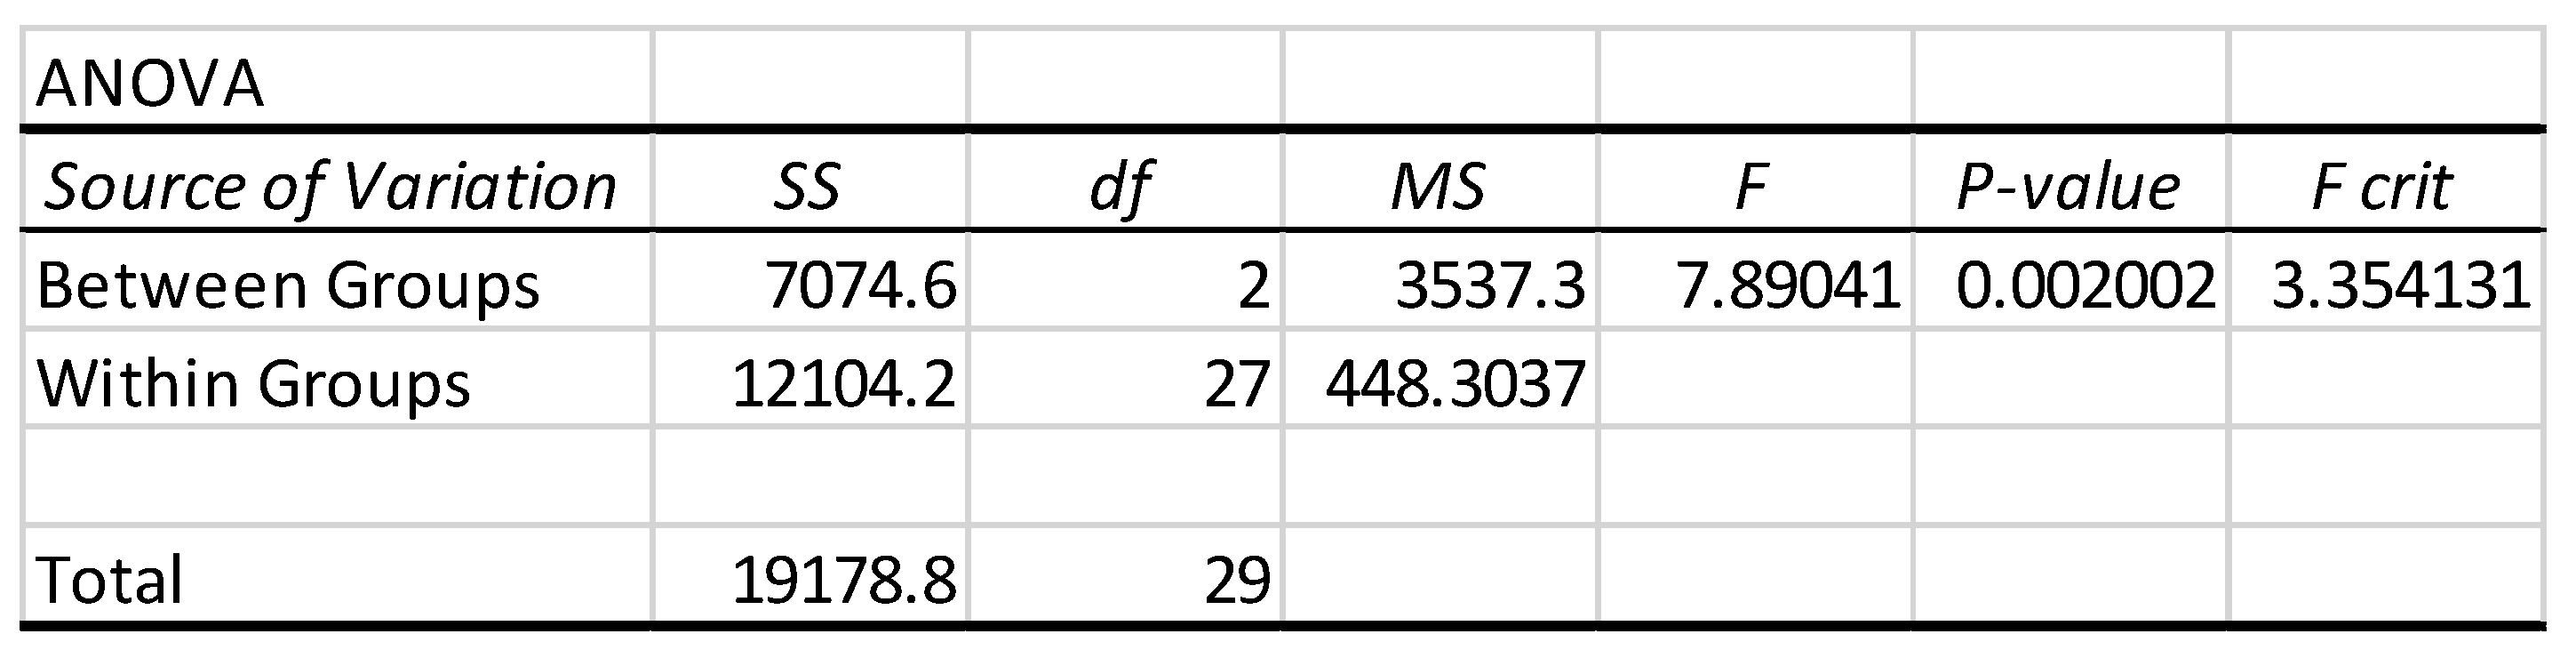
2.9. Data Analysis Using the One Factor Analysis of Variance (ANOVA)
- k = Number of groups;
- n = Total sample size (all groups combined);
- nk = Sample size of group k;
- = Sample mean of group k;
- = Grand mean.
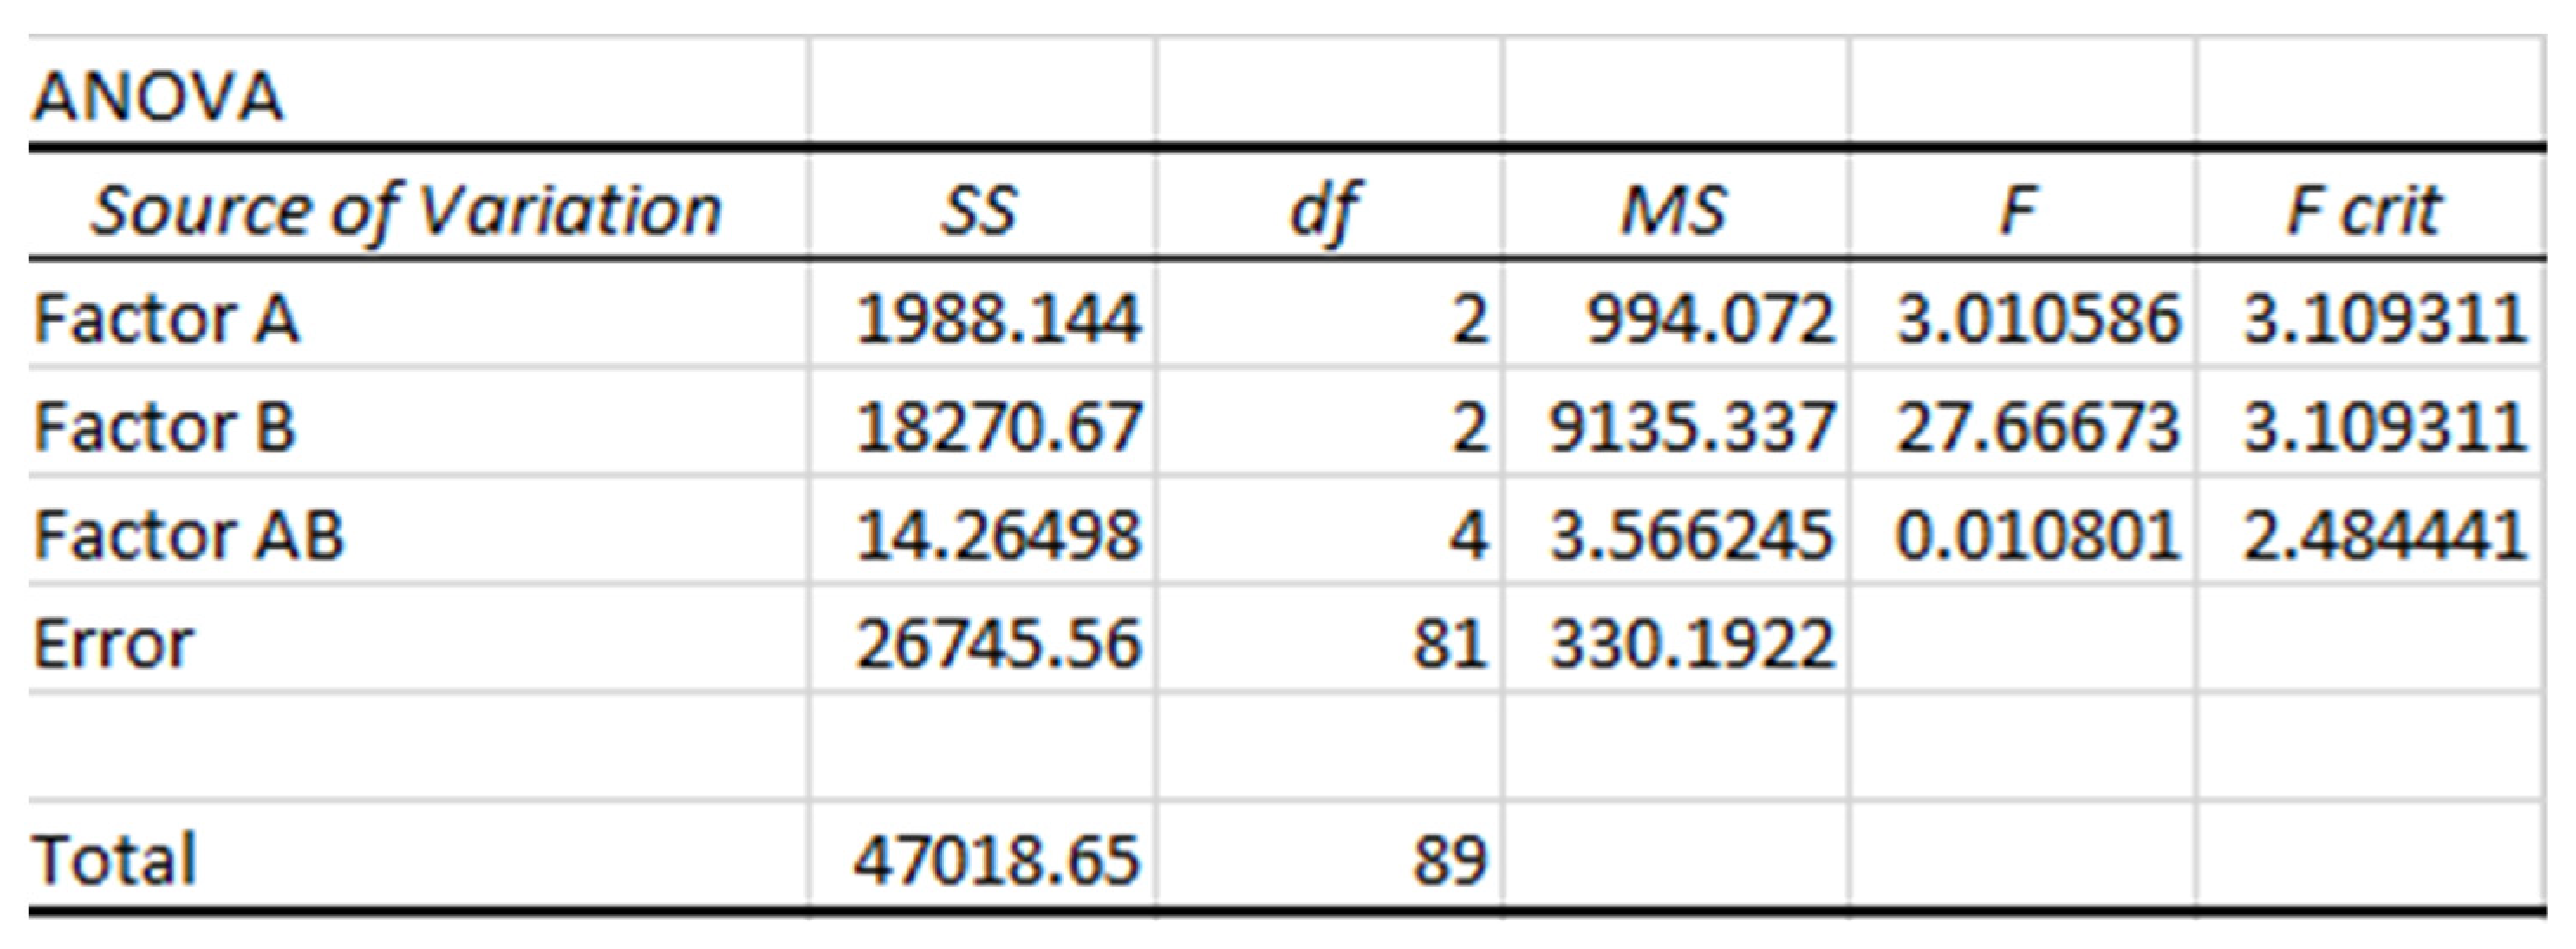
2.10. Data Analysis Using the Two Factor Analysis of Variance (ANOVA)
- a = number of levels in factor A;
- b = number of levels in factor B;
- c = total number of trials.
3. Results and Discussion
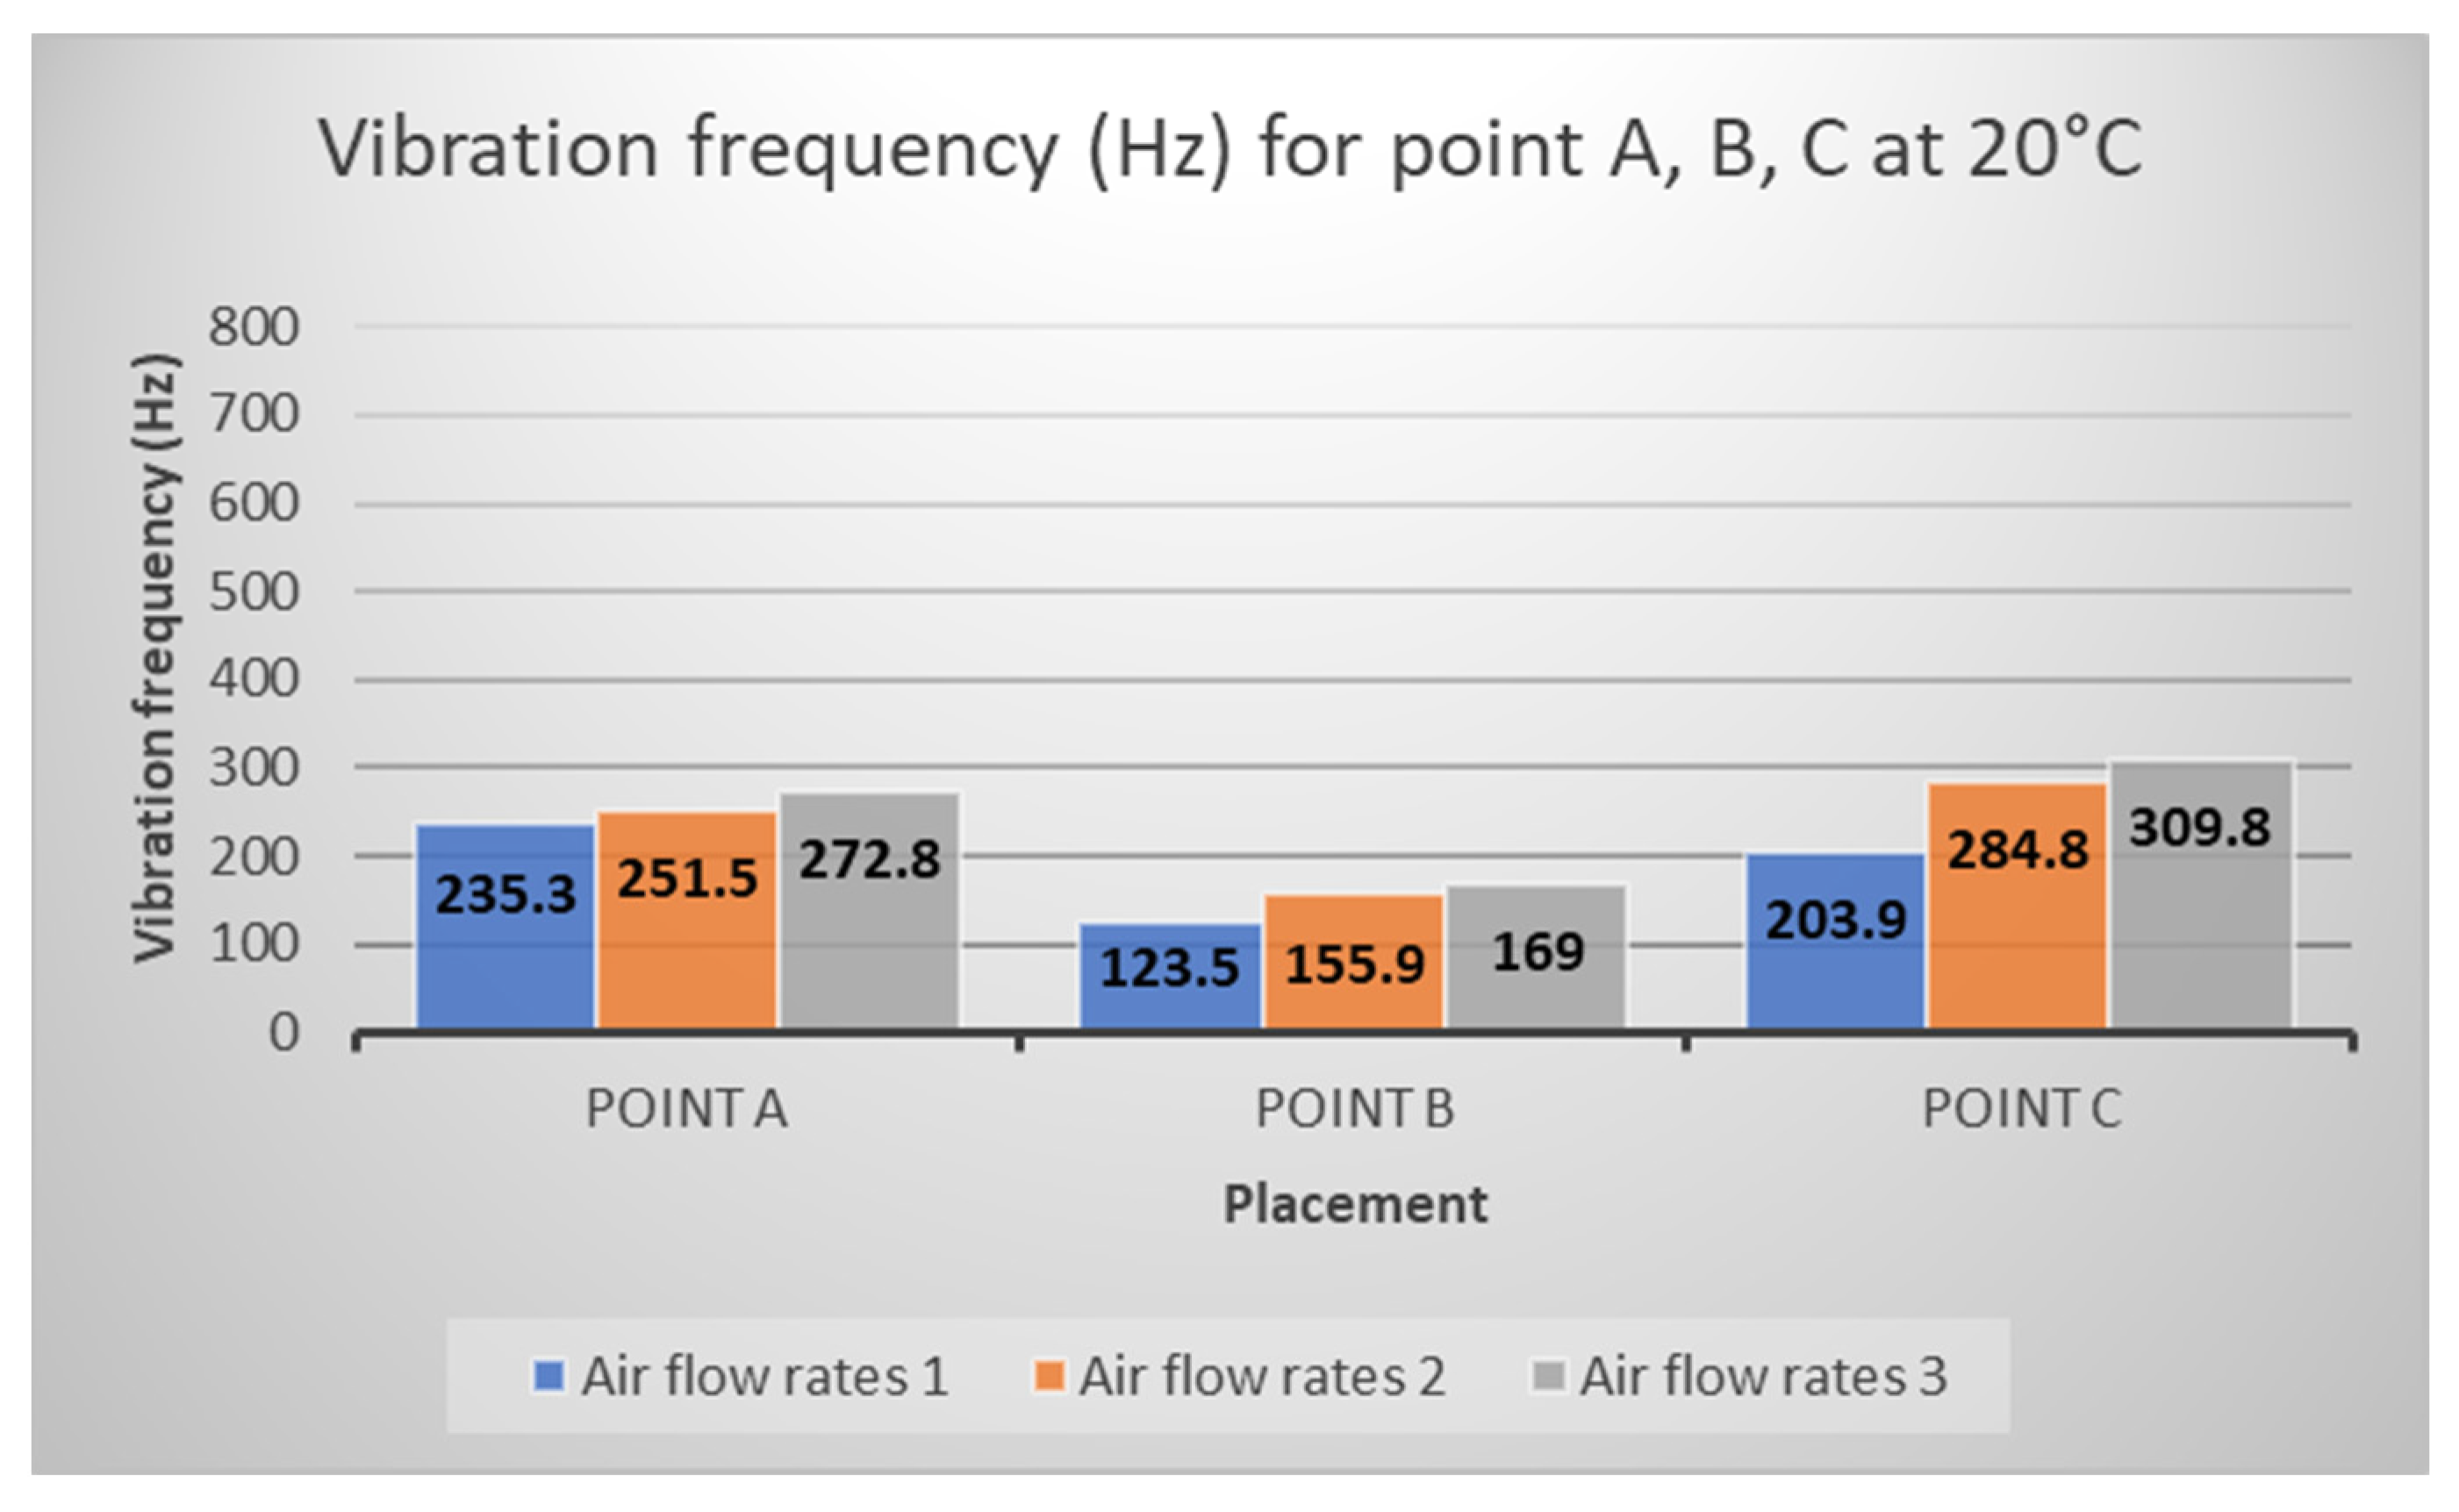
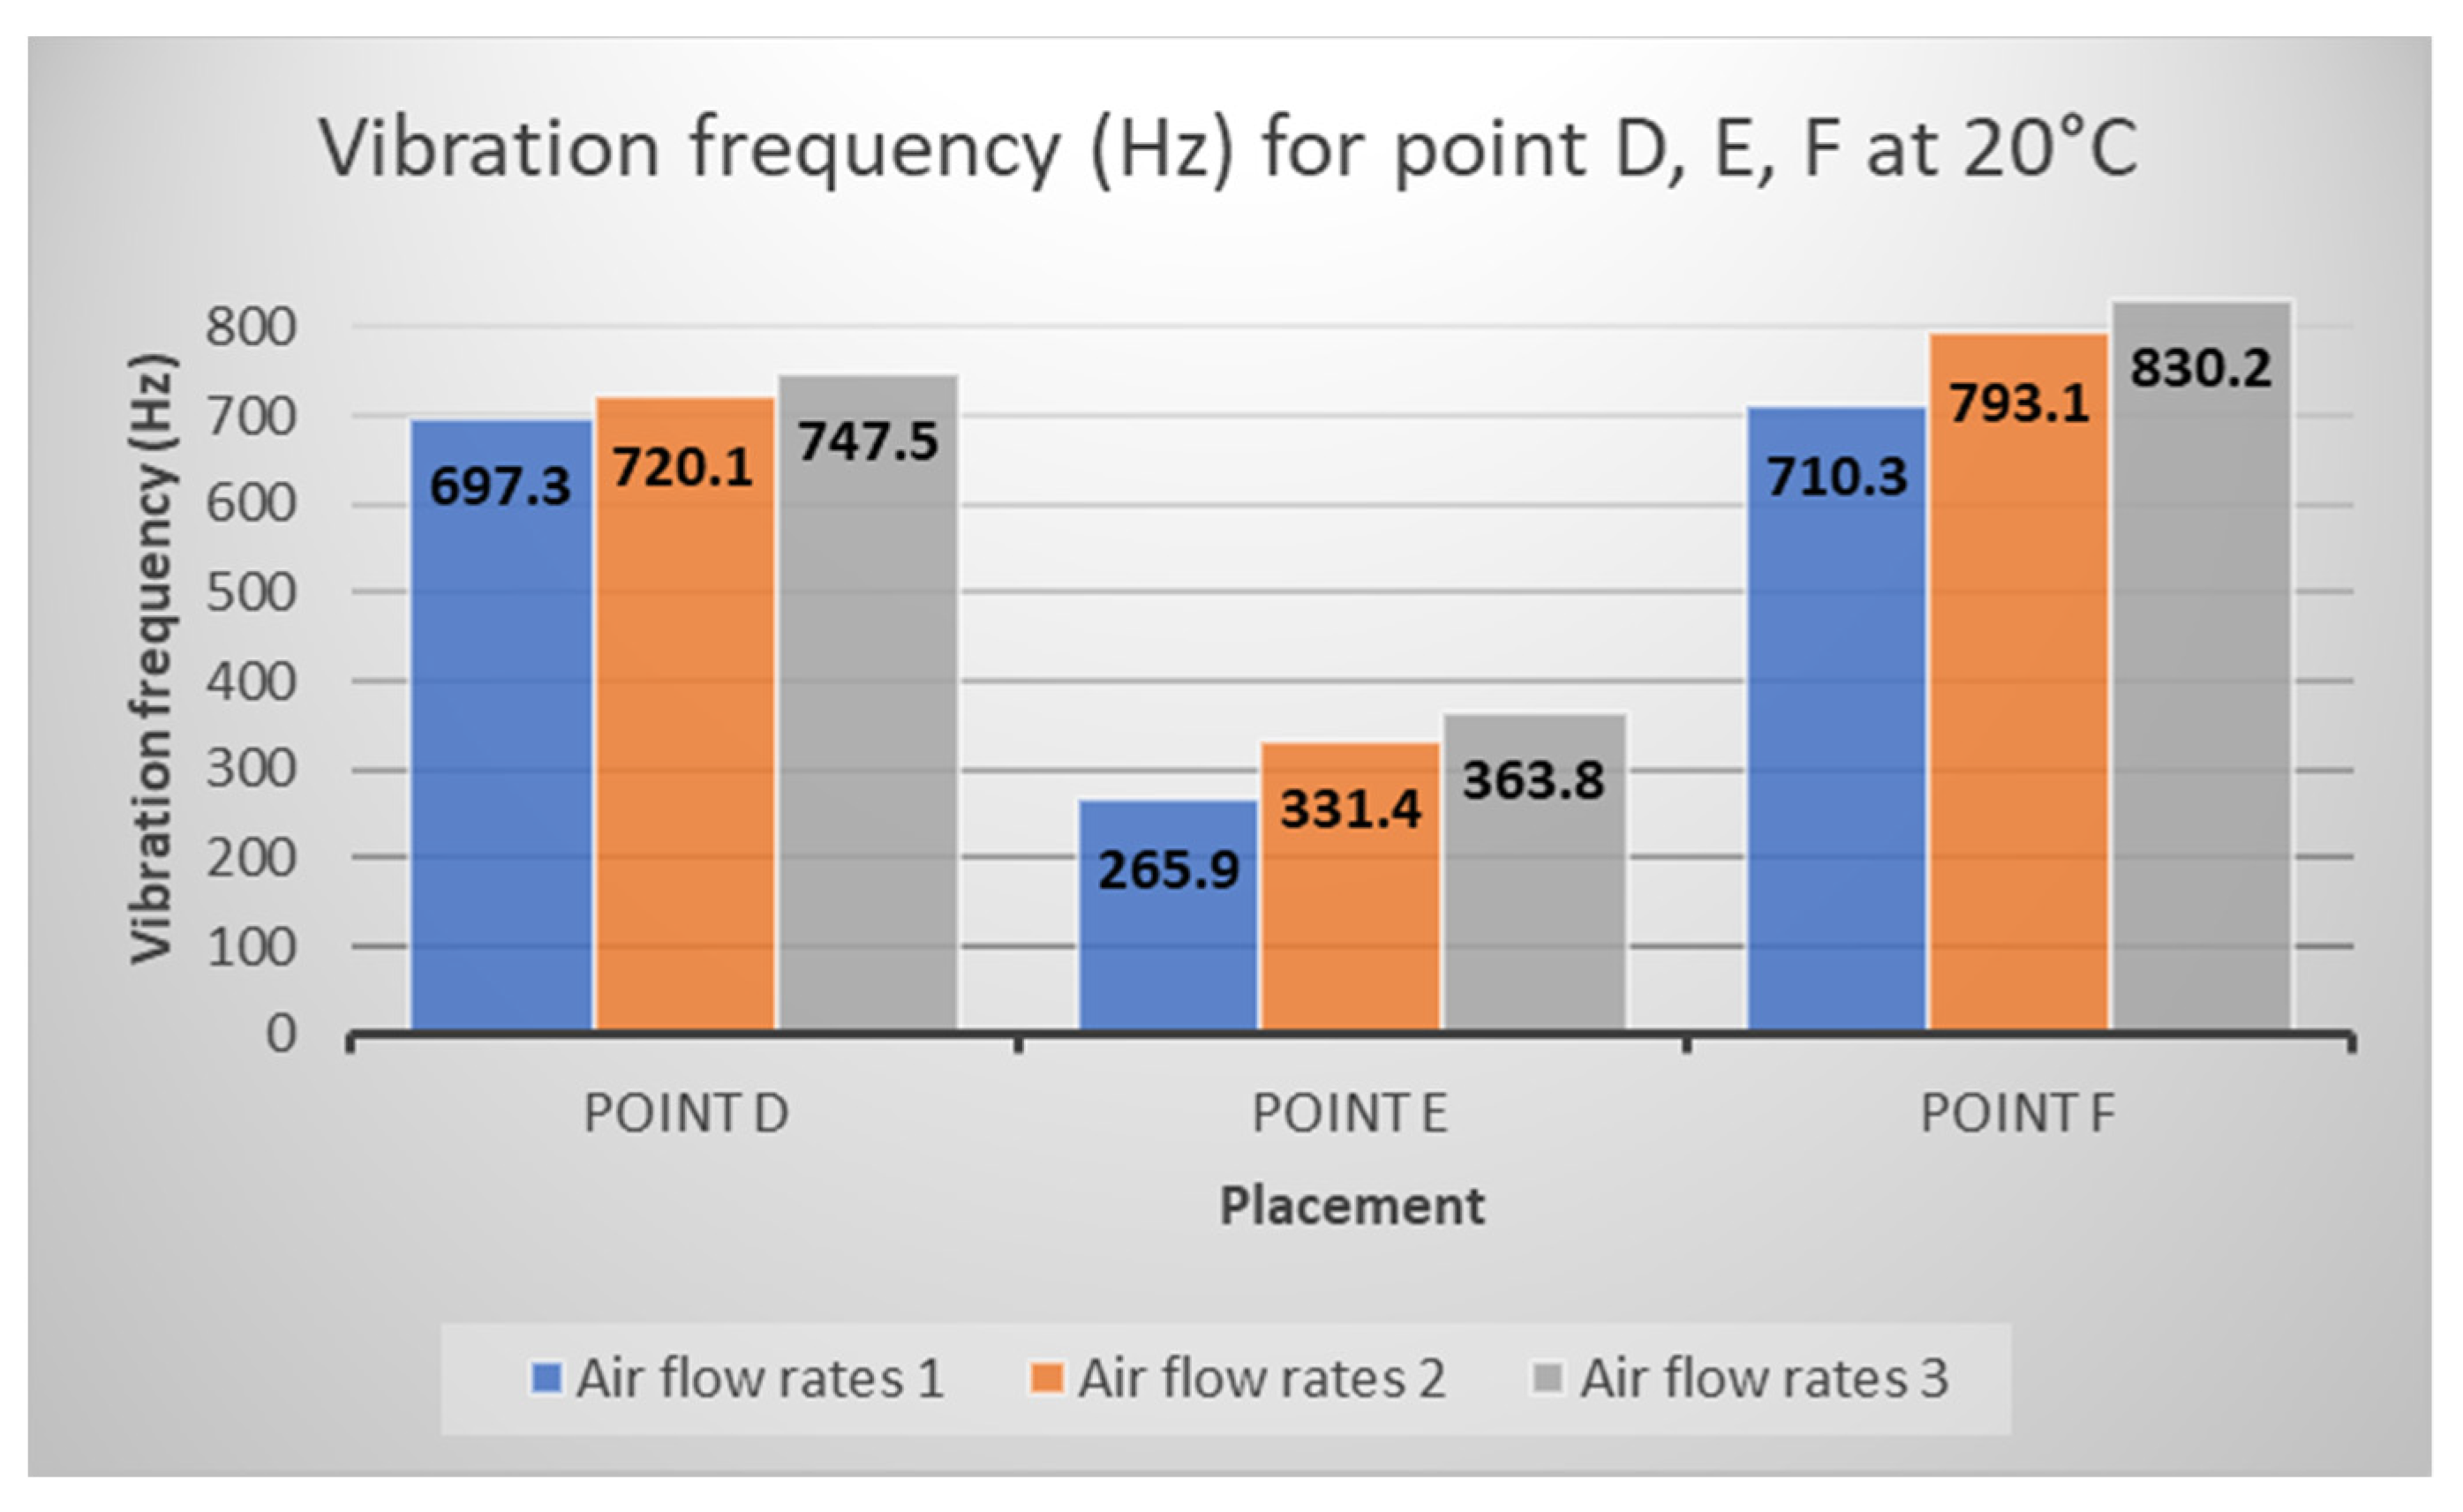
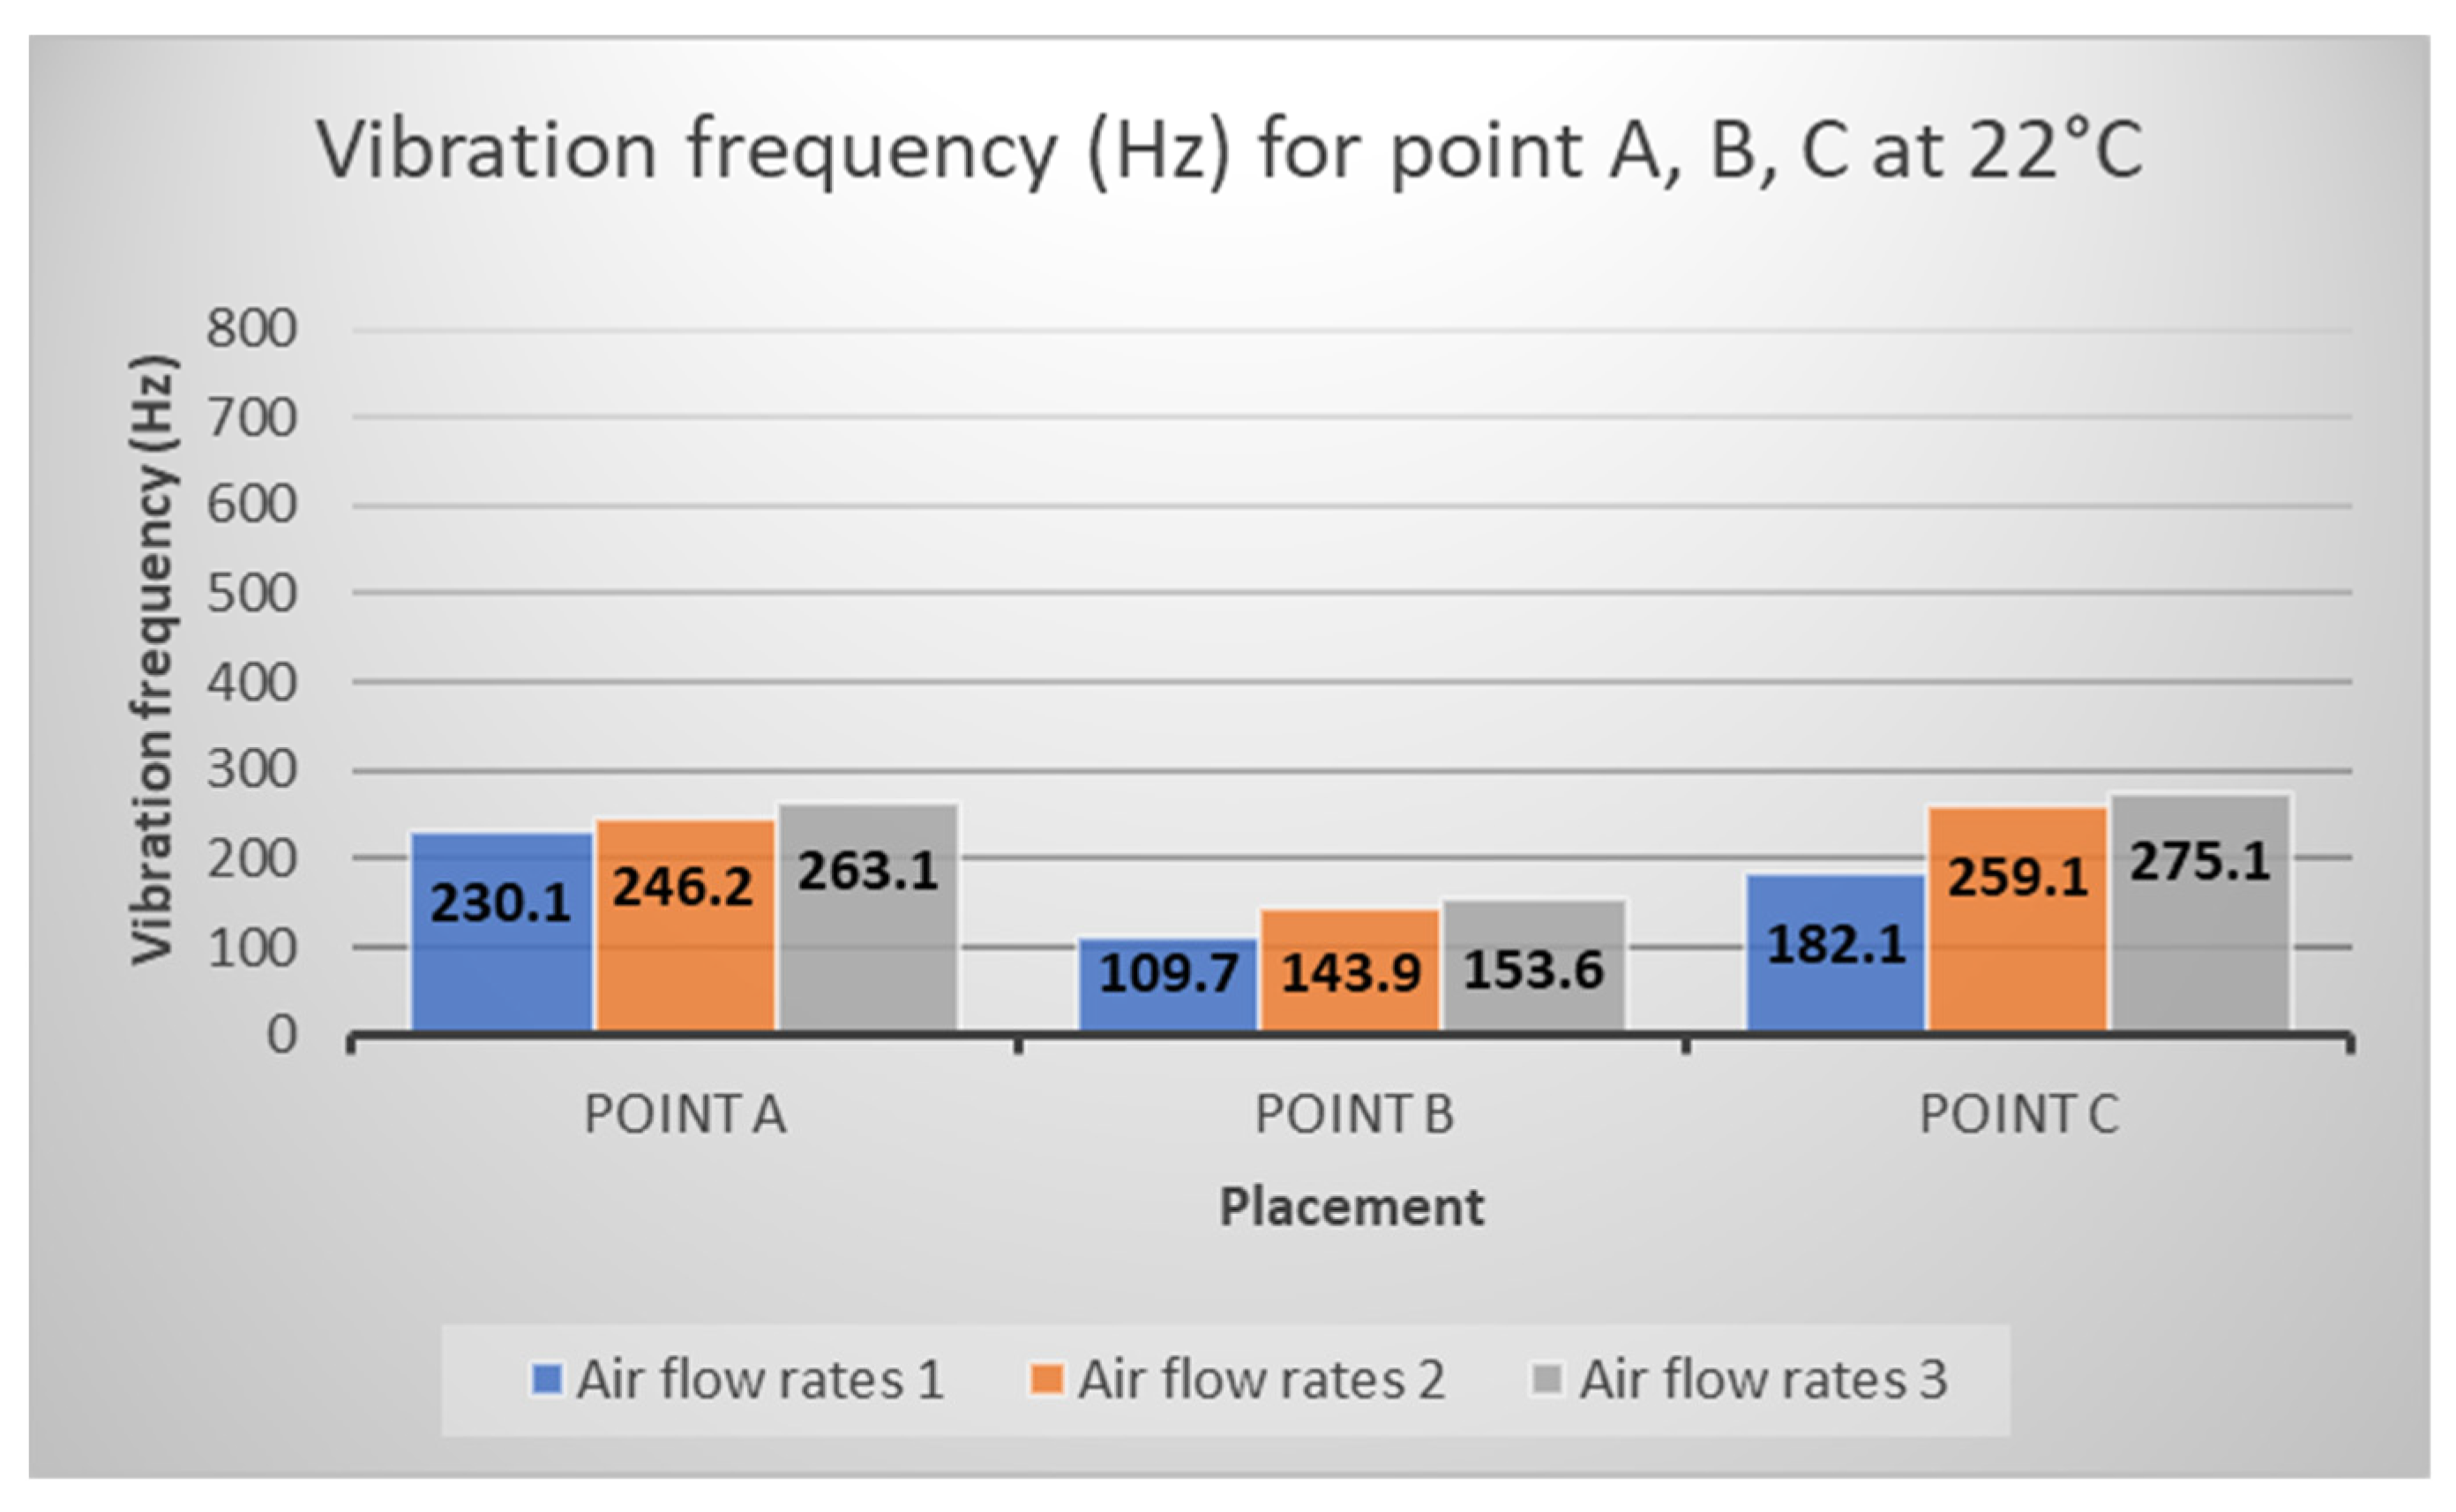
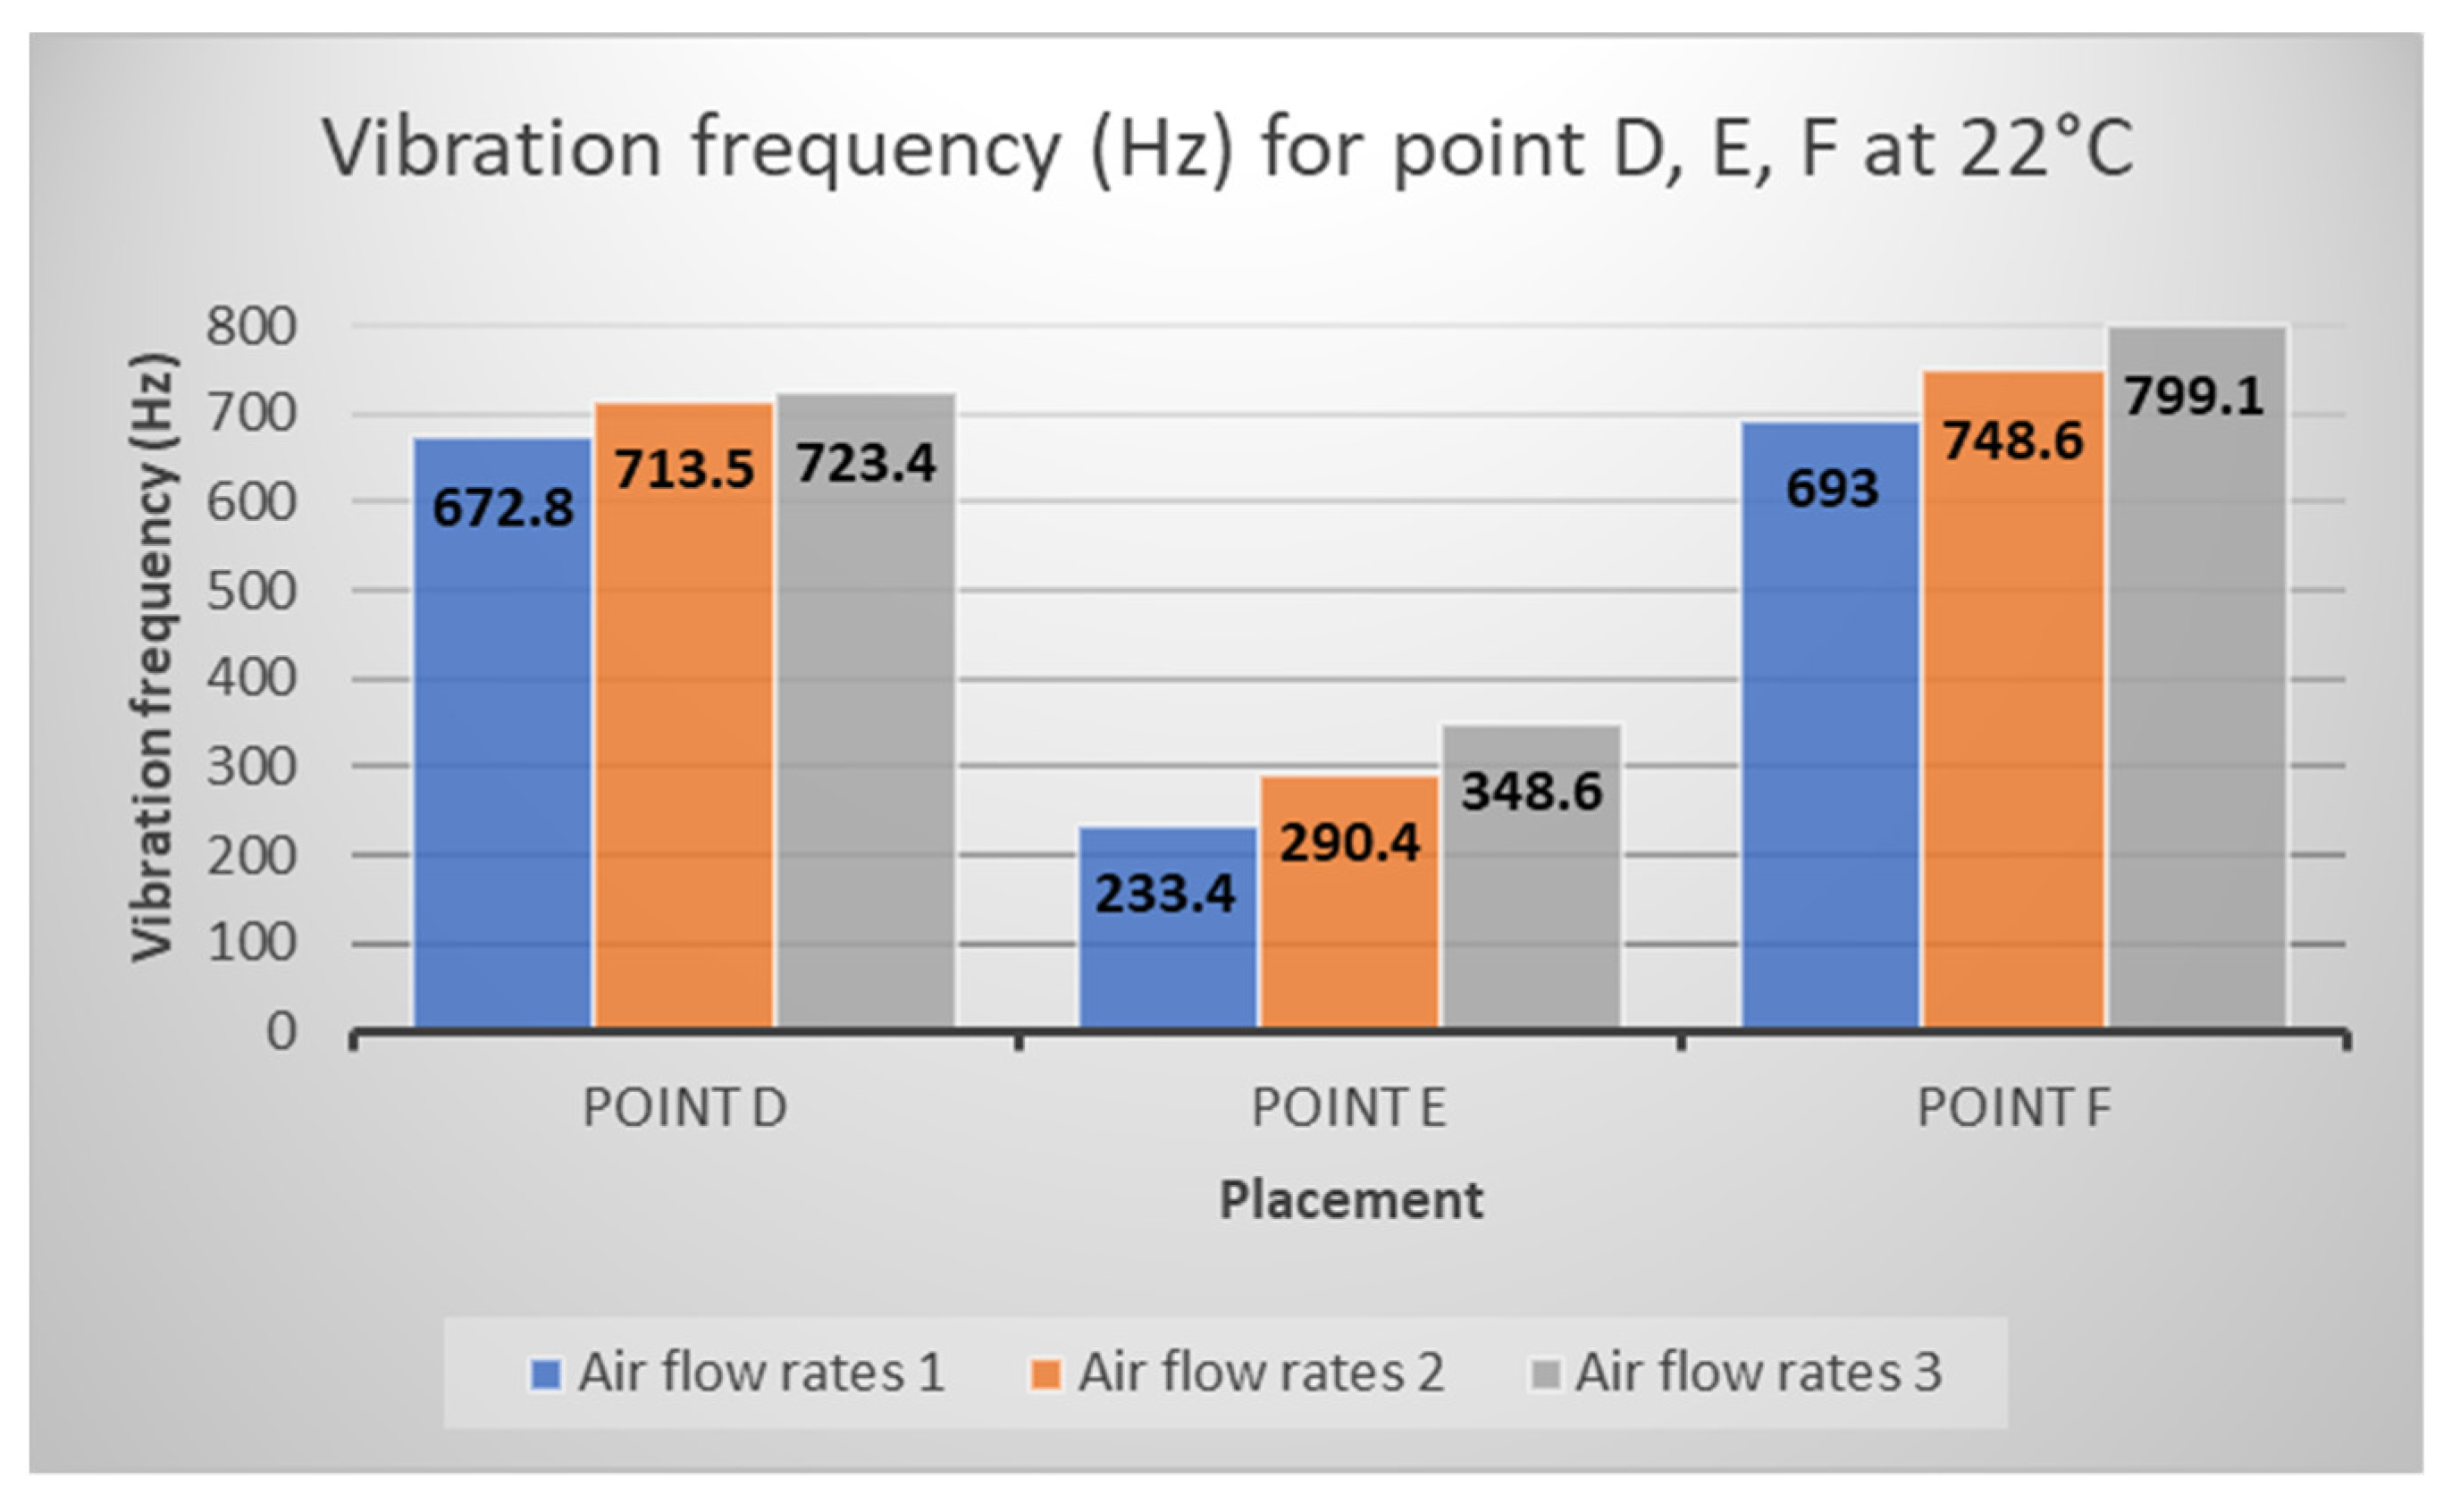
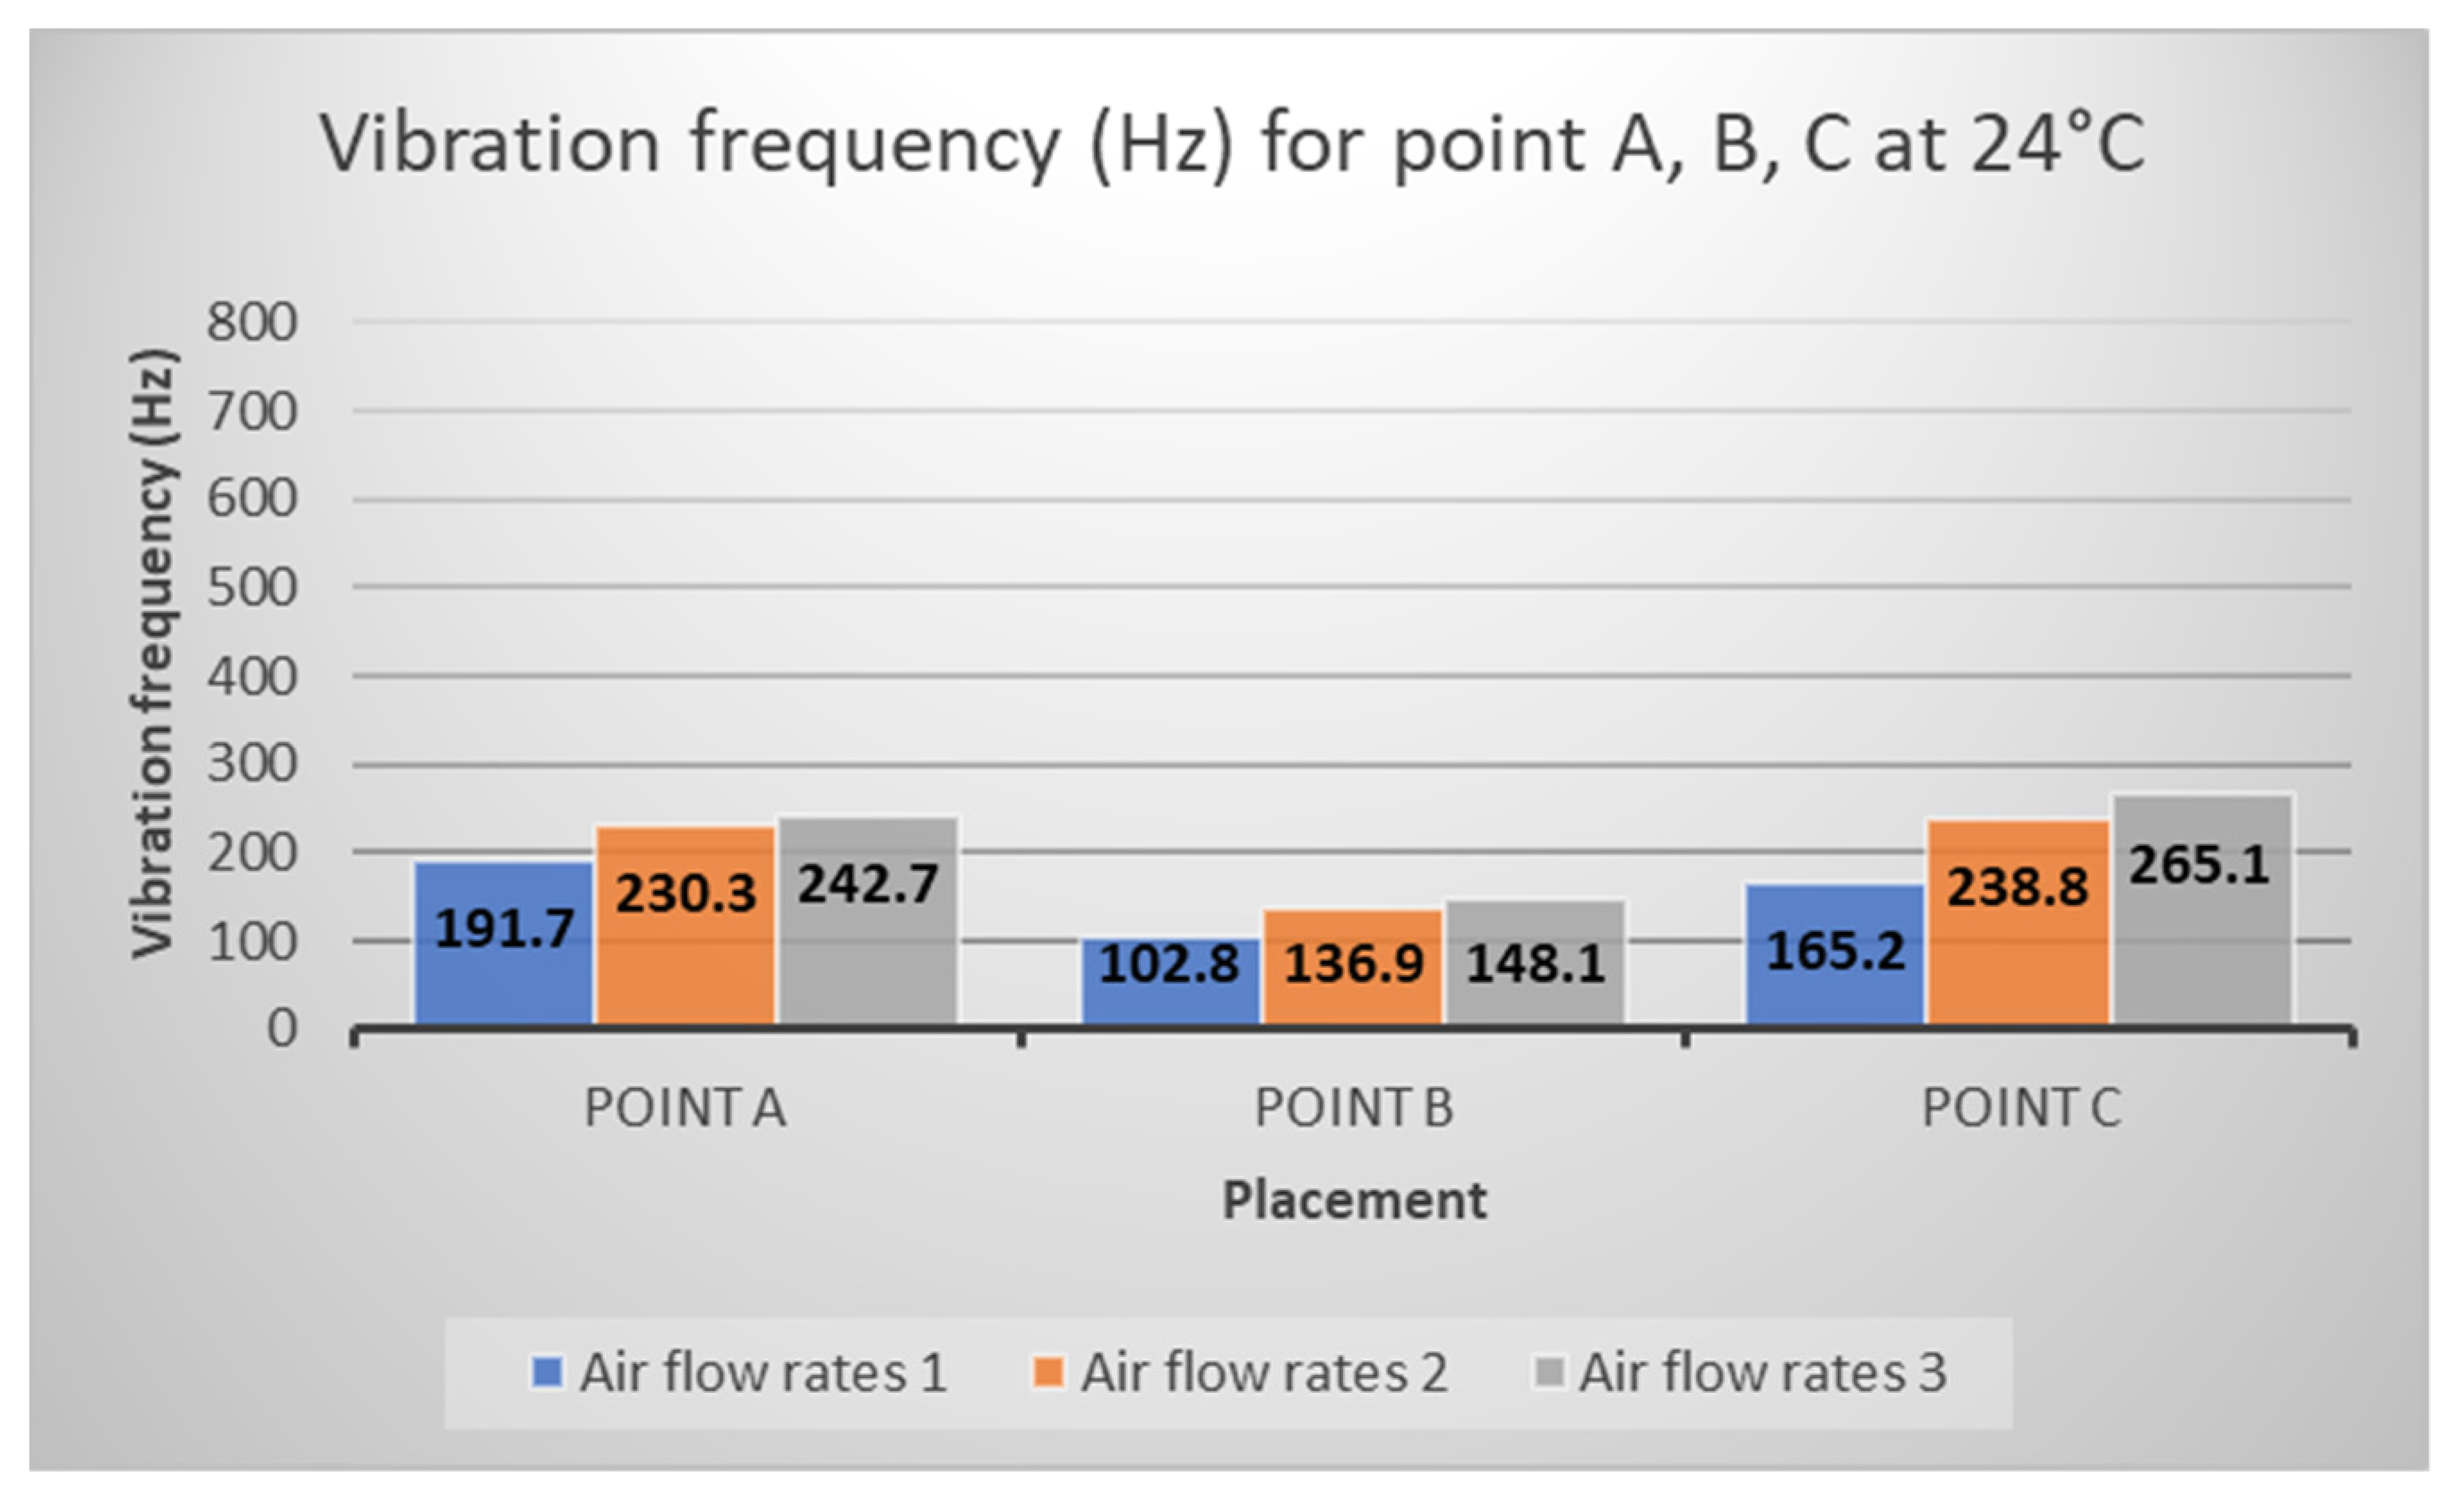
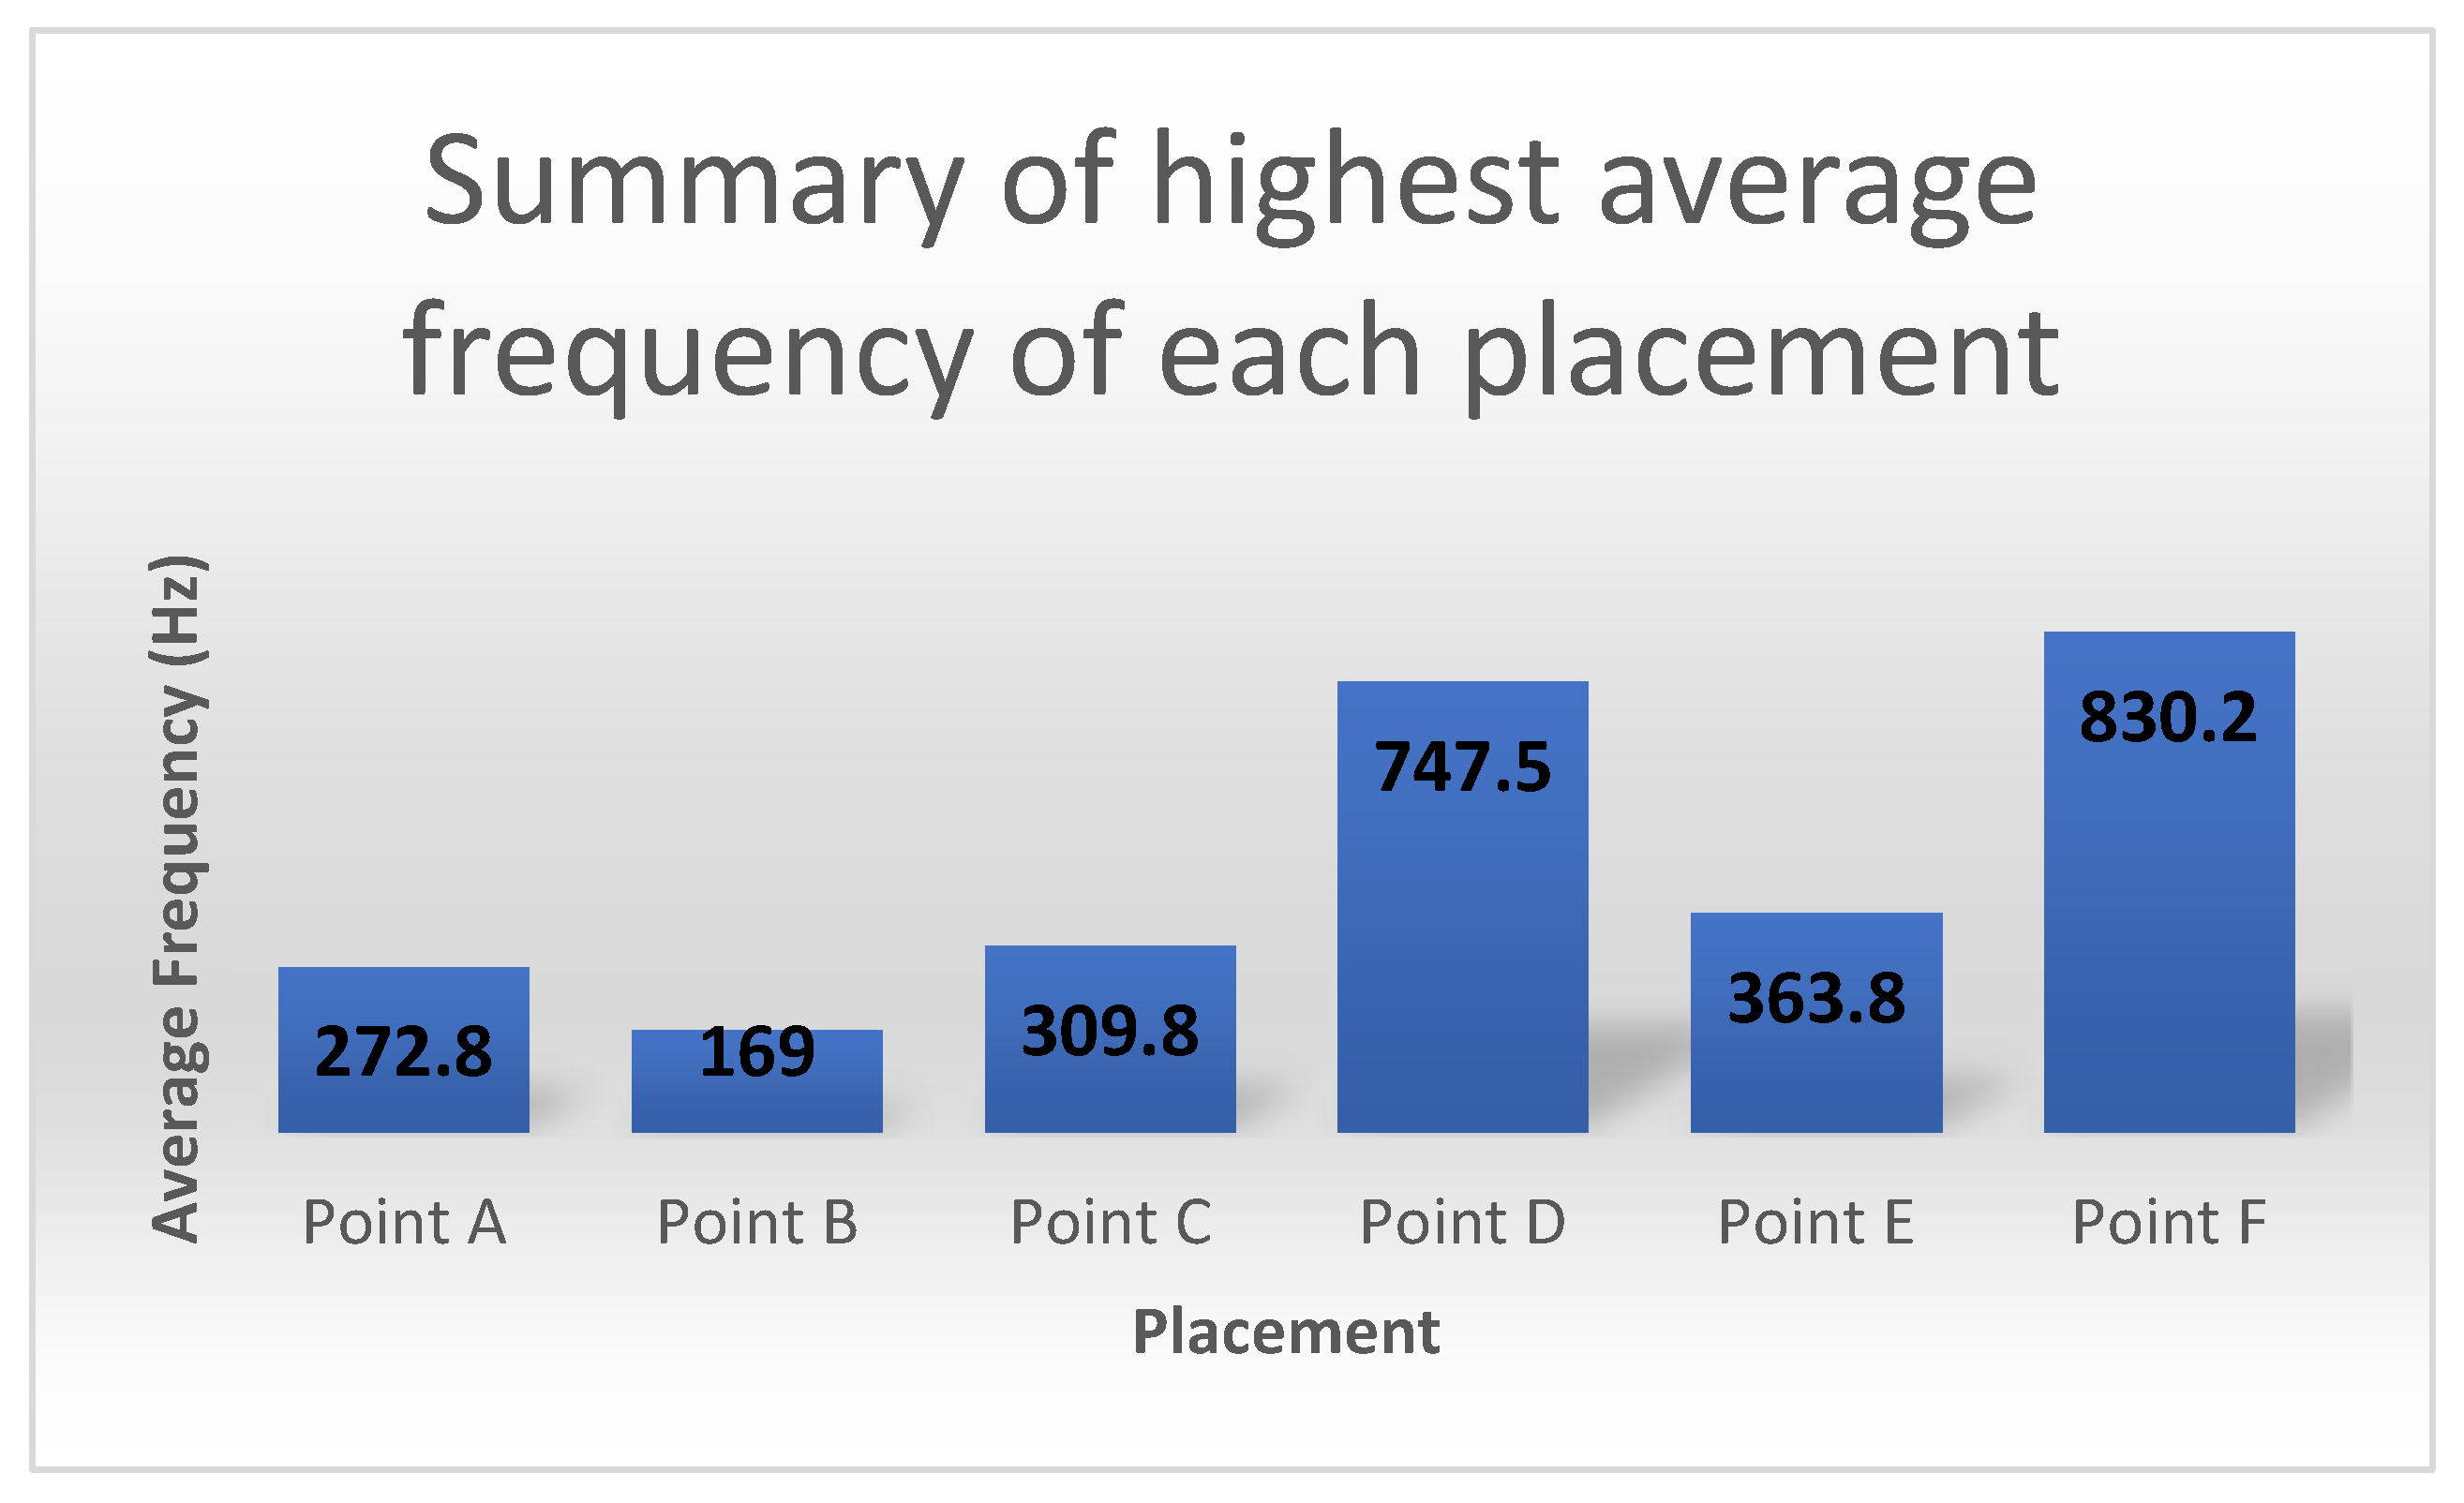
3.1. Vibration Frequency Data
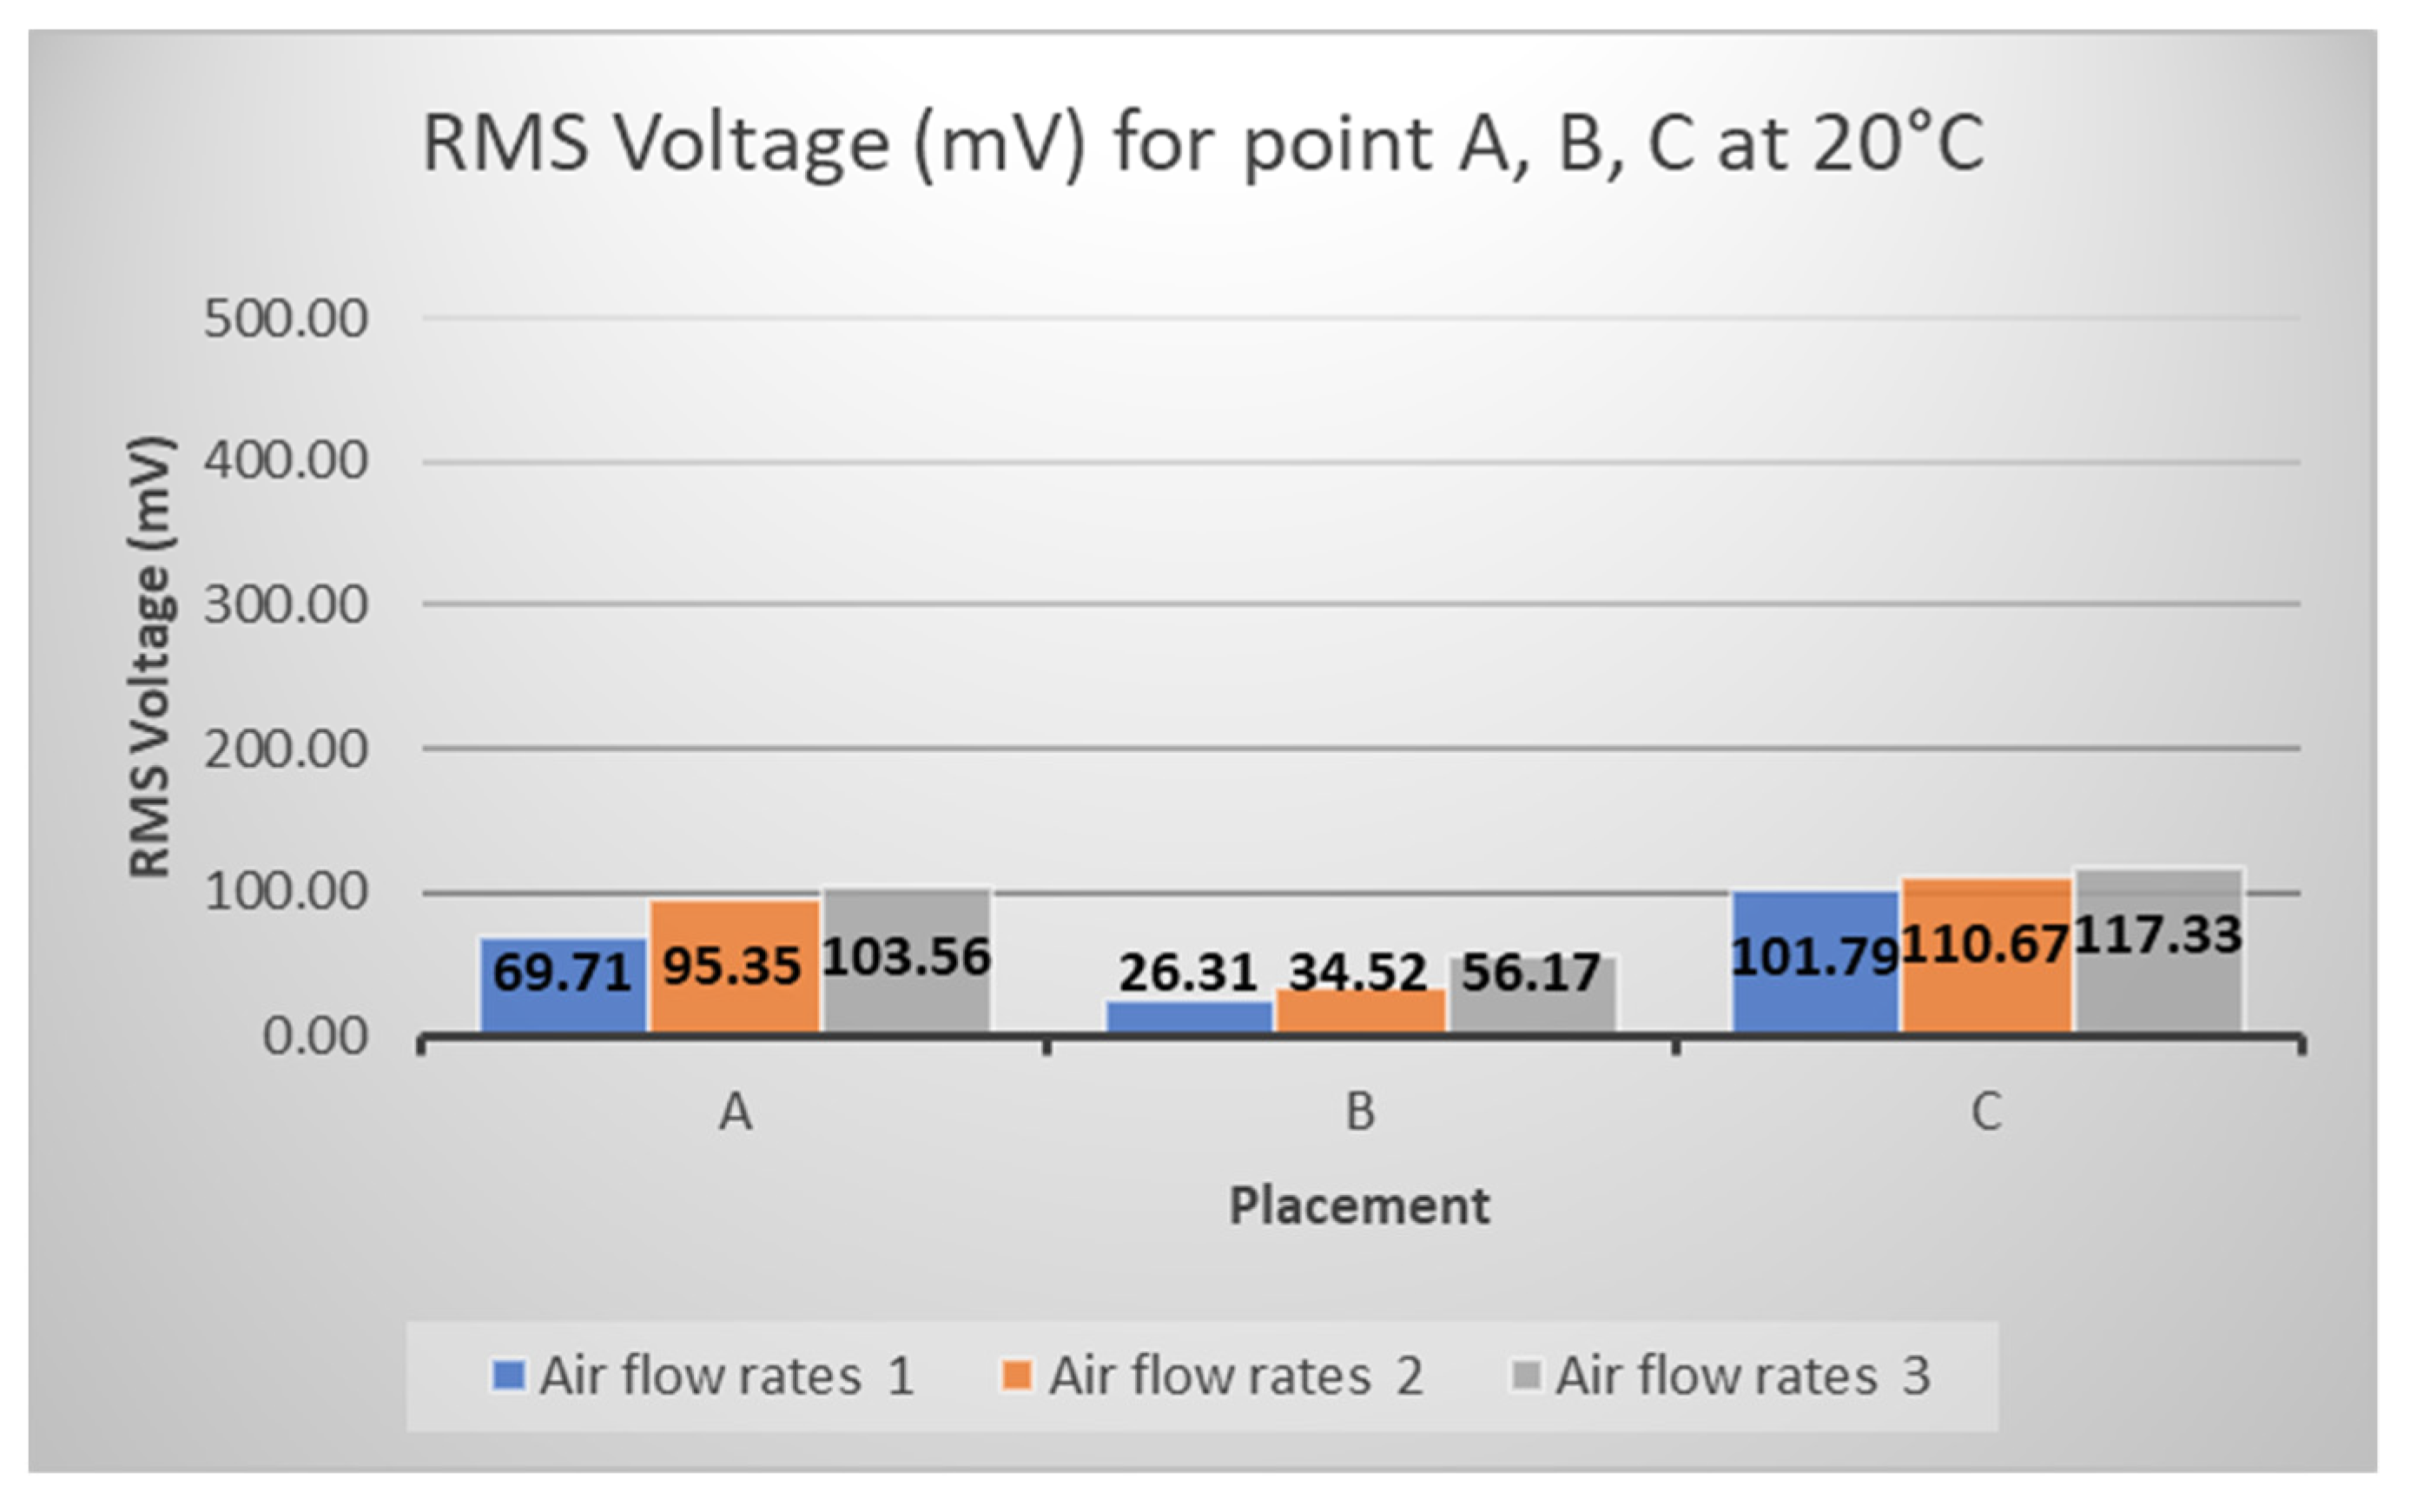
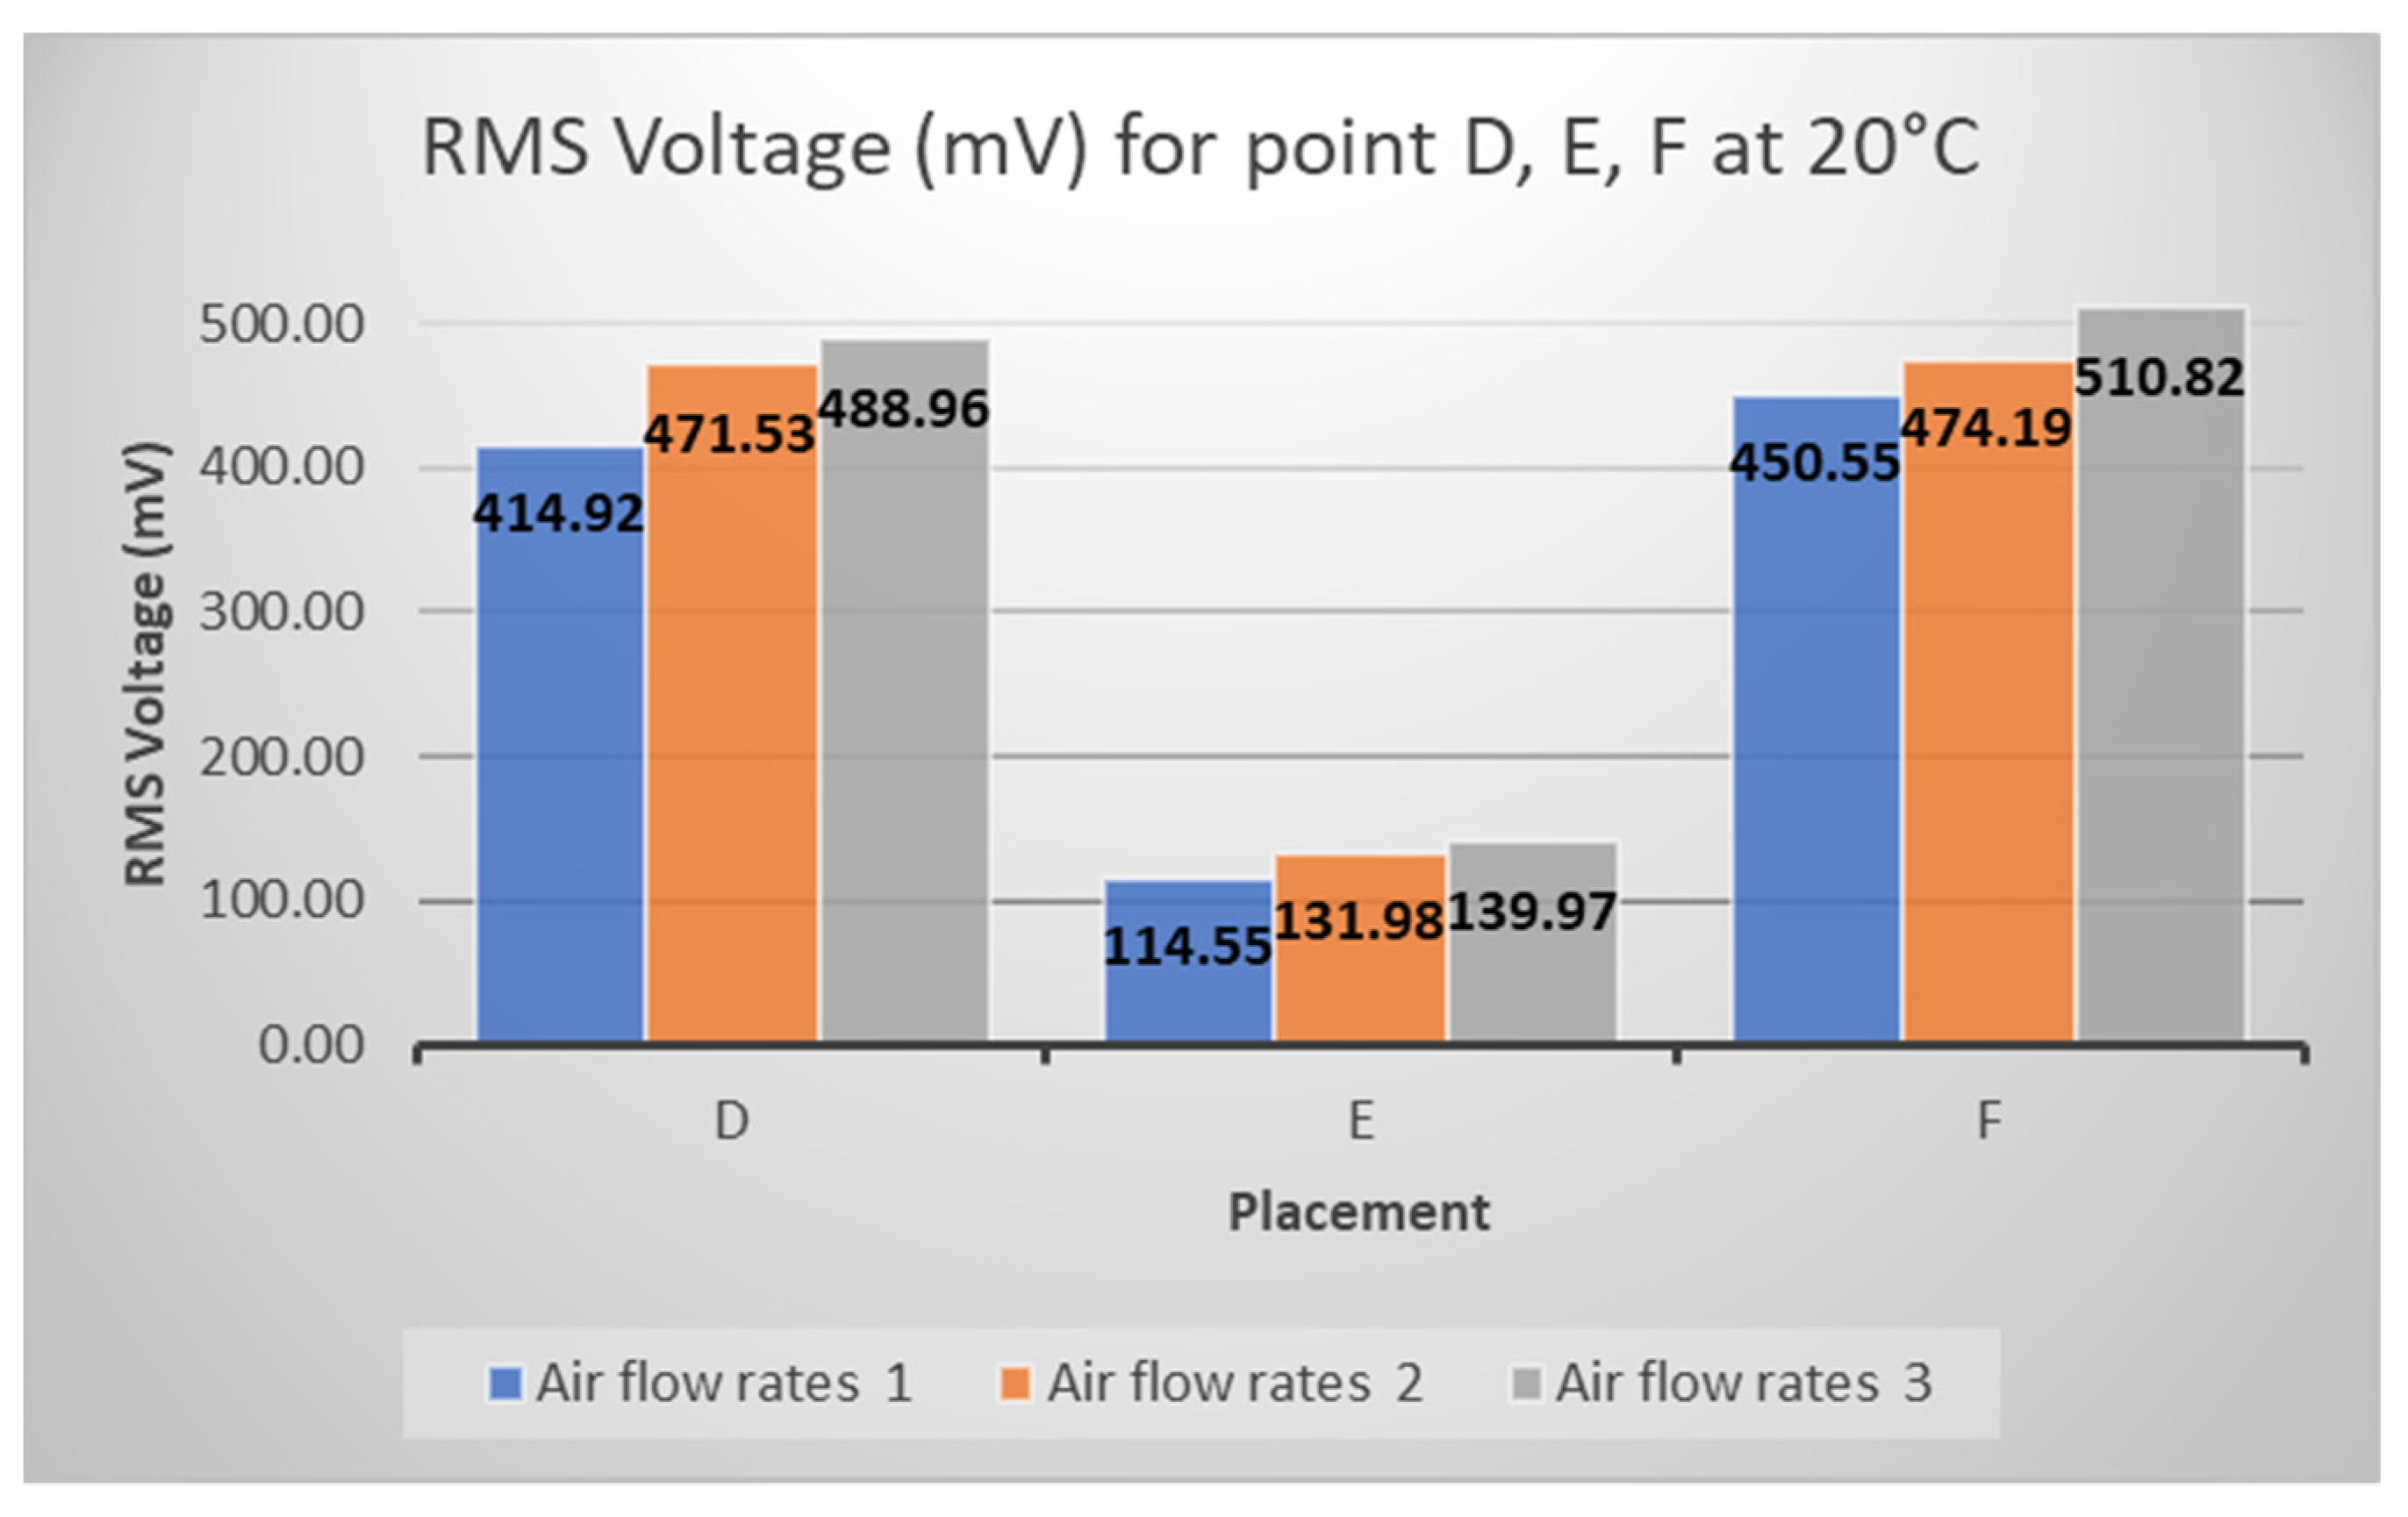
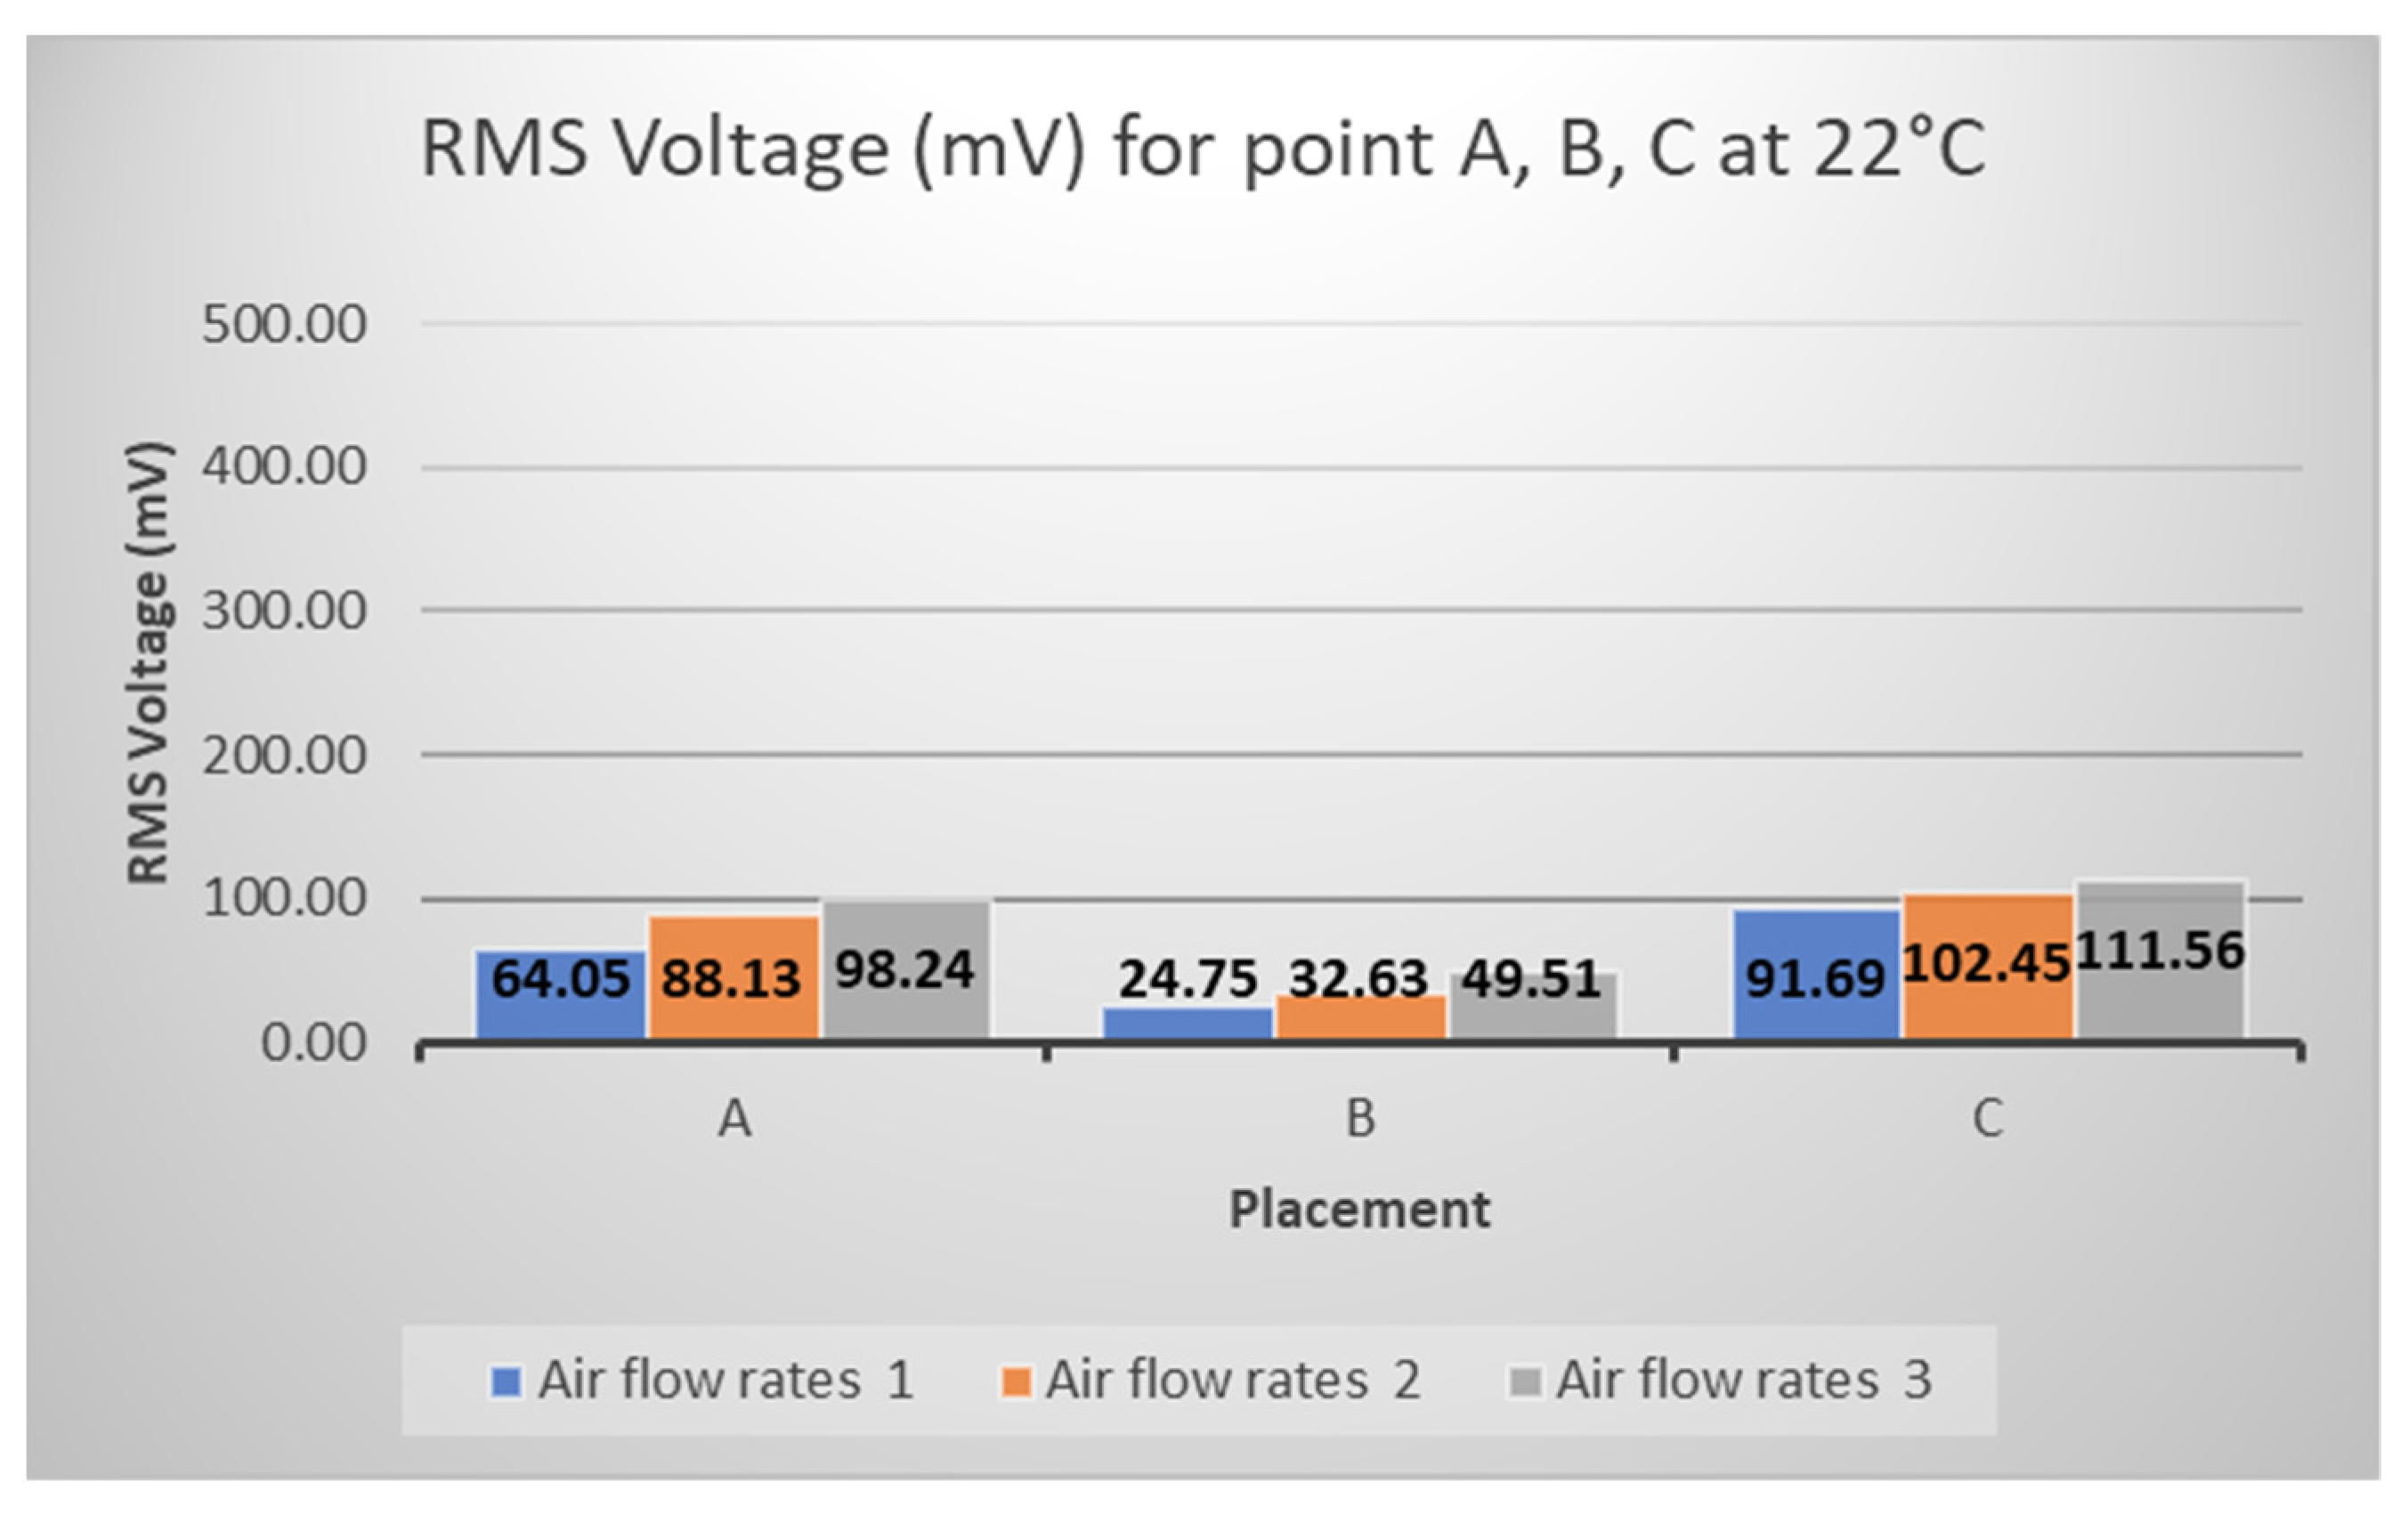
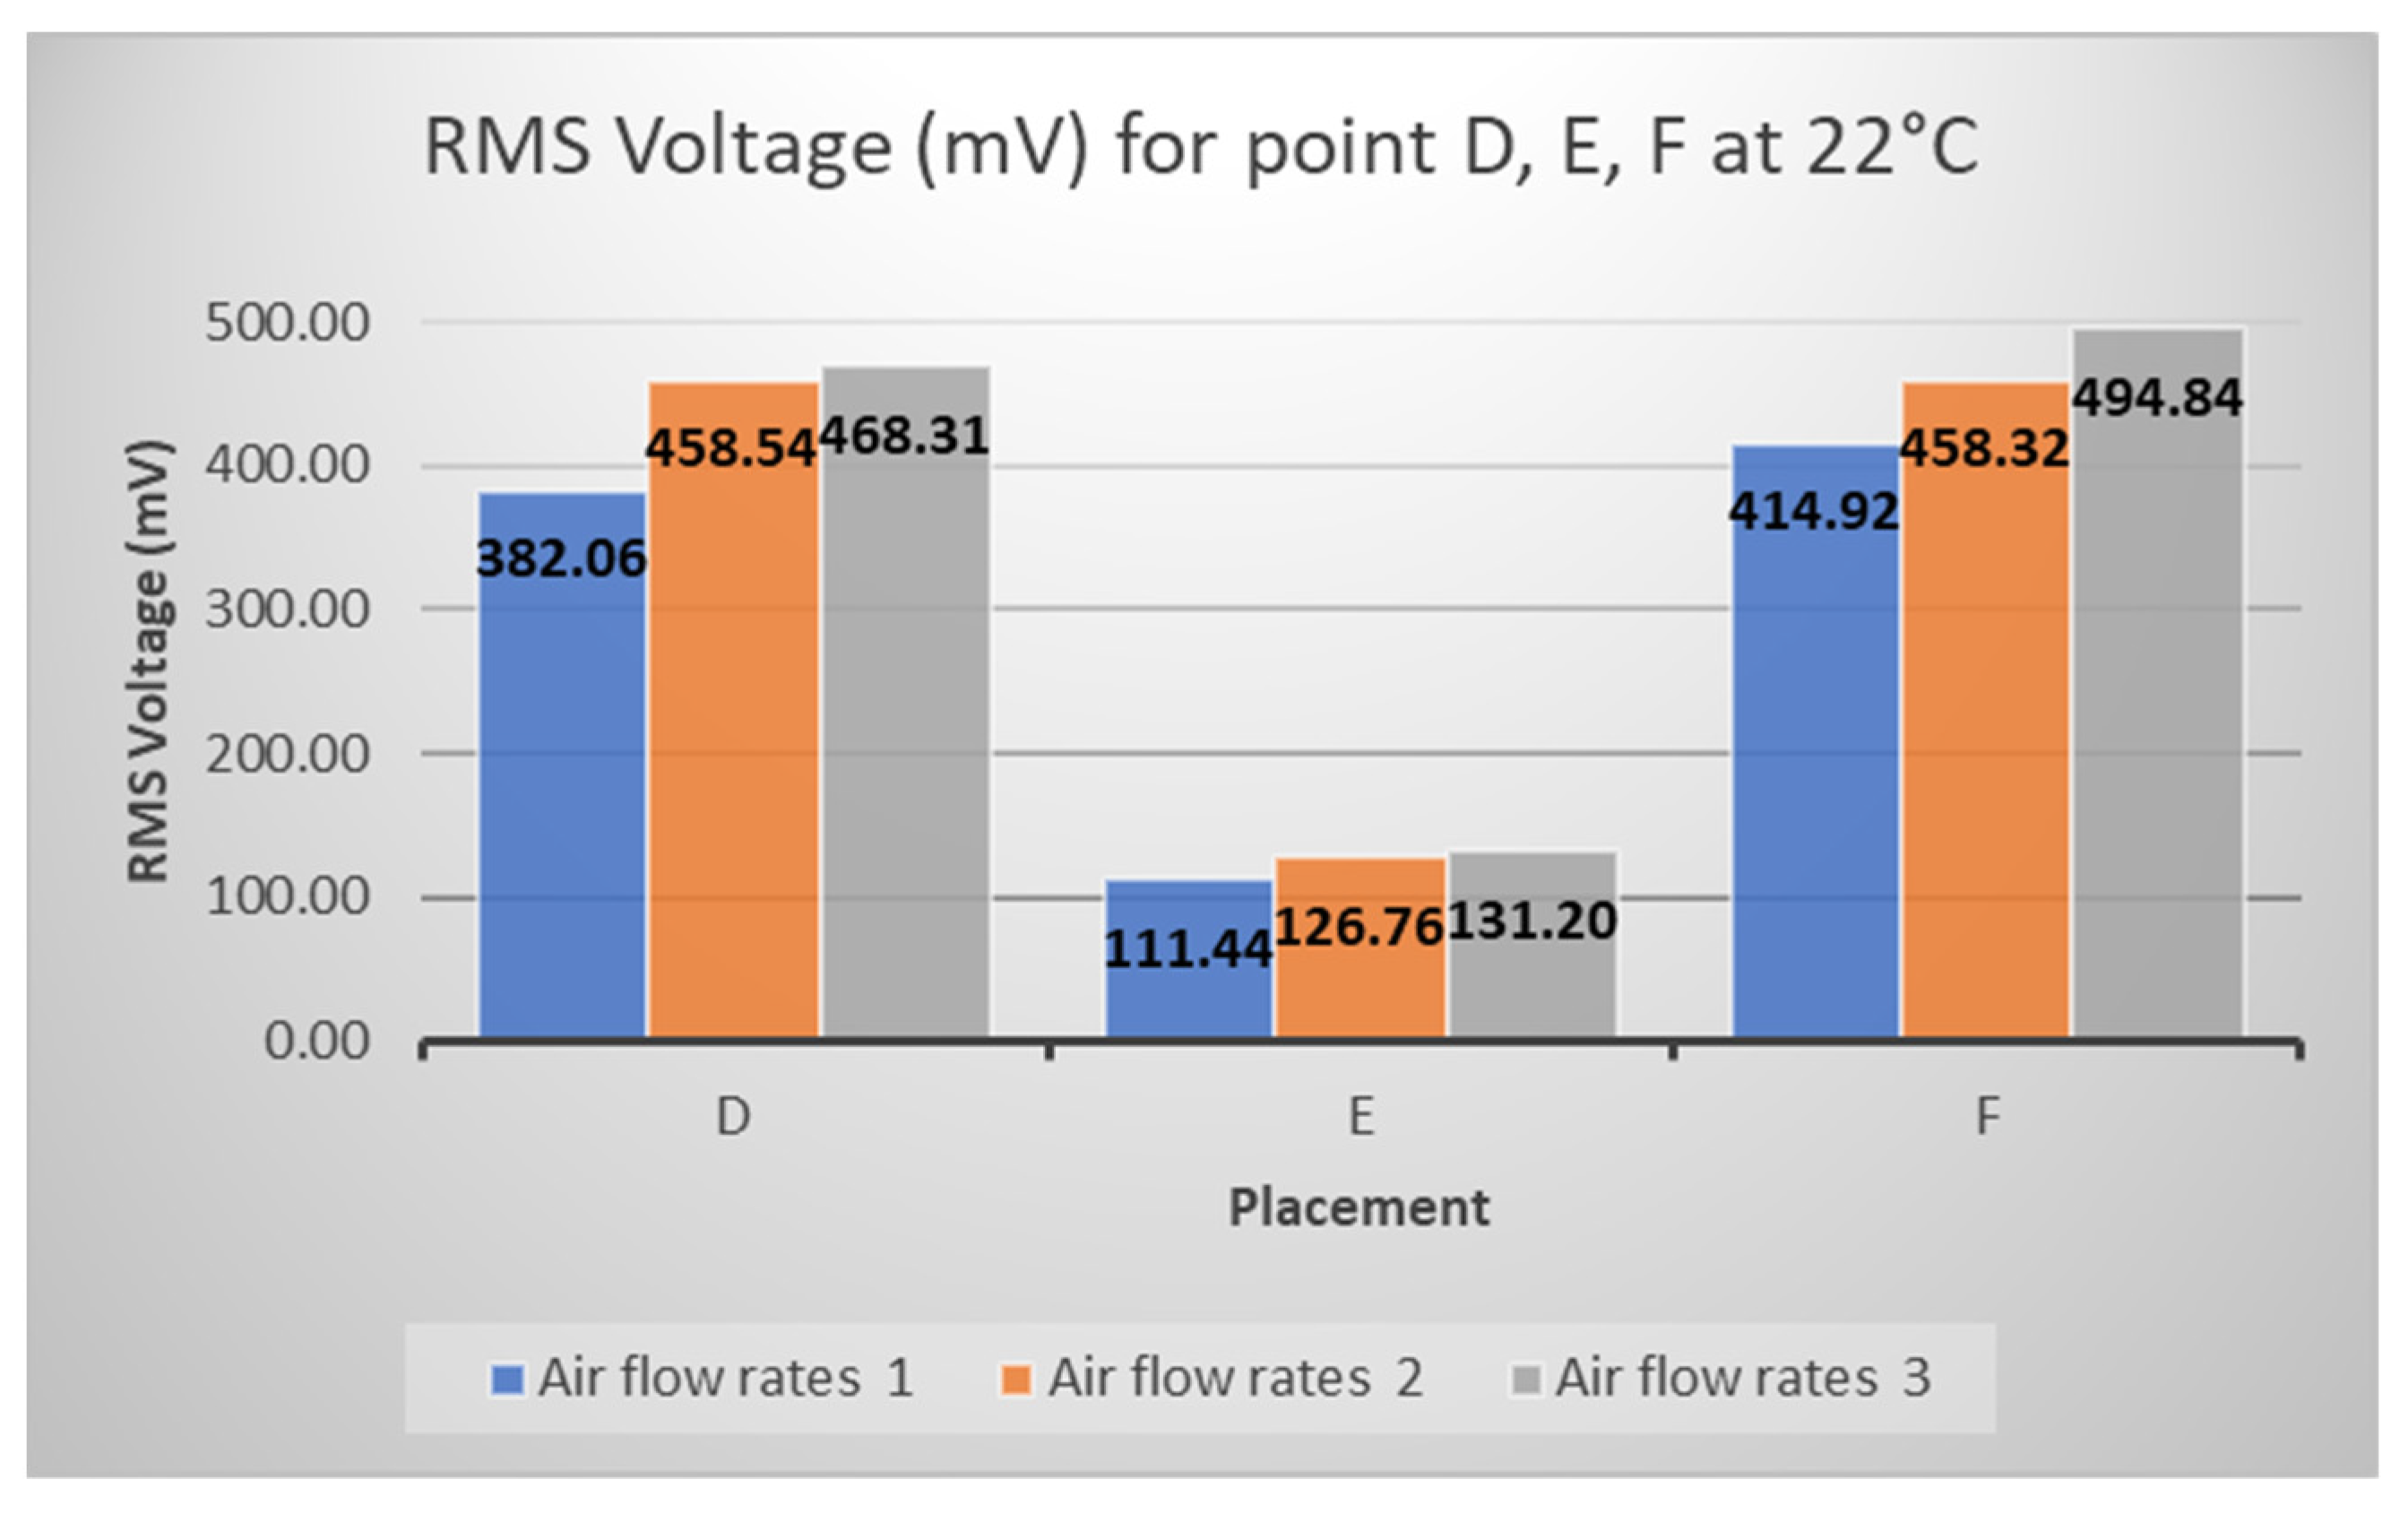
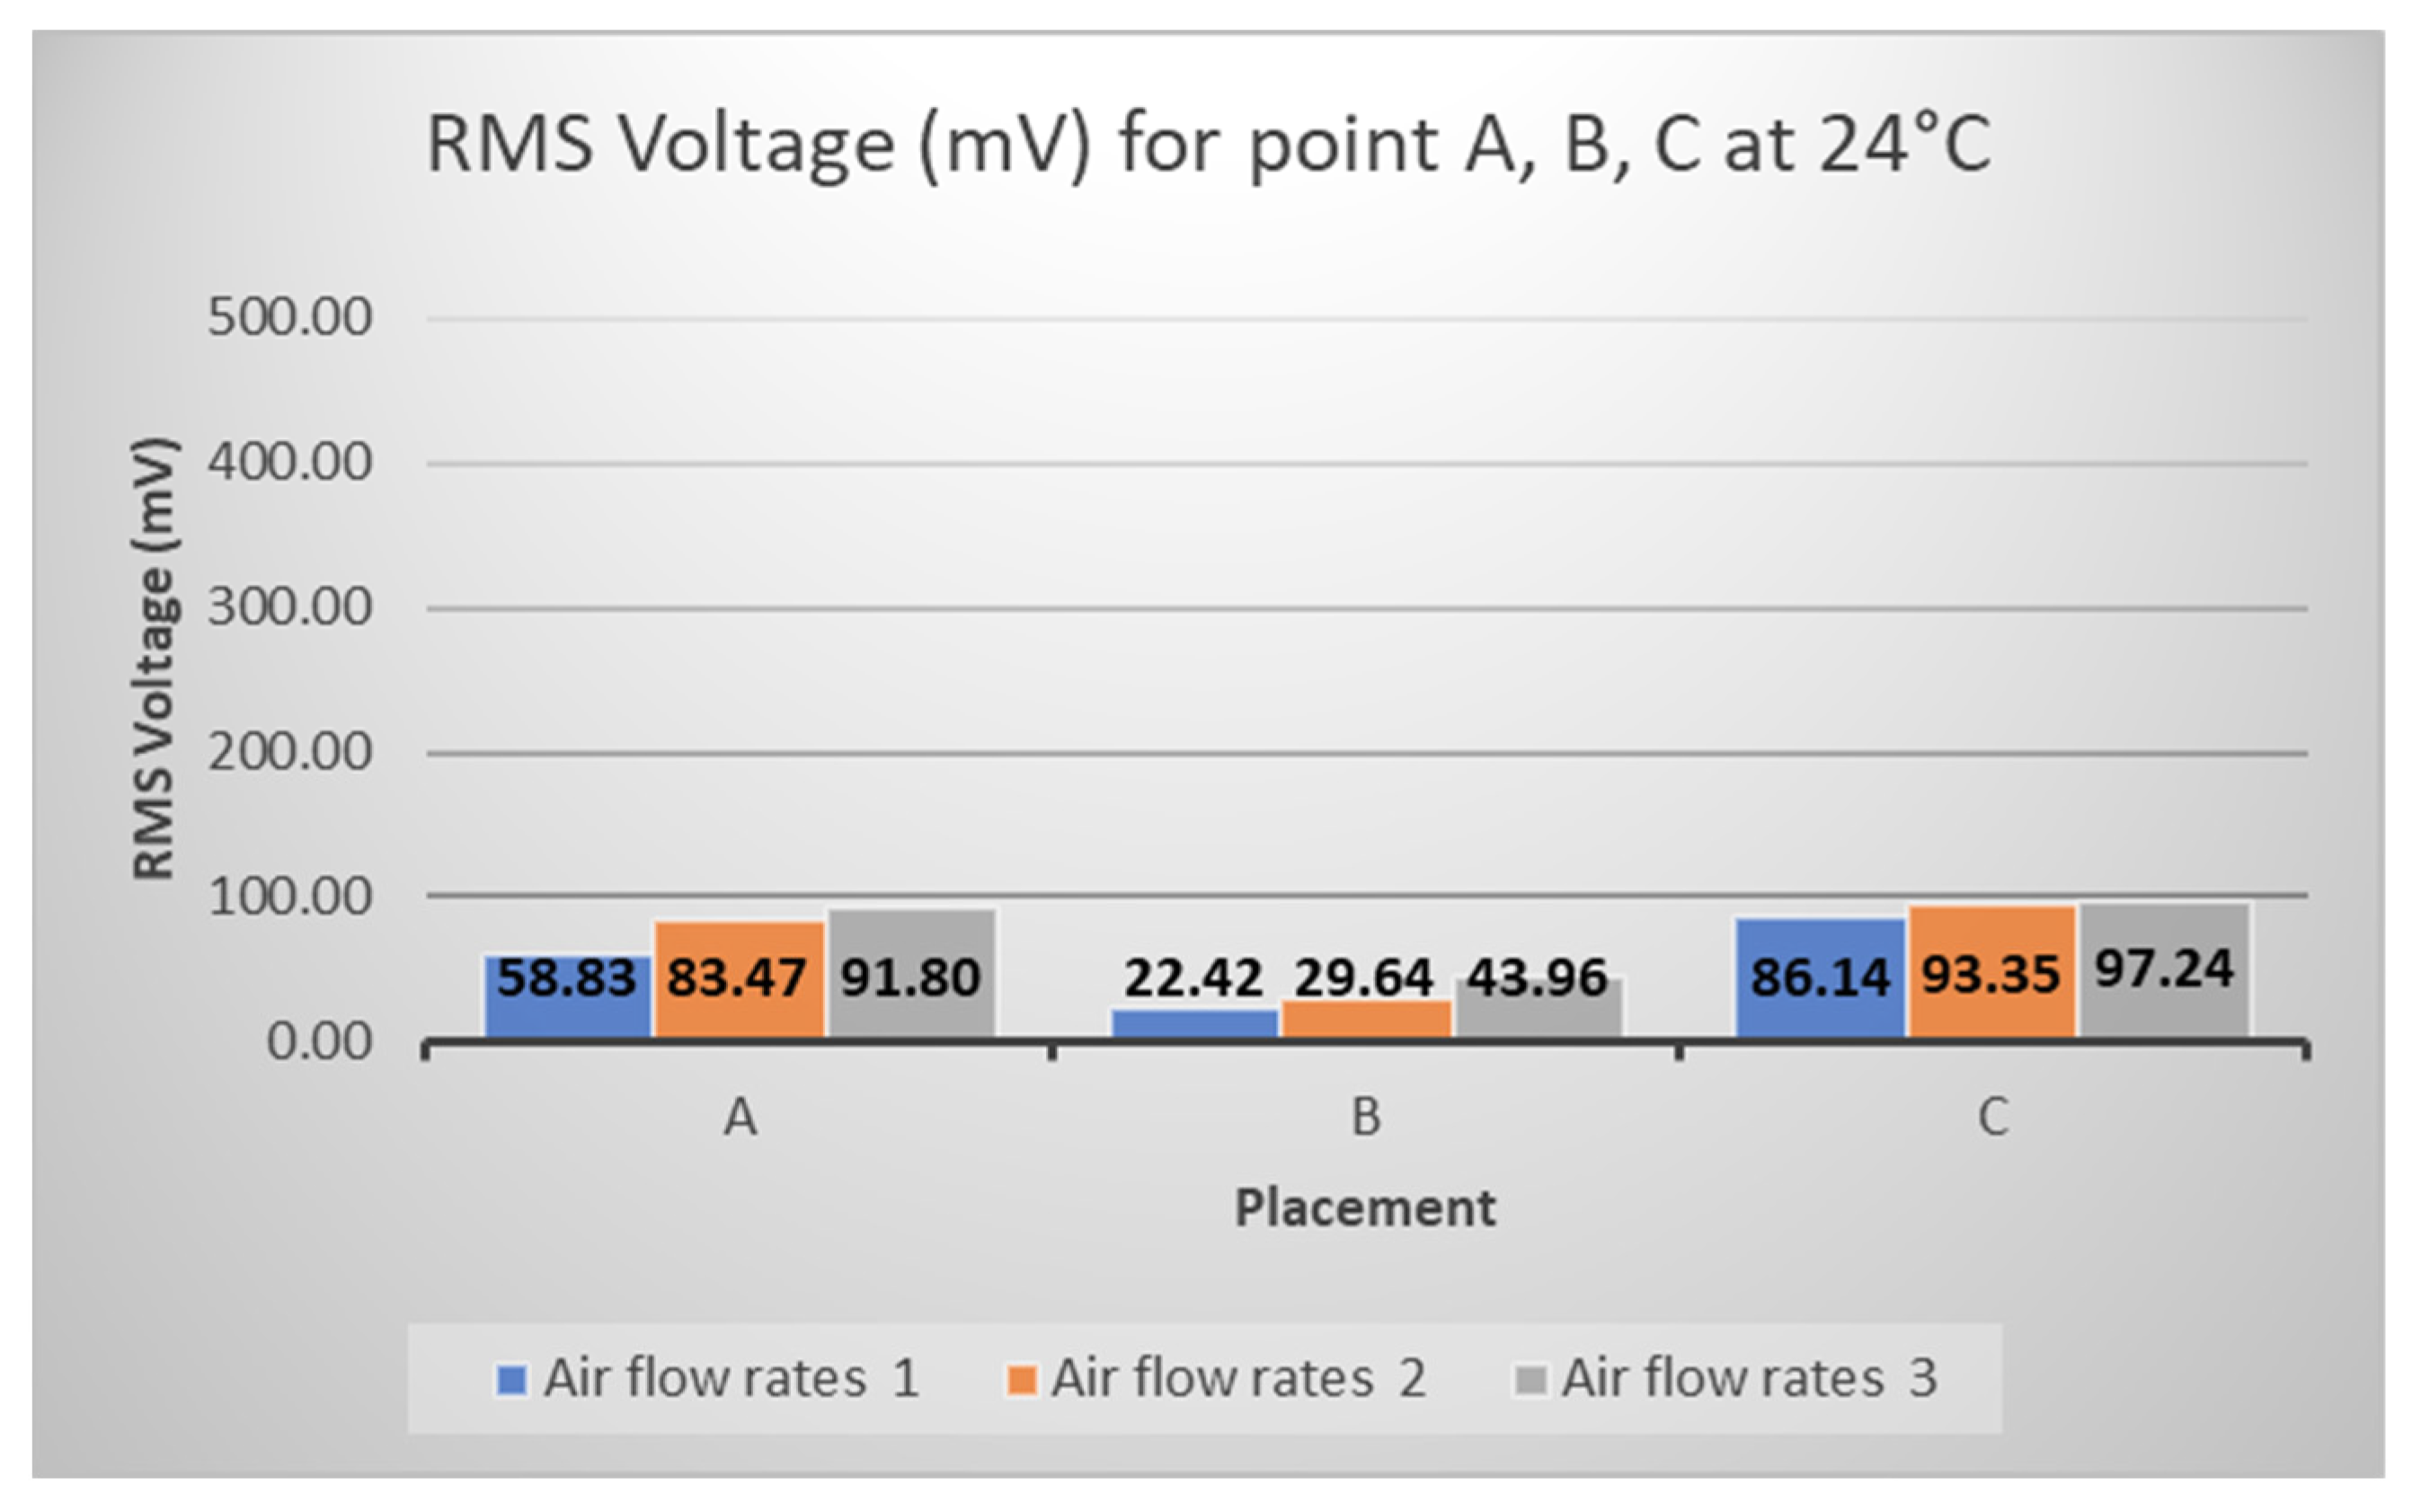
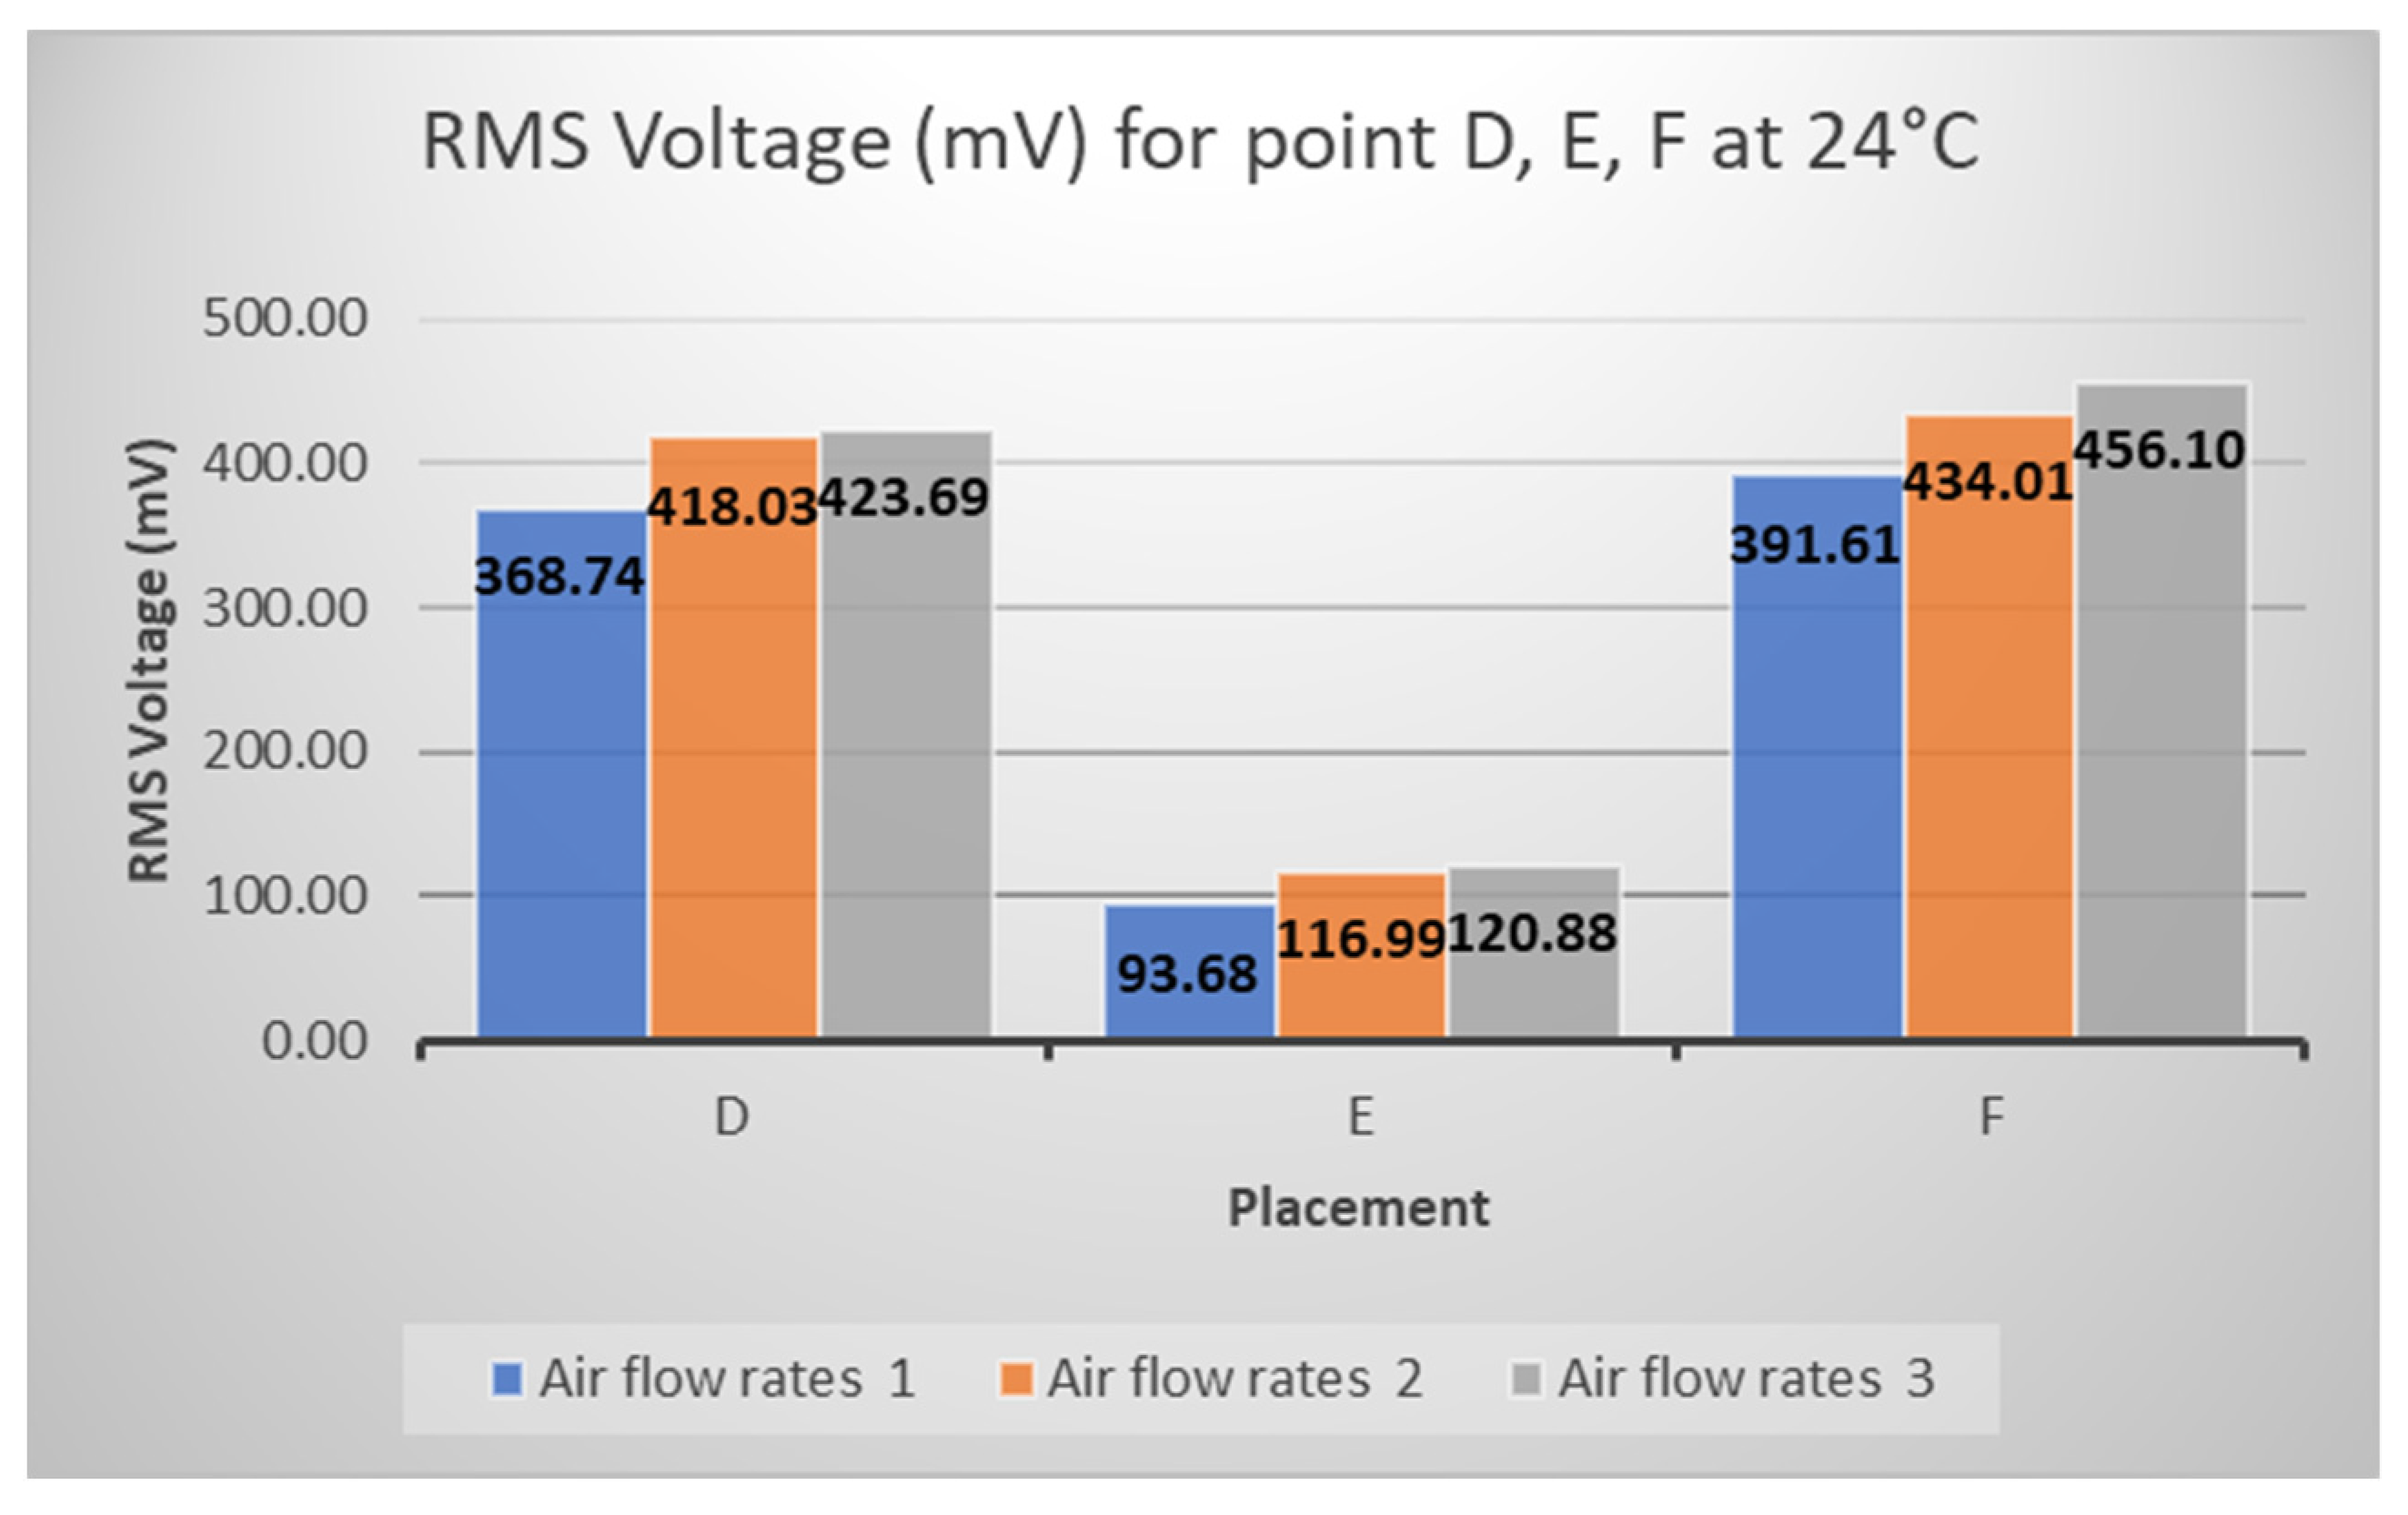
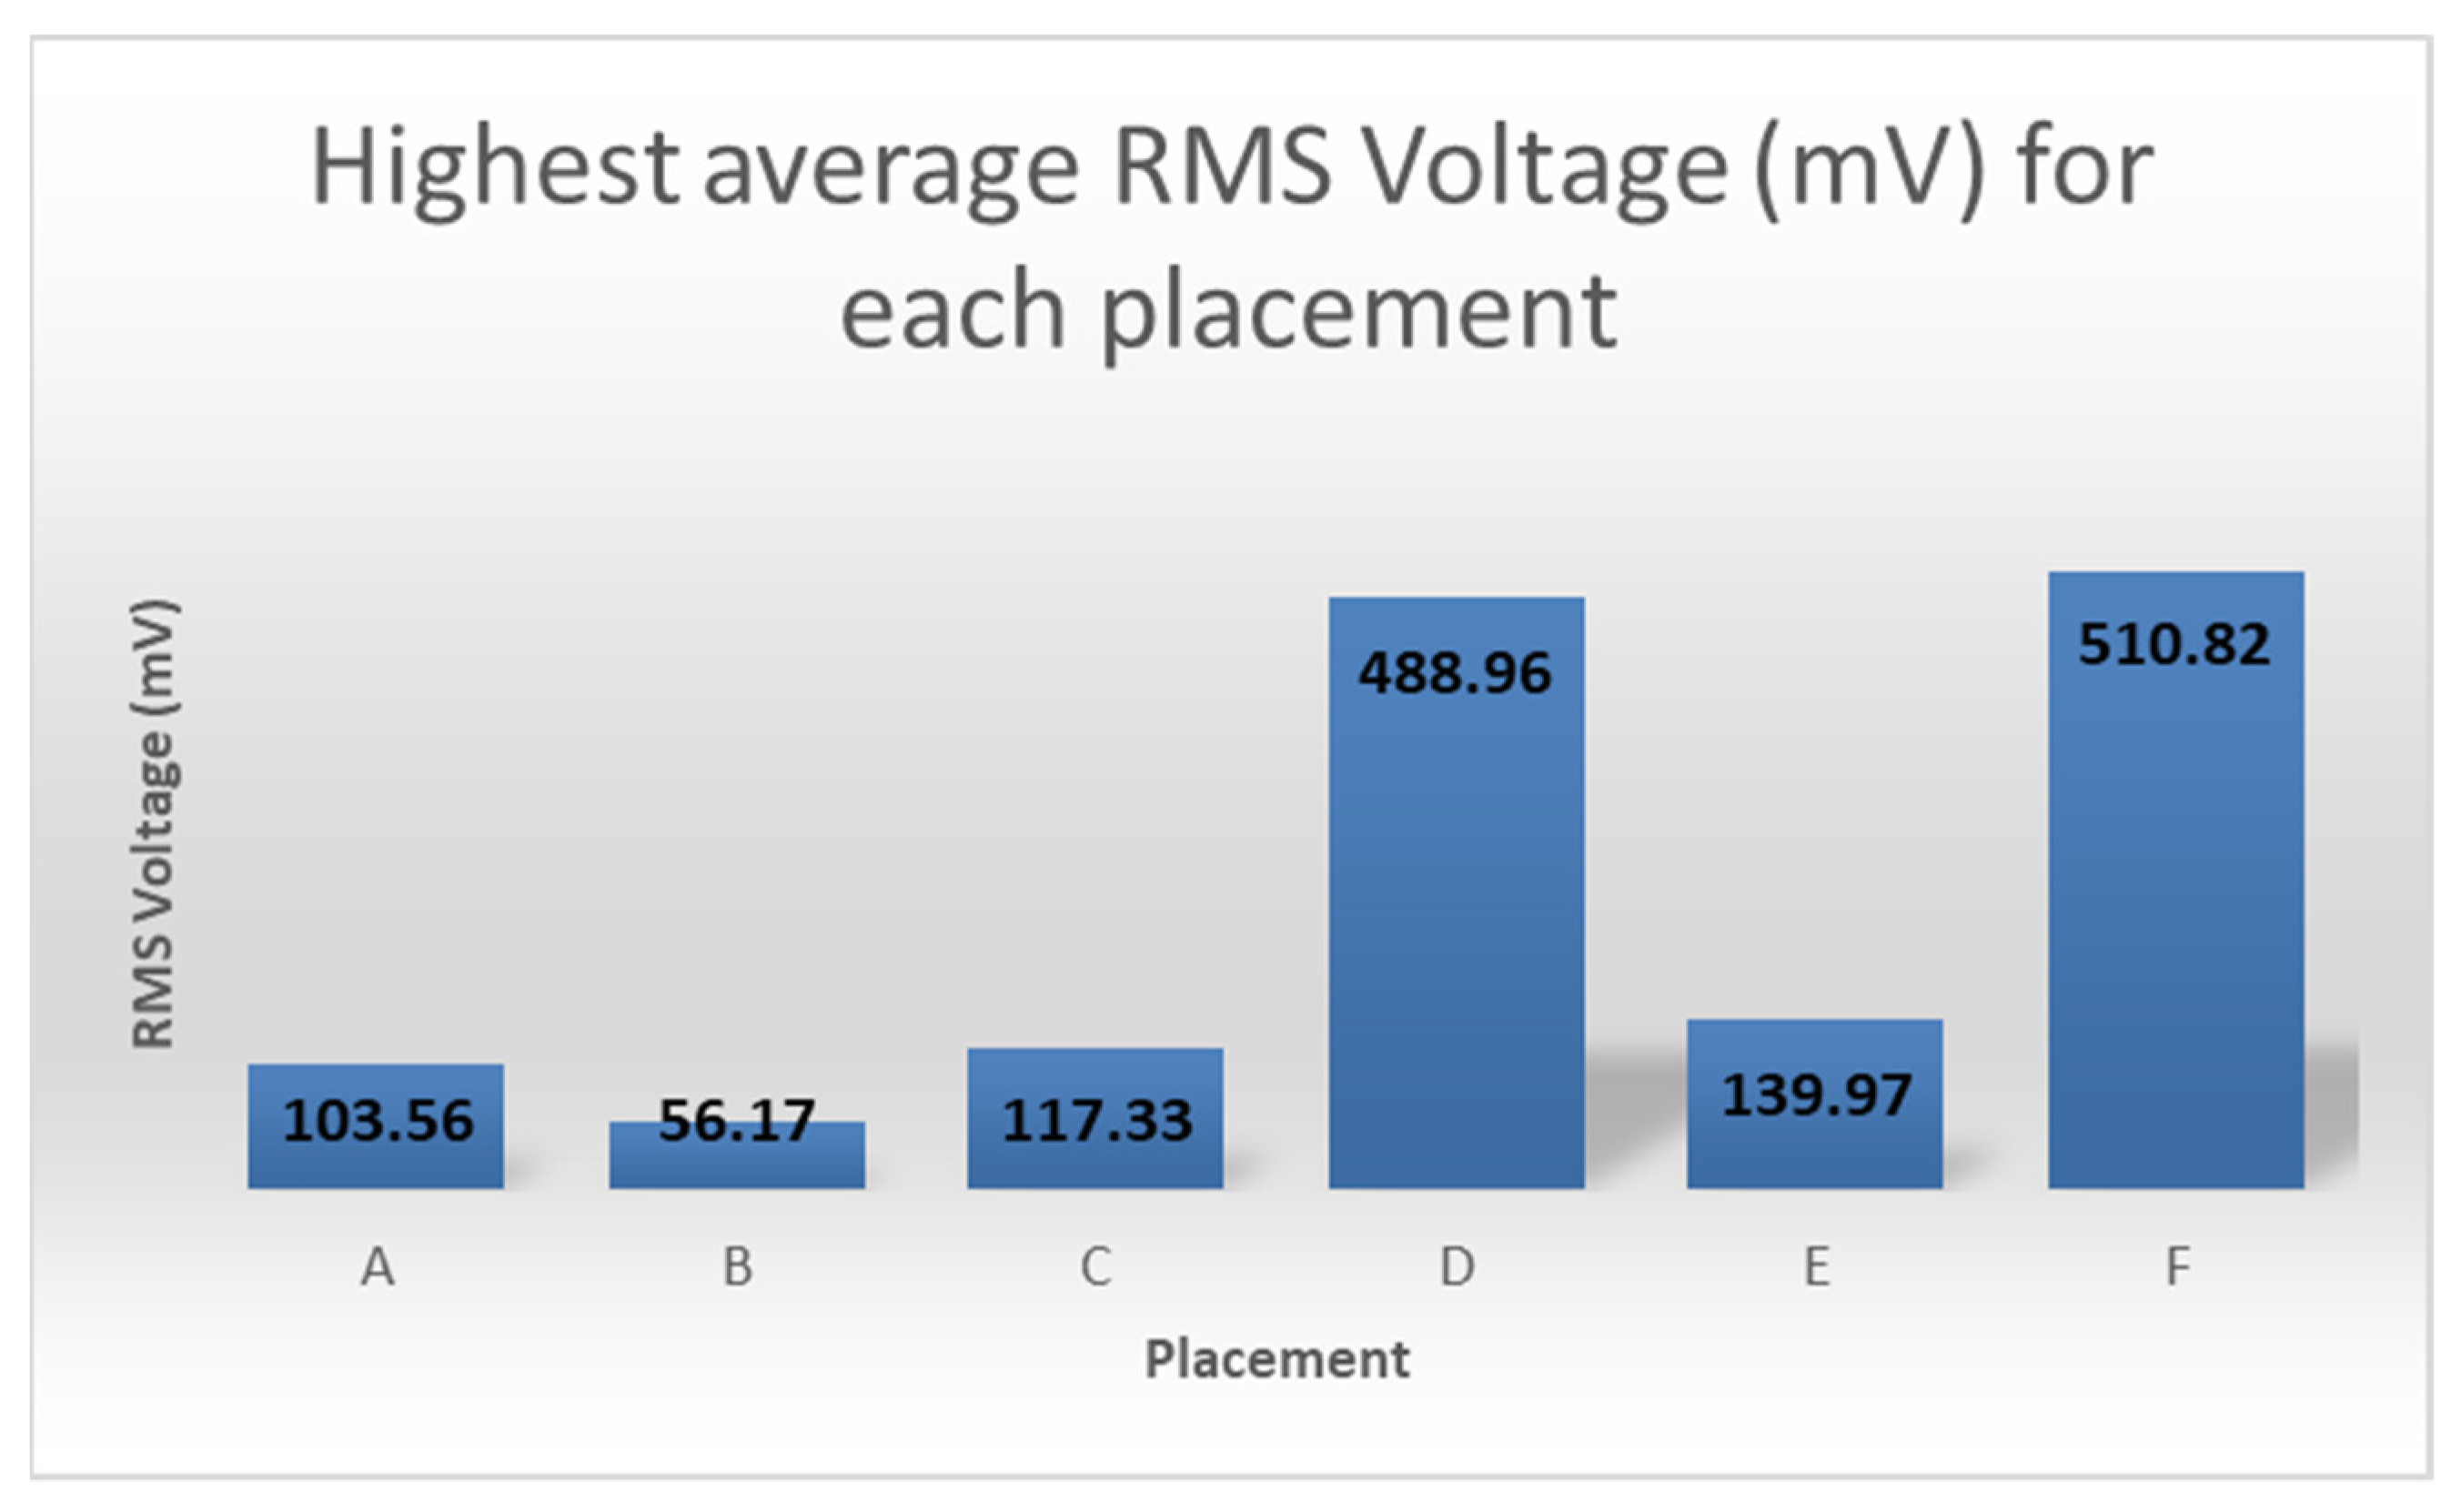
3.2. Voltage Data
- q = electrical charge;
- d33 = piezoelectric constant;
- F = exerted force.
- u = voltage;
- F = the exerted force;
- d = the thickness of the piezoelectric material;
- A = the area of the piezoelectric material;
- d33 = piezoelectric constant;
- e33 = piezoelectric constant.
4. Conclusions
Supplementary Materials
Author Contributions
Funding
Institutional Review Board Statement
Informed Consent Statement
Data Availability Statement
Conflicts of Interest
References
- Wei, C.; Jing, X.; Jing, X. A comprehensive review on vibration energy harvesting: Modelling and realization. Renew. Sustain. Energy Rev. 2017, 74, 1–18. [Google Scholar] [CrossRef]
- Hanif, N.H.H.M.; Mohaideen, A.J.; Azam, H.; Rohaimi, M.E. Rotational piezoelectric energy harvester for wearable devices. Cogent Eng. 2018, 5, 1–11. [Google Scholar] [CrossRef]
- Kim, H.S.; Kim, J.H.; Kim, J. A review of piezoelectric energy harvesting based on vibration. Int. J. Precis. Eng. Manuf. 2011, 12, 1129–1141. [Google Scholar] [CrossRef]
- Siang, J.; Lim, M.H.; Leong, M.S. Review of vibration-based energy harvesting technology: Mechanism and architectural approach. Int. J. Energy Res. 2018, 1–28. [Google Scholar] [CrossRef]
- Arroyo, E.; Badel, A.; Formosa, F.; Wu, Y.; Qiu, J. Comparison of electromagnetic and piezoelectric vibration energy harvesters: Model and experiments. Sens. Actuators A Phys. 2012, 183, 148–156. [Google Scholar] [CrossRef]
- Kokkinopoulos, A.; Vokas, G.; Papageorgas, P. Energy harvesting implementing embedded piezoelectric generators-the potential for the Attiki Odos traffic grid. Energy Procedia 2014, 50, 1070–1085. [Google Scholar] [CrossRef][Green Version]
- Yang, C.C.; Imran Bin Rohimi, R.; Hany Mohamad Hanif, N.H.; Noorjannah Ibrahim, S. Non-intrusive Energy Harvesting from Vibration of Air Conditioning Condenser Unit Utilizing Piezoelectric Sensors. In Proceedings of the 2021 8th International Conference on Computer and Communication Engineering (ICCCE), Kuala Lumpur, Malaysia, 22–23 June 2021; pp. 126–130. [Google Scholar] [CrossRef]
- Yildiz, F.; Dakeev, U.; Baltaci, K.; Coogler, K.L. Energy Harvesting from Air Conditioning Condensers with the use of Piezoelectric Devices. In Proceedings of the 122nd ASEE Annual Conference and Exposition, Seattle, WA, USA, 14–17 June 2015. [Google Scholar]
- Campbell, B.; Dutta, P. Gemini: A Non-invasive, Energy-Harvesting True Power Meter. In Proceedings of the 2014 IEEE Real-Time Systems Symposium, Rome, Italy, 2–5 December 2014; pp. 324–333. [Google Scholar] [CrossRef]
- Zeng, X.; Li, B.; Li, H.; Chen, S.; Chen, Y. Non-invasive energy harvesting for wireless sensors from electromagnetic fields around 10kV three-core power cables. In Proceedings of the 2017 1st International Conference on Electrical Materials and Power Equipment (ICEMPE), Xi’an, China, 14–17 May 2017; pp. 536–539. [Google Scholar] [CrossRef]
- Çengel, Y.A.; Boles, M.A. Thermodynamics: An Engineering Approach, 8th ed.; McGraw-Hill Education: New York, NY, USA, 2015; p. 284. [Google Scholar]
- Lee, S.H.; Ryu, S.M.; Jeong, W.B. Vibration analysis of compressor piping system with fluid pulsation. J. Mech. Sci. Technol. 2012, 26, 3903–3909. [Google Scholar] [CrossRef]
- Park, C.; Kim, S.; Park, G.; Seok, J. Active Mechanical Vibration Control of Rotary Compressors for Air-conditioning Systems. J. Power Electron. 2012, 12, 1003–1010. [Google Scholar] [CrossRef]
- Lee, H.J.; Kim, K.J. Multi-dimensional vibration power flow analysis of compressor system mounted in outdoor unit of an air conditioner. J. Sound Vib. 2004, 272, 607–625. [Google Scholar] [CrossRef]
- Cavallaro, A.; Bullard, C.W. Effects of Varying Fan Speed on a Refrigerator/Freezer System; University of Illinois: Urbana, IL, USA, 1994. [Google Scholar]
- Lee, J.; Choi, B. Development of a piezoelectric energy harvesting system for implementing wireless sensors on the tires. Energy Convers. Manag. 2014, 78, 32–38. [Google Scholar] [CrossRef]
- Covaci, C.; Gontean, A. Piezoelectric Energy Harvesting Solutions: A Review. Sensors 2020, 20, 3512. [Google Scholar] [CrossRef] [PubMed]
- Yang, Z.; Zhou, S.; Zu, J.; Inman, D. High-performance piezoelectric energy harvesters and their applications. Joule 2018, 2, 642–697. [Google Scholar] [CrossRef]
- Najini, H.; Muthukumaraswamy, S. Investigation on the Selection of Piezoelectric Materials for the Design of an Energy Harvester System to Generate Energy from Traffic. Int. J. Eng. Appl. Sci. 2016, 3, 257722. [Google Scholar]
- Butt, Z.; Pasha, R.A.; Qayyum, F.; Anjum, Z.; Ahmad, N.; Elahi, H. Generation of electrical energy using lead zirconate titanate (PZT-5A) piezoelectric material: Analytical, numerical and experimental verifications. J. Mech. Sci. Technol. 2016, 30, 3553–3558. [Google Scholar] [CrossRef]
- Van Schaijk, R.; Elfrink, R.; Oudenhoven, J.; Pop, V.; Wang, Z.; Renaud, M. A MEMS vibration energy harvester for automotive applications. Smart Sens. Actuators MEMS VI 2013, 8763. [Google Scholar] [CrossRef]
- Elfrink, R.; Matova, S.; de Nooijer, C.; Jambunathan, M.; Goedbloed, M.; van de Molengraft, J.; Pop, V.; Vullers, R.J.M.; Renaud, M.; van Schaijk, R. Shock induced energy harvesting with a MEMS harvester for automotive applications. In Proceedings of the 2011 International Electron Devices Meeting, Washington, DC, USA, 5–7 December 2011. [Google Scholar] [CrossRef]
- Zheng, Q.; Tu, H.; Agee, A.; Xu, Y. Vibration Energy Harvesting Device Based on Asymmetric Air-Spaced Cantilevers for Tire Pressure Monitoring System. In Proceedings of the Power MEMS 2009, Washington, DC, USA, 1–4 December 2009; pp. 403–406. [Google Scholar]
- The Air Conditioning Outdoor Unit Exploded Diagram. Available online: http://www.acson-international.com/files/tm/acson/Acson%20TM2009/Technical%20Spec%202009/High%20Ambient%20ALC2025C%20and%20CR/ALC-C(HA)-2009-0001.pdf (accessed on 10 August 2021).
- The Air Conditioning Indoor Unit Specifications. Available online: http://www.acson-international.com/files/leaflet/ACSON/2008/AP-RCM-D-08.pdf (accessed on 10 August 2021).
- Hisham, N.A.; Shaikh Salim, S.A.Z.; Hagishima, A.; Yusoff, N.M. Load and Household Profiles Analysis for Air-Conditioning and Total Electricity in Malaysia. KnE Soc. Sci. 2019. [Google Scholar] [CrossRef]
- The Government of Malaysia Advice on Air Conditioning Temperature Setting. p. 5. Available online: https://www.jpm.gov.my/images/surat_pekeliling/SPA_2-2014.pdf (accessed on 31 August 2021).
- The Malaysian Association for Shopping and Highrise Complex Management Advice on Air Conditioning Temperature Setting. Available online: https://www.thestar.com.my/News/Nation/2013/12/29/Warming-up-to-new-rates-Businesses-to-set-thermostats-higher-to-cope-with-electricity-tariff-hike/ (accessed on 31 August 2021).
- The Piezoelectric Sensor Specifications. Available online: https://www.steminc.com/PZT/en/piezo-ceramic-bimorph-40x10x05mm-2-khz (accessed on 10 August 2021).
- MMF. Metra Mess- und Frequenztechnik in Radebeul e., Piezoelectric Principle. Available online: https://www.mmf.de/piezoelectric_principle.htm (accessed on 31 August 2021).


| Source | Sum of Squares | Degree of Freedom | Mean Square | F | p-Value | F Crit |
|---|---|---|---|---|---|---|
| Between Groups (Factor) | SSF | VF | MSF | F | ||
| Within Groups (Error) | SSE | VE | MSE | |||
| Total | SST |
| Air Volume Flow Rates (Factor B) | |||
|---|---|---|---|
| Temperature (Factor A) | 1 (Low) | 2 (Medium) | 3 (High) |
| 20 °C | y111, …, y11n | y121, …, y12n | y131, …, y13n |
| 22 °C | Y211, …, y21n | y221, …, y22n | y231, …, y23n |
| 24 °C | y311, …, y31n | y321, …, y32n | y331, …, y33n |
| Source | Sum of Squares | Degree of Freedom | Mean Square | F | Fα,v1,v2 | Significant (Yes/No) |
|---|---|---|---|---|---|---|
| Factor A | SSA | vA | MSA | FA | Fα,vA,vE | |
| Factor B | SSB | vB | MSB | FB | Fα,vB,vE | |
| Factor AB | SSAB | vAB | MSAB | FAB | Fα,vAB,vE | |
| Error | SSE | vE | MSE | |||
| Total | SST |
| Significant? | |||
|---|---|---|---|
| Temperature | 20 °C | 22 °C | 24 °C |
| Point A | Yes | Yes | Yes |
| Point B | Yes | Yes | Yes |
| Point C | Yes | Yes | Yes |
| Point D | Yes | Yes | No |
| Point E | Yes | Yes | Yes |
| Point F | Yes | Yes | Yes |
| Significant (Yes/No) | |||
|---|---|---|---|
| Placement | Factor A (Temperature) | Factor B (Air Volume Flow Rates) | Factor AB |
| A | Yes | Yes | No |
| B | Yes | Yes | No |
| C | Yes | Yes | No |
| D | Yes | Yes | No |
| E | Yes | Yes | No |
| F | Yes | Yes | No |
| Significant (Yes/No) | |||
|---|---|---|---|
| Placement | Factor A | Factor B | Factor AB |
| A | No | Yes | No |
| B | Yes | Yes | No |
| C | Yes | Yes | No |
| D | Yes | Yes | No |
| E | Yes | Yes | No |
| F | Yes | Yes | No |
Publisher’s Note: MDPI stays neutral with regard to jurisdictional claims in published maps and institutional affiliations. |
© 2021 by the authors. Licensee MDPI, Basel, Switzerland. This article is an open access article distributed under the terms and conditions of the Creative Commons Attribution (CC BY) license (https://creativecommons.org/licenses/by/4.0/).
Share and Cite
Yang, C.C.; Bin Noor Hanafi, N.F.R.; Bt Mohamad Hanif, N.H.H.; Ismail, A.F.; Chang, H.-H. A Novel Non-Intrusive Vibration Energy Harvesting Method for Air Conditioning Compressor Unit. Sustainability 2021, 13, 10300. https://doi.org/10.3390/su131810300
Yang CC, Bin Noor Hanafi NFR, Bt Mohamad Hanif NHH, Ismail AF, Chang H-H. A Novel Non-Intrusive Vibration Energy Harvesting Method for Air Conditioning Compressor Unit. Sustainability. 2021; 13(18):10300. https://doi.org/10.3390/su131810300
Chicago/Turabian StyleYang, Chuan Choong, Noor Fiqri Razqi Bin Noor Hanafi, Noor Hazrin Hany Bt Mohamad Hanif, Ahmad Faris Ismail, and Hsueh-Hsien Chang. 2021. "A Novel Non-Intrusive Vibration Energy Harvesting Method for Air Conditioning Compressor Unit" Sustainability 13, no. 18: 10300. https://doi.org/10.3390/su131810300
APA StyleYang, C. C., Bin Noor Hanafi, N. F. R., Bt Mohamad Hanif, N. H. H., Ismail, A. F., & Chang, H.-H. (2021). A Novel Non-Intrusive Vibration Energy Harvesting Method for Air Conditioning Compressor Unit. Sustainability, 13(18), 10300. https://doi.org/10.3390/su131810300