1. Introduction
Land-use/-cover change (LUCC) affects global and regional climate change [
1] and the ecological environment and biodiversity. It also plays a key role in the relationship between humans and the natural environment [
2], and it is a critical aspect of sustainable development research [
3]. Land-use changes can alter the pattern, process, and function of an ecosystem [
4], thus having a profound impact on the regional ecological environment [
5].
Much of the research on land-use spatiotemporal change patterns focuses on the land-use transfer matrix [
6], land-use dynamics [
7], gradient analysis [
8], ecological effect evaluation [
9], and other related aspects. Hence, the research results are mostly land-use model simulations and predictions [
10,
11,
12] and driving mechanisms [
13,
14]. Recent studies showed that the value of ecosystem services [
15], water-resource utilization [
16], regional ecosystem environment patterns [
17], and other activities are directly or indirectly affected by land-use changes. Zhang [
18] selected socioeconomic data to build a complex driving mechanism model, discovering that the total regional population, GDP, and other socioeconomic factors are the main driving forces of land-use system changes. Additionally, research conducted by Guillaume is of great significance in dealing with the impact of land-use transformation on a wide range of potential ecologies [
19]. Generally speaking, it is clear from the literature that global climate change and human activities are the two main factors affecting LUCC [
20]. Deepening the analysis of the temporal and spatial evolution and driving factors of land use can improve our understanding of sustainable development and help us better examine the relationship between people and land use.
The Tarim River Basin, with a drainage area of about 1.02 million km
2, is the largest inland river basin in China. It is also the core area for the construction of the Silk Road Economic Belt [
21]. The Tarim River Basin has an arid climate and features the dual characteristics of relatively rich natural resources and an extremely fragile ecological environment [
22,
23]. The economic layout and structure, the speed and scale of economic development, and regional ecological and environmental problems are all closely related to water.
The processes of oasis and desertification and the restoration of fragile ecosystems are all facing huge challenges. Due to escalating drought stress and human activities, land-use types have accordingly changed. How to deal with the relationship between resource development and ecology and environmental protection is a problem that urgently needs to be solved [
24]. Therefore, it is crucial to study and interpret land-use and -cover changes in this area in order to determine the laws undergirding the changes and avoid risks associated with water-resource development.
This study used the distribution characteristics of land use as a starting point to analyze the current status and change characteristics of land use in the Tarim River Basin. The two indicators of natural factors and human activities were selected, and the driving mechanisms of land-use change were analyzed through factors such as temperature and precipitation, social and economic centers of gravity, and night light. In addition, the study explores the causes and processes of LUCC under the combined influence of the natural environment and economic and social factors, provides scientific data for enriching the study of land-use changes in typical extreme arid areas, and serves as a scientific information resource for ecological environment protection in arid areas [
25], land-use planning, and the sustainable use of water resources.
2. Data and Materials
2.1. Study Area
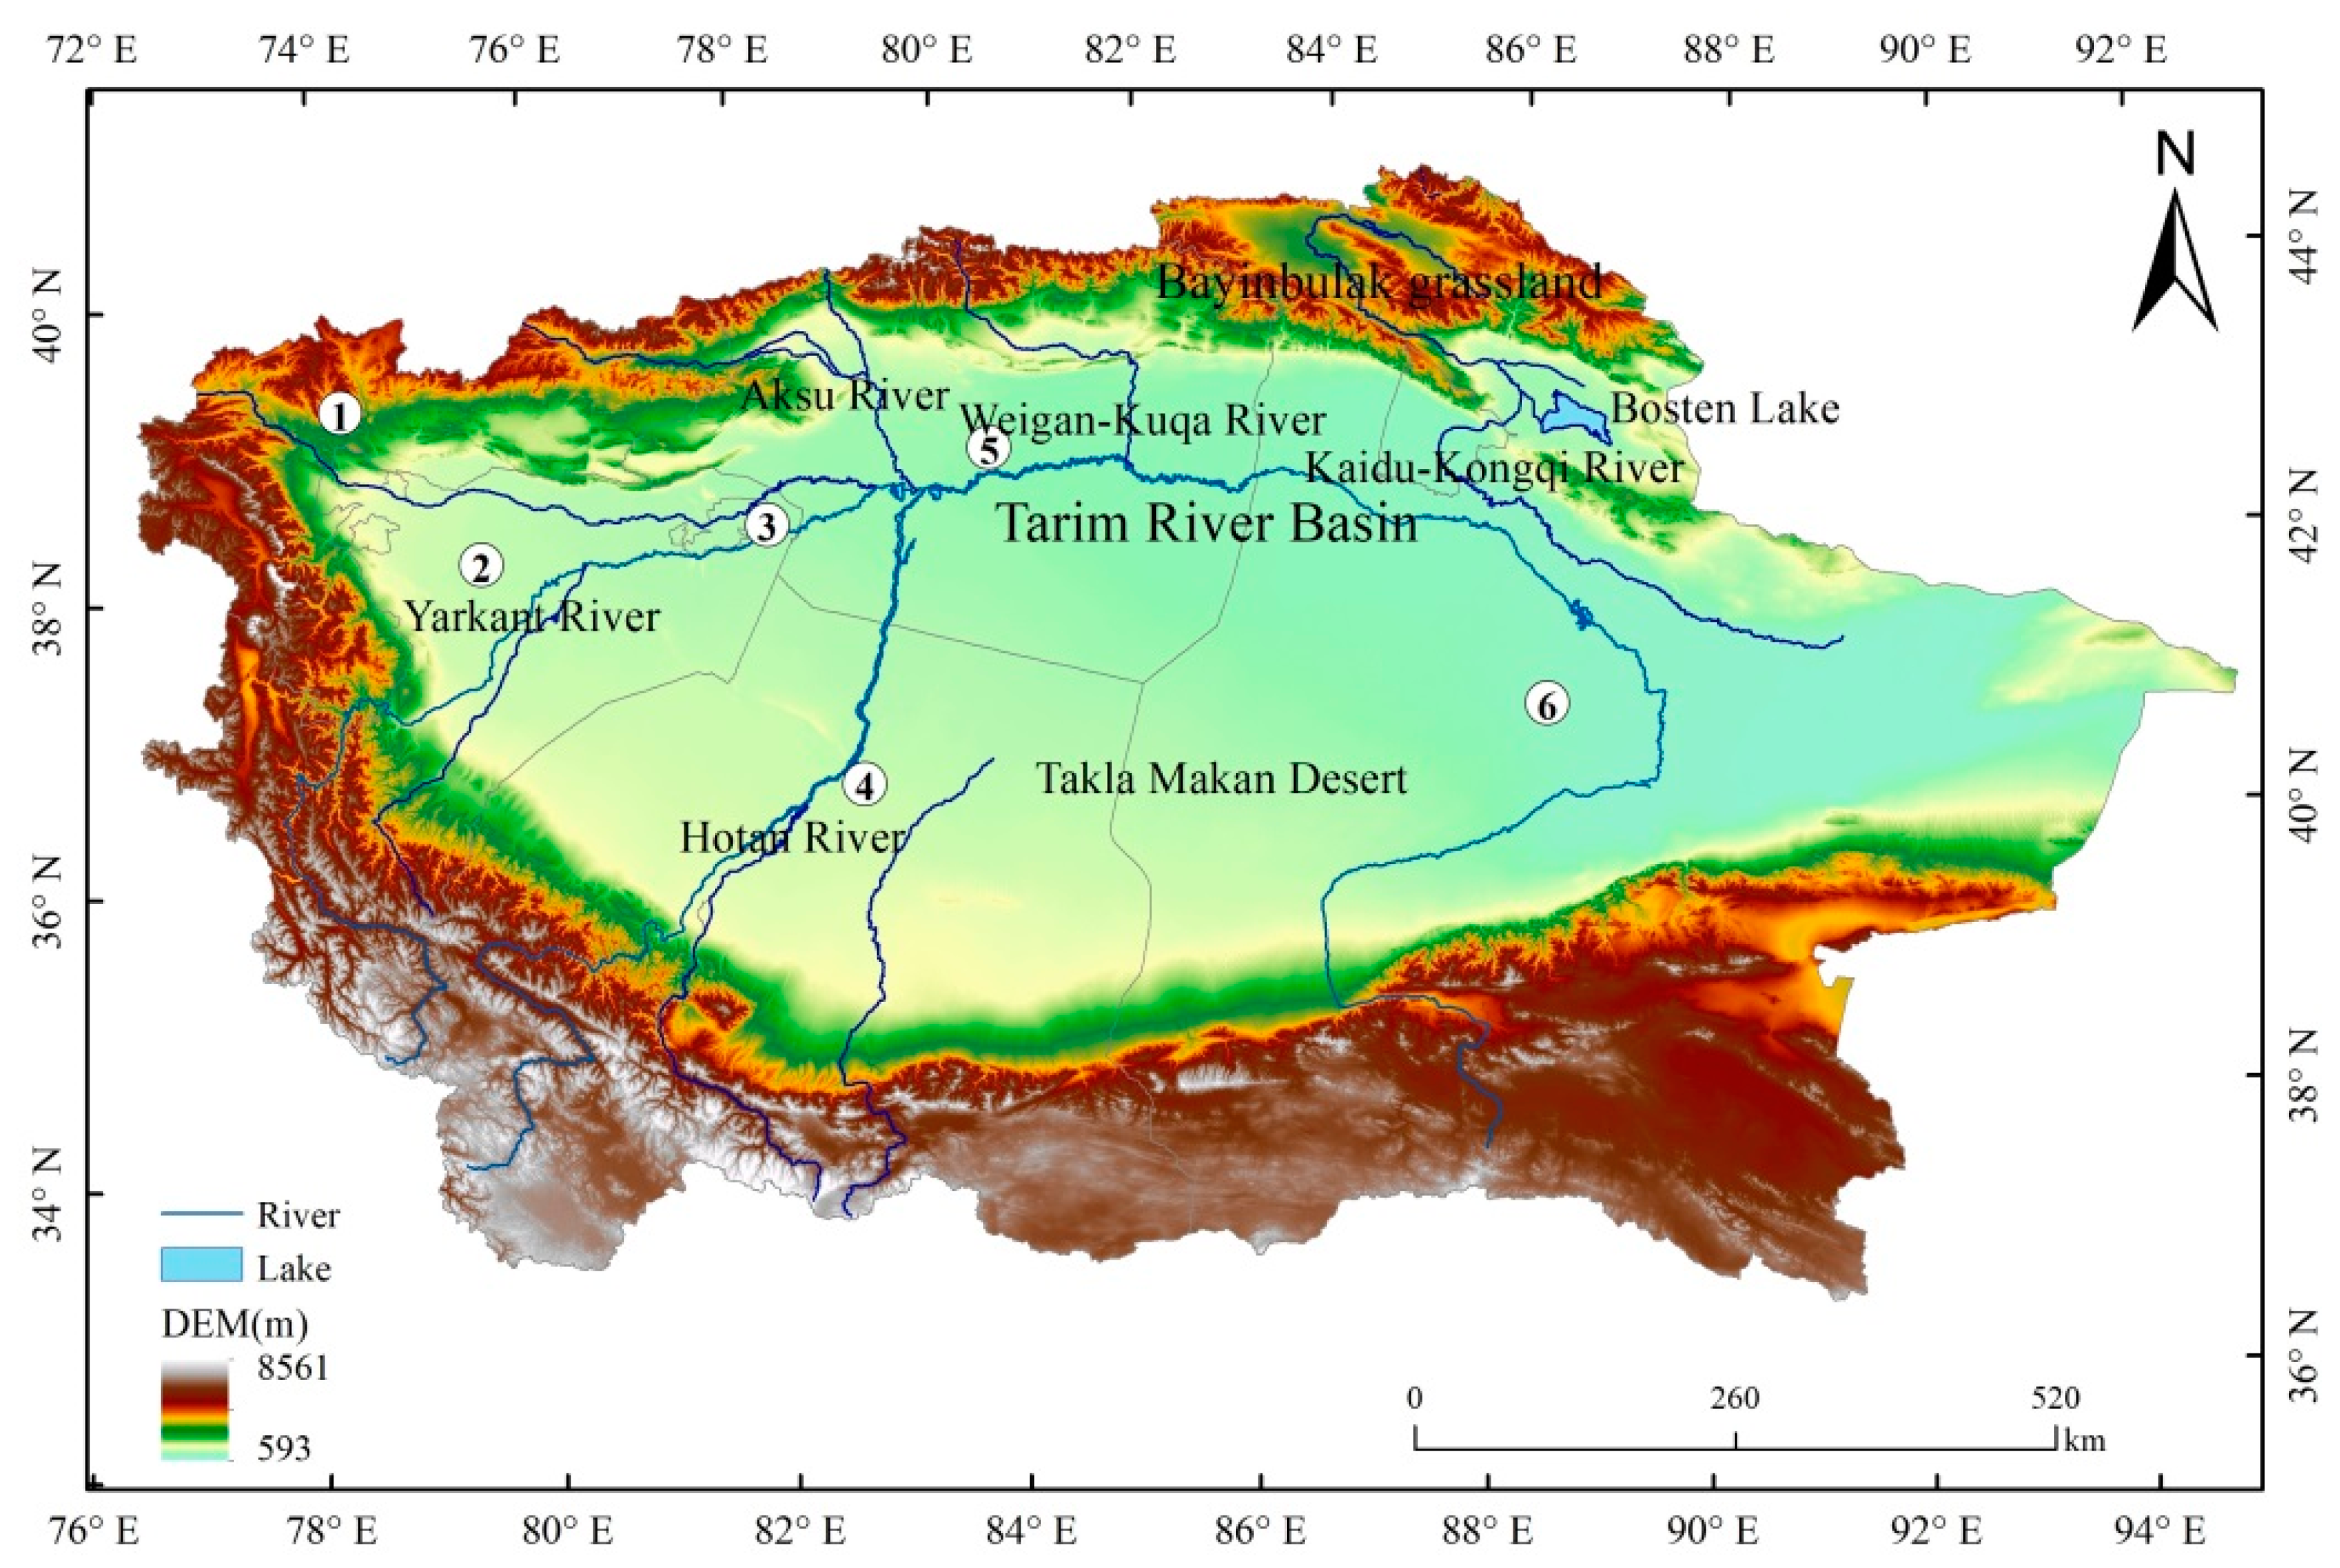
The Tarim River Basin, which is the largest inland river basin in China, is located in the southern part of Xinjiang (73°10′–94°05′ E, 34°55′–43°08′ N). The basin is fringed by the Tianshan Mountains to the north, the Kunlun Mountains to the south, and the Pamirs to the west (
Figure 1). The region covers about 103 × 10
4 km
2 and accounts for 61.82% of the total area of Xinjiang. Across this vast expanse, there are 114 rivers in 9 major river systems. However, despite the presence of so many water bodies, the basin still has the characteristics of an arid climate, which includes sparse precipitation, strong evaporation, and large temperature differences between day and night. More specifically, it has an extreme arid climate typical of the continental warm temperate zone, with an average annual temperature of 10.6 °C and average annual rainfall of 89.1 mm.
Geopolitically, the Tarim River basin comprises five prefectures, namely, the Bayingoleng Mongolian Autonomous, Aksu, Kashgar, Kizilsu Kirgiz Autonomous, and Hetian Prefectures; 42 counties and cities; and the first, second, and third Agricultural Divisions of the Corps. The division and Hotan Agricultural Reclamation Administration combine to a total of 56 land-reclamation groups, which are multiethnic settlements dominated by Uyghurs. At the end of 2018, the total population of the Tarim River Basin was 72.749 million, and the per capita GDP of the region was CNY 342.912 billion [
26,
27].
2.2. Data Sources
Land-use data were obtained from TM land-use data in Xinjiang from 1990 to 2018, published by the Resource and Environmental Science and Data Center of the Chinese Academy of Sciences (
http://www.resdc.cn/ (accessed on 11 May 2021)). Spatial resolution is 30 m, according to the national standard of the Classification of Land Use Status. A human–computer interaction interpretation method was adopted using the first-level standard classification system. By combining the actual situation and research purpose of the study area, the Tarim River Basin was divided into six categories in
Table 1: cultivated land, forest land, grassland, water area, construction land, and unused land [
28].
NDVI data came from United States NASA EOS/MODIS data (
http://wist.echo.nasa.gov/api (accessed on 2 May 2021)). The MOD13Q1 product used in this study has a spatial resolution of 250 × 250 m and an interval of 16 days. The MODIS remote-sensing image covering the entire watershed has 6 scenes (h23v04, h23v05, h24v04, h24v05, and h25v05) and provides a total of 23 time-phase data per year.
Meteorological data were obtained from the China Meteorological Science Data Sharing Service Network (
http://cdc.cma.gov.cn (accessed on 26 May 2021)); monthly average data and monthly precipitation data were selected from standard meteorological stations in the Tarim River Basin. In accordance with the latitude and longitude information of each meteorological station, Kriging spatial interpolation was performed on the data to obtain the annual average temperature and annual average precipitation of the basin.
Social economy and demographic data employed in this study came from the 1990–2019 Xinjiang Statistical Yearbook and Xinjiang Production and Construction Corps Statistical Yearbook.
Night-light data were sourced from the National Geophysical Data Center (
http://www.ngdc.noaa.gov/ (accessed on 15 April 2021)), using the Defense Meteorological Satellite Program Operational Linescan System (DMSP_OLS) to stabilize both night-light data and NPOESS Preparatory Project-Visible Infrared Imaging Radiometer (NPP-VIIRS) data. Stable DMSP_OLS night-light data remove the effects of accidental lights such as lightning, natural gas burning, fire, and fishing boats and are not easily disturbed by light-saturation problems [
29]. NPP-VIIRS data solve the problem of the saturation of the DN value of the city’s center of gravity, making it easier to detect more subtle light sources.
2.3. Methods
2.3.1. Normalized Difference Vegetation Index Calculation
The NDVI is currently the most widely used vegetation index method. The principle behind the NDVI is to increase the difference in chlorophyll absorption between the green leaf near-infrared spectral channel and the red spectral channel in vegetation [
30]; its formula is as follows:
where
R is the visible light red band,
NIR is the near-infrared band, and the
NDVI value range is [−1, 1].
NDVI < 0 represents water, snow, glaciers, etc. on the ground;
NDVI = 0 represents components such as deserts and bare ground;
NDVI > 0 represents the growth of surface vegetation.
2.3.2. Land-Use Center-of-Gravity Model
The overall characteristics of spatial changes in regional land use can be intuitively expressed by shifts in the center of gravity. By analyzing the direction and distance of the center-of-gravity shift of each land-use type, we can, to a certain extent, understand the distribution characteristics of a spatial change in land-use types. The direction and distance of the center-of-gravity migration can be linked to regional natural economic conditions and may also reflect changes in the quality of land-use types. The transfer direction and distance of the center of gravity can be expressed by the change in center-of-gravity coordinates [
31]. This section uses the center-of-gravity model formula to explore the migration of the land-use center of gravity. The calculation formula of barycentric coordinates is:
where
Xti and
Yti represent the latitude and longitude coordinates of the center of gravity of a certain land resource in year
t, respectively;
Ct represents the area of the land resource in the
i-th small area; and
Xi and
Yi represent the latitude and longitude coordinates of the geometric center of the
i-th small area (or the location of the flag county), respectively.
The calculation formula of the center-of-gravity movement distance in the area may be expressed as:
where the distance of the center of gravity from year
t to year
j in the
Ct−j study area unit is km,
R is a constant, and the value of 111.111 is the coefficient for converting geographic coordinates into plane distance.
2.3.3. Mutual Correction of Images
The mutual correction of remote-sensing images ensures that the DN value of luminous remote-sensing data has temporal and spatial continuity [
32].
where
DN and
DN0 (uncalibrated) are the
DN value of the image before and after correction, respectively, while
a,
b, and
c are regression coefficients.
3. Results
3.1. Spatiotemporal Change Characteristics of Land Use
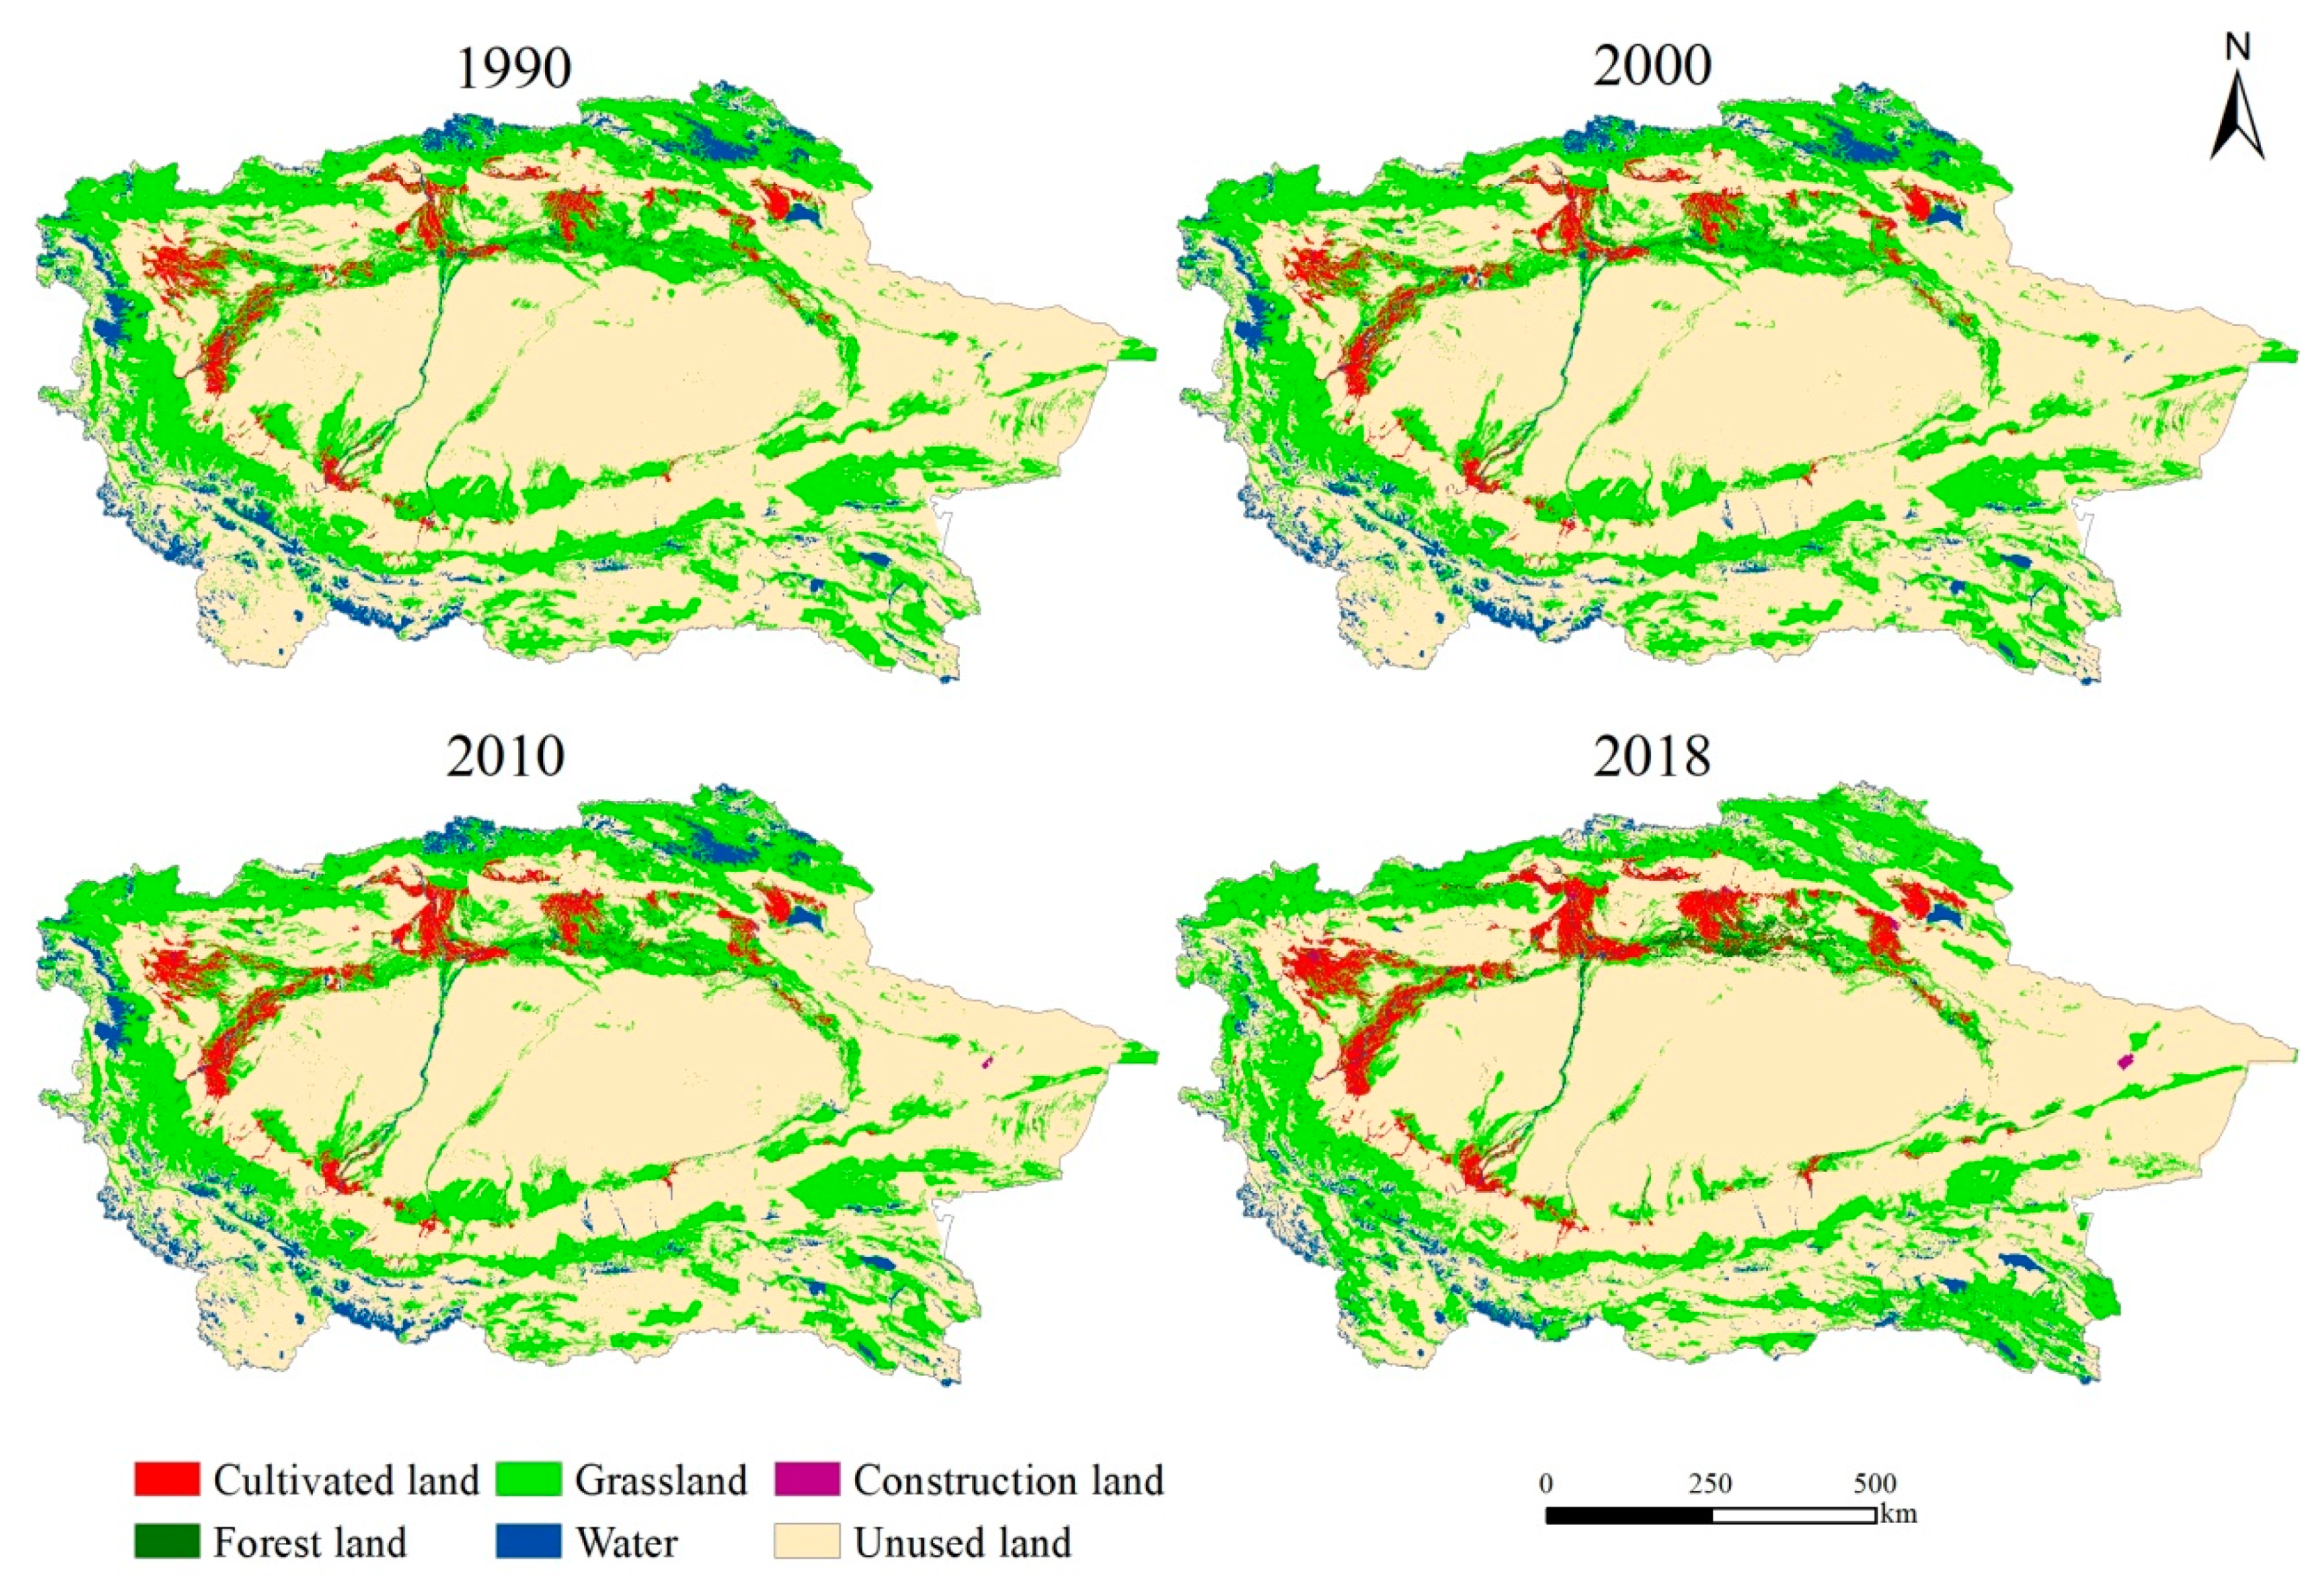
Largely due to the development of the One Belt and One Road initiative, land-use types in the Tarim River Basin significantly changed from 1990 to 2018 (
Figure 2). Unused land constitutes the main land-use type in the basin, accounting for more than 64% of the total area. Concentrated in the middle and northeast of the study zone, unused land cover is mainly desert. Grass area is second only to unused land and is distributed in the west and north of the basin. Water bodies are distributed in the north and southwest, forestland is abundant only in the lower reaches of the Tarim River, and cultivated land is concentrated along the Kashgar, Yarkant, and Aksu Rivers, the Weigan–Kuqa River vicinity, and Bosten Lake. Lastly, construction land is sparsely distributed and exists only sporadically in cultivated land areas.
From 1990 to 2018, change rates of cultivated and construction land were as high as 73.95% and 87.47%, respectively (
Table 2). The total area of cultivated land increased to 181.39 × 10
4 hm
2 by 2018 through expansion, primarily in the Kashgar, Yarkant, Aksu, and Weigan–Kuqa River basins. During the same time period, forestland initially increased and then decreased, with the change rate being the largest from 1990 to 2000. The increased area of forestland was 6.51 × 10
4 hm
2, but that dropped to 5.25 × 10
4 hm
2. Grassland also showed a decreasing trend, with the total area decreasing by 185.29 × 10
4 hm
2 at a rate of 6.38 × 10
4 hm
2 per year. Water area suffered serious degradation, with the greatest reduction occurring between 2010 and 2018. Overall water-body areas dropped to just 131.08 × 10
4 hm
2. Meanwhile, construction land showed the largest change rate, decreasing slightly before increasing, and unused land showed fluctuating changes across the entire study period, with an overall increase in area of 113.18 × 10
4 hm
2.
3.2. Land-Use Conversion
In the Tarim River Basin from 1990 to 2018, frequent land-use conversions occurred among different land-use types. The main conversions were between grassland and unused land. Land-use changes differed significantly across different years (
Table 3). For example, from 1990 to 2000, the total transferred area of land-use type was 321.29 × 10
4 hm
2, among which the maximal transferred area of grassland was 162.32 × 10
4 hm
2. This land type was mainly converted into unused and cultivated land, accounting for 61.06% and 25.27%, respectively. Only 73.23 × 10
4 hm
2 was converted into grassland by other land-use types, which mainly came from unused land, 41.43 × 10
4 hm
2. Unused-land area that was transferred out comprised 80.83 × 10
4 hm
2 in total; of this, 41.43 × 10
4 hm
2 was grassland, and 27.81 × 10
4 hm
2 was water. A total area of 33.8 × 10
4 hm
2 of cultivated land was converted into other land-use types (mostly grassland) and showed an expansion trend. Total water area was 393.35 × 10
4 hm
2, and the area that did not change was 362.03 × 10
4 hm
2.
Overall, the dominant transfer type was 21.65 × 10⁴ hm2 of unused land and 8.37 × 10⁴ hm2 of grassland. The total amount of forestland and construction land was 7.81 × 10⁴ hm2 and 5.21 × 10⁴ hm2, and the main type of land was cultivated land, with an area of 3.18 × 10⁴ and 4.62 × 10⁴ hm2, respectively.
The area of participating land-use transfer from 2000 to 2018 was 2438.78 × 10
4 hm
2 (
Table 4). Grassland comprised the largest amount (1084.64 × 10
4 hm
2), accounting for 44% of the total converted area. The most common converted land-use types were 863.52 × 10
4 hm
2 of unused land and 122.05 × 10
4 hm
2 of cultivated land. The reason for the conversion was that overgrazing and human activities had reduced the grassland area.
Construction land, as the land-use type with the largest change rate, was mainly converted from cultivated and unused land. On the basis of recommendations on urbanization and industrialization processes in the study area, the demand for construction land increased from 15.04 × 10⁴ hm2 in 2000 to 29.47 × 10⁴ hm2 in 2018. By 2018, the area of cultivated land had increased by about 60% compared with 2000, which represented an increase of 159.24 × 10⁴ hm2.
Additionally, due to the increase in population and the intensification of human activities, cultivated land area greatly expanded. Meanwhile, water area decreased from 407.45 × 10⁴ hm2 in 2000 to 274.05 × 10⁴ hm2 in 2018. At the same time, the degradation of water resources increased as the amount of cultivated land in the study area increased. The rise in irrigation water consumption also contributed to the drop in water area. The unused land area showed an expansion trend into grassland (843.88 × 10⁴ hm2), but as a result of grassland degradation and water-resource consumption, desertification in the study area was aggravated.
3.3. Spatial–Temporal Change Characteristics of NDVI
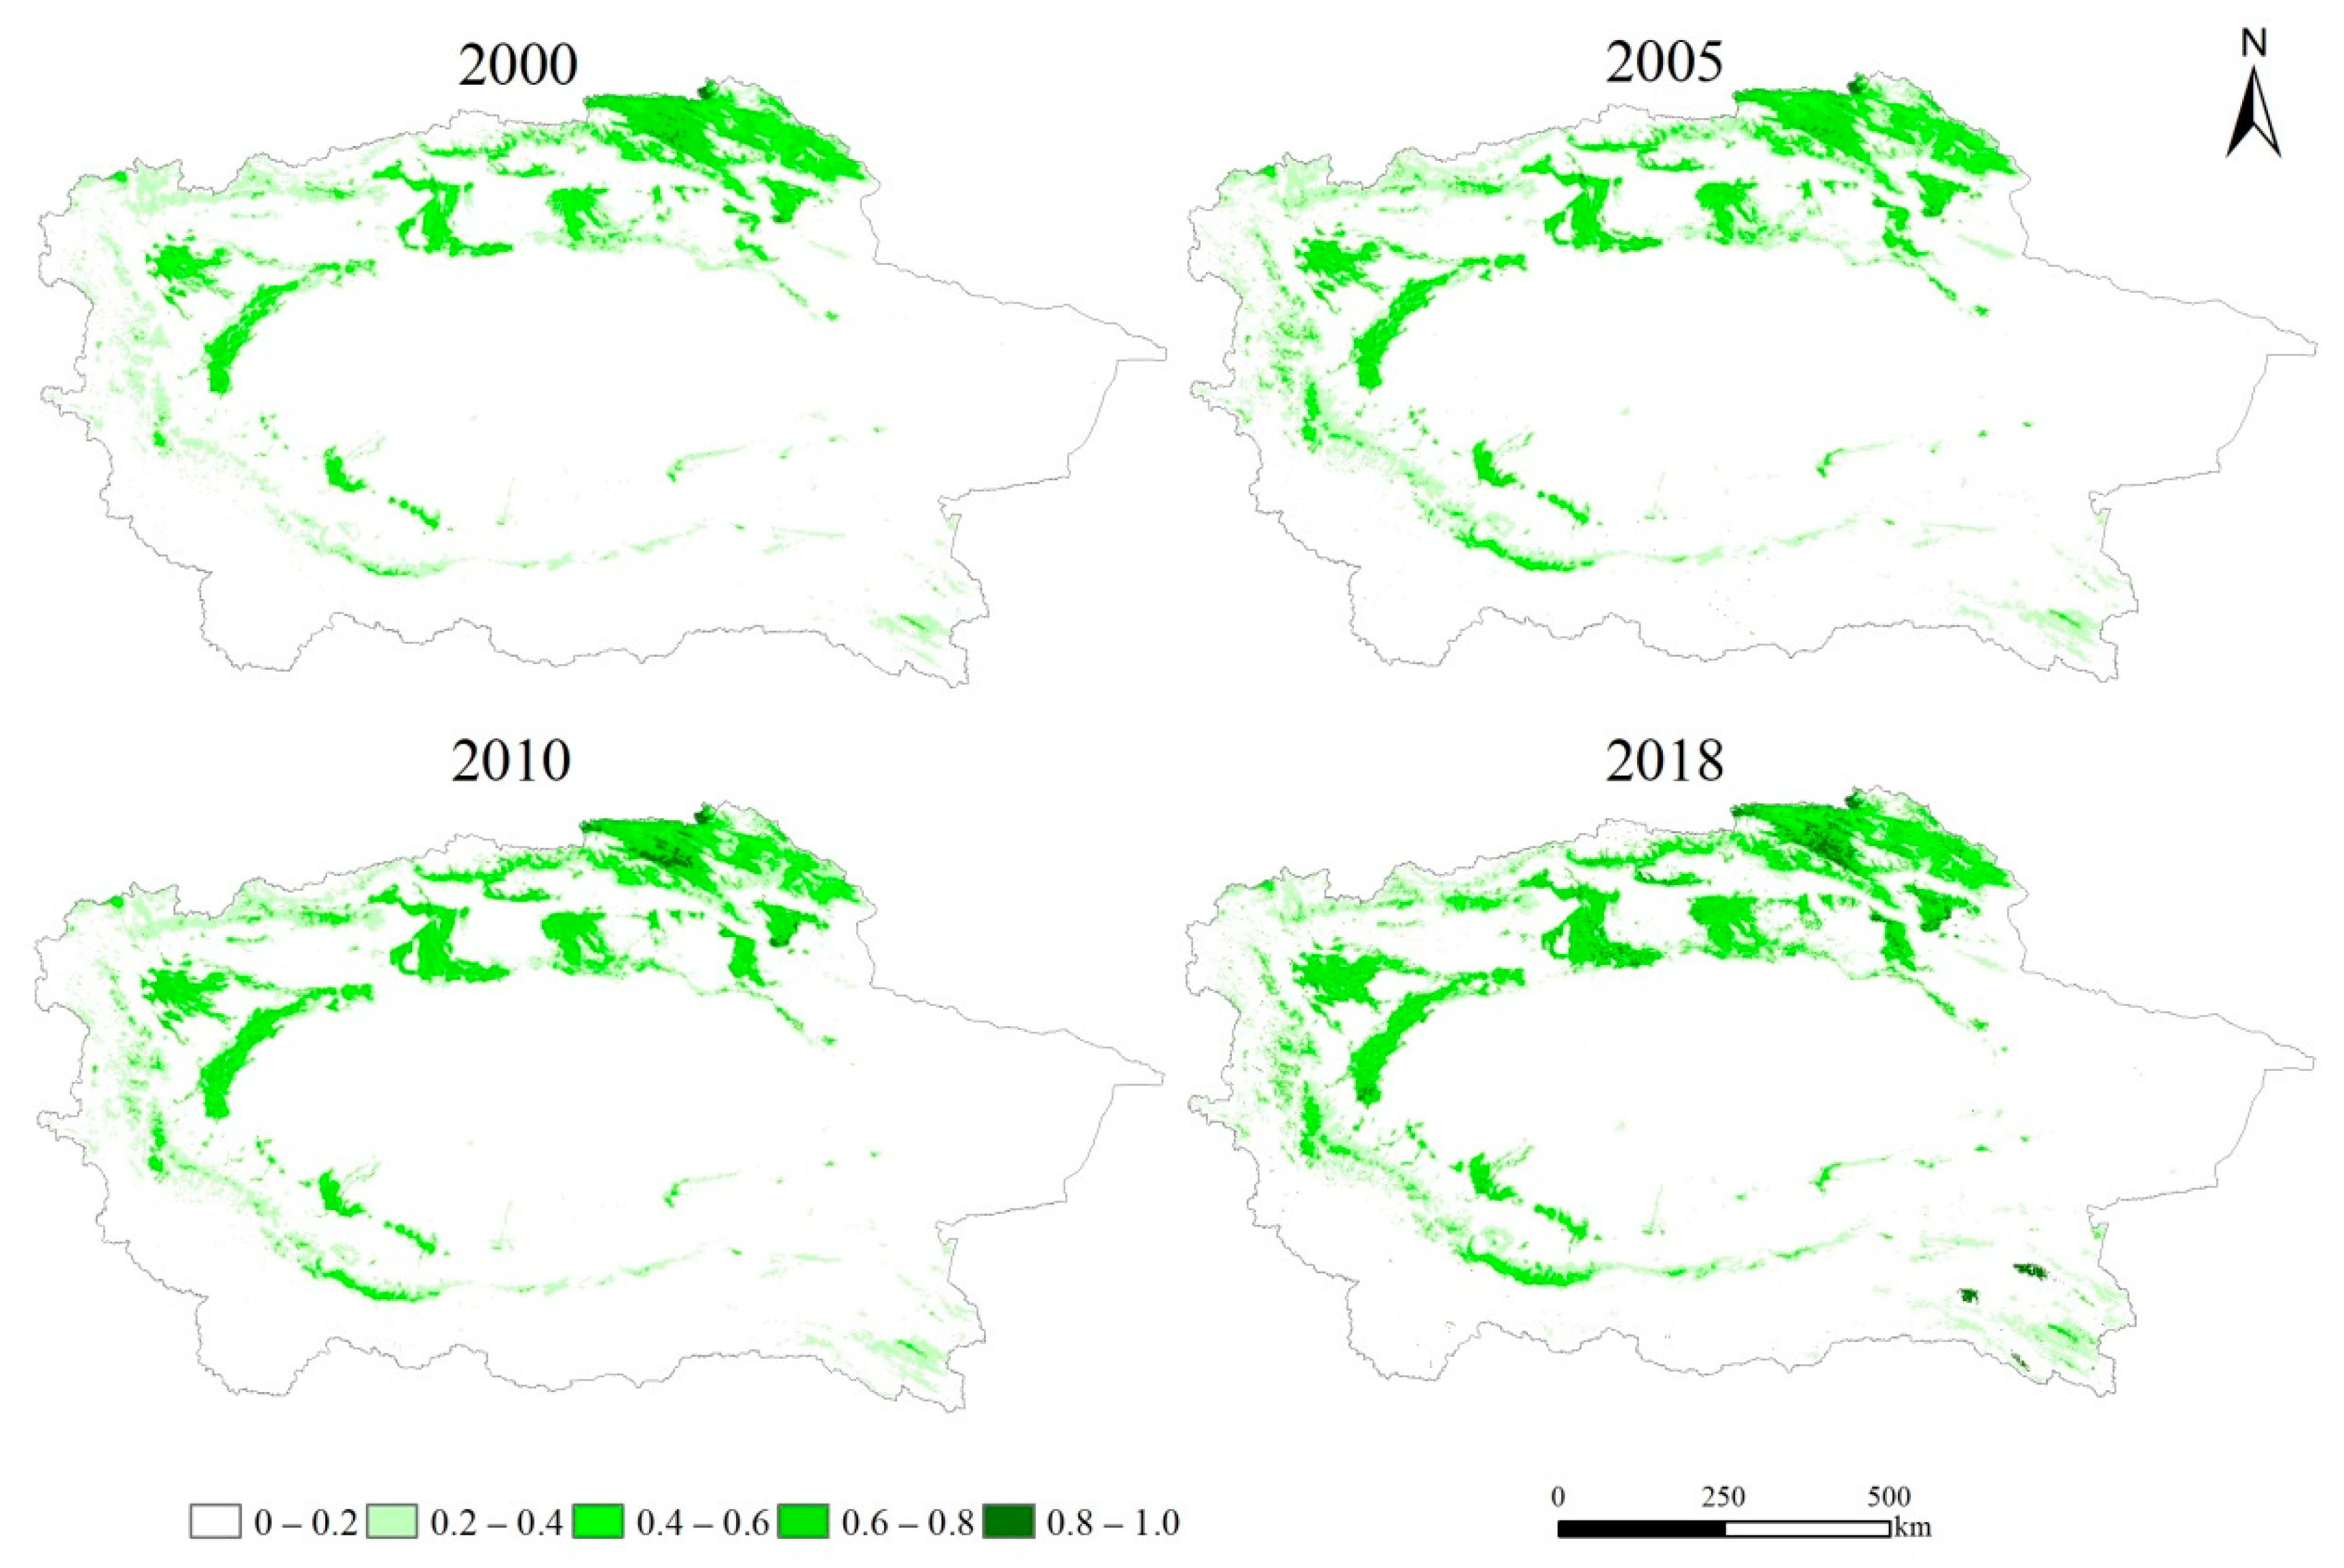
This study explored changes in natural vegetation coverage in the Tarim River Basin by comparing and analyzing the change characteristics of natural vegetation NDVI in the second quarter of 2000–2018. From 2000 to 2018, the natural vegetation coverage in the study area showed spatial distribution characteristics of high in the middle and low in the surrounding area, high in the northwest and low in the southeast, and high in the oasis and low in the desert (
Figure 3). The spatial distribution characteristics of NDVI are divided into five levels, namely, 0 < NDVI ≤ 0.2, 0.2 < NDVI ≤ 0.4, 0.4 < NDVI ≤ 0.6, 0.6 < NDVI ≤ 0.8, and 0.8 < NDVI ≤ 1.0. The high NDVI area is mainly concentrated at the northern edge of the study area and the mountainous areas in the southern part of the study area. Mountain grassland is the most abundant vegetation type. The northern area of the study area has a higher altitude, abundant precipitation, and suitable air humidity. The characteristics of these conditions with less human activity make the area highly suitable for vegetation growth. However, there are fewer high-value areas in the southeast of the study area.
Low-value areas are primarily distributed in the southern portion of the study area (i.e., the southern part of the Taklimakan Desert). This area is primarily a desert zone, and the natural environment is unsuitable for vegetation growth. Areas classified as 0.8 < NDVI ≤ 1.0 are mostly concentrated in the northern part of the basin and exhibited an increasing trend, from 5.12 × 10⁴ hm2 in 2000 to 26.56 × 10⁴ hm2 in 2018, while areas with 0.6 < NDVI ≤ 0.8 are mostly distributed in the northern part of the study area, along with a few small pockets in the northwest and south. This type of area is mainly at mid-elevation and features good vegetation growth conditions. Although the overall area of this region showed a rising trend from 2000 to 2018, increasing by 44.71 × 10⁴ hm2, it is easily affected by human activities.
Areas categorized as 0.4 < NDVI ≤ 0.6 are mostly distributed in plains and basins, where vegetation growth conditions are better, while areas with 0 < NDVI ≤ 0.2 are mostly distributed in the central, southern, and western regions of the study area. Because this area is located in the desert–oasis transition zone with less rainfall, natural vegetation growth requires more water resources and is also affected by human activities. Vegetation distribution in this area is reduced and showed a decreasing trend, from the original 2038 × 104 to 1671.21 × 104 hm2. The annual rate is 20.08 × 10⁴ hm2.
3.4. Shift of Center of Gravity of Land-Use Types
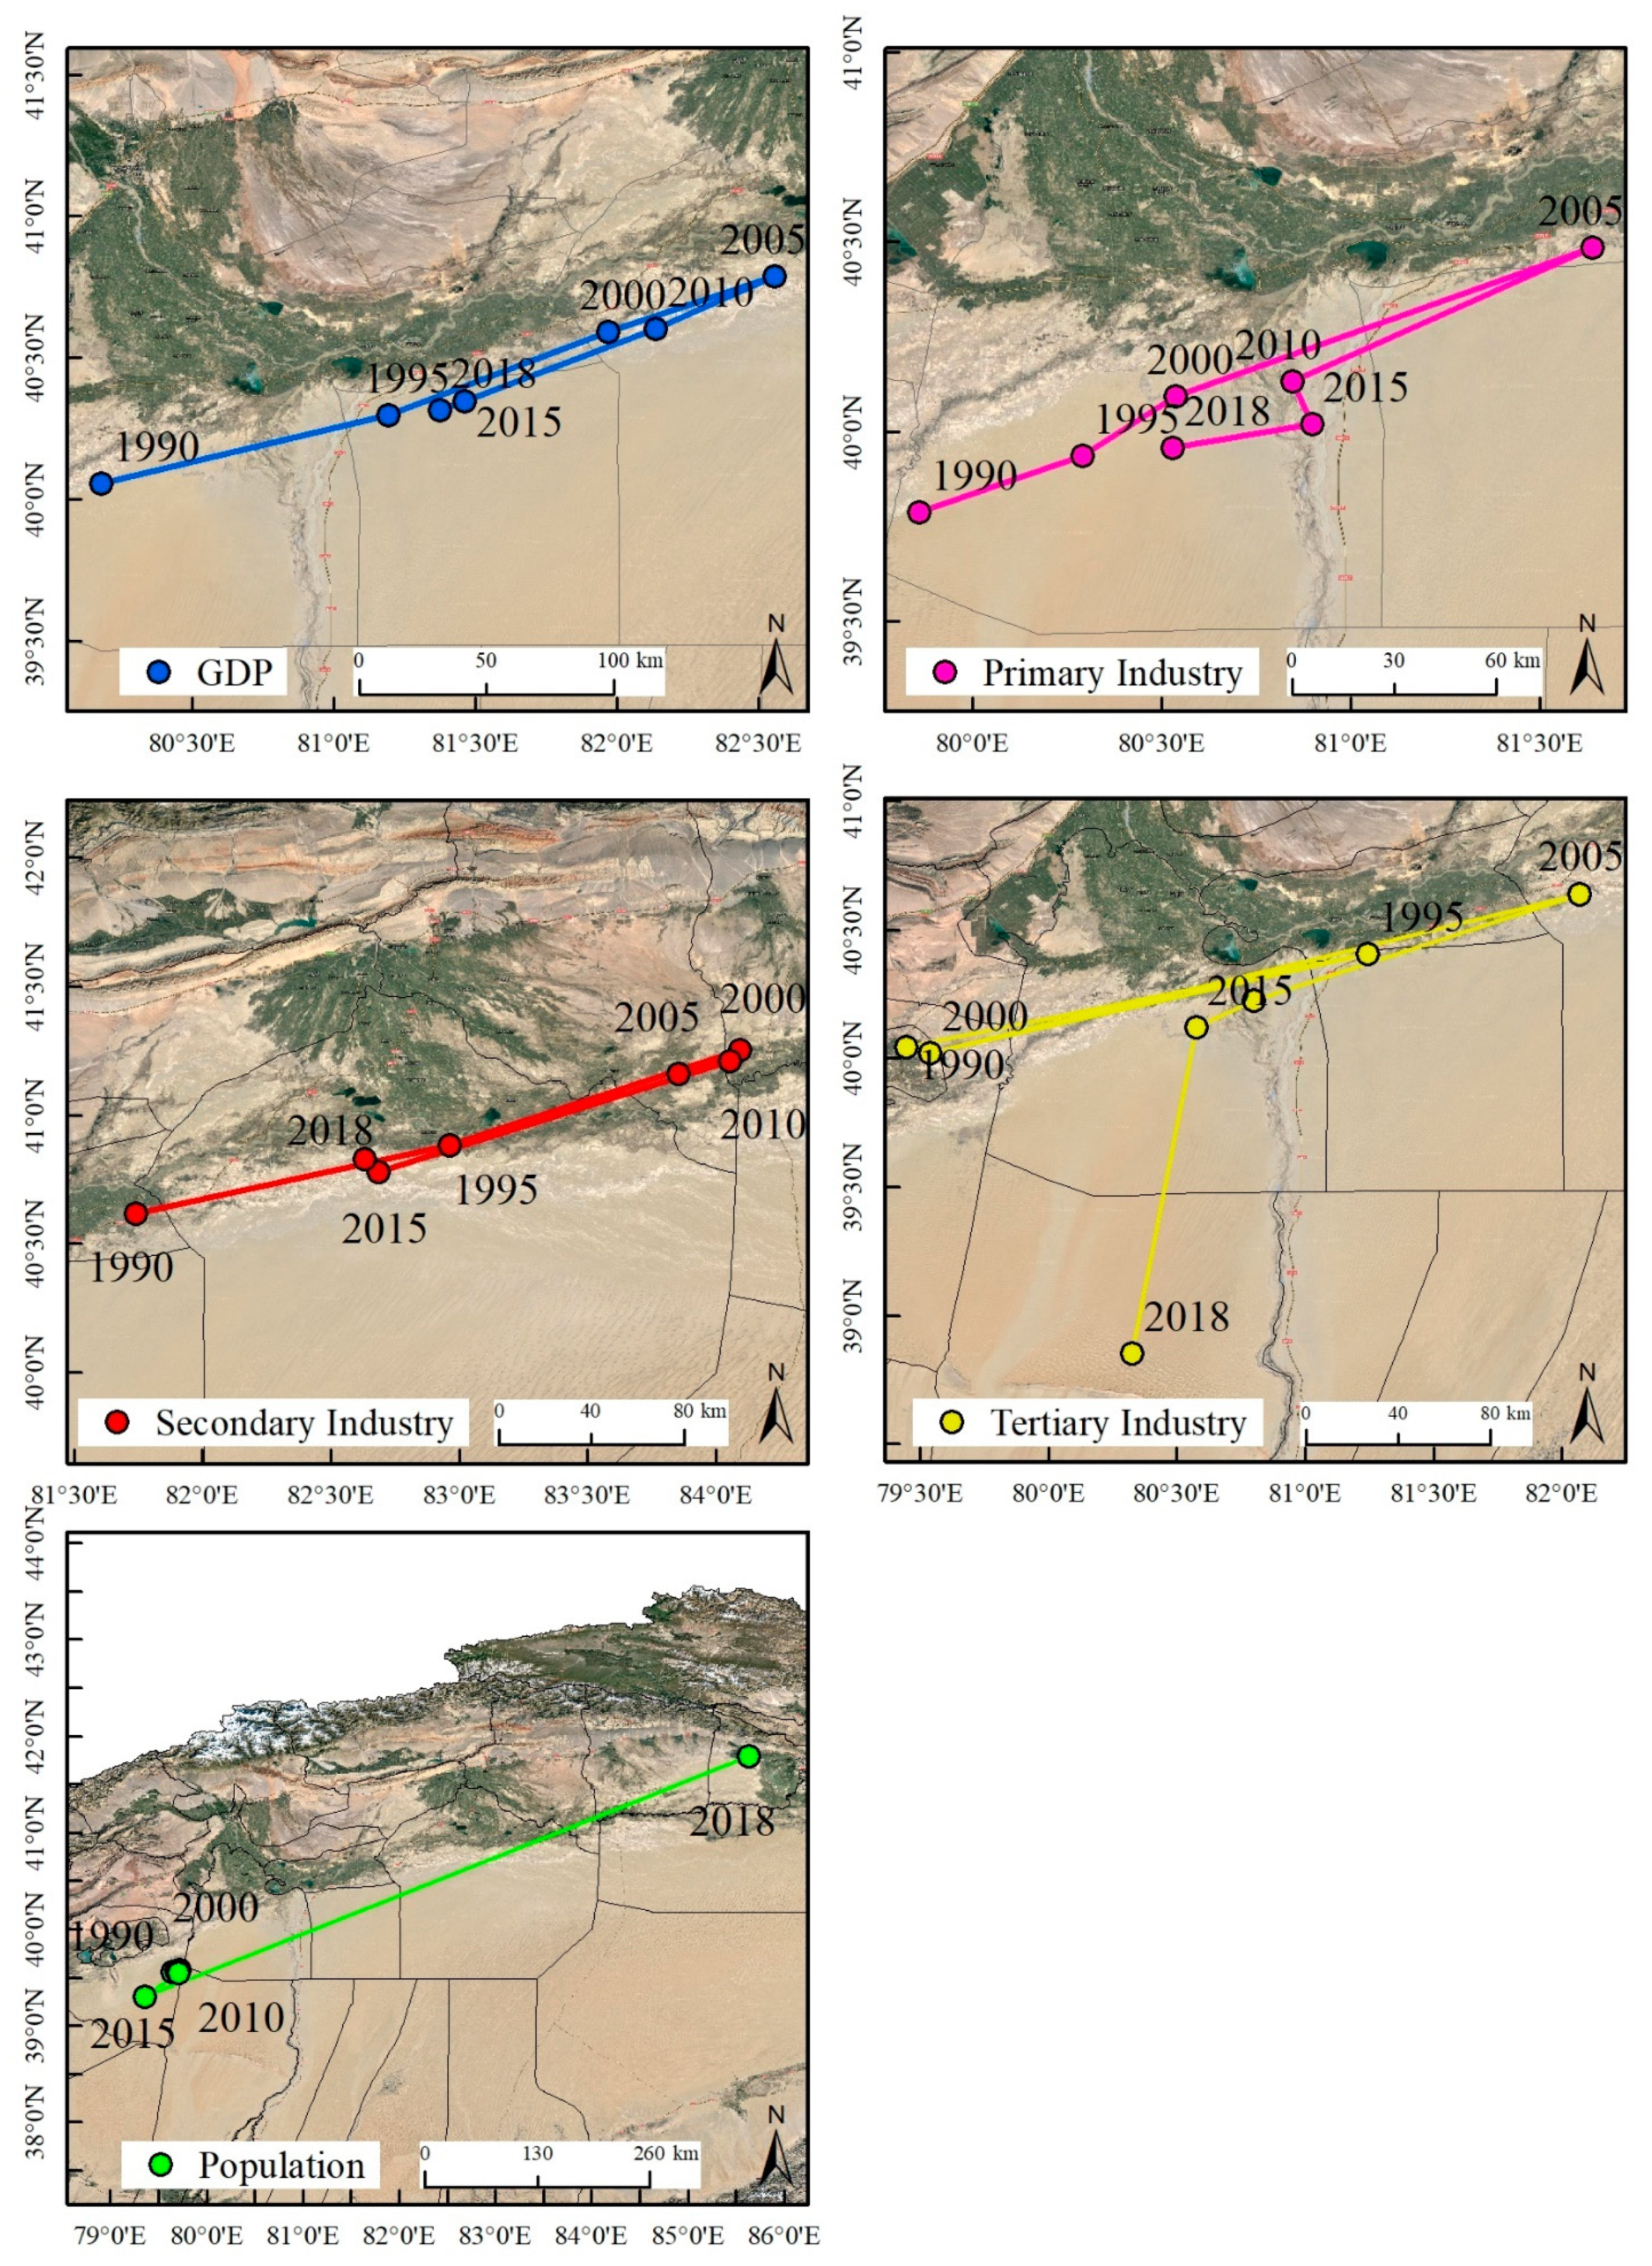
From 1990 to 2018, the spatial migration characteristics of the center of gravity of various land-use types in the Tarim River Basin were quite different (
Appendix A,
Table A1). For cultivated land, the center of gravity showed a general trend of migration in the direction of higher economic development, moving from the southwest to the northeast at a migration distance of 212.59 km. The area of cultivated land was mainly converted from grassland and increased by 181.39 × 10
4 hm
2. This is because the increase in population sparked a greater demand for arable land. The result is that more land needed to be cultivated to sustain human life, resulting in less grassland.
Figure 4 illustrates that the center of gravity of woodland migrated from the southwest to the northeast and then from the northeast to the northwest, for a total migration distance of 163.47 km over the study period. The trend shows gradual migration to the northwest. This is logical, considering that the Tianshan Mountains are located in the northern part of the study area, and the northern and southern slopes of the mountains have abundant precipitation. The tributaries of the Tarim River also have woodland distribution, and thus the grassland has obvious characteristics of center-of-gravity migration. By 2000, grassland had migrated to the northeast at a distance of 53.34 km; by 2010, it had migrated to the northwest at a distance of 101.43 km; by 2018, it had migrated to the southeast at a distance of 157.67 km, leading to a degradation of grassland and the aggravation of the desertification process.
During these transitions, the center of gravity of the water bodies as a whole migrated from the southwest to the northeast, as did construction land, which was mainly due to the rapid economic development of the study area leading to an increase in demand for construction land. At the same time, unused land also showed a trend of migration to the northeast from the southwest during 1990–2000 at a migration distance of 168.42 km. It then moved to the northwest during 2000–2010 at a distance of 67.34 km, before shifting back to the northeast during 2010–2018. Correspondingly, the vegetation coverage in the northeast of the study area was reduced, the grassland degraded, and the degree of desertification aggravated.
4. Driving Factors of Land-Use Change
4.1. Natural Influences
Climate change can affect the biomass of vegetation, temperature can provide the energy needed for vegetation growth, and moisture can promote plant growth. The study area has a typical continental climate, manifested as a large temperature difference between day and night, drought and minimal rainfall, wind-driven sand, and plentiful sunshine. Overall, the ecological environment is fragile, and natural conditions are harsh.
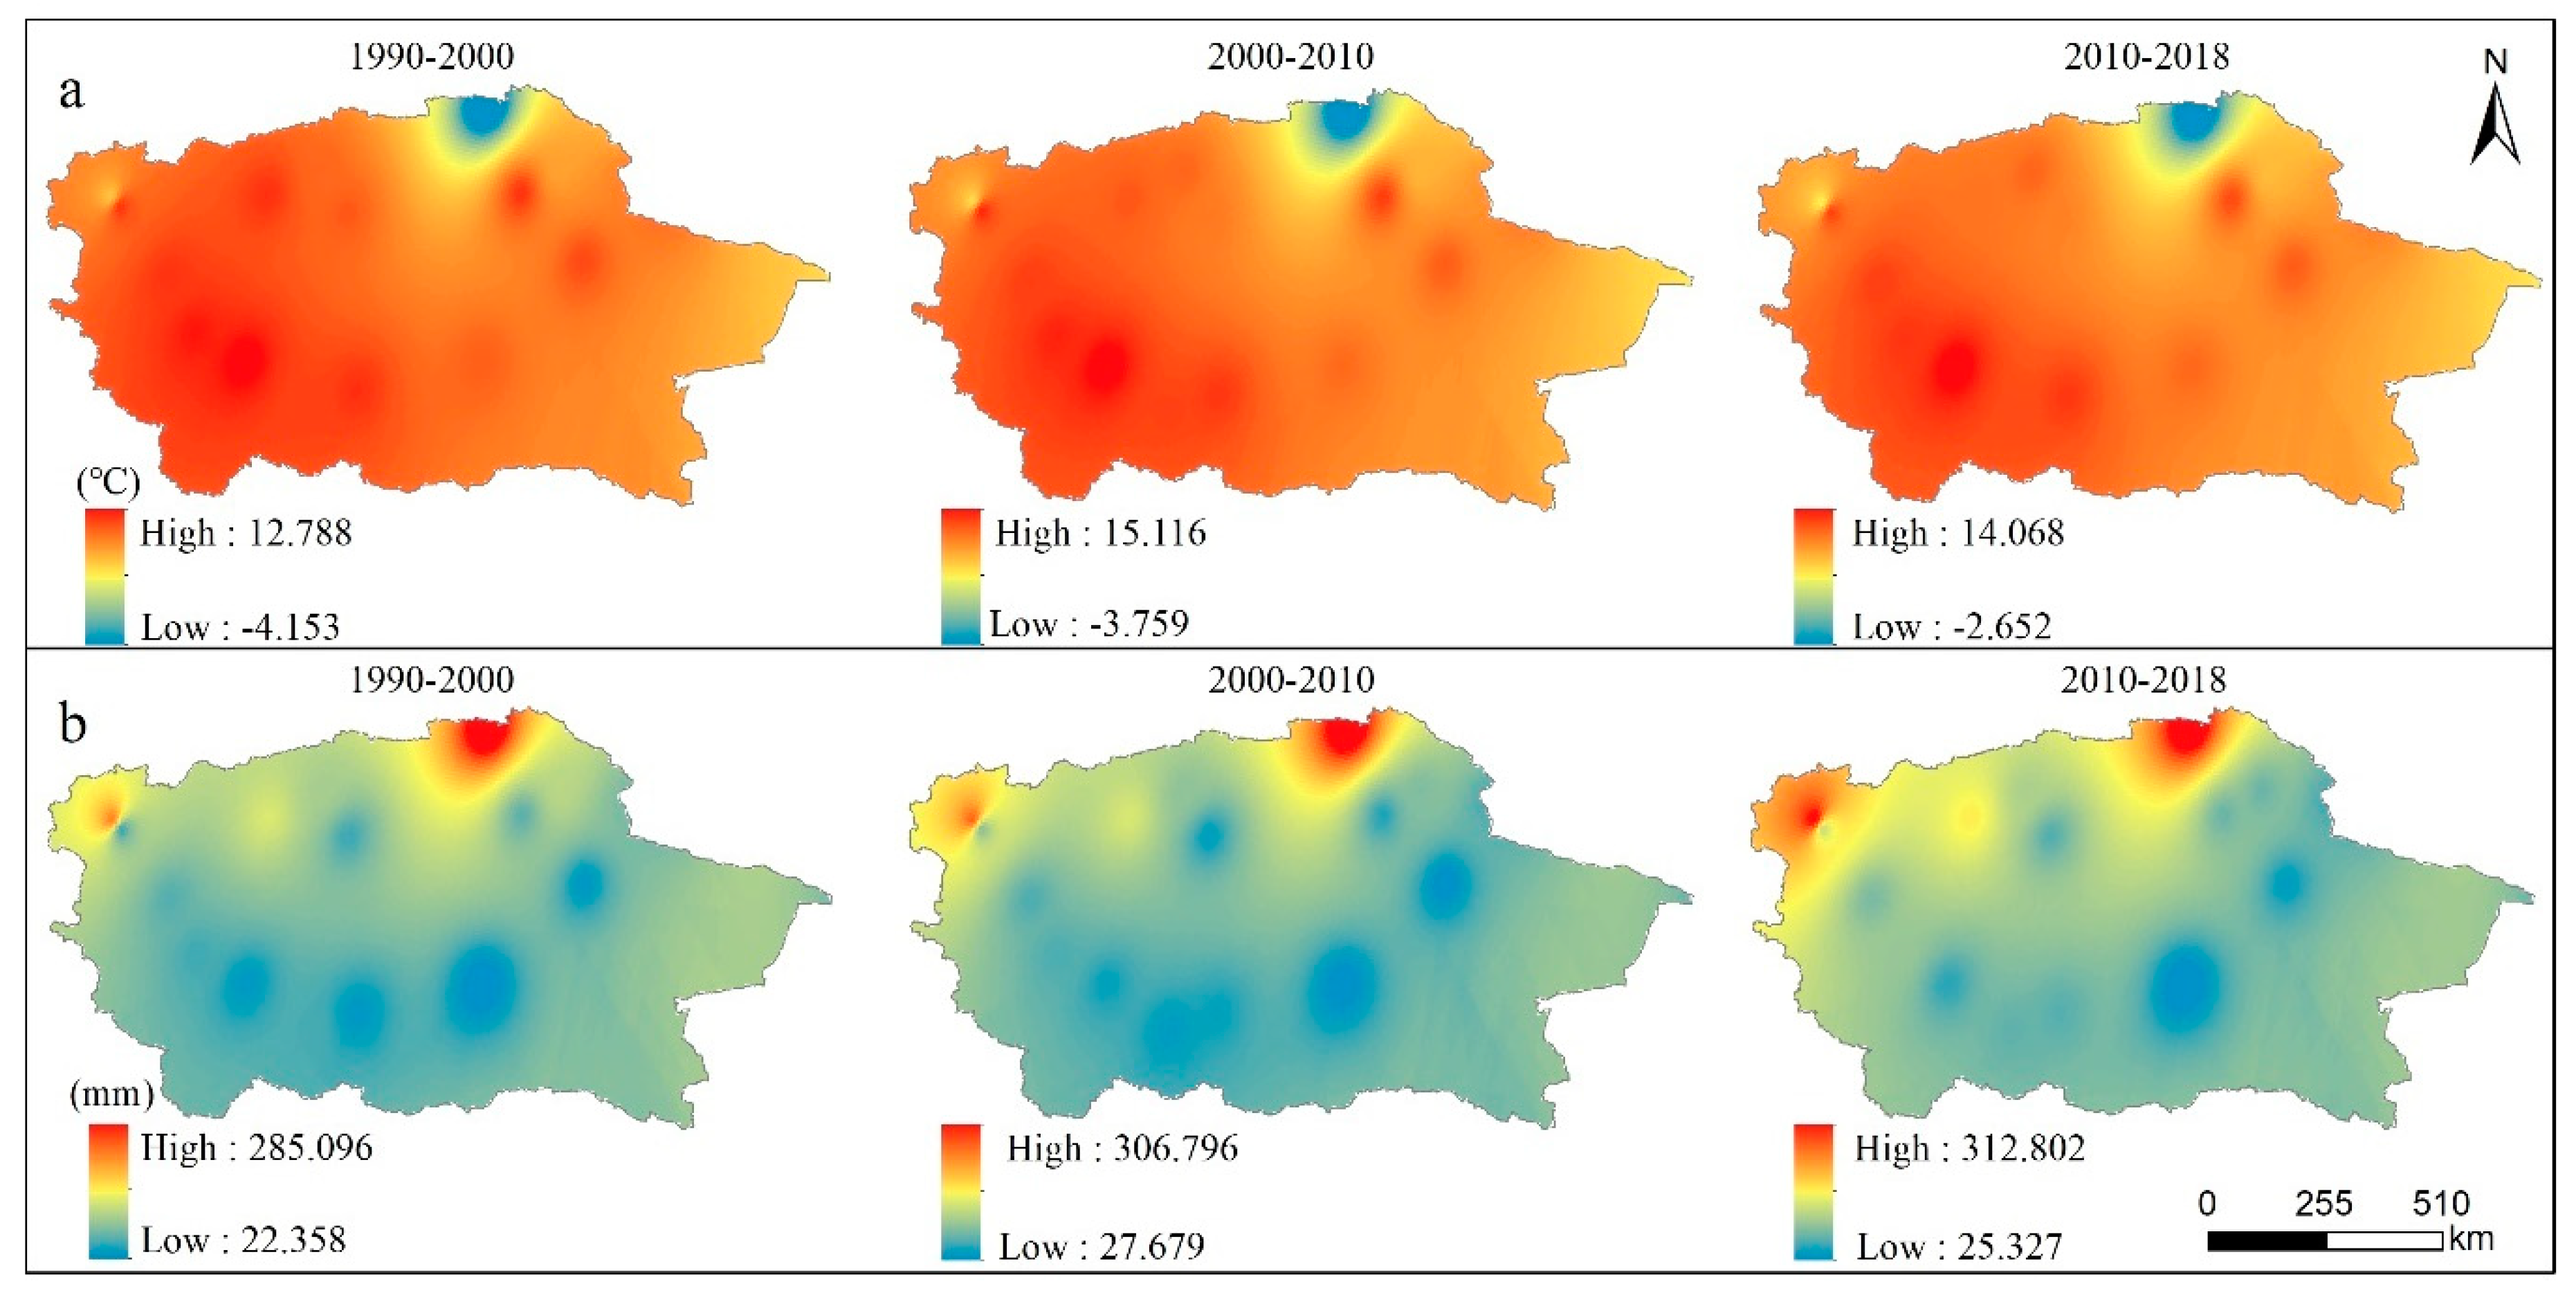
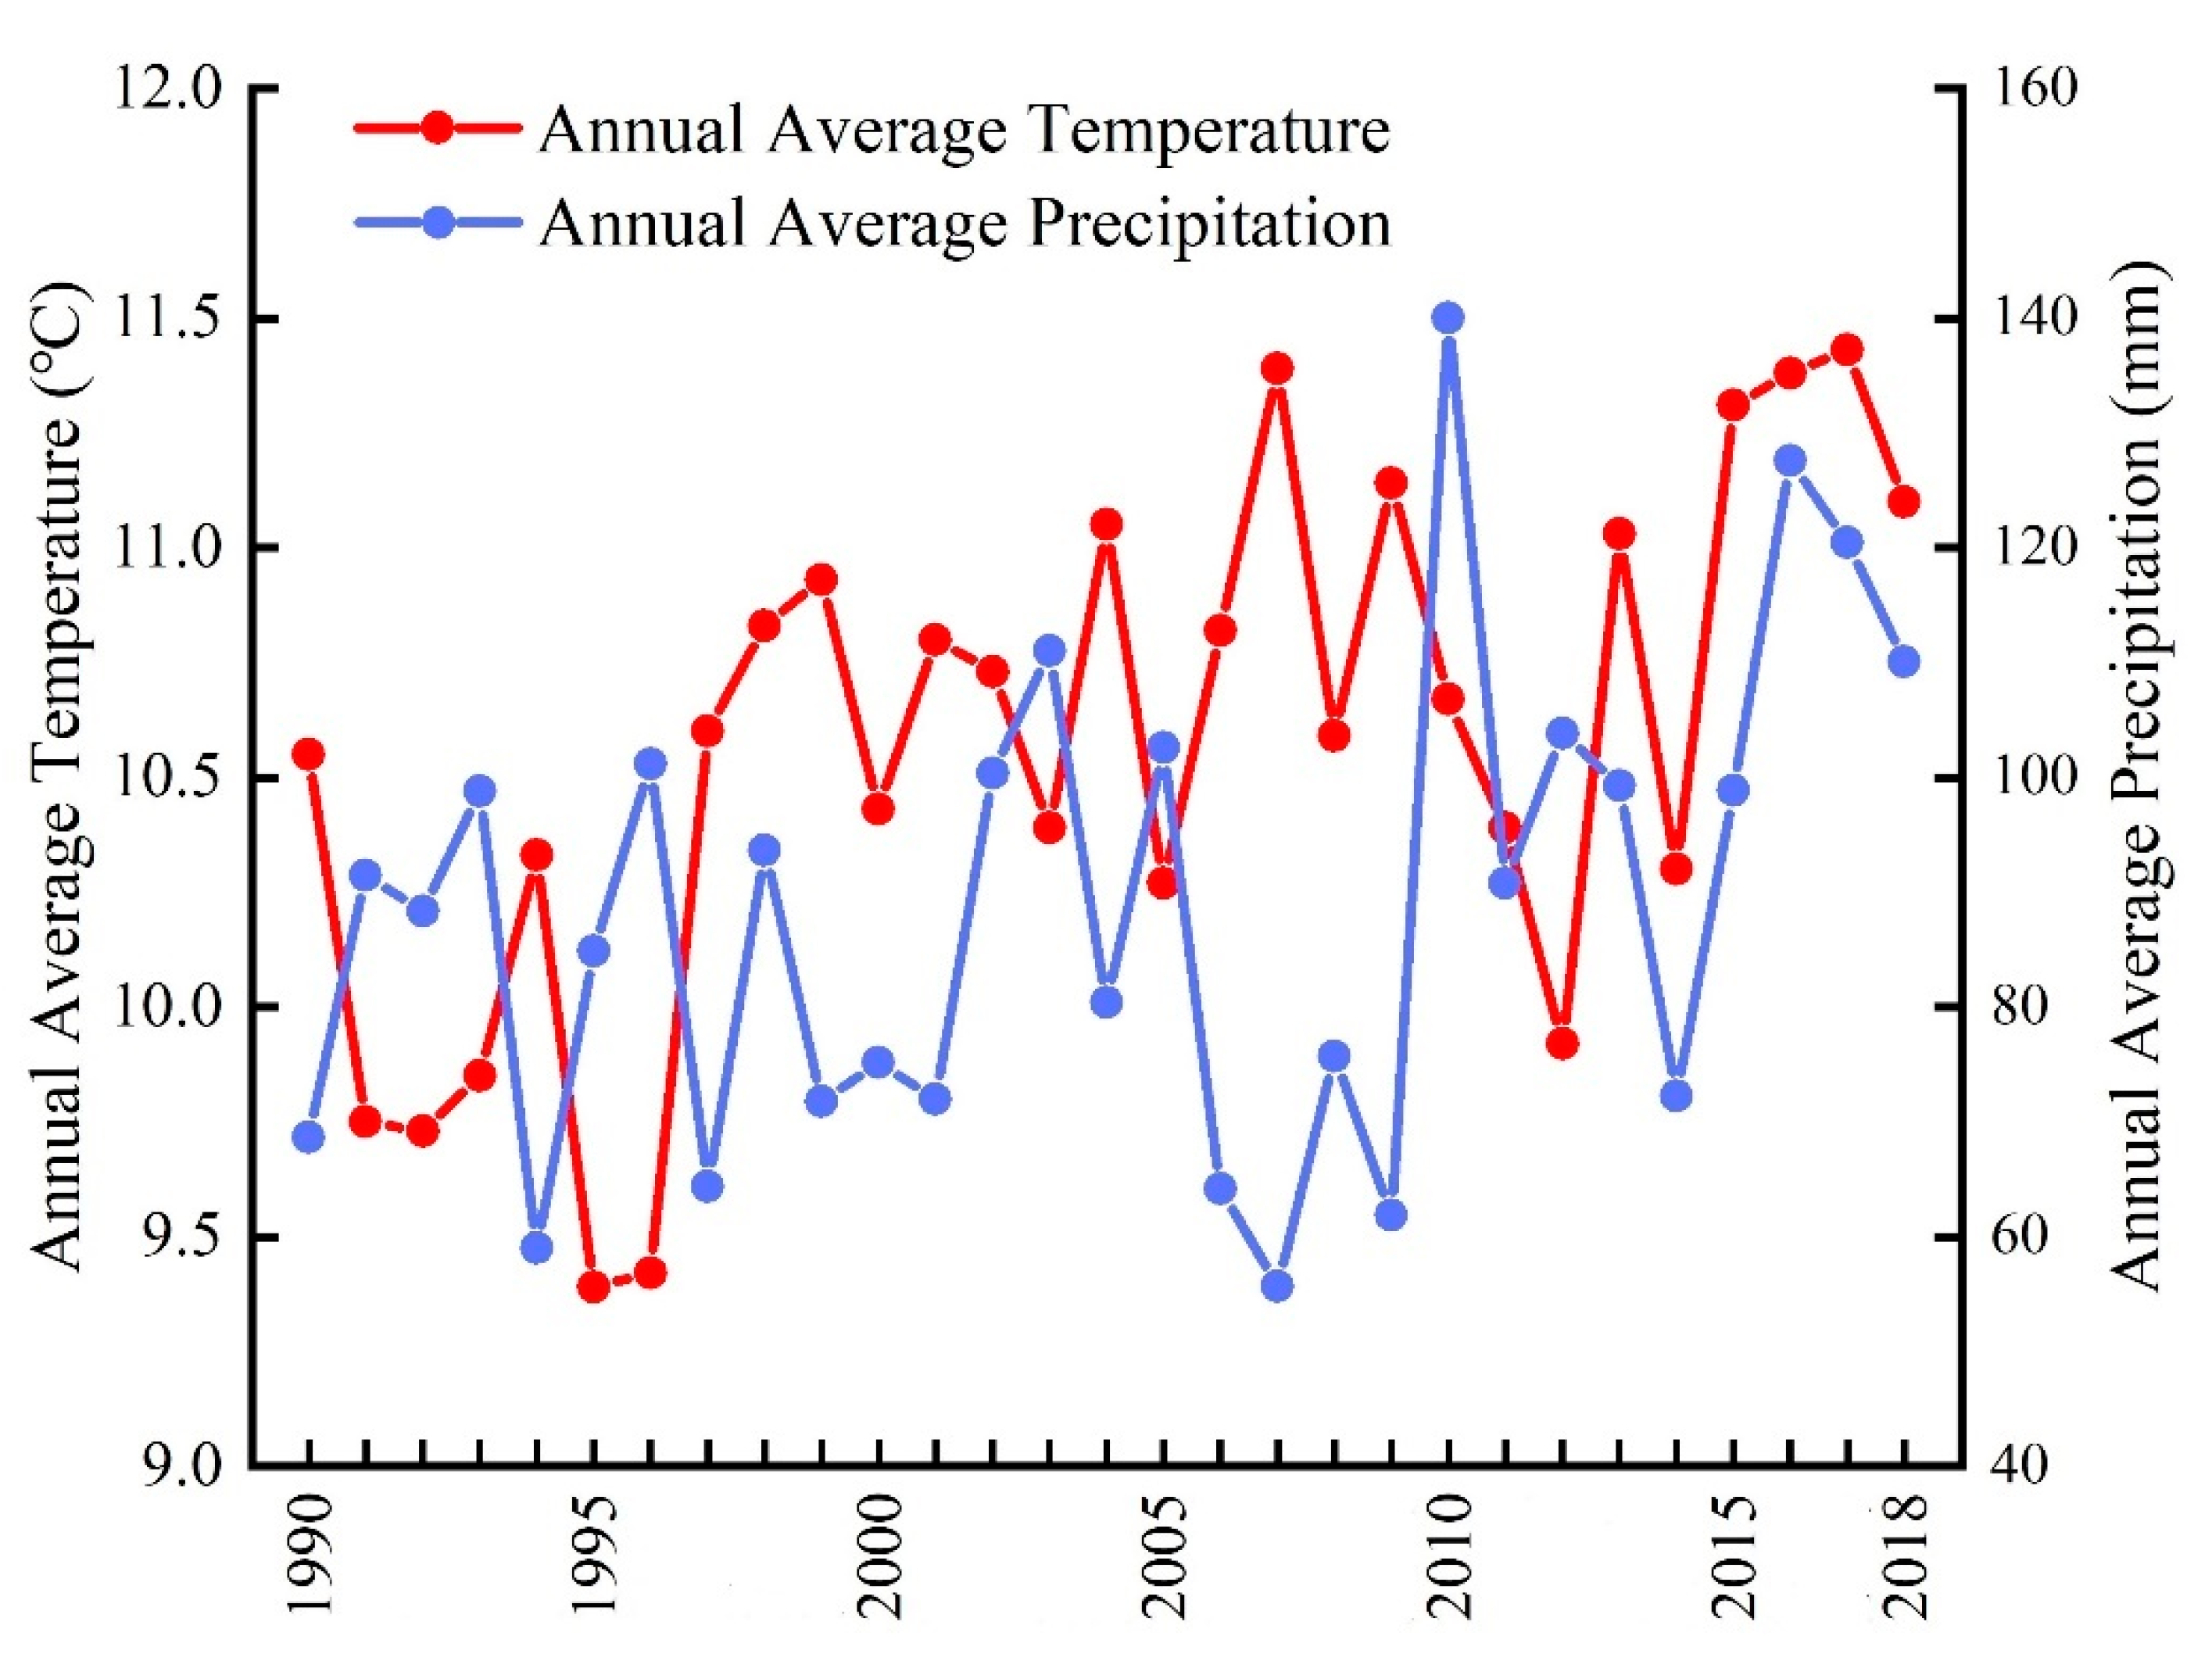
During the 29 years of the study period, temperature in the Tarim River Basin showed a fluctuating trend upward. Except for some anomalous lower temperatures near the Bayinbulak grassland in the northernmost part of the study area, the temperature generally showed a rising trend (
Figure 5a). Overall, the 29-year average temperature was 10.57 °C, and the annual average temperature showed an increasing trend. In 2007, the average temperature reached 11.43 °C, which was the highest value for the study period.
From 1990 to 2018, annual average precipitation in the Tarim River Basin was 89.10 mm, the annual extreme maximum was 140.03 mm, and the minimum was 55.66 mm, giving a range of 84.37 mm. From 2005 to 2010, precipitation was at a low level. The extremely heavy rainfall that had occurred in July 2010 caused precipitation in the study area to break through the historical extreme value for the same period. Since that time, precipitation in the study area has continued to be extreme. However, this changed in 2014 to an overall increasing trend (
Figure 6). Temperature also worked together with precipitation to affect regional land-use types. From 1990 to 2018, high-temperature areas were mainly concentrated in the southwestern part of the Taklimakan Desert and the Tarim Basin. Temperature in the Bayinbulak grassland, south of the Tianshan Mountains in the northernmost part of the study area, was generally low throughout the year. However, the temperature then increased, which accelerated the loss of soil water and led to the death of vegetation and a spike in desertification. This reduced the vegetation coverage. On the other hand, the increase in temperature contributed to light and heat resources that were more suitable for the growth of crops. Encouraged by local governments and driven by national policies, there was a subsequent rapid expansion of the area of arable land in the region.
Meanwhile, precipitation in the study area showed an increasing trend from 1990 to 2018, along with an expansion of natural vegetation. Specifically, in areas with more average annual precipitation, the natural vegetation coverage was relatively high. Thus, the increase in precipitation directly impacted the natural vegetation coverage in the Tarim River Basin, thereby affecting the degree of land-use change in the study area (
Figure 5b).
4.2. Human Impact
4.2.1. Migration of Population and Economic Center of Gravity
The statistical yearbook provides information on the population and economic center of gravity of the Tarim River Basin, including the GDP and data on primary, secondary, and tertiary industries (
Appendix A,
Table A2). From 1990 to 2018, the overall trend of the population centers of gravity in the Tarim River Basin migrated from the southwest to the northeast. The population center of gravity was mainly distributed at 79.35° E–85.63° E, 39.29° N–41.80° N. By 2018, the population center of gravity had moved to Korla, for a total migration distance of 812.21 km (the straight-line distance was 708.60 km). However, the migration distance was not significant during 1990–2000. Then, between 2000 and 2010, it migrated from the northeast to the southwest. After 2015, it migrated to the northeast, gradually shifting in the direction of Korla, with the largest range of movement being eastward 6.27° in the longitudinal direction. The latitude migrated to the north by 2.50°, and the degree of deviation in the longitudinal direction was greater than that of the latitude, indicating that the population center of gravity in the study area was more imbalanced in longitude than that in latitude.
The migration of the population center of gravity is inseparable from both the living environment and the economic development of the region. The increase in population boosted the demand for arable land and various resources and led to changes in the local economic structure, as Korla is the largest city in the Tarim River Basin. The rapid development of urbanization, along with better natural resources and other conditions, promoted the increase in population, and these are the main reasons for the migration of the population center of gravity. At the same time, the migration of the population center of gravity changed the land use, which, in turn, affected the land-cover type.
Analyzing the trajectory of the GDP center-of-gravity migration in the study area shows that the center-of-gravity migration of GDP presented a shift from the southwest to the northeast, mainly in the direction of Aksu (
Figure 7). Longitudinally, the GDP moved 1.20° to the east, while latitudinally it wandered 0.26° to the north. The direction of GDP migration followed the same path as that of cultivated land and population. From 1990 to 2018, the trajectory of GDP migration changed twice, and the overall trajectory moved toward rapid economic development. This development is mostly concentrated in the northern part of the study area, with a migration distance of 418.88 km and a migration rate of 14.44 km/a.
Gross domestic product in the study area is composed of three major industries. The primary industry’s center-of-gravity migration trajectory is consistent with GDP, exhibiting a migration direction from the southwest to the northeast, or 0.67° east (longitude) and 0.17° north (latitude). The imbalance in longitude is greater than that of latitude, but after 2010, the imbalance decreased. The center of gravity for the secondary industries, however, is more to the northeast than the center of gravity for GDP or primary industries is, showing a trend of migration from the southwest to the northeast. During 1990–2018, the total migration distance for the secondary industries was 440.67 km, which was longer than that of the primary industries. The migration trajectory of the tertiary industries’ center of gravity shows that, during the study period, these industries migrated six times, with migration to the southern region being the most substantial.
The migration direction of the arable land area is consistent with that of the population, GDP, and the primary industry’s center of gravity. As the population increases, the relationship between humans and land becomes tenser, and human demand for land increases, resulting in an expansion of the arable land area. The continuous advancement of the process of chemical and other forms of industrialization has led to an increase in the area of construction land and affected the land-use structure of the study area.
4.2.2. Analysis Results of Night-Lighting Development Index
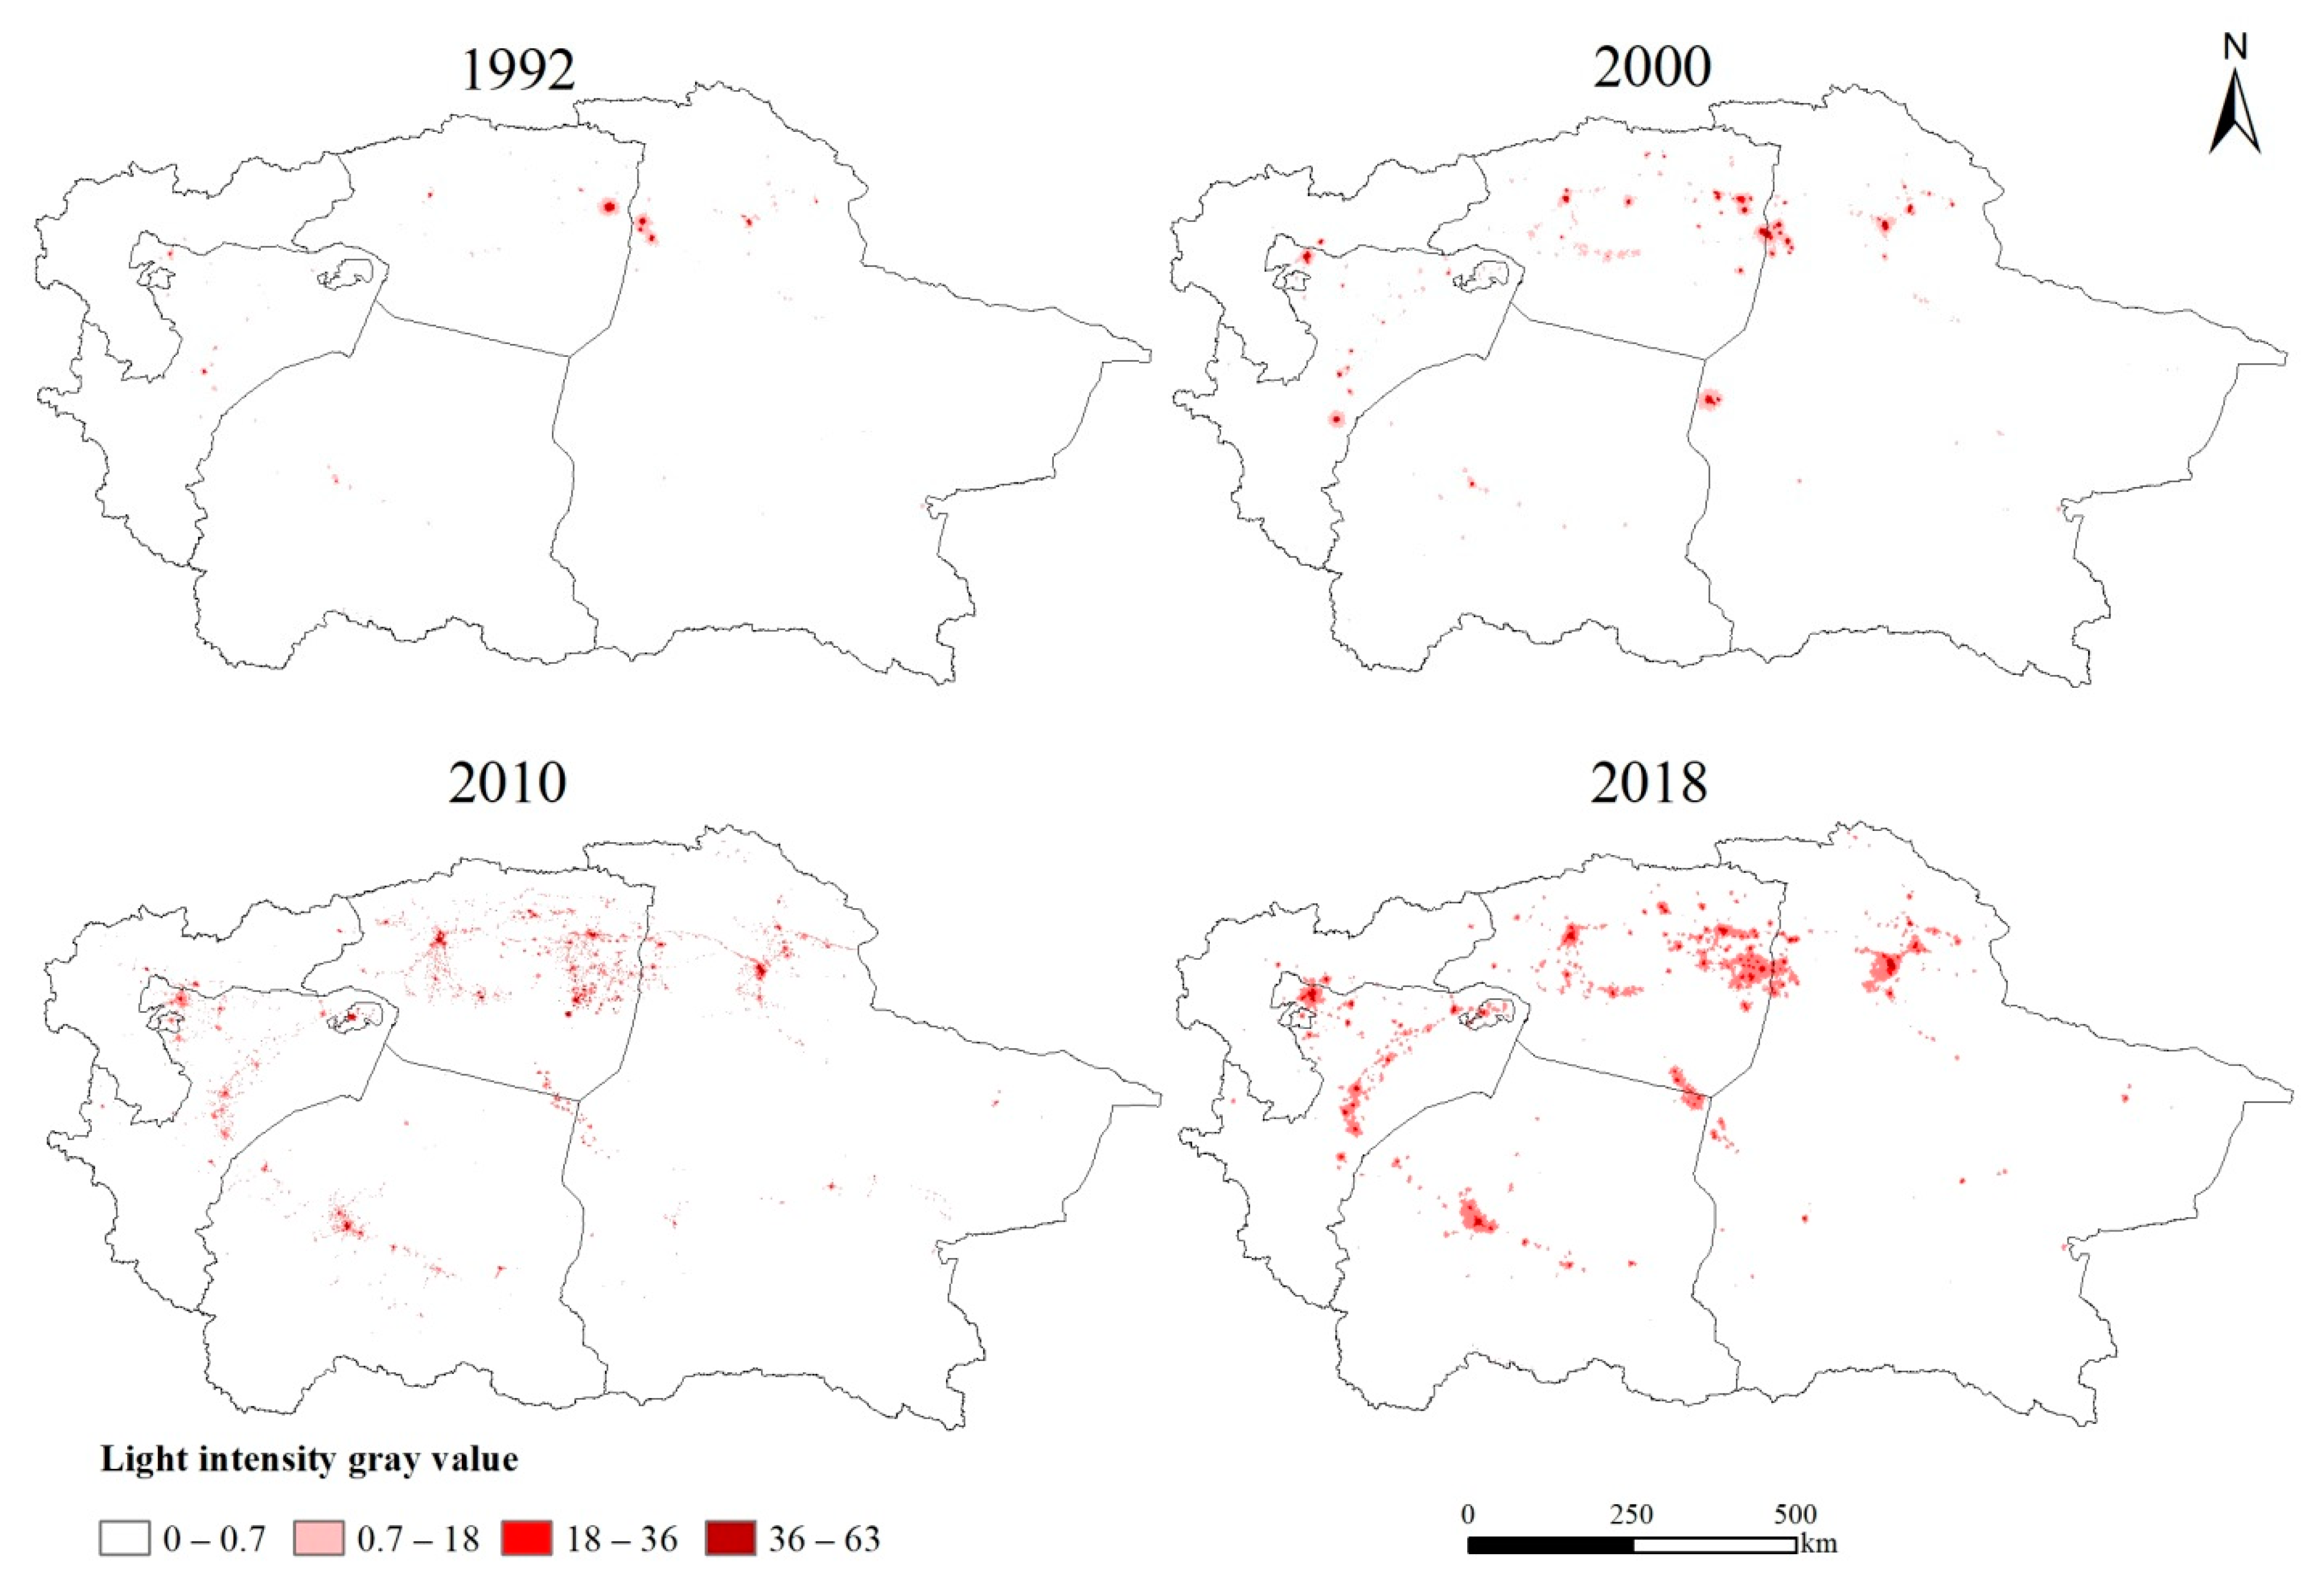
The brightness of lights at night does more than just guide a plane to an airport: lights can reflect the degree of urban development and changes, monitor the progress of urbanization, and reflect urban expansion [
33,
34].
Figure 7 shows that the brightness of lights in the Tarim River Basin continued to increase from 1992 to 2018, with the lighted area showing a rising trend from 0.3% in 1992 to 6.4% in 2018. The Kashgar, Hotan, and Korla regions formed the center of the light expansion. The fastest growth rate occurred during 2010–2018 when the scope of expansion was also the largest. Data show that the brightness of the lights in 2018 increased to 1.5 times the brightness of the lights in 2010, indicating that the urbanization process of the study area developed rapidly during this time frame.
After the implementation of Xinjiang’s Twelfth Five-Year Plan, which was driven by China’s national policies, the rapid expansion of the Korla economic circle began. The construction of new urbanization projects in Korla was mainly promoted through the Silk Road Economic Belt. Since establishing the Kashgar Special Zone in 2010, it has been defined as the powerful engine of the Silk Road Economic Belt. With its vast territory, rich mineral resources, and strong policies, this zone has achieved sound and rapid development.
Kashgar is also boosting its economy at the same time by stimulating the development of the city of Hotan. Located at an important juncture of the Silk Road Economic Belt and the China–Pakistan Economic Corridor, Hotan is gradually becoming a regional center under the new national regional-development strategy. The night-time lighting area in Hotan was significantly expanded from 2010 to 2018, and the urbanization process was accelerated, which promoted economic development (
Figure 8). At the same time, the area of arable and construction land significantly increased, and the migration direction of the population and GDP centers of gravity drove notable changes in land-use structure.
5. Discussion
This study explored the driving mechanisms of land-use changes in the Tarim River Basin by considering both human and natural factors on the basis of the analysis of temporal and spatial characteristics. The study research and results are consistent with those of related studies by Dong Diwen et al. [
35].
(1) The Tarim River Basin underwent frequent land-use conversions over the 29 years of the study period. The main land-use types in the study area are unused land and grassland. The expansion of arable and construction land has occupied fertile land such as grassland. At the same time, the increase in water-resource development and utilization has resulted in a significant reduction in water area. This result is consistent with the findings of Zhang Junfeng et al. [
36]. With the increase in global temperatures, the Tarim River Basin is generally warming and humidifying. At the same time, due to rapid socioeconomic development, grassland in the study area has mainly been converted into cultivated and unused land. This result is consistent with that of Sun Qian et al. [
37].
As the temperature rises and the demand for water resources increases, precipitation cannot meet the water demand of the Tarim River Basin, causing the waters to be converted into unused land. Further, the increase in population has boosted demand for cultivated and construction land. Meanwhile, the development of activities such as deforestation and grass destruction has led to a significant decline in forest and grassland and a volatile increase in unused land area. The main reason is that humans tend to exploit water resources. The result, in this case, is that the groundwater level in the basin has fallen, leading to a reduction in biodiversity [
38] and a further weakening of the fragile ecosystem. Moreover, the rapid increase in grassland degradation and the aggravation of desertification is restricting both the construction of ecological civilization and the process of ecological restoration in the study region.
At the same time, the fluctuating growth of unused land area is restricting the development of the social economy, thus hindering the improvement of people’s living standards. The expansion of arable and construction land area is mainly dominated by human activities, while the increase in population and subsequent rise in the demand for food have led to a large amount of newly cultivated and residential land. The center of arable land area has moved in the same direction as the center of population and GDP, indicating that the migration of a population center and the development of the social economy can change land-use structure. In the study area, human activities accelerated the process of urbanization, leading to rapid urban expansion. The expansion was fastest during 2010–2018 when urbanization was accelerating and economic development was being heavily promoted by all levels of government. During the same time period, the area of arable and construction land significantly increased, and the migration direction of the population and GDP centers drove pivotal changes in land-use structure. Newly cultivated land often originates from areas with better water and soil conditions around the original cultivated land, whereas the increase in construction land tends to encroach on cultivated land and grassland. Hence, the demand for cultivated land increases and stimulates reclamation activities, but grassland areas are also reduced.
(2) As the study area further develops, attention should be paid to halting or at least mitigating the degradation of grassland and water bodies caused by unsustainable resource exploitation, such that the protection of the ecological use of the Tarim River Basin increases. To address problems such as the deterioration of the ecological environment, ecological water-delivery projects were constructed in the basin, improving the natural environment and gradually restoring natural vegetation. Cultivated land, grassland, and woodland in the lower reaches of the Tarim River all showed an increasing trend after the ecological water transfer, whereas unused land showed a decreasing trend. Concurrently, the value of ecosystem services in the study area charted an upward trend. Because vegetation growth conditions have improved since the water transfer, water replenishment has increased woodland and grassland areas. Specifically, NDVI has increased by 33.3% compared to the area prior to water transfer [
39]. These efforts have achieved ecological, economic, and social benefits [
40].
The ecological environment of the Tarim River Basin is relatively fragile, and its ecological problems restrict the process of ecological restoration. This study explored the influencing factors of land-use change on the basis of climatic factors such as temperature and precipitation and human-activity factors such as population, economic centers of gravity, and remote sensing. The driving factors of land use are more complex and fueled by nature, social economy, policy, and history. Research also needs to consider other natural [
41] and socioeconomic factors, and it is considered to differentiate the contributions of each factor to land-use changes in the basin and their interaction and quantitative and systematic research on the relationship between driving factors and land-type changes in order to reveal the driving mechanism and major factors of land-use change in the Tarim River Basin.
6. Conclusions
(1) From 1990 to 2018, the land-use structure of the Tarim River Basin revealed that the area of construction and cultivated land continued to increase, the area of unused land exhibited a fluctuating growth trend, the area of grassland was in continuous decline, and the area of water and woodland fluctuated downward.
(2) From 2000 to 2018, the NDVI of natural vegetation in the Tarim River Basin charted an overall increasing trend, showing spatial distribution characteristics of high in the middle and low in the surrounding area, high in the northwest and low in the southeast, and high in the oasis and low in the desert. Annual average temperature trended upward in mutual volatility growth in the same area where the annual precipitation showed an upward trend.
(3) From 1990 to 2018, there was a significant migration of use types across the various regions. The center of gravity of cultivated land, water bodies, construction land, and unused land migrated from the southwest to the northeast, while the center of woodland and grassland migrated from the southeast to the northwest. The population and GDP as a whole migrated from the southwest to the northeast, which is consistent with the migration direction of cultivated land. For the 29 years of the study period, the cumulative migration of the population was 812.21 km, giving a linear distance of 708.60 km. The migration distance of GDP for the same time frame was 418.88 km. The migration distance of primary industries was 362.98 km, and the migration distance of the secondary industries was longer than that of the primary ones.
(4) From 1990 to 2018, the brightness of night lights in the study area was distributed in a circular shape, with more lights in the northwest and fewer in the southeast. Over the years, the brightness of the lights gradually increased, and the area of night lights showed an expansion trend.
The Tarim River is China’s largest inland river. Over the years, land-use changes in the Tarim River Basin have been affected by natural and human activities, with the impact of human disturbance being particularly significant in land-use change patterns. In view of this, ecological resources and the utilization and protection of the basin should be considered by adopting the following measures:
- (i)
Human intervention in water resources in the basin has caused the fragile ecological environment to face tremendous pressure, resulting in a drastic reduction in the water area. Measures could include continuing to implement ecological water-delivery projects, rationally controlling the construction of water conservancy projects, rationally developing water resources, implementing strict water-resource management systems, and promoting comprehensive water conservation, with agriculture as the focus.
- (ii)
Controlling the conversion of forest land and grassland into other land-use types and continuing to implement the policy of returning forest to grassland. At the same time, farmers should be resettled in areas with poor living conditions, and reasonable land development plans should be formulated.
- (iii)
As a result of grassland degradation and water-resource consumption, desertification in the study area was aggravated, and the ecological barrier became fragile. Measures could include increasing watershed restoration efforts, implementing watershed maintenance, establishing artificial ecological barriers, and adopting wind-proofing, sand-fixation, afforestation, and other necessary measures.
- (iv)
A series of favorable agricultural policies have stoked farmers’ enthusiasm for expansion, leading to an increase in arable land area. Measures could include strengthening the consolidation of rural construction land, gathering farmers’ homesteads, increasing land utilization, and accelerating the development of small towns.


