1. Introduction
Coffee is a commercial crop that is widely produced and traded in the world. The coffee trade amounted to USD 30 billion in 2019, representing 0.17% of the total world trade [
1]. The main coffee importers in the world are the United States of America, Germany, France, Italy, and Belgium. These five countries imported coffee worth USD 13.81 billion in 2019 [
1]. Coffee is produced by over 60 countries in the world. The main coffee producers are Brazil, Vietnam, and Colombia. These three countries produced about 56% of the total world coffee in 2019 [
2]. Similarly, the same countries were the top exporters of coffee in the world in the same year. Brazil alone registered a USD 4.7 billion export value. Brazil is driving the coffee production and trade growth in the world. The world coffee production experienced a growth rate of 6.4% in the year 2020, while Brazil’s coffee production grew by 18.5% [
3].
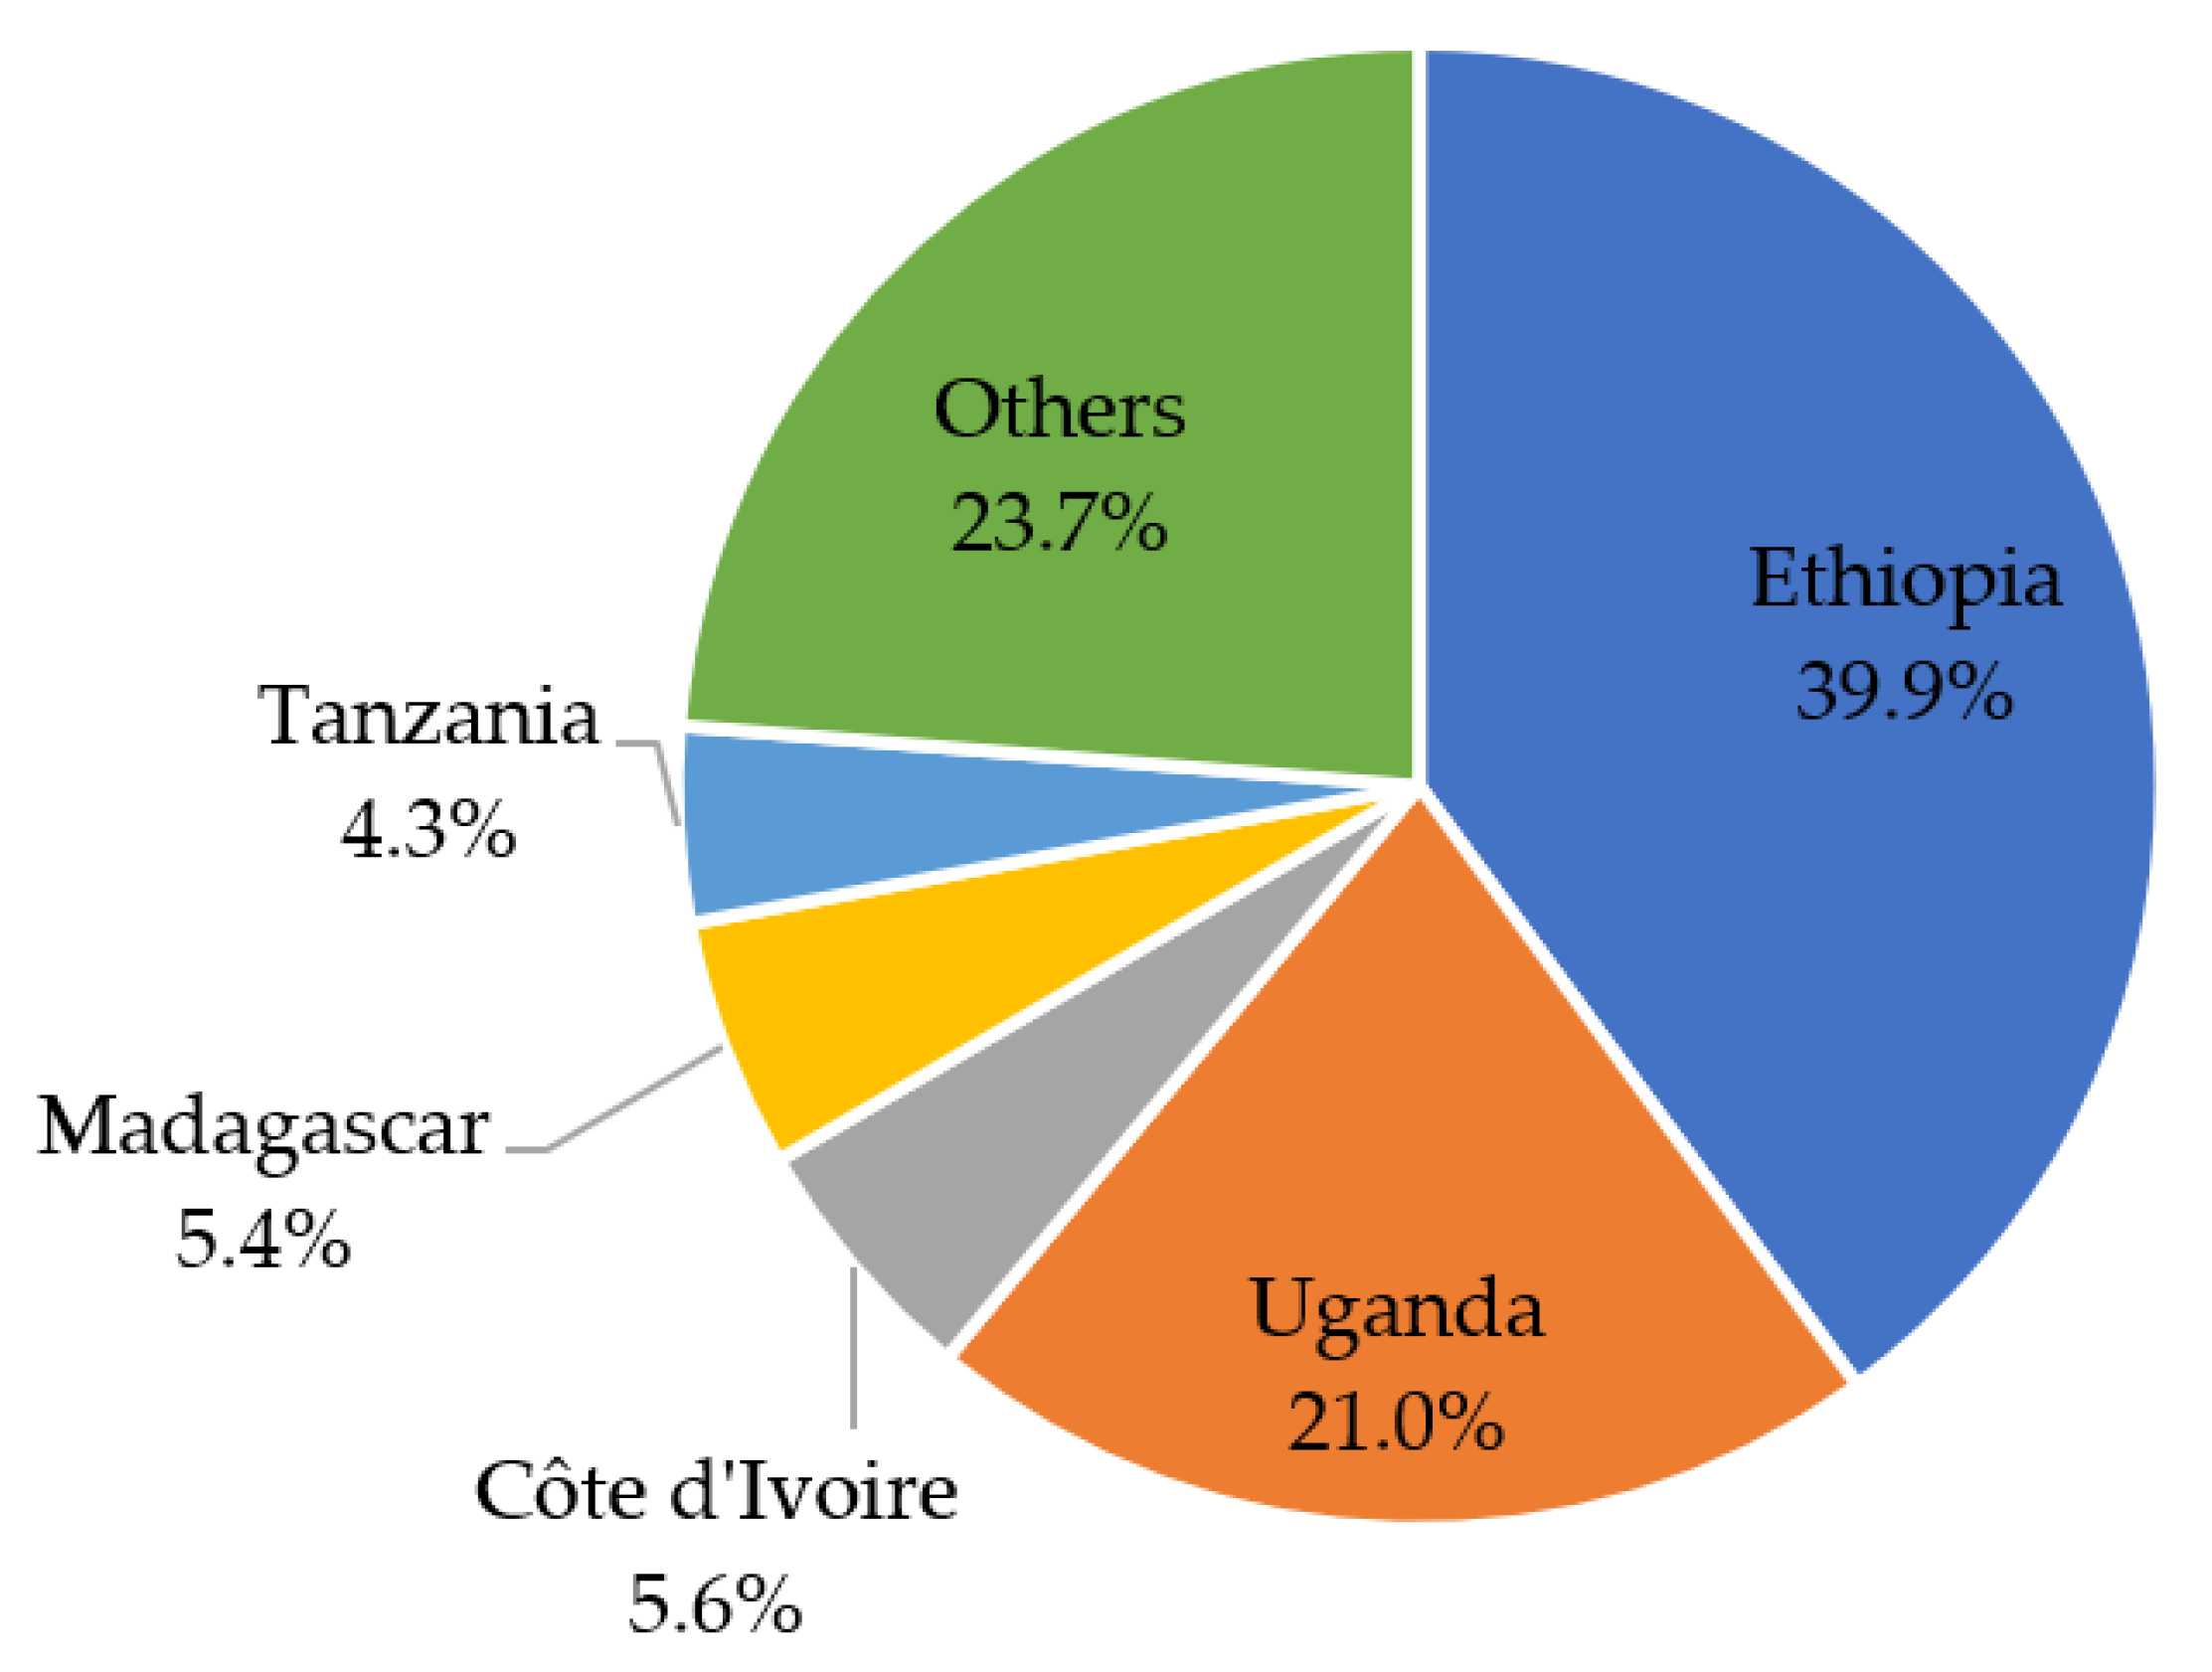
Africa grows about 11% of the total global coffee production [
3]. The main coffee producers in Africa are Ethiopia, Uganda, Côte d’Ivoire, Madagascar, and Tanzania (
Figure 1). These five countries produce about 76% of the total coffee production in Africa [
2]. The coffee trade in Africa provides foreign currency to most of the African coffee-producing countries. The top five coffee-producing countries exported coffee worth USD 1.64 billion in the year 2019 [
4]. Coffee is among the key crops for economic growth, development, and livelihood improvement in many African countries.
Small-scale farmers are the main actors along the coffee supply chain in many of the developing countries, including Tanzania. The benefits accrued from participating in various functions of the coffee supply chain are beneficial to these developing countries, and most men and women farmers. The ability to benefit from the supply chain depends on how farmers participate, and whether the distribution of income gains from the crop equally favors both men and women. However, gender equality is a necessary and sufficient condition to achieve inclusive economic development in any supply chain [
5]. Gender equality increases the competitiveness and participation in economic activities, which contributes to economic growth [
6].
Gender equality implies equal opportunities, responsibilities, and rights for men and women. There should be equal conditions for benefiting from social, economic, cultural, and political development [
5]. However, gender equality is hardly achieved, hence a need to exercise gender equity. This is because variations exist in the distribution of productive resources, rights, and responsibilities between men and women [
7].
Gender equity is the process that can be followed in order to achieve gender equality. It entails empowerment in the form of resources and agency [
8]. Kabeer [
9] explains agency to be key in enhancing gender equality, as it shows the capacity to define one’s own goals and make strategic choices in pursuit of these goals, particularly in a context where this ability was previously denied. Thus, there needs to be fair treatment for men and women within the supply chain. This fairness can be achieved by compensating for historical and social disadvantages that prevent men and women from carrying out various functions on an equal opportunity and fair field [
5,
8,
9]. Equity always leads to equality.
Increased fair participation of men and women within the supply chain is expected to enhance the equal distribution of benefits, hence contributing to gender equity as well as livelihood improvement. Improved livelihood implies increased access to economic opportunities and ability to generate incomes for a living. This has a direct contribution to achieving the sustainable development goals on poverty, hunger, jobs, environmental conservation, and gender equality [
10]. Fair participation of men and women is not always attained for most of the cash crops, including coffee, in developing countries [
5,
6,
11]. To achieve this requires gender-responsive policies that govern the value chains.
Previous studies, such as Quisumbing, Meinzen-Dick [
7], Leach [
5], and Rubin, Boonabaana [
6], have established the existence of evidence that the distribution of income gains from the commercial crops, including coffee, does not equally favor both men and women in developing countries. Other studies, such as Korinek, Moïsé [
12], affirm that social disadvantages lead to low participation of women in trade, which increases the level of inequality. Inequality in trade can also emanate from trade policies. This is due to the fact that, despite trade promoting gender equality according to the World Bank and World Trade Organization [
13], trade- and value chain-specific policies impact men and women differently, due to historical and social disadvantages. It is thus important to understand income generation and distribution, and how it leads to gender equity and livelihood improvement, in order to suggest gender-responsive policies. A study on gender and trade is also an important contribution to the body of knowledge, under the circumstances that gender-specific trade data and studies are scanty [
12,
13]. Therefore, this study uses data from a developing country, Tanzania, to evaluate coffee income distribution, and how general coffee production and trade contribute to gender equity and livelihood improvement. Specifically, the study examines the livelihood conditions, and determines whether coffee production and trade have income inequality-reducing effects, in addition to contributing to gender equity among men and women coffee farmers.
2. Coffee Production and Trade Situation in Tanzania
Coffee is one of the most important crops, which brings foreign exchange to Tanzania. Tanzania produced 51,529 tons of green coffee (859 thousand 60 kg bags) in 2019 (FAO, 2020). Tanzania contributes about 1.7% to the total share of coffee production in the world [
14]. Tanzania exported coffee worth USD 165 million in the year 2019 [
4]. The available statistics indicate that about 70% of the Tanzania coffee is exported to six markets, which are Germany, Italy, the United States of America, Japan, Belgium, and the United Kingdom [
4]. The coffee export value grows at the rate of 4.9% annually [
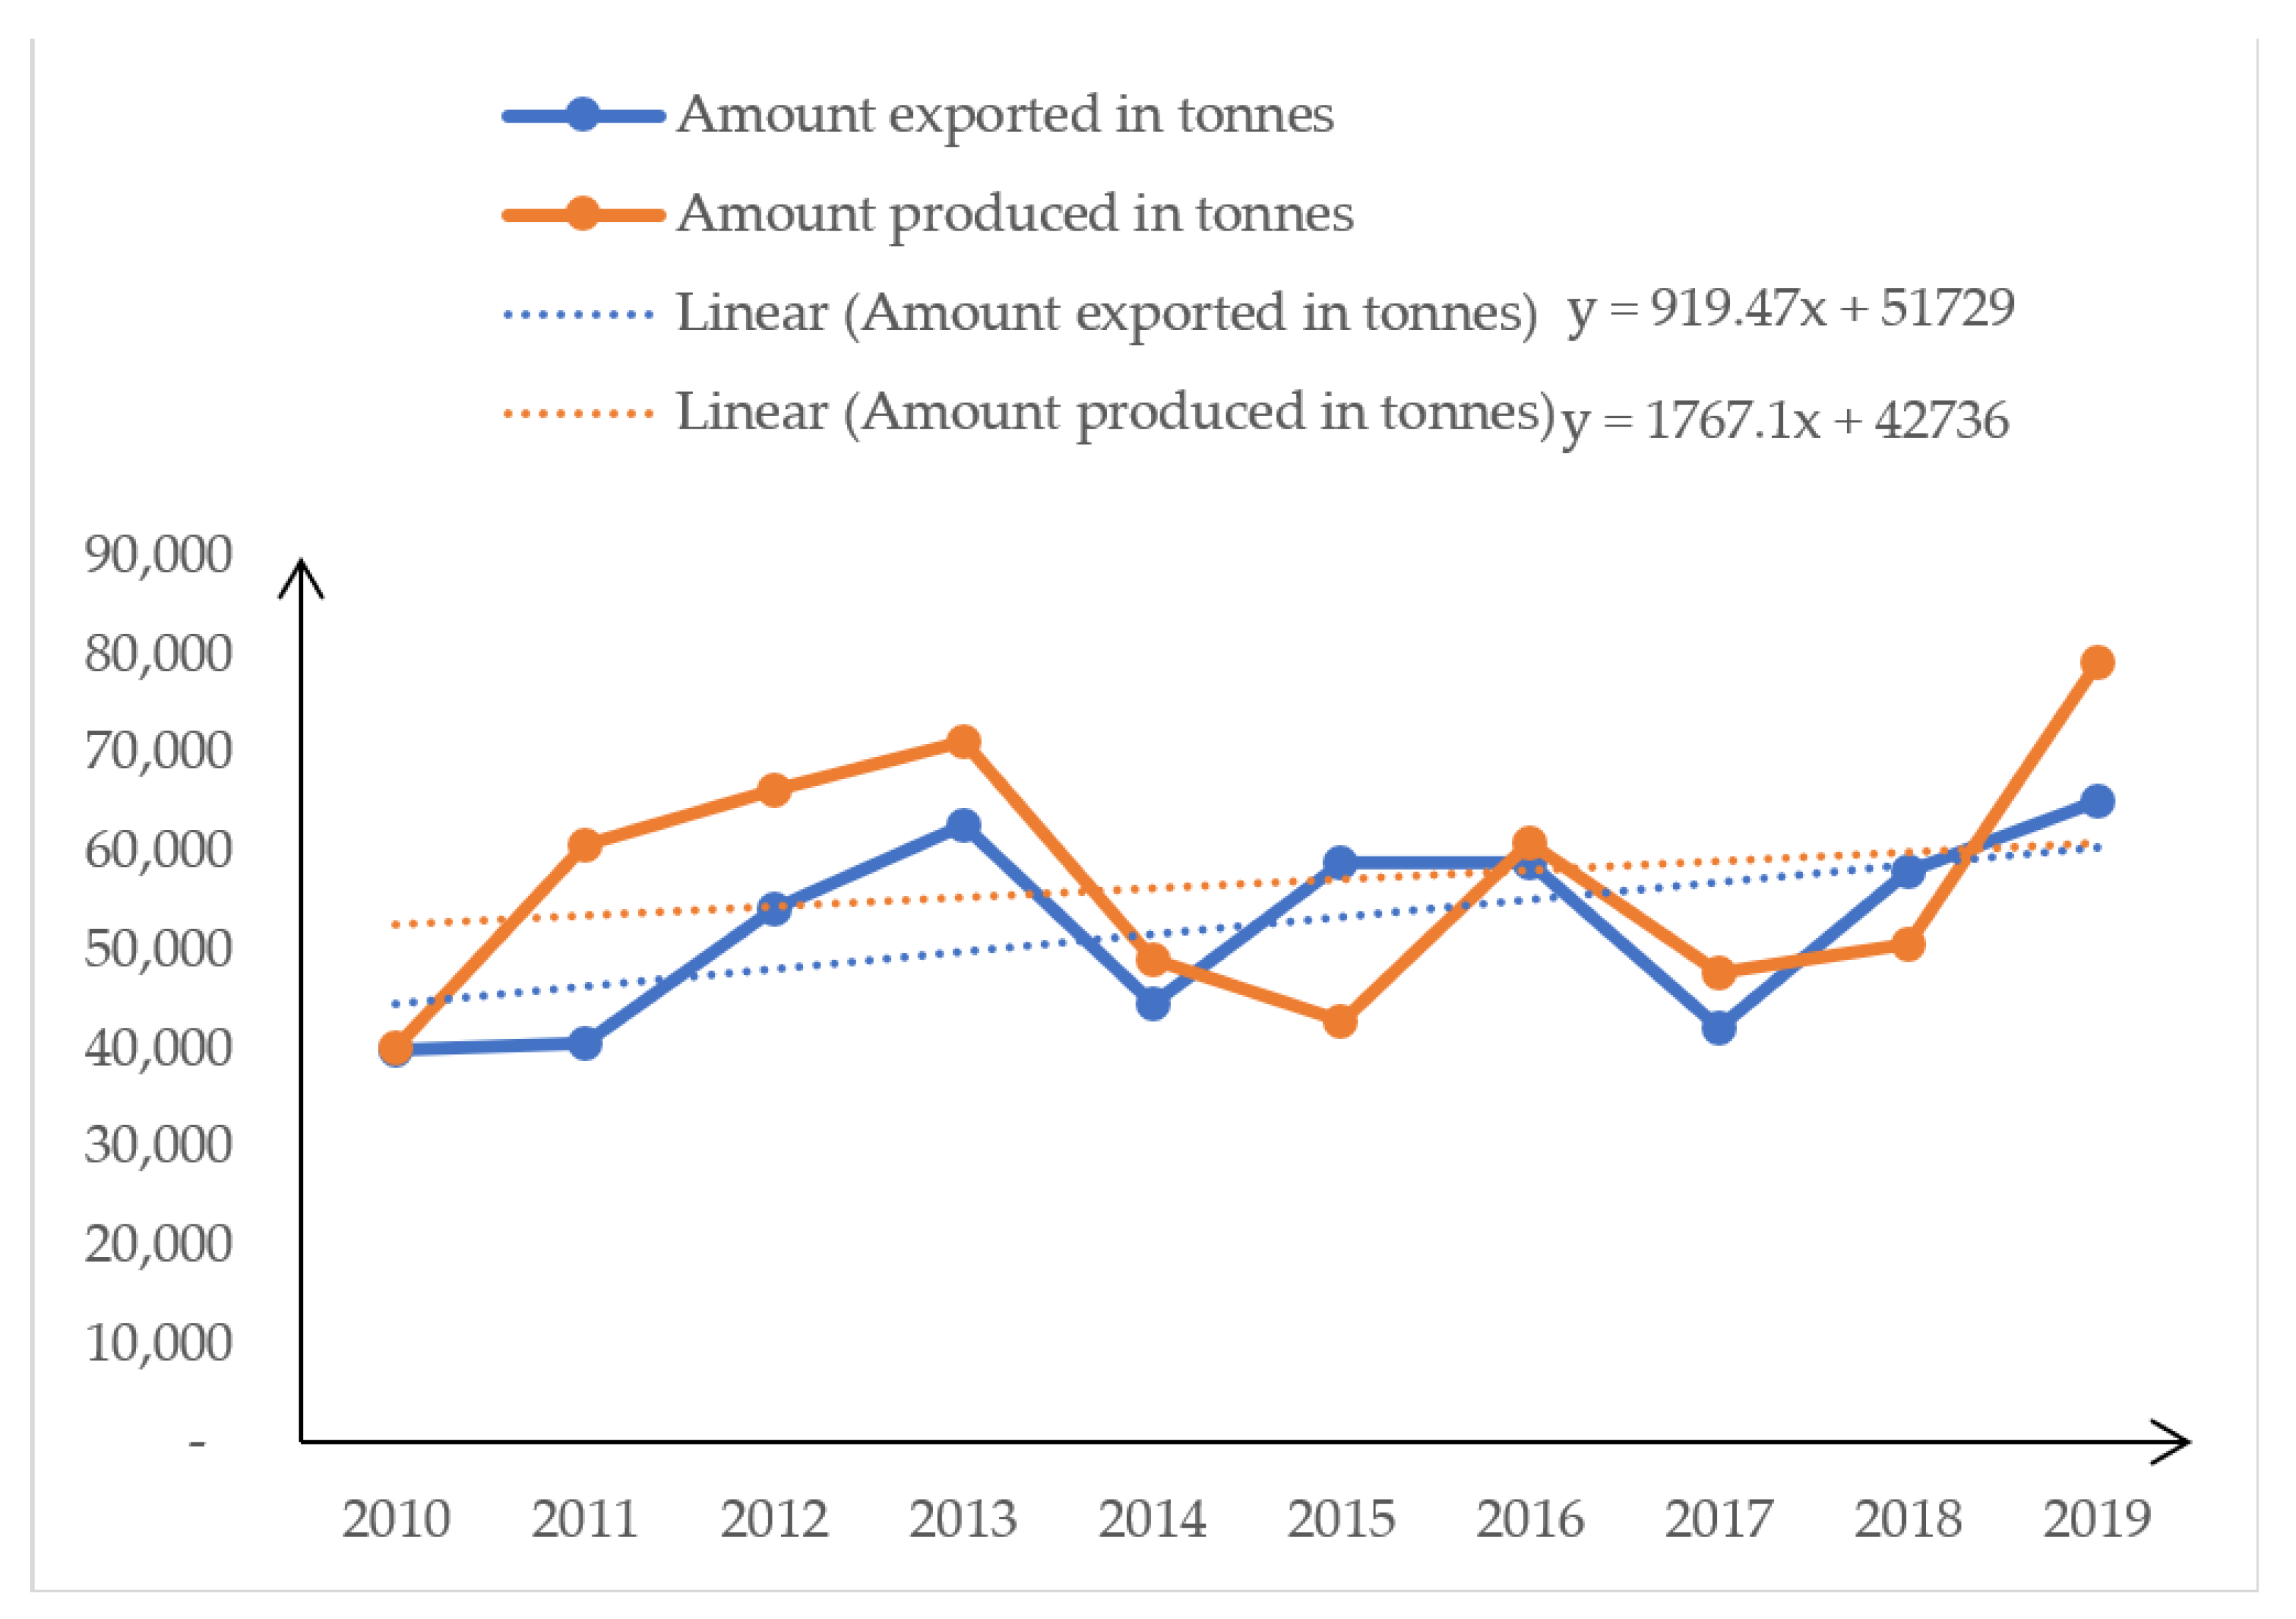
15]. Coffee production and trade has been experiencing a positive growth trend in Tanzania. Coffee export is growing at 1767 tons annually, whereas production is growing at 919.5 tons of green coffee. This means that there is more growth in trade than production (
Figure 2).
Increased production and trade are important, given the fact that coffee contributes positively to multiple country goals. It contributes to job creation, especially rural jobs; economic growth and development; and various dimensions of livelihood improvements. Coffee contributes about 1% to the share of the agriculture sector gross domestic product (GDP), and generates a GDP per worker of about USD 433 [
16]. There are a lot of indirect benefits that are obtained from increased coffee production and trade. However, these benefits vary depending on how the supply chain actors actively participate along the coffee supply chain to achieve inclusive economic development. Inclusive economic development can only be achieved if the supply chain actors not only benefit from, but also actively participate in, various functions of the supply chain.
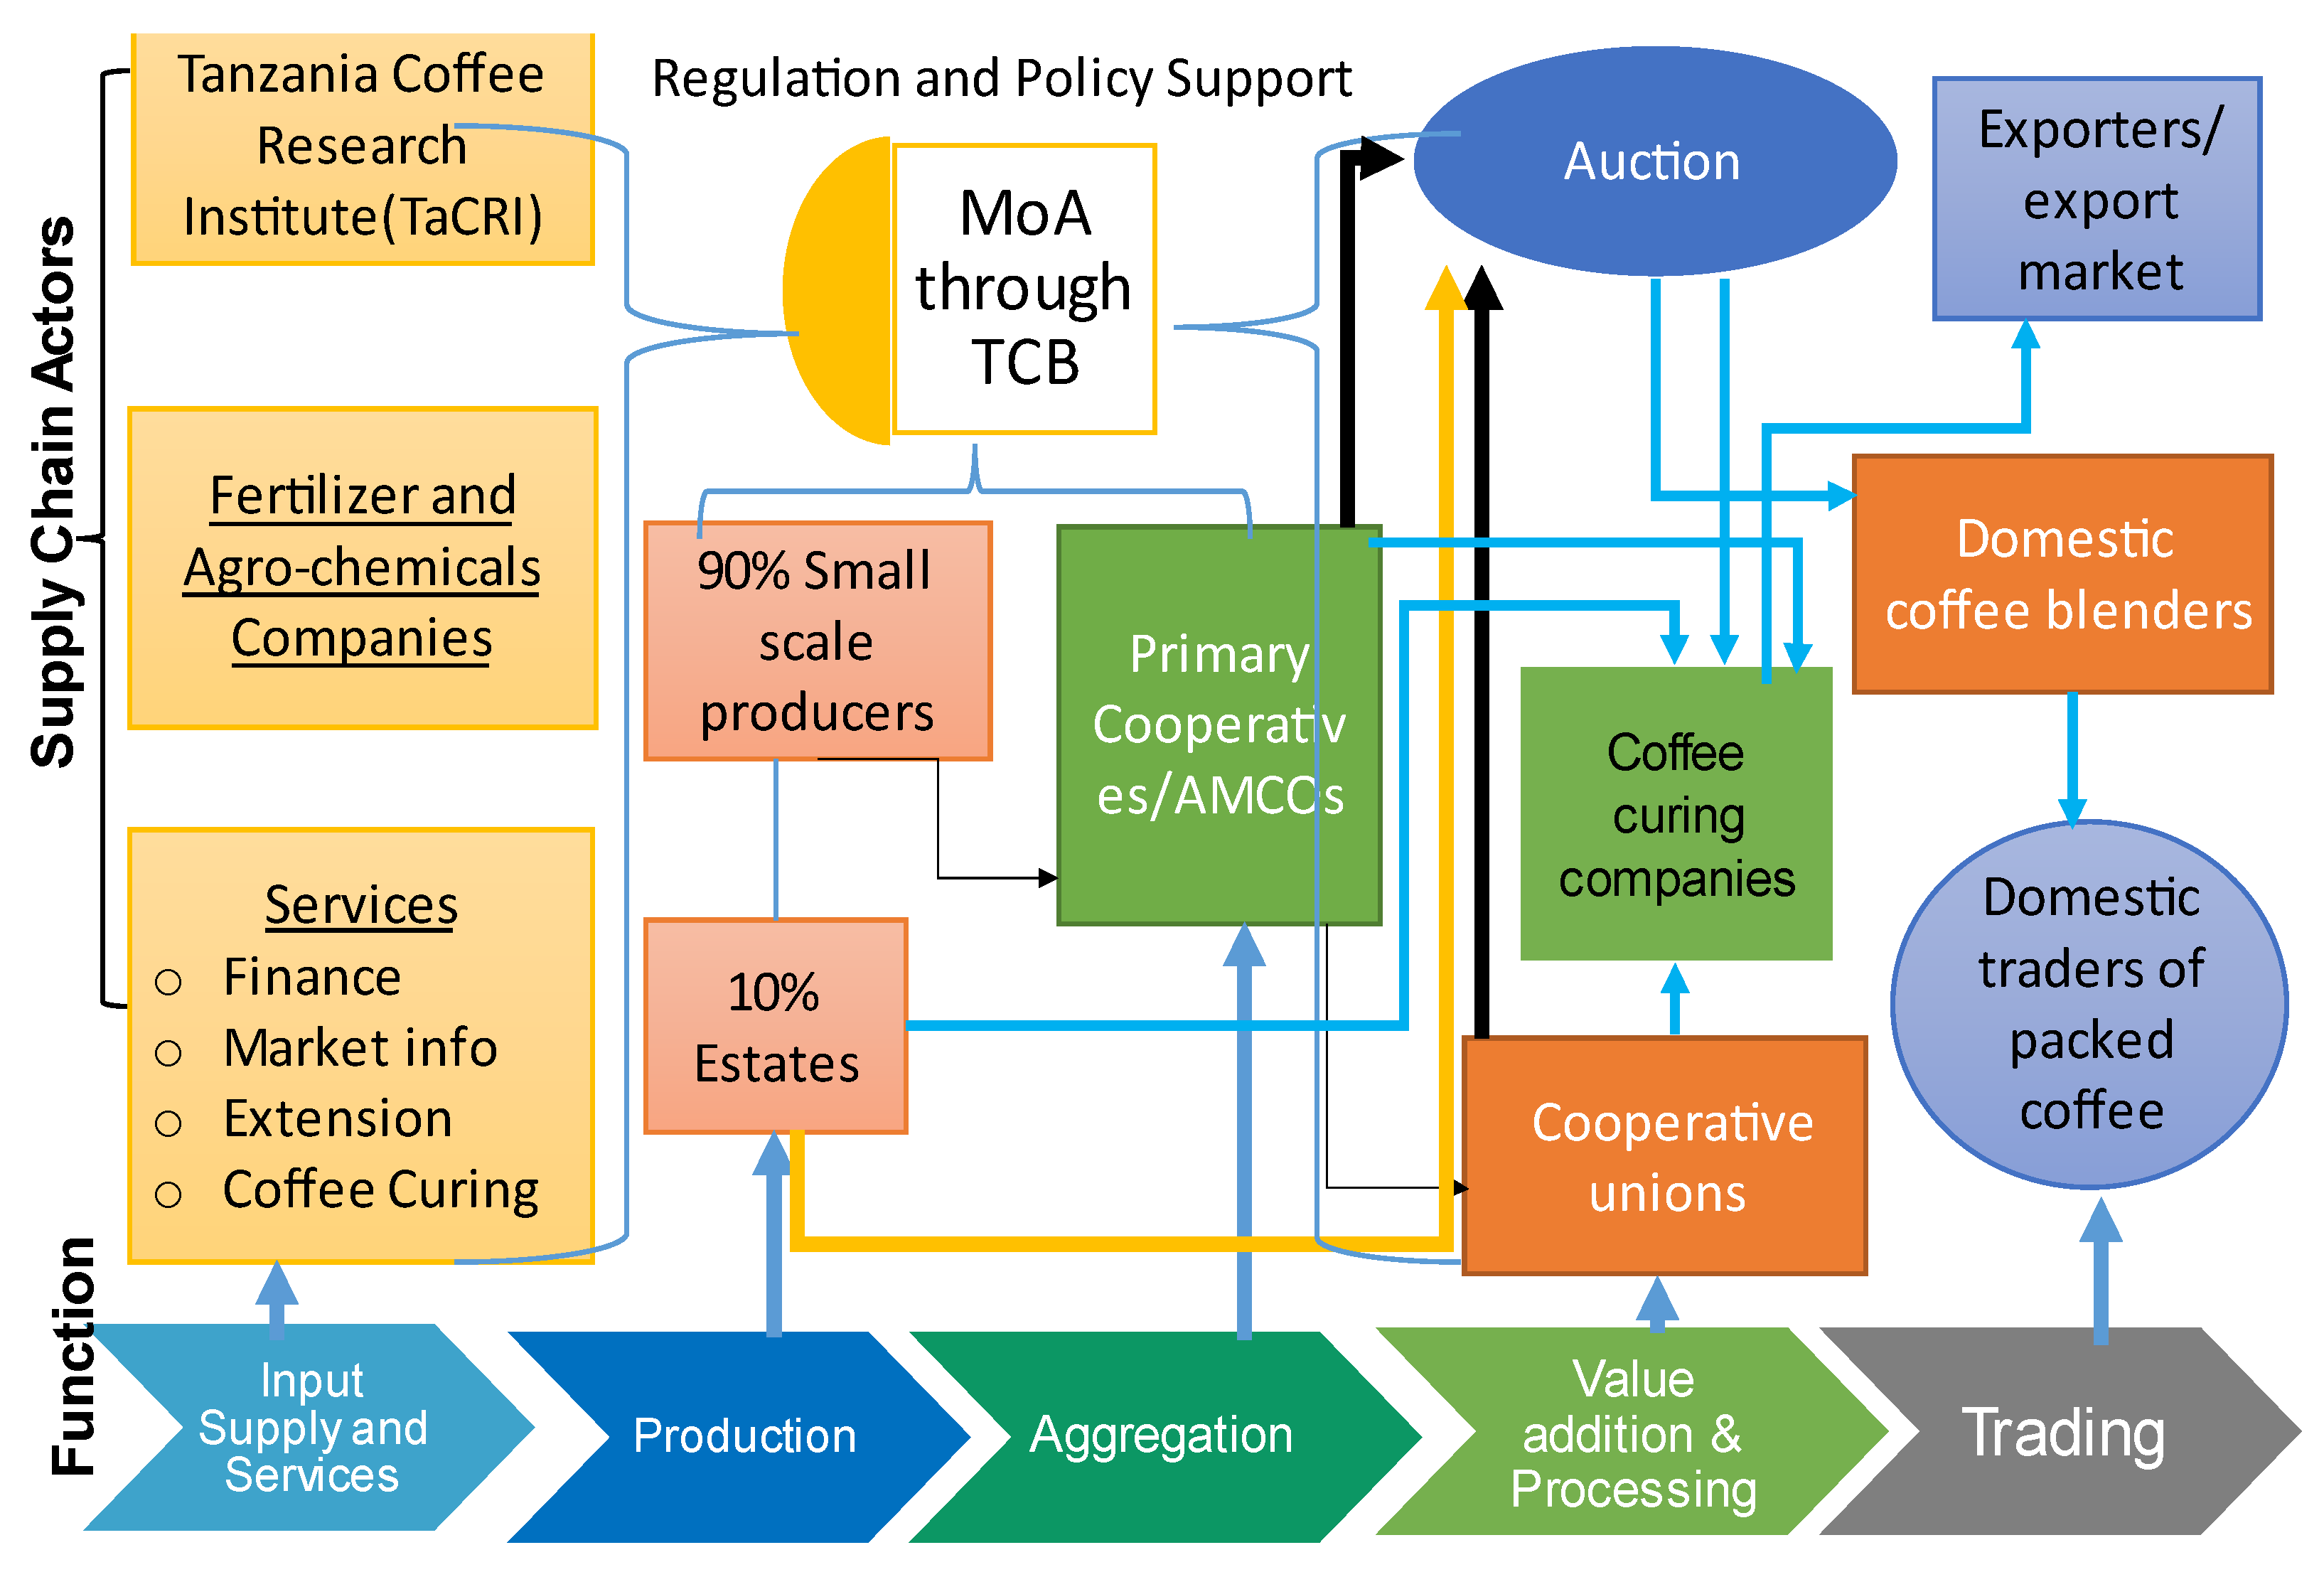
The coffee supply chain in Tanzania involves different actors in each stage, from production, trading, to consumption. The systematic stages of the coffee supply chain are input supply and services; production; aggregation; value addition and processing; and trading (
Figure 3). Several actors play roles in the provision of inputs and services. The Tanzania Coffee Research Institute (TaCRI) in collaboration with district councils deals with the provision/distribution of seedlings to farmers. TaCRI also conducts coffee research and provides technical backstopping on emerging coffee diseases. Other coffee inputs, such as fertilizer and agrochemicals, are provided by agrodealers and agrochemical companies, through their agents. Service providers include financial institutions, extension agents, coffee curing companies, and other actors supporting the access of market information.
Input suppliers and service providers deliver the inputs and services to farmers. Farmers are the main coffee supply chain actors. Coffee production is dominated by small-scale farmers (90%) [
17]. Small-scale farmers aggregate their coffee through the Agricultural Marketing Cooperative Societies (AMCOS), which are linked to the cooperative unions. Value addition and processing is conducted at the AMCOS level and sometimes starts with home processing, especially for AMCOS lacking central pulpery units (CPU). AMCOS also extends the processing using coffee curing companies. AMCOS and cooperative unions take part in the trading of coffee in auctions. The main buyers at the auctions include exporters and domestic coffee blenders. The domestic coffee blenders buy green coffee beans from an auction, then they add value before selling them to domestic traders of packed blended coffee.
4. Results
4.1. Summary Statistics of the Survey Results
The income earned by men through coffee production and trading is higher than that earned by women. The t-test statistics indicate a significant difference in coffee income earned between men and women (
p < 0.05) (
Table 1). Men own and produce in larger coffee farm sizes than women. The average coffee farm size for men is 6.3 hectares, against the 4.7 hectares for women. The participation of men in off-farm economic activities was found to be higher than that of women. Men were also found to have a higher total value of assets than women. The summary statistics further show that 65.05% of men in coffee farming households are involved in coffee production activities. The proportion of men involved in coffee trading activities averages at 72.5%. However, few men had accessed credit. The results reveal that more women were found to have accessed credit than men. Nevertheless, the overall access to credit among the coffee farming households was found to be low. Women coffee farmers spent more years in formal training than men. The results further show that there is no significant difference in the level of education, as depicted by the number of years spent in formal training, between men and women. Overall, the farmers spent an average of 9 years in formal training, implying that all the farmers involved in the survey had completed at least primary education level.
4.2. Involvement of Women and Men along the Coffee Supply Chain
Males dominate the coffee supply chain. The results show that 87% of the coffee farmers interviewed are male and 13% are female. The structure of the coffee supply chain, from ownership and control of resources to the participation in production and marketing, limits the active involvement of women. Women are highly integrated into the lower end of the coffee supply chain. Women perform activities such as harvesting and post-harvesting handling activities that include drying and sorting, while men are involved in agrochemicals application, pruning of coffee trees, and other high-level activities in the coffee supply chain. This makes the participation of women less than men in both the production as well as the trading activities.
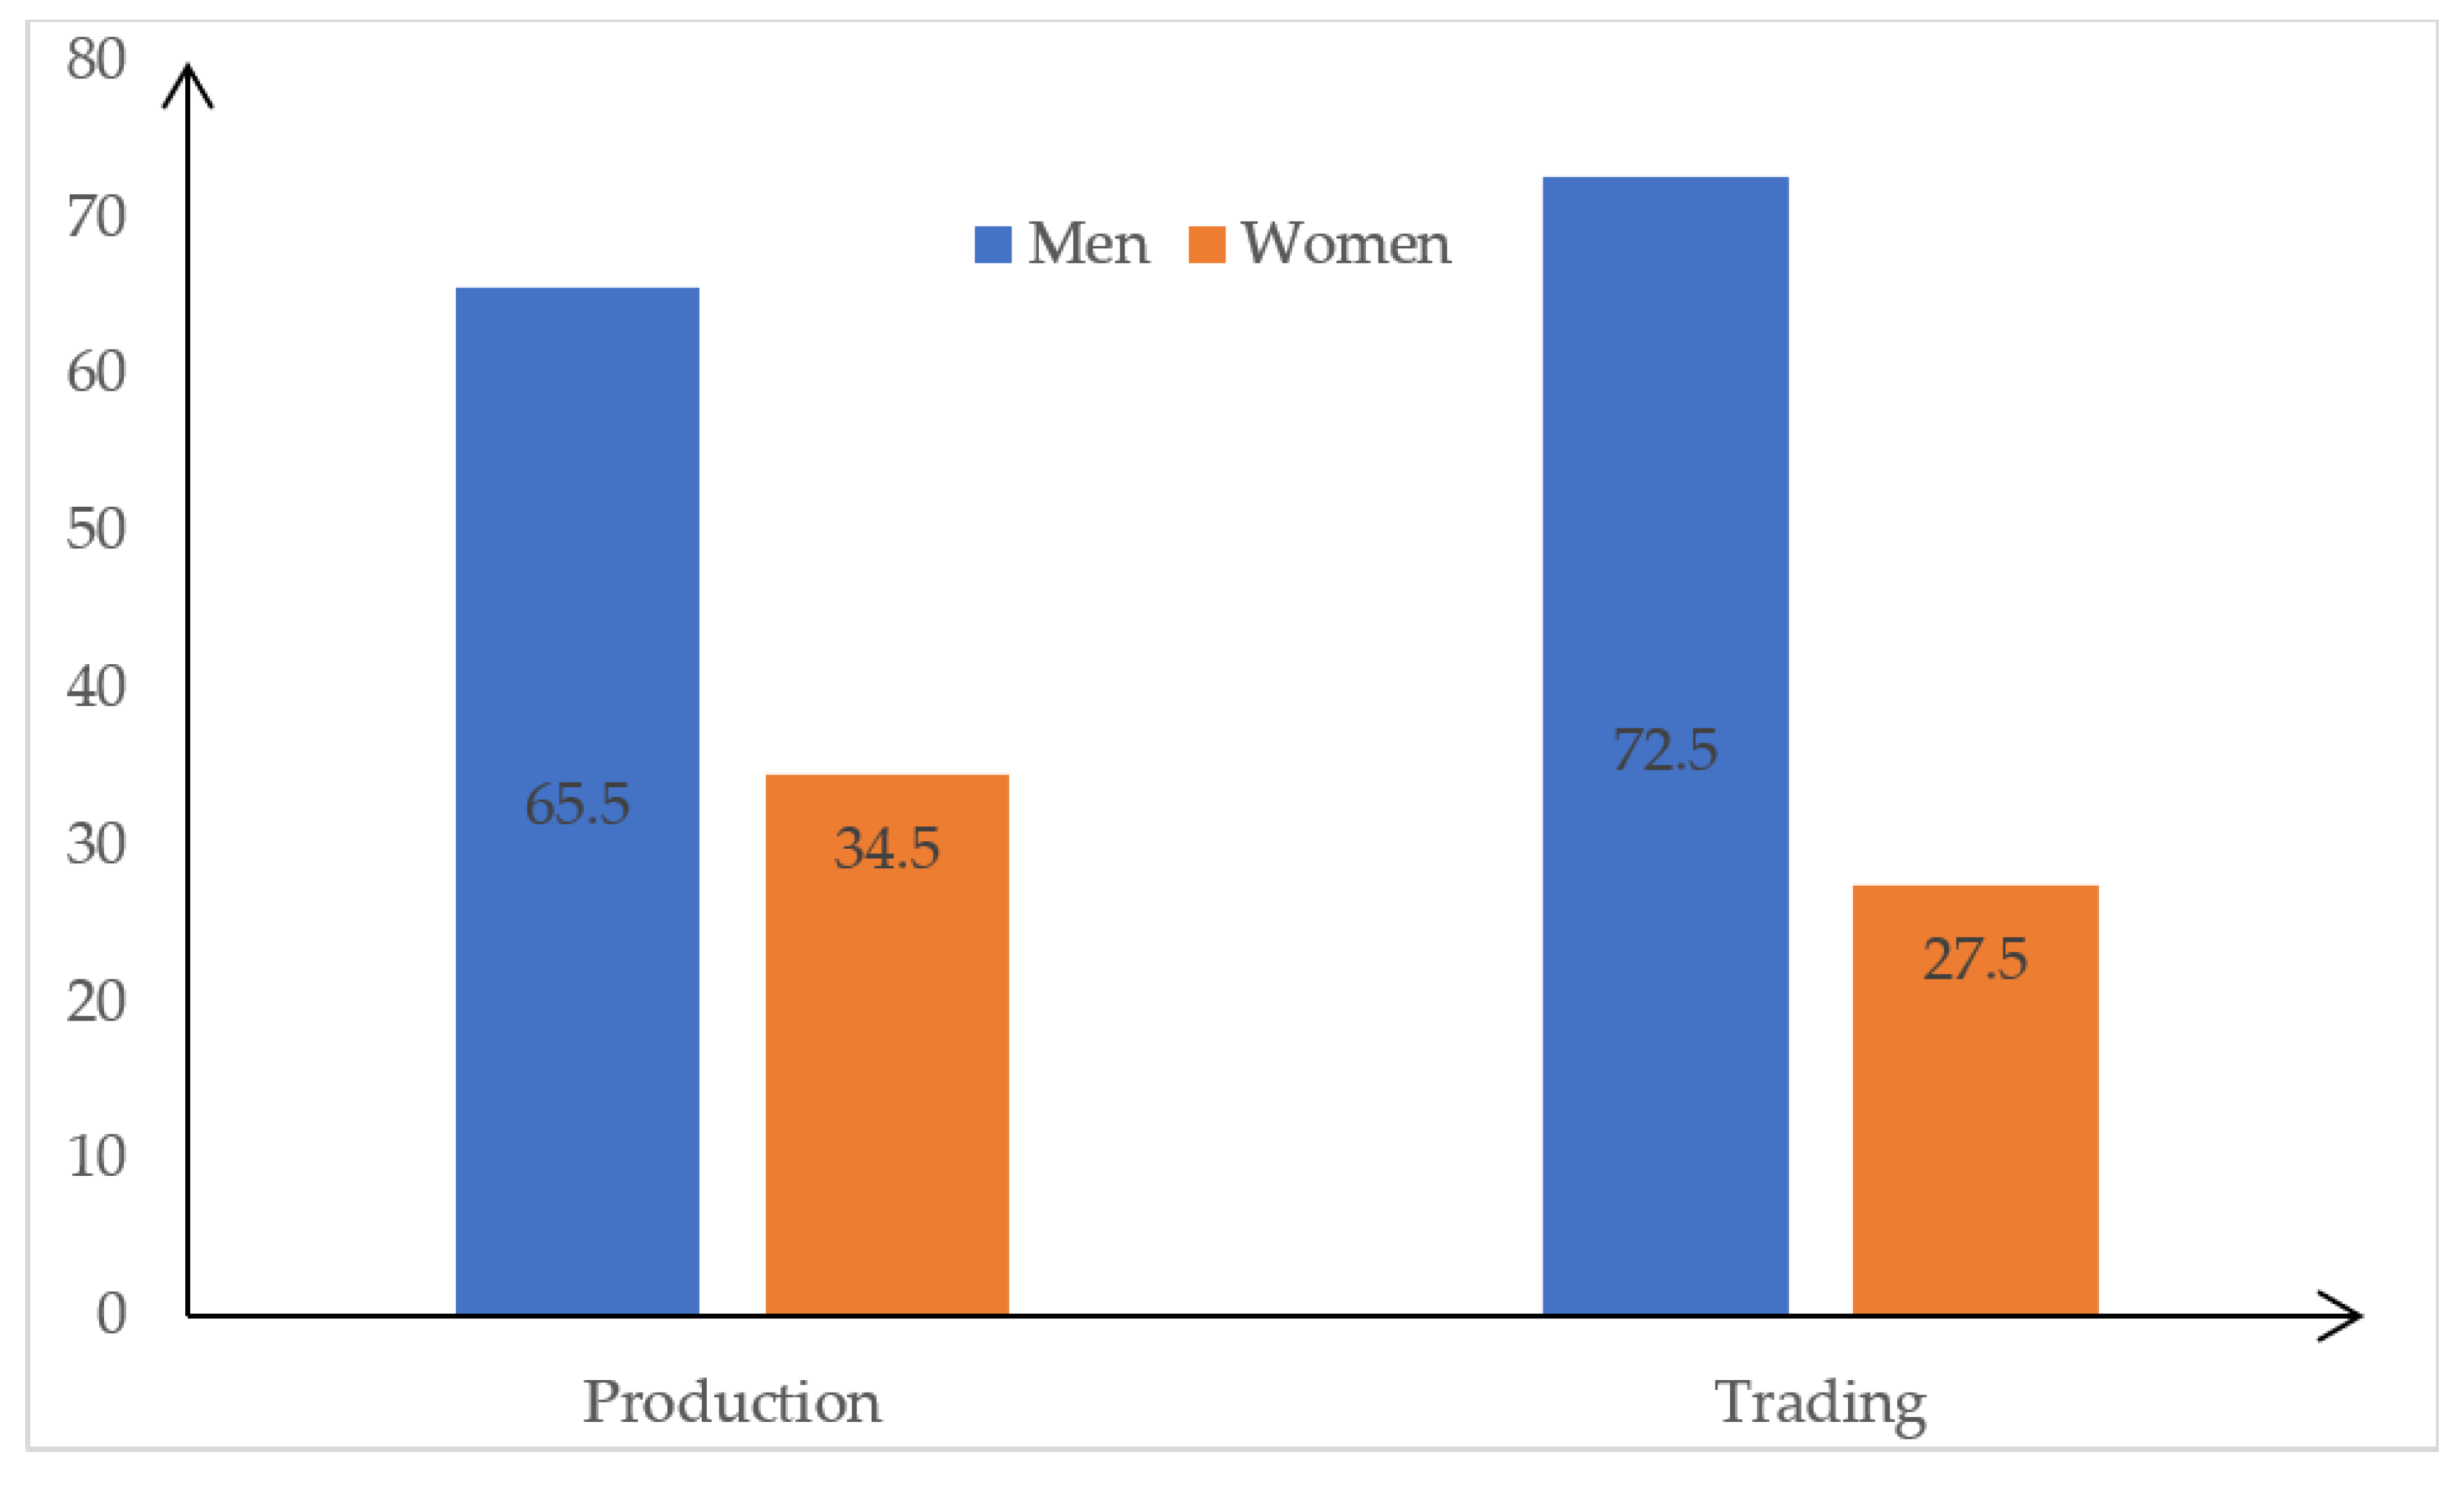
The results indicate that 34.5% of women are fully involved in coffee production, against the proportion of men, which is 65.5% (
Figure 5). The participation of women in coffee trading activities is low (27.5%). The results indicate that 72.5% of men participate in coffee trading. The low participation of women in trading is linked to the hurdles they face in ensuring coffee is sold through the Agricultural Marketing Cooperative Societies (AMCOS). Qualitative data confirm that women also have low control over the proceeds coming from coffee.
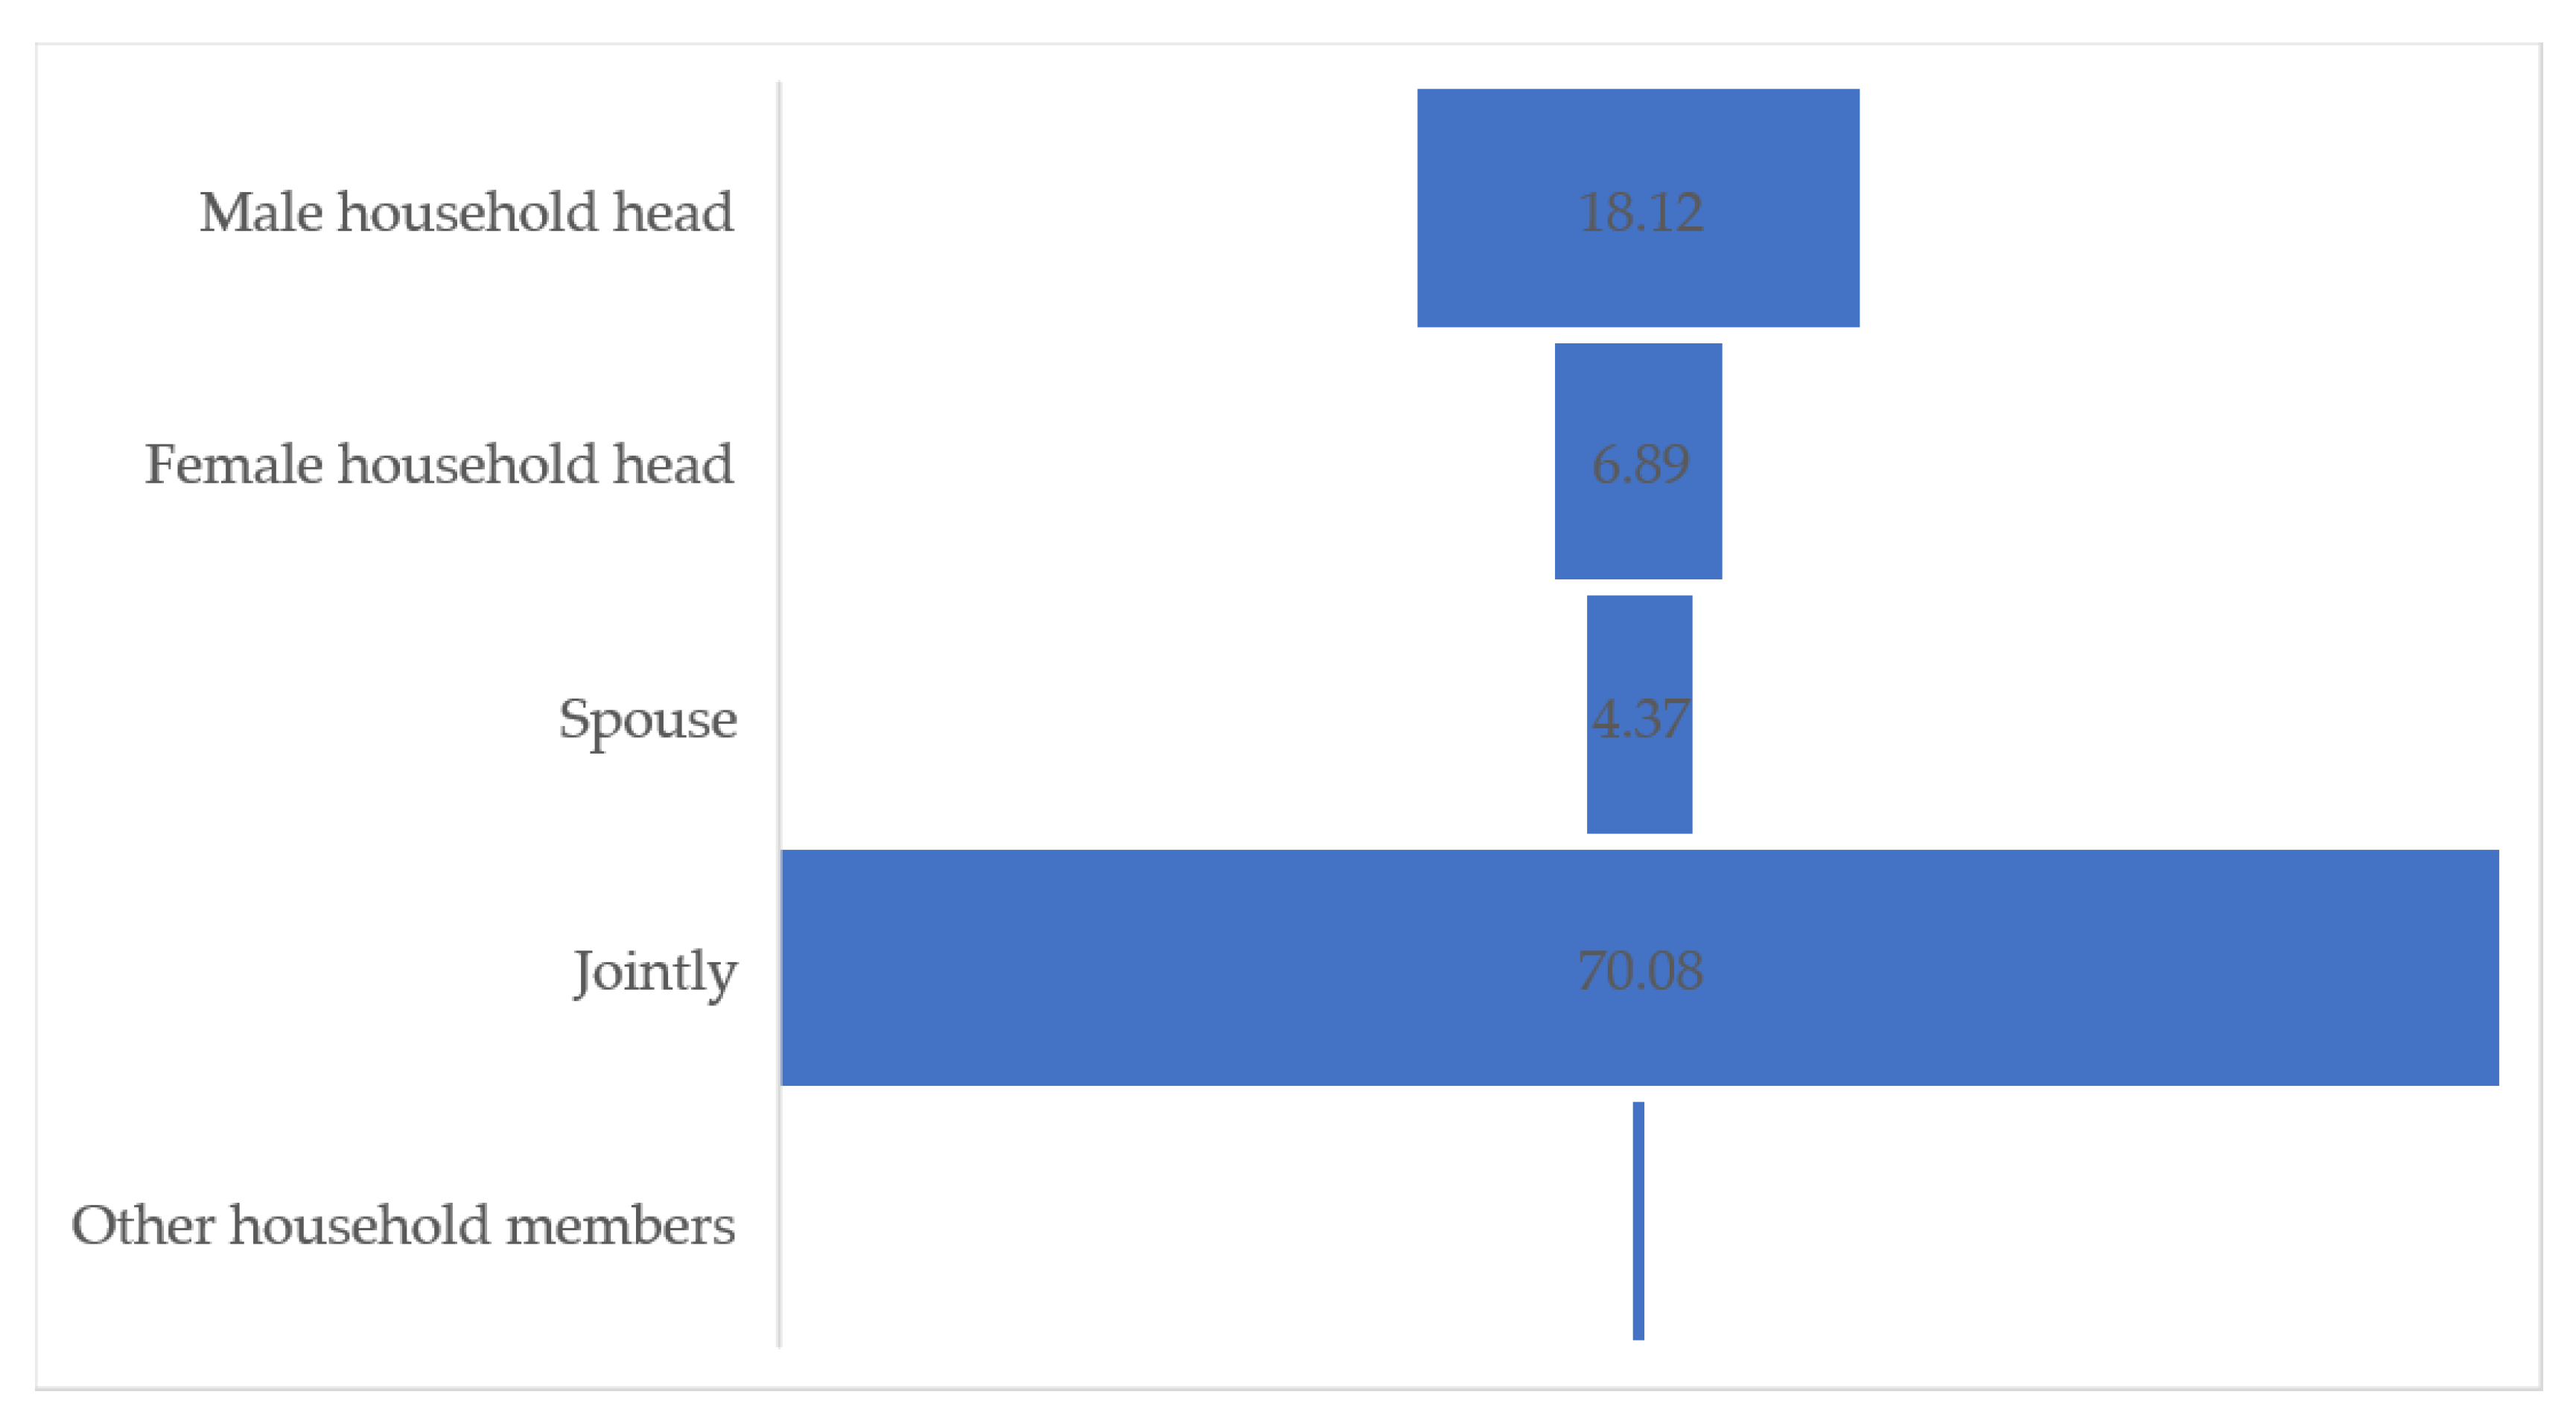
4.3. Participation of Women in Household Decision Making
Coffee farmers make decisions on various socio-economic aspects, such as coffee production and trading, household income and expenditure, farming of other crops, and health issues. The participation of women in decision making among the coffee farming households is high (77%). The results show that women are included in making most of the household decisions. The disaggregated results show that 70.08% of the coffee farmers make decisions jointly in their households (
Figure 6). Interestingly, about 7% of women indicate that they make decisions on their own. However, these decisions are mainly on minor household expenditures, such as food for daily consumption, or other household needs. Women are more involved on the decisions about whether or not to use family planning to space or limit births; their children’s education, such as whether to send them to school, where children should be sent; participation in off-farm economic activities, including things such as running a small business; and use of the revenue from the trading of coffee.
4.4. Gender Gap in Income Earned from Coffee Production and Trading
The study confirms differences in the incomes earned between men and women coffee farmers. Male coffee farmers earn more income than female farmers, by USD 737.76. The results show a significant difference in the coffee income earned between male and female coffee farmers (
p < 0.05). Male farmers earned an average income of USD 1172.12 and female farmers earned an average of USD 434.37 (
Table 2). The intragroup differences are attributed to various factors. The differences in coffee income among women are influenced by their differences in coffee farm sizes, the value of assets owned, level of education, and participation in off-farm income economic activities (
p < 0.05). Similarly, farm size and access to credit accounts for the differences in coffee income among men farmers. The decomposition of coffee income shows the existence of an income gender gap that is mainly influenced by economies of scale and access to credit, given the fact that the crop is capital intensive.
The decomposition results show that the mean increase in women’s coffee income, if they had the same characteristics as men (USD 321.71), accounts for 43.6% of the coffee income gap. This is the proportion of the endowment or the women’s structural disadvantage. Furthermore, applying men’s coefficients to women’s characteristics would change the women’s coffee income by USD 418.109. However, the simultaneous effect of the differences in endowment and coefficients is USD −2.062, implying that after controlling for coefficients and women’s structural disadvantages/endowments, the portion of the gap that remains is very small (USD −2.062), suggesting that women are better than men in trade once the structural barriers are eliminated. They need to achieve economies of scale and have access to credit.
The economies of scale are reported in the sense that there are big farms that are owned by men, making the differences in income between men and women coffee farmers high. Other studies in Tanzania have also confirmed the existence of differences in the productivity of men- and women-managed farms. The study by Slavchevska [
23] indicated women farms to be less productive, which might contribute to the low levels of income obtained from these farms. This is highly linked to the ownership of land, which is key in the production of coffee. However, land ownership has multiplier effects on other indicators as well. Land ownership is interrelated with access to credit. Farmers with good land tenure systems can easily access credit.
4.5. Income Distribution among Men and Women Coffee Farmers
Coffee is an important crop for livelihood improvement to many men and women farmers. The findings show that 65.8% of the farmers indicate coffee to be their main source of income for improved livelihood. The remaining (34.2%) show that coffee is among the crops in their portfolio, but it is not the main source of income. In addition to coffee, farmers obtain incomes from various sources. The findings indicate that 88.3% of the coffee farmers obtain income from the production of other crops. Furthermore, 47% of the farmers report to have obtained income from livestock production activities. The other income sources, with the proportion of farmers generating income from that source in brackets, are as follows: business (16.5%), off-farm economic activities (11.3%), production of vegetables and fruits (10.8%), remittances (6.8%), and salaries/wages (3.8%). The average annual amount of income from these sources varies from one source to another. The results show that coffee production and trading generate the highest annual income, with an average of USD 1141.87 per farmer. The second source of income with a high value is found to be businesses that generated an average annual income of USD 1084.54. However, farmers generated an average of less than USD 1000 from other income sources, that is, livestock, vegetable and fruits, other crops, remittances, and off-farm economic activities (
Table 3).
Income from the production of vegetables and fruits, salaries and wages, off-farm production activities, remittance, and business show a higher level of income inequality than other income sources (
Table 3). However, the increase in incomes from remittances decreases the Gini coefficient of the total incomes earned by coffee farmers. The findings show that a 1% increase in the income earned from remittance, all else being equal, decreases the Gini coefficient of the total income by 0.006%. The business income, off-farm income, wages and salaries, and income earned through the production of vegetables and fruits shows an increase with an increasing level of inequality among men and women coffee farmers.
The lowest level of inequality is revealed from the production and trading of other crops and coffee. The income earned from coffee and other crops shows the highest level of equality among farmers. The other income source with a low level of inequality is the income earned from livestock production activities, coffee, and other crops, which shows inequality reducing effects to coffee farmers. The results of coffee income show that a 1% increase in the income earned from coffee production, all else being equal, decreases the Gini coefficient of the total income by 0.043%. This implies that coffee production has an inequality reducing effect to coffee farmers, hence being an essential crop for livelihood improvement. Additionally, the Gini correlation between off-farm income and total income is the highest among the income sources (0.832), indicating that the income earned from off-farm activities favors the rich more than any other income source.
4.6. Livelihood Conditions among Men and Women Coffee Farmers
The study examines the livelihood conditions of men and women coffee farmers in terms of food security, housing conditions, and access to utilities, such as water, electricity, and other forms of energy. Most of the coffee farmers involved in the study (54.2%) indicate to have better food availability than other farmers. Many women (75%) indicate to be in a better food availability condition than men (
Table 4). They use the money obtained for household food needs, as well as other requirements, such as sending children to school. This implies that coffee production and trade positively affect food security, in terms of food availability and food access. Food availability and access have a broad meaning in measuring food security [
25,
26]. Food availability implies physical availability, such that there is a reliable and consistent source of quality food, as determined by the level of food production guaranteed by the availability of, and access to, land, water, labor, biodiversity, technologies, and credit, stock levels, and net trade. The income earned through coffee is used to buy food, hence supporting physical access to food. Physical access to food entails people having sufficient resources to produce and/or purchase food.
The housing conditions of coffee farmers are measured in terms of ownership of the house, availability and type of toilet, and features of the house, such as roofing materials, exterior wall materials, and floor materials. Among the interviewed farmers, 98.8% own a house, while the remaining 1% and 0.2% are living in their relatives’ houses and rented houses, respectively. There is no significant difference between men and women coffee farmers in terms of house ownership. The results show that 99.7% of the coffee farmers live in houses with corrugated iron sheets and concrete, while only 0.3% indicated to live in houses with tin roofing materials. Regarding the exterior walls of the houses, 84.8% indicated to have bricks/blocks exterior walls. The house floor status is investigated as well. The results show that 81.5% of the coffee farming households live in houses with cement/tiles floors, while 18.5% have earth floors. Interestingly, all the interviewed farmers (100%) have toilets, where 92.5% use covered and flush toilets, and only 8.5% use an uncovered pit latrine.
The access to electricity, water, and fuel are the key utilities examined among men and women coffee farmers. The results indicate that 58.3% of coffee farming households have access to, and use, electricity. This includes electricity through the national grid, as well as solar power. The findings show that 49.3% of the interviewed coffee farmers use electricity for lighting. The use of firewood for cooking is high among coffee farmers. The findings show that only 4.8% of men and women farmers have diverted away from using firewood as the main fuel for cooking. The majority of the farmers (95.2%) still depend on firewood as the main fuel for cooking. This means that livelihood improvement is associated with environmental conservation, where farming households avert from using firewood. This is important for environmental conservation, in addition to the key role of coffee farming, where it contributes to carbon sequestration, stabilization of soils, and preservation of biodiversity [
27]. Additionally, the high proportion (44.3%) of the coffee farmers interviewed use piped water as a main source of water for domestic use.
5. Discussion
The study establishes that coffee is an important crop for livelihood improvement, which favors equality among men and women coffee farmers. The crop has an inequality reducing effect. An increase in the income earned from coffee production and trading, all else being equal, decreases the Gini coefficient of the total income. This implies that investing in supporting the coffee supply chain has an impact on poverty reduction. This is because the income earned from coffee favors the poor more than other income sources.
It has been found that coffee production and trade contribute to livelihood improvement, in terms of food security, housing conditions, and access to utilities such as water, electricity, and other forms of energy, among men and women coffee farmers. The average household income of USD 2124.8 is higher than the Tanzania basic needs poverty line, as well as the food poverty line. The Tanzania food poverty line is USD 14.9 per adult equivalent per month, and the basic needs poverty line is USD 21.8 [
28]. Given the fact that the average household size for coffee farming households is six people, this translates the poverty line to USD 1073.3 and USD 1568.5 per household annually. It should be noted that the food poverty line means that the total spending is used to meet food needs. The basic needs poverty line is inclusive of food and non-food requirements [
15]. This means that men and women farming households are above the food poverty line, as well as the basic needs poverty line. This is an indicator that they have a high ability to obtain income, as well as to access various economic opportunities.
However, coffee is a men-dominated supply chain, where women are highly integrated into the lower end of the coffee supply chain. The study establishes that women face more hurdles than men in ensuring coffee is sold through the AMCOS. This is in agreement with previous studies, such as Bergman Lodin, Tegbaru [
29], which linked the low participation of women with mobility challenges, and the difficulties they experience in accessing agricultural inputs and services compared to men. The low involvement of women along the coffee supply chain results in an inability to take control of the proceeds from the coffee in their households.
The participation of women in decision making is expected to act as an empowerment that would enhance their involvement in the coffee supply chain. The participation of women in household decision making is essential to spur involvement in production and trading activities, access, and control of benefits. There is a high participation of women in household decision making. However, the ability of women to make decisions on the production and trading of coffee on their own is found to be low among coffee farming households. This implies that there is low control and access of women in productive assets that would empower them to make decisions. This is augmented by culture, the stereotype that women cannot make decisions in the presence of men, gender norms, and insufficient knowledge resources, as similarly reported in other countries by other studies, such as Iradukunda, Bullock [
30] and Filho, Brandli [
11]. Empowering women to have access and control of key resources will enhance their ability to make decisions along the coffee supply chain.
The study confirms the existence of the gender gap in the income earned from coffee production and trading. The crop is capital intensive and the economies of scale are the key drivers of gendered coffee income differences. The differences in farm sizes that are attributed to the economies of scale among men and women farmers, and the access to credit, drive the gendered imbalance. This means that women are disadvantaged in terms of ownership and access to land. The land is predominantly owned by men, thus it becomes difficult for women to make investment decisions, especially on perennial crops, such as coffee. Access to credit, which would support the management of the coffee farms and enhance the trading of coffee, is also limited among women.
Access and control of resources and other socio-economic characteristics among women collectively represent the structural disadvantages of women. The study has indicated that female structural disadvantage accounts for about 44% of the gap. Thus, an empowerment that would enable easy access and control of resources, such as land and access to credit, can eliminate the existing gender gap. The study has confirmed that women can be better than men in trade, after compensating for historical and social disadvantages. Efforts to achieve inclusive finance should be exercised. The problem of credit being inaccessible also affects many women farmers in developing countries. The study by Hill and Vigneri [
31] found a similar situation in coffee farmers in Uganda. Additionally, the study by Korinek, Moïsé [
12] indicated that women’s enterprises are less financed. The reasons are always aligned to the access and control of resources. It is evident that land ownership status is correlated with access to credit. Farmers with titled land ownership can easily access credit. Therefore, empowering women to have access and control of land will also contribute to inclusive finance among women as well as men coffee farmers.
6. Conclusions
Coffee is an important crop with an inequality reducing effect, contributing to livelihood improvement among men and women coffee farmers. It is evident that investing in supporting the coffee supply chain has an impact on poverty reduction, as the income earned from coffee favors the poor more than other income sources. Nevertheless, we find gender imbalance from the ownership and control of resources to the participation of men and women in the coffee supply chain. Coffee is a men-dominated supply chain, where women are highly integrated into the lower end of the coffee supply chain and have low control over the proceeds coming from coffee. The study also affirms the existence of the gender gap in the income earned from coffee production and trading. The crop is capital intensive and the economies of scale are the key drivers of gendered coffee income differences. Empowerment for equal access to land and credit will contribute to bridging the existing gender gap in coffee production and trading. Production and trade policies should also be gender-responsive, by providing opportunities to offer trade facilitation services to increase the participation of women in coffee supply chain activities and control of their benefits of participation. Additionally, developing and disseminating new coffee production technologies that will reduce discrimination, by offering new opportunities and making coffee an inclusive supply chain, remains imperative. These efforts will ensure that the distribution of income gains from coffee equally favors both men and women in developing countries, achieving gender equality and livelihood improvement. Nevertheless, further research is required to ascertain how social, cultural, and behavioral constraints, and gender-based violence, such as denial of resources, services and opportunities in developing countries, limit the participation of women, and the generation of benefits from the production and trading of global supply chains, such as coffee. Gender-based determinants of the profitability of coffee production should also be explored further.


 ,
, 

