
Changes in Fan Energy Consumption According to Filters Installed in Residential Heat Recovery Ventilators in Korea

Abstract
:1. Introduction
2. Materials and Methods
2.1. Experimental Methods
2.2. Performance of Heat Recovery Ventilator
2.3. Test Site
2.4. Test Conditions
- (1)
- Experiment air filters
- (2)
- Air volumes for experiments
3. Research Results and Discussion
4. Conclusions
Author Contributions
Funding
Institutional Review Board Statement
Informed Consent Statement
Data Availability Statement
Conflicts of Interest
References
- The Government of Korea. Ministry of Land, Infrastructure and Transport (MLIT), Presidential Decree No. 467, Rules on the Facility Standards of Buildings; The Government of Korea: Seoul, Korea, 2017.
- The Government of Korea. MLIT. Presidential Decree No. 715, Rules on the Facility Standards of Buildings; The Government of Korea: Seoul, Korea, 2020.
- Brook, R.D.; Rajagopalan, S.; Pope, C.A.; Brook, J.R.; Bhatnagar, A.; DiezRoux, A.V.; Holguin, F.; Hong, Y.; Luepker, R.V.; Mittleman, M.A.; et al. Particulate matter air pollution and cardiovascular disease. Circulation 2010, 121, 2331–2378. [Google Scholar] [CrossRef] [PubMed] [Green Version]
- Choe, J.; Lee, Y. A study on the impact of PM2.5 emissions on respiratory diseases. J. Environ. Policy Admin. 2015, 23, 155–172. [Google Scholar] [CrossRef]
- Kim, M.; Park, J.; Lee, J. Development of pre-filter system for improving particulate matter filtering performance of multi-unit heat recovery ventilation system. Korean Soc. Living Environ. 2019, 26, 641–648. [Google Scholar] [CrossRef]
- Song, Y. Evaluation of particulate matter removal rate according to filter type and thickness of total heat exchanger in apartment houses. LHI J. 2020, 11, 93–98. [Google Scholar]
- Won, K.; Kwak, R.; Huh, J. Evaluation of energy consumption of HVAC system of air filter pressure change in commercial buildings. Korean J. Air-Cond. Refrig. Eng. 2004, 16, 1227–1234. [Google Scholar]
- Kang, Y.; Kim, J.; Seo, J.; Jeon, B.; Ahn, Y. A study on the performance variations of an energy-recovery ventilator using a pre-filter and HEPA grade filters. Korean J. Air-Cond. Refrig. Eng. 2020, 32, 165–172. [Google Scholar]
- MacNeill, M.; Kearney, J.; Wallace, L.; Gibson, M.; Heroux, M.E.; Kuchta, J.; Guernsey, J.R.; Wheeler, A.J. Quantifying the contribution of ambient and indoor-generated fine particles to indoor air in residential environments. Indoor Air 2013, 24, 362–375. [Google Scholar] [CrossRef] [PubMed]
- Baxter, L.K.; Burke, J.; Lunden, M.; Turpin, B.J.; Rich, D.Q.; Thevenet-Morrison, K.; Hodas, N.; Ozkaynak, H. Influence of human activity patterns, particle composition, and residential air exchange rates on modeled distributions of PM2.5 exposure compared with central-site monitoring data. J. Expo. Sci. Environ. Epidemiol. 2013, 3, 241–247. [Google Scholar] [CrossRef] [PubMed]
- Alavy, M.; Siegel, J. IAQ and energy Implications of high efficiency filters in residential buildings: A review (RP-1649). Sci. Technol. Built Environ. 2019, 25, 261–271. [Google Scholar] [CrossRef] [Green Version]
- Noh, K.; Hwang, J. The effect of ventilation rate and filter performance on indoor particle concentration and fan power consumption in a residential housing unit. Indoor Built 2010, 19, 444–452. [Google Scholar] [CrossRef]
- Stephens, B.; Novoselac, A.; Seigel, J. The effects of filtration on pressure drop and energy consumption in residential HVAC systems. Sci. Technol. Built Environ. 2010, 16, 273–294. [Google Scholar]
- Zaatari, M.; Novoselac, A.; Siegel, J. The relationship between filter pressure drop, indoor air quality, and energy consumption in rooftop HVAC unit. Build. Environ. 2014, 73, 151–161. [Google Scholar] [CrossRef]
- Fazli, T.; Yeap, R.Y.; Stephens, B. Modeling the energy and cost impacts of excess static pressure in central forced-air heating and air-conditioning systems in single-family residences in the U.S. Energy Build. 2015, 107, 243–253. [Google Scholar] [CrossRef]
- Nassif, N. The impact of air filter pressure drop on the performance of typical air conditioning systems. Build. Simul. 2012, 5, 345–350. [Google Scholar] [CrossRef]
- Alavy, M.; Li, T.; Siegel, J.A. Energy use in residential buildings: Analyses of high-efficiency filters and HVAC fans. Energy Build. 2020, 209, 109697. [Google Scholar] [CrossRef]
- Walker, L.; Dickerhoff, D.; Faulkner, D.; Turner, J. System effects of high efficiency filters in homes. In Proceedings of the ASHRAE Annual Conference, Denver, CO, USA, 22–26 June 2013. [Google Scholar]
- Yang, S.; Ahn, T. A study on the airflow characteristics of an energy recovery ventilator according to the filter characteristics. In Proceedings of the Society of Air-Conditioning and Refrigeration Engineering Summer Conference, Yongpyeong, Korea, 19–21 June 2019. [Google Scholar]
- Jeong, Y.; Lee, S.; Park, B. Energy performance analysis according to filter pressure loss change of heat recovery ventilator. In Proceedings of the Society of Air-Conditioning and Refrigeration Engineering Summer Conference, Seoul, Korea, 22 November 2019. [Google Scholar]
- Montgomery, J.; Green, S.; Rogak, S.; Bartlett, K. Predicting the energy use and operation cost of HVAC air filters. Energy Build. 2012, 47, 643–650. [Google Scholar] [CrossRef]
- Kwak, R.; Won, G.; Jung, W.; Huh, J. Evaluation of energy saving and development of energy management system of AHU’s fan by air filter differential pressure in building. J. Arch. Inst. Korea 2004, 20, 204–211. [Google Scholar]
- Fisk, W.J.; Faulkner, D.; Palonen, J.; Seppanen, O. Performance and costs of particle air filtration technologies. Indoor Air 2002, 12, 223. [Google Scholar] [CrossRef] [Green Version]
- The Government of Korea. MLIT. The Second Plan for Green Buildings (20~24), Policy Report; The Government of Korea: Seoul, Korea, 2020.
- Lee, S. Application state of apartment ventilation system in Korea. Mag. SAREK 2021, 50, 56–62. [Google Scholar]
- Korea Standard. KS B 6879; Heat Recovery Ventilator; Korean Standard: Seoul, Korea, 2017.
- The Government of Korea. MLIT. Law for Apartment Housing; The Government of Korea: Seoul, Korea, 2020.
- British Standards (BS); European Standard (EN). BS EN 1822-1; Performance Testing, Marking. High Efficiency Air Filters (EPA, HEPA and ULPA); British Standards: London, UK, 2019. [Google Scholar]
- Song, S.; Shin, Y.; Kim, J. An experimental study on the differential pressure and speed of small air cleaner filter. In Proceedings of the KFMA Annual Meeting, Yeosu, Korea, 28–30 November 2018. [Google Scholar]
- American Society of Heating, Refrigerating and Air-Conditioning Engineers (ASHRAE). Standard 52.2; Method of Testing General Ventilation Air-Cleaning Devices for Removal Efficiency by Particle Size; ASHRAE Inc.: Atlanta, GA, USA, 2017. [Google Scholar]
- ASHRAE. Standard 62.1; Ventilation for Acceptable Indoor Air Quality; ASHRAE Inc.: Atlanta, GA, USA, 2019. [Google Scholar]
- Global Monitoring Laboratory, Trends in Atmospheric Carbon Dioxide. Available online: https://gml.noaa.gov/ccgg/trends/global.html (accessed on 25 April 2021).
- Seong, N. Energy requirements of a multi-sensor based demand control ventilation system in residential buildings. In Proceedings of the 31st AIVC Conference, Low Energy and Sustainable Ventilation Technologies for Green Buildings, Seoul, Korea, 26–28 October 2010. [Google Scholar]
- Hesaraki, A.; Holmberg, S. Demand-controlled ventilation in new residential buildings: Consequences on indoor air quality and energy savings. Indoor Built Environ. 2015, 24, 162–173. [Google Scholar] [CrossRef] [Green Version]
- ASHRAE. Standard 62.2; Ventilation and Acceptable Indoor Air Quality in Residential Buildings; ASHRAE Inc.: Atlanta, GA, USA, 2019. [Google Scholar]


| Item | Specification | |
|---|---|---|
| HRV unit | Air leakage rate | Less than 2% |
| Heat exchanger | Heat exchange efficiency | heating 83%, cooling 73% |
| Material | Polyethylene terephthalate material (Sensible heat exchange type) | |
| HRV fan | Motor power | 72 W (150 CMH) |
| Fan and motor type | Forward Type, brushless direct current | |
| Airflow control | Revolutions/minute control method | |
| Filter | Type | HEPA (H13 grade) |
| Unit Size | - | 1000 (W) × 785 (L) × 340 (D) |
| Measurement | Unit | Equipment | Accuracy |
|---|---|---|---|
| Filter Pressure drop | Pa | DP100 * | 0–500 Pa (±0.5% of reading) |
| Airflow | m3/h | Airtron * | ±0.5% of reading |
| Power draw | W | SJPM-C16 ** | ±0.2% of reading |
| Specification | H13 | E10 | Pre |
|---|---|---|---|
| Method | A count test method | Mass spectrometry | |
| Standard | EN 1822 | ASHRAE 52.2 [30] | |
| Thickness | 3 cm | 3 cm | 1 cm |
| Efficiency | 99.97% | 98.7% | 87.0% |
| Air Volume Condition | Rooms for Ventilation | Medium/Pre 1 | HEPA/Pre 2 | HEPA/Medium 3 |
|---|---|---|---|---|
| 0.5 ACH | L | 5.0% | 17.5% | 11.9% |
| L + R1 | 4.7% | 13.5% | 8.4% | |
| L + R1 + R2 | 3.5% | 16.2% | 12.3% | |
| All rooms | 3.8% | 17.2% | 13.0% | |
| Average | 4.2% | 16.1% | 11.4% | |
| 1.0 ACH | L | 5.7% | 11.8% | 5.8% |
| L + R1 | 4.4% | 13.6% | 8.9% | |
| L + R1 + R2 | 7.4% | 16.0% | 8.0% | |
| All rooms | 6.2% | 13.7% | 7.1% | |
| Average | 5.9% | 13.8% | 7.4% | |
| 1.5 ACH | L | 10.3% | 16.8% | 5.8% |
| L + R1 | 18.4% | 28.7% | 8.7% | |
| L + R1 + R2 | 14.7% | 33.5% | 16.4% | |
| All rooms | 20.9% | 41.3% | 16.9% | |
| Average | 16.1% | 30.1% | 12.0% |
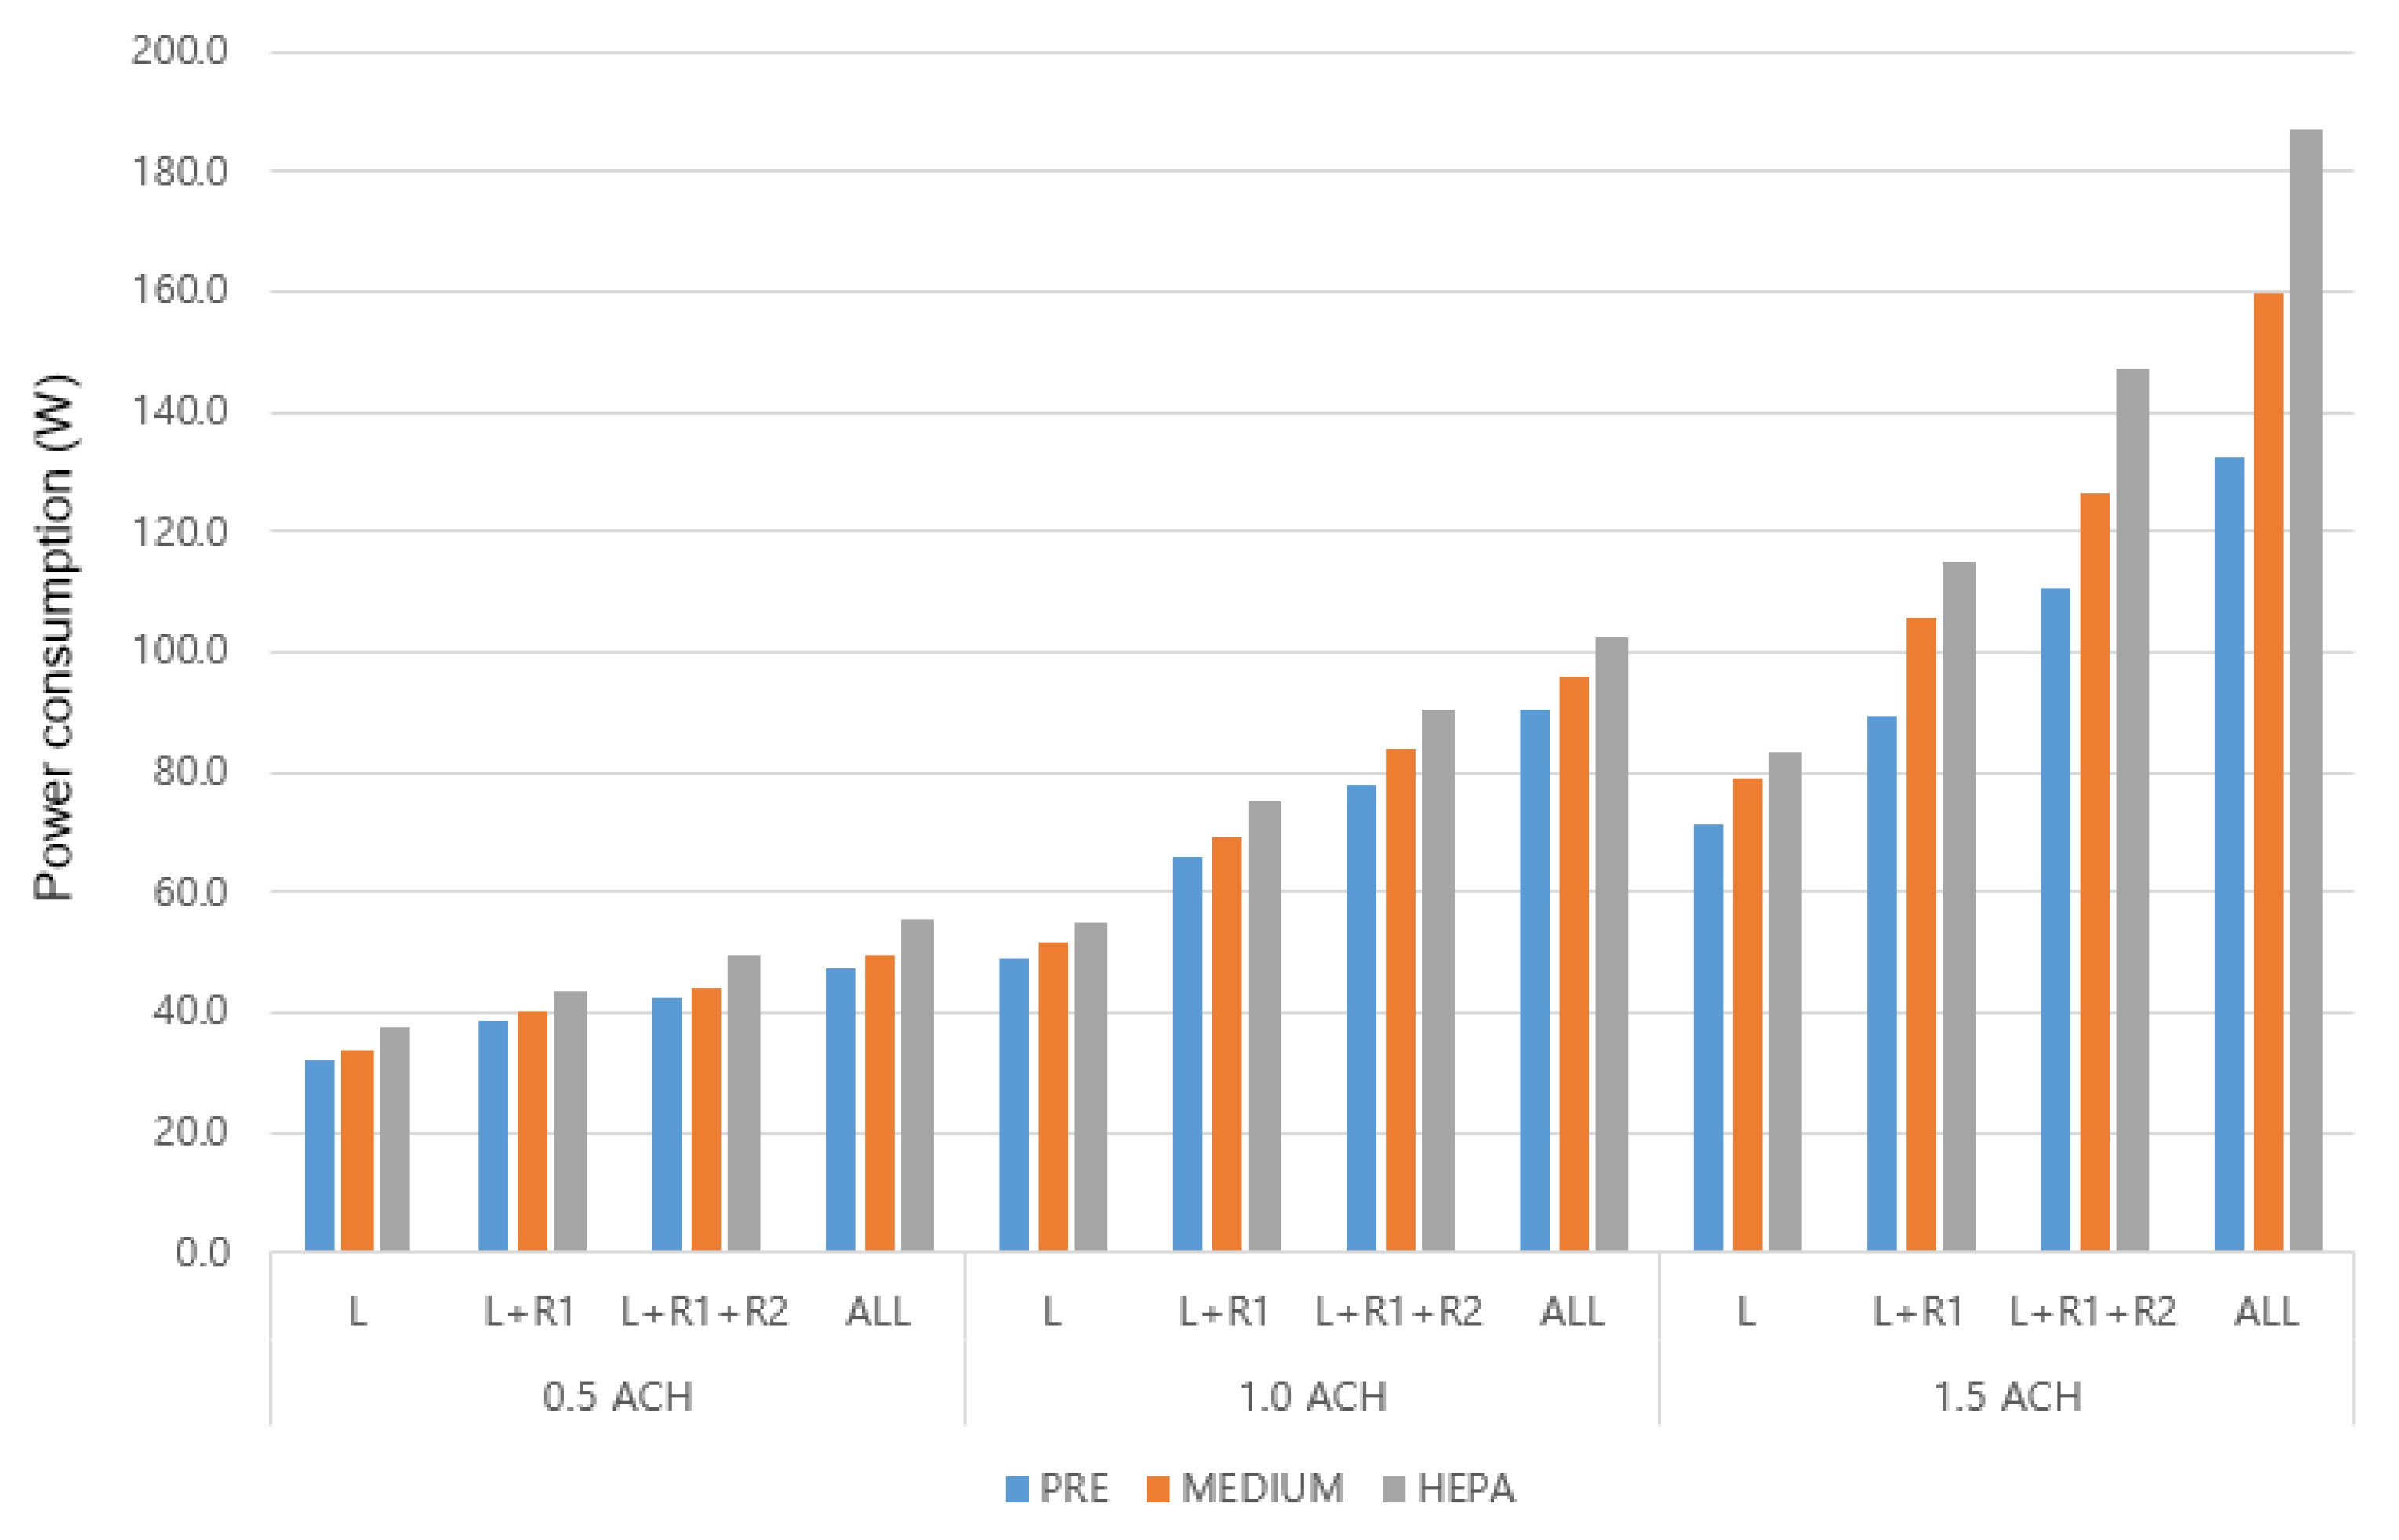
| Filter Specification | ACH | Rooms for Ventilation | Case | Total AirFlow (CMH) | Pressure Loss by the Filter (Pa) | Power Draw (W) |
|---|---|---|---|---|---|---|
| Pre | 0.5 | L | Case 1 | 28 ± 5 | 0 | 32.0 |
| L + R1 | Case 2 | 54 ± 5 | 0 | 38.6 | ||
| L + R1 + R2 | Case 3 | 66 ± 7 | 0 | 42.5 | ||
| All | Case 4 | 83 ± 7 | 0 | 47.6 | ||
| 1 | L | Case 5 | 64 ± 3 | 0 | 49.0 | |
| L + R1 | Case 6 | 92 ± 3 | 0 | 66.0 | ||
| L + R1 + R2 | Case 7 | 126 ± 4 | 1 | 78.0 | ||
| All | Case 8 | 158 ± 4 | 1 | 90.2 | ||
| 1.5 | L | Case 9 | 92 ± 5 | 0 | 71.6 | |
| L + R1 | Case 10 | 143 ± 5 | 1 | 89.2 | ||
| L + R1 + R2 | Case 11 | 189 ± 5 | 2 | 110.4 | ||
| All | Case 12 | 237 ± 5 | 2 | 132.2 | ||
| Medium | 0.5 | L | Case 13 | 29 ± 5 | 2 | 33.6 |
| L + R1 | Case 14 | 52 ± 5 | 3 | 40.4 | ||
| L + R1 + R2 | Case 15 | 64 ± 6 | 4 | 44.0 | ||
| All | Case 16 | 84 ± 6 | 5 | 49.4 | ||
| 1 | L | Case 17 | 66 ± 2 | 5 | 51.8 | |
| L + R1 | Case 18 | 93 ± 3 | 9 | 68.9 | ||
| L + R1 + R2 | Case 19 | 131 ± 3 | 10 | 83.8 | ||
| All | Case 20 | 158 ± 3 | 13 | 95.8 | ||
| 1.5 | L | Case 21 | 95 ± 3 | 8 | 79.0 | |
| L + R1 | Case 22 | 141 ± 3 | 14 | 105.6 | ||
| L + R1 + R2 | Case 23 | 187 ± 4 | 17 | 126.6 | ||
| All | Case 24 | 235 ± 5 | 20 | 159.8 | ||
| HEPA | 0.5 | L | Case 25 | 27 ± 5 | 10 | 37.6 |
| L + R1 | Case 26 | 52 ± 5 | 12 | 43.8 | ||
| L + R1 + R2 | Case 27 | 65 ± 5 | 15 | 49.4 | ||
| All | Case 28 | 82 ± 6 | 21 | 55.8 | ||
| 1 | L | Case 29 | 64 ± 4 | 19 | 54.8 | |
| L + R1 | Case 30 | 95 ± 3 | 25 | 75.0 | ||
| L + R1 + R2 | Case 31 | 132 ± 4 | 31 | 90.5 | ||
| All | Case 32 | 160 ± 5 | 42 | 102.6 | ||
| 1.5 | L | Case 33 | 94 ± 5 | 27 | 83.6 | |
| L + R1 | Case 34 | 143 ± 3 | 43 | 114.8 | ||
| L + R1 + R2 | Case 35 | 188 ± 3 | 53 | 147.4 | ||
| All | Case 36 | 235 ± 5 | 60 | 186.8 |
Publisher’s Note: MDPI stays neutral with regard to jurisdictional claims in published maps and institutional affiliations. |
© 2021 by the authors. Licensee MDPI, Basel, Switzerland. This article is an open access article distributed under the terms and conditions of the Creative Commons Attribution (CC BY) license (https://creativecommons.org/licenses/by/4.0/).
Share and Cite
Cho, K.; Chae, C.-U.; Cho, D.; Kim, T. Changes in Fan Energy Consumption According to Filters Installed in Residential Heat Recovery Ventilators in Korea. Sustainability 2021, 13, 10119. https://doi.org/10.3390/su131810119
Cho K, Chae C-U, Cho D, Kim T. Changes in Fan Energy Consumption According to Filters Installed in Residential Heat Recovery Ventilators in Korea. Sustainability. 2021; 13(18):10119. https://doi.org/10.3390/su131810119
Chicago/Turabian StyleCho, Kyungjoo, Chang-U Chae, Dongwoo Cho, and Taeyeon Kim. 2021. "Changes in Fan Energy Consumption According to Filters Installed in Residential Heat Recovery Ventilators in Korea" Sustainability 13, no. 18: 10119. https://doi.org/10.3390/su131810119
APA StyleCho, K., Chae, C.-U., Cho, D., & Kim, T. (2021). Changes in Fan Energy Consumption According to Filters Installed in Residential Heat Recovery Ventilators in Korea. Sustainability, 13(18), 10119. https://doi.org/10.3390/su131810119