Article

Research on Evaluation of Climate Comfort in Northwest China under Climate Change

1
College of Geography and Environmental Science, Northwest Normal University, Lanzhou 730070, China
2
Key Laboratory of Resource Environment and Sustainable Development of Oasis, College of Geography and Environmental Science, Northwest Normal University, Lanzhou 730070, China
*
Author to whom correspondence should be addressed.
Sustainability 2021, 13(18), 10111; https://doi.org/10.3390/su131810111
Submission received: 25 July 2021 / Revised: 1 September 2021 / Accepted: 6 September 2021 / Published: 9 September 2021

Abstract

:
Based on the monthly observation data of major surface meteorological observatories in Northwest China from 1960 to 2019, this paper uses the temperature and humidity index (THI), wind efficiency index (WEI), and clothing index (ICL) to construct a comprehensive climate comfort index evaluation model. This model was used to quantitatively evaluate the change characteristics of climate comfort in Northwest China against the background of climate warming. The results show that the overall climate comfort index in Northwest China is on the rise. In terms of space, an increase in the climate comfort index means an increase in the comfort zone, with the largest increase in the southeastern part of Gansu Province and the southern part of Shaanxi Province. The trend of change is that the increase in the north is greater than that in the south, and the higher the latitude, the greater the change. The space range of the comfort zone and the sub-comfort zone is generally expanding, and the climate is gradually becoming more comfortable. In terms of time, an increase in the climate comfort index means an increase in the climate comfort period, and the annual comfort index shows an increasing trend. The comfort period is mostly distributed in summer, with the most suitable cities in May and September, followed by June.

1. Introduction

Climatic comfort refers to the climatic conditions under which people can ensure the normal progress of physiological processes without resorting to any cold and heat-relief measures [1]. It is used to evaluate the comfort state of the human body under different climatic conditions from the perspective of meteorology. A bio-meteorological index is based on the heat exchange between the atmospheric environment, which reflects the human body’s awareness of the degree of satisfaction with the thermal environment [2]. At the same time, it is also an important factor to measure the impact of climate change on tourism activities and human settlements [3]. The difference in climatic comfort in different regions directly leads to the length and seasonal distribution of the regional climatic comfort period, which is of decisive significance for the attractiveness of regional tourist destinations and the development of regional tourism.
Foreign scholars started early in the study of climate comfort. In the 1920s, Houghthon and Yaglou [4] determined the iso-comfort line of naked men with two variables including temperature and humidity and proposed an effective temperature index with far-reaching influence. Burton et al. systematically described the effect of temperature and humidity on comfort [5]. Subsequently, Thom [6] and Terjung [7] successively proposed discomfort index, comfort index, and wind efficiency index, which enriched the theoretical research on climate comfort. Since then, research related to climate comfort has begun to develop and gradually build various climate comfort indexes and evaluation models such as temperature and humidity index, wind efficiency index, clothing index, etc. Oliver [8] proposed and established a temperature–humidity index and a wind–cold index scale, created applied climatology, and research related to climate comfort gradually became mature. Research on the relationship between climate change and tourism is also comprehensive, focusing on the impact of climate on tourism demand [9], the impact of temperature on tourist demand [10], and climate influences on tourism destinations [11] and other aspects.
Domestic research on tourism climate started relatively late, but the development progress is relatively fast. Most of the early studies on tourism climate in China focused on the evaluation of tourism climate resources [12,13,14,15], and later studies combined comprehensive analysis of tourism development [16,17]. After more in-depth research, it is found that it is more scientific and convenient to use various meteorological factors to evaluate tourism climate. Therefore, after Zhang Jianguang and Feng Yunfei introduced the concept of “agreeableness” [18], research on tourism climate comfort has developed rapidly in China [19,20,21,22]. After entering the 21st century, research on climate comfort is no longer limited to a single scenic spot or city, but a comprehensive evaluation from a large spatial scale [23,24,25,26,27]. With the introduction of geographic information technology and fuzzy evaluation methods, climate comfort evaluation has gradually developed in the direction of accuracy [28,29,30,31]. In addition, some scholars have researched the impact of climate comfort changes on tourist flow [22,32,33], all of which have achieved a series of results.
The Intergovernmental Panel on Climate Change (IPCC) Fifth Assessment Report pointed out that the global temperature has increased substantially since 1951 [34], and under the simulated scenarios of different emission concentrations, the future temperature will continue to rise [35]. Global warming has become an indisputable fact and has formed a differential regional climate response [36], which objectively causes climate comfort and comfort period to have different characteristics in different regions, and to a certain extent, it affects the quantity and quality of tourism resources, leading to changes in the flow and direction of tourism activities [
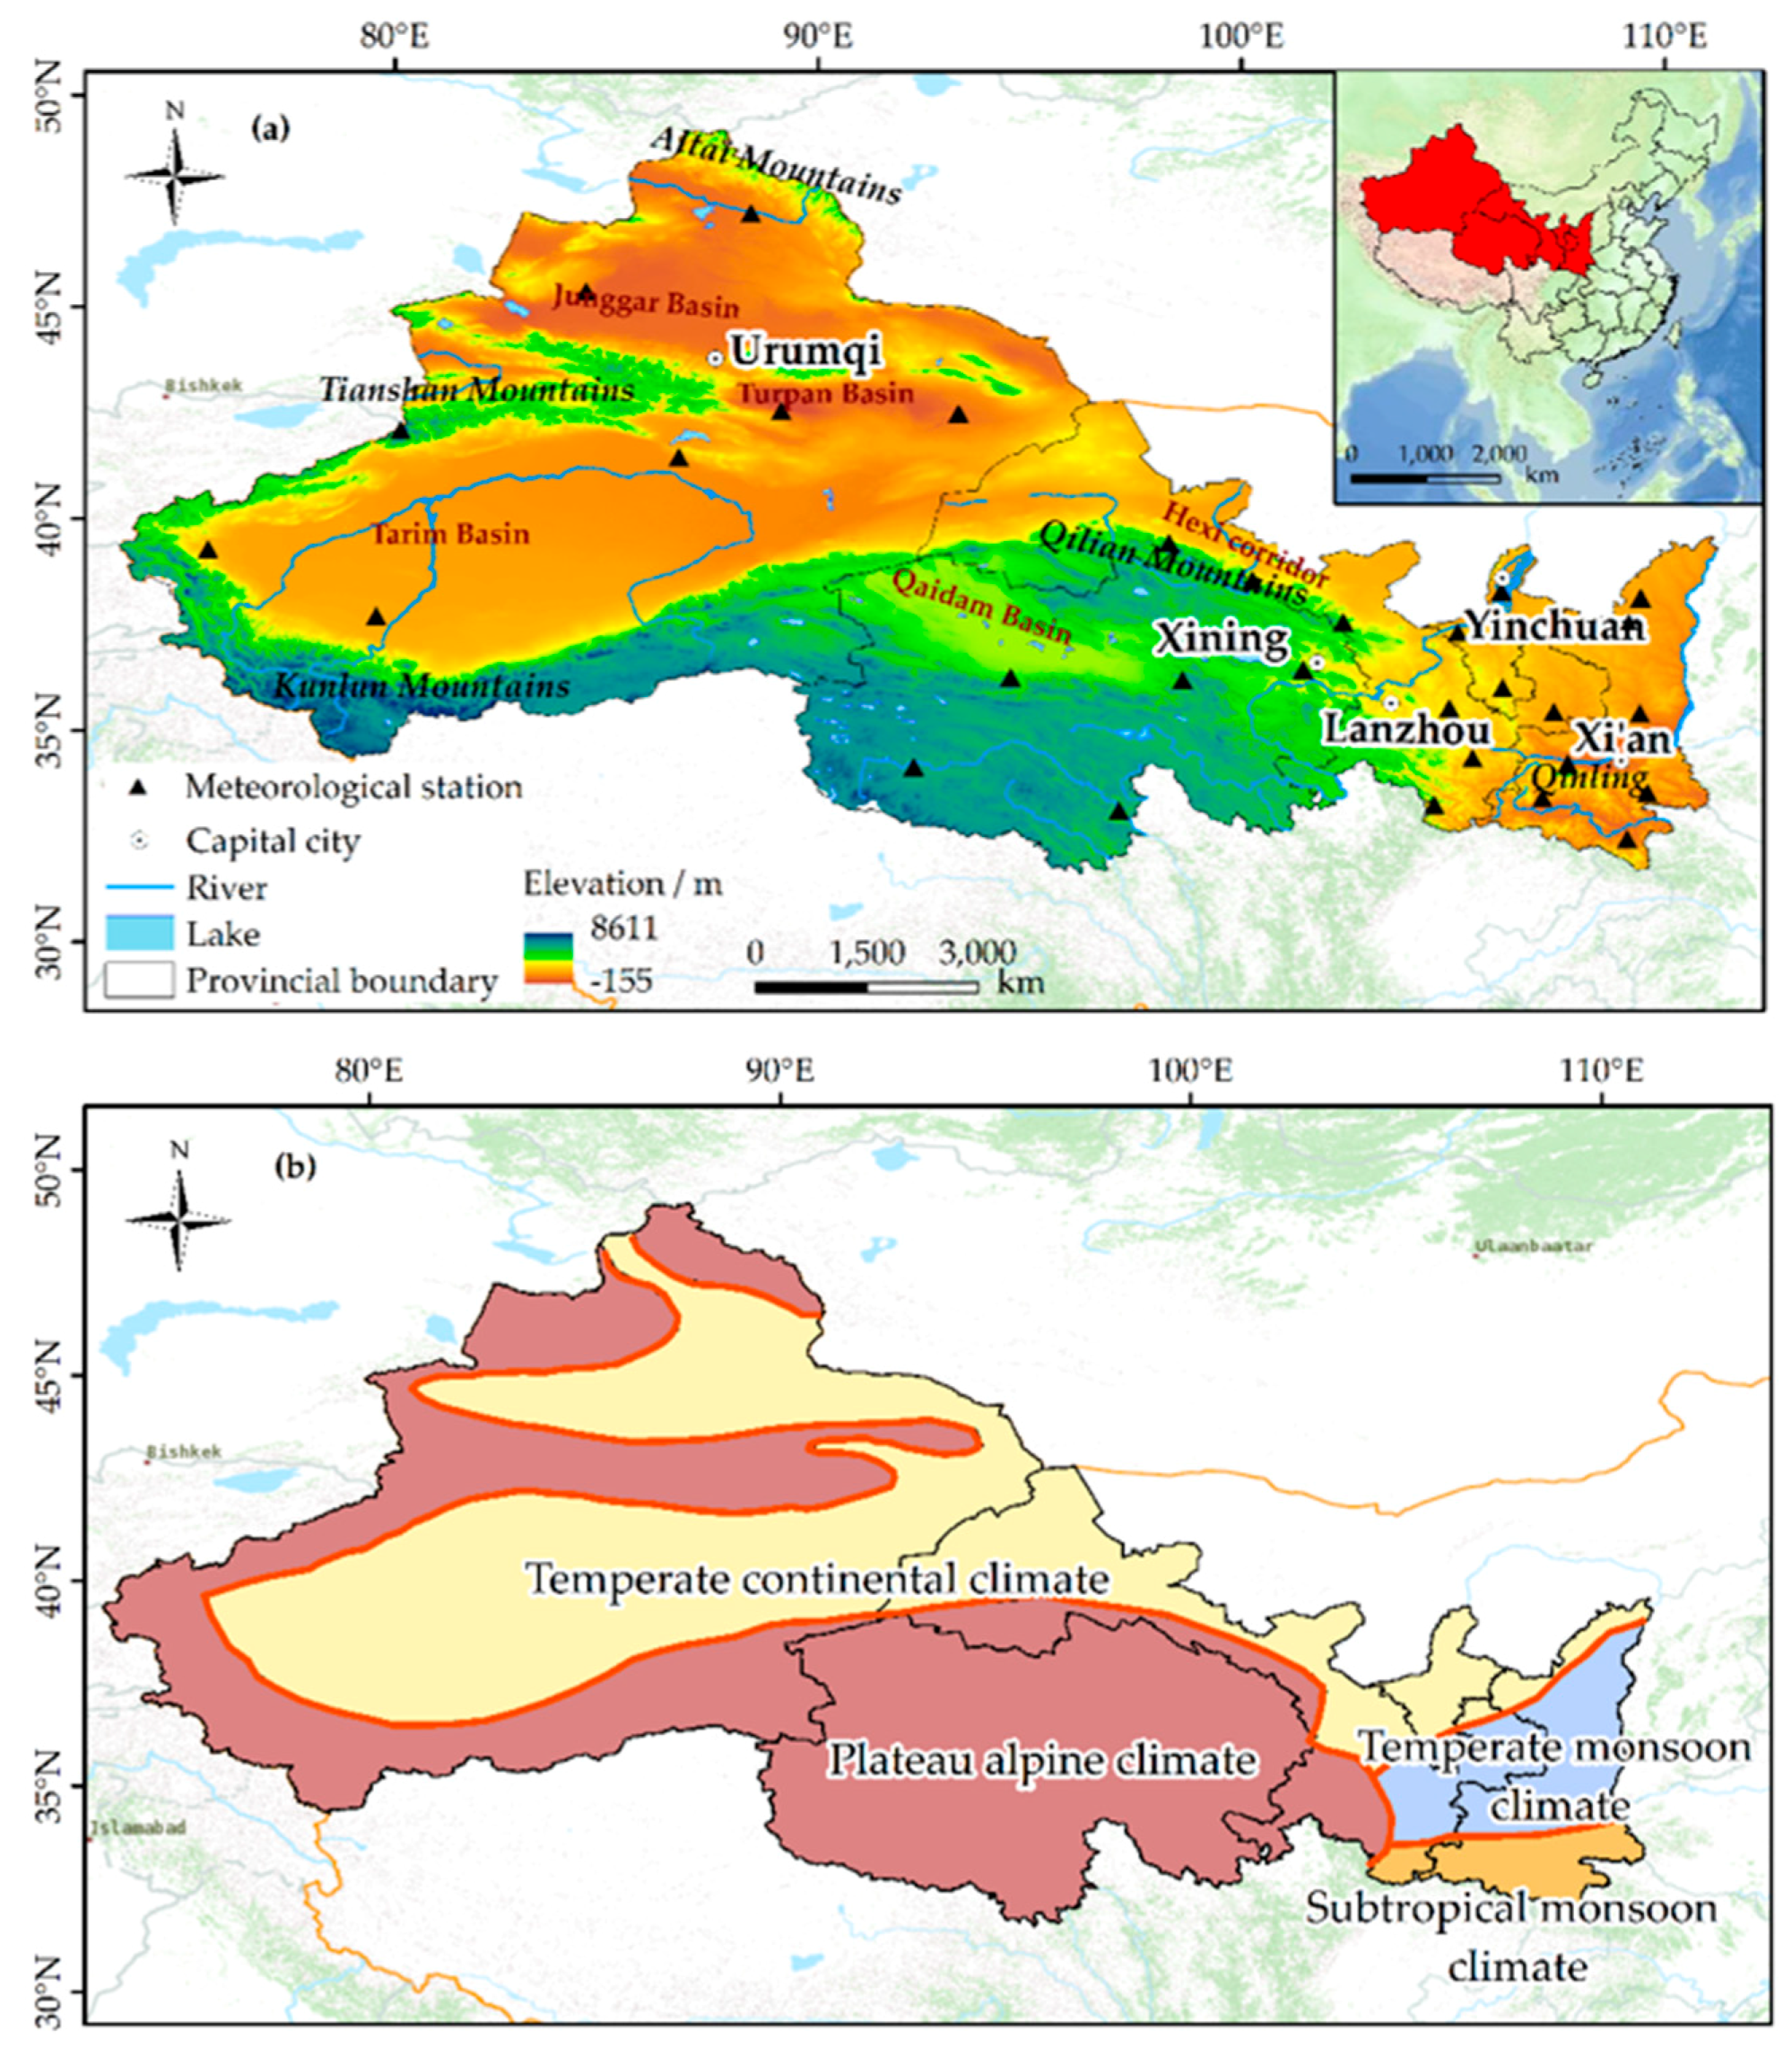
37]. Northwest China has a vast territory, a large east–west span, and complex and diverse underlying surface conditions. Therefore, regional differences in climate change are particularly prominent, and the degree of impact on different regions is not the same [38,39]. Research on climate comfort in the Northwest has only gradually started in the past 10 years [40,41,42,43]. As an important part of the Silk Road, the northwestern region is rich in natural landforms, diverse ethnic customs, and cultures, and tourism resources are cross-cutting and similar, but each has its characteristics. Therefore, the development of tourism has obvious advantages. With the further warming of the global climate, the study of tourism climate comfort should receive more and more attention and become one of the important contents of human settlement environment climate assessment and tourism climate resource evaluation.
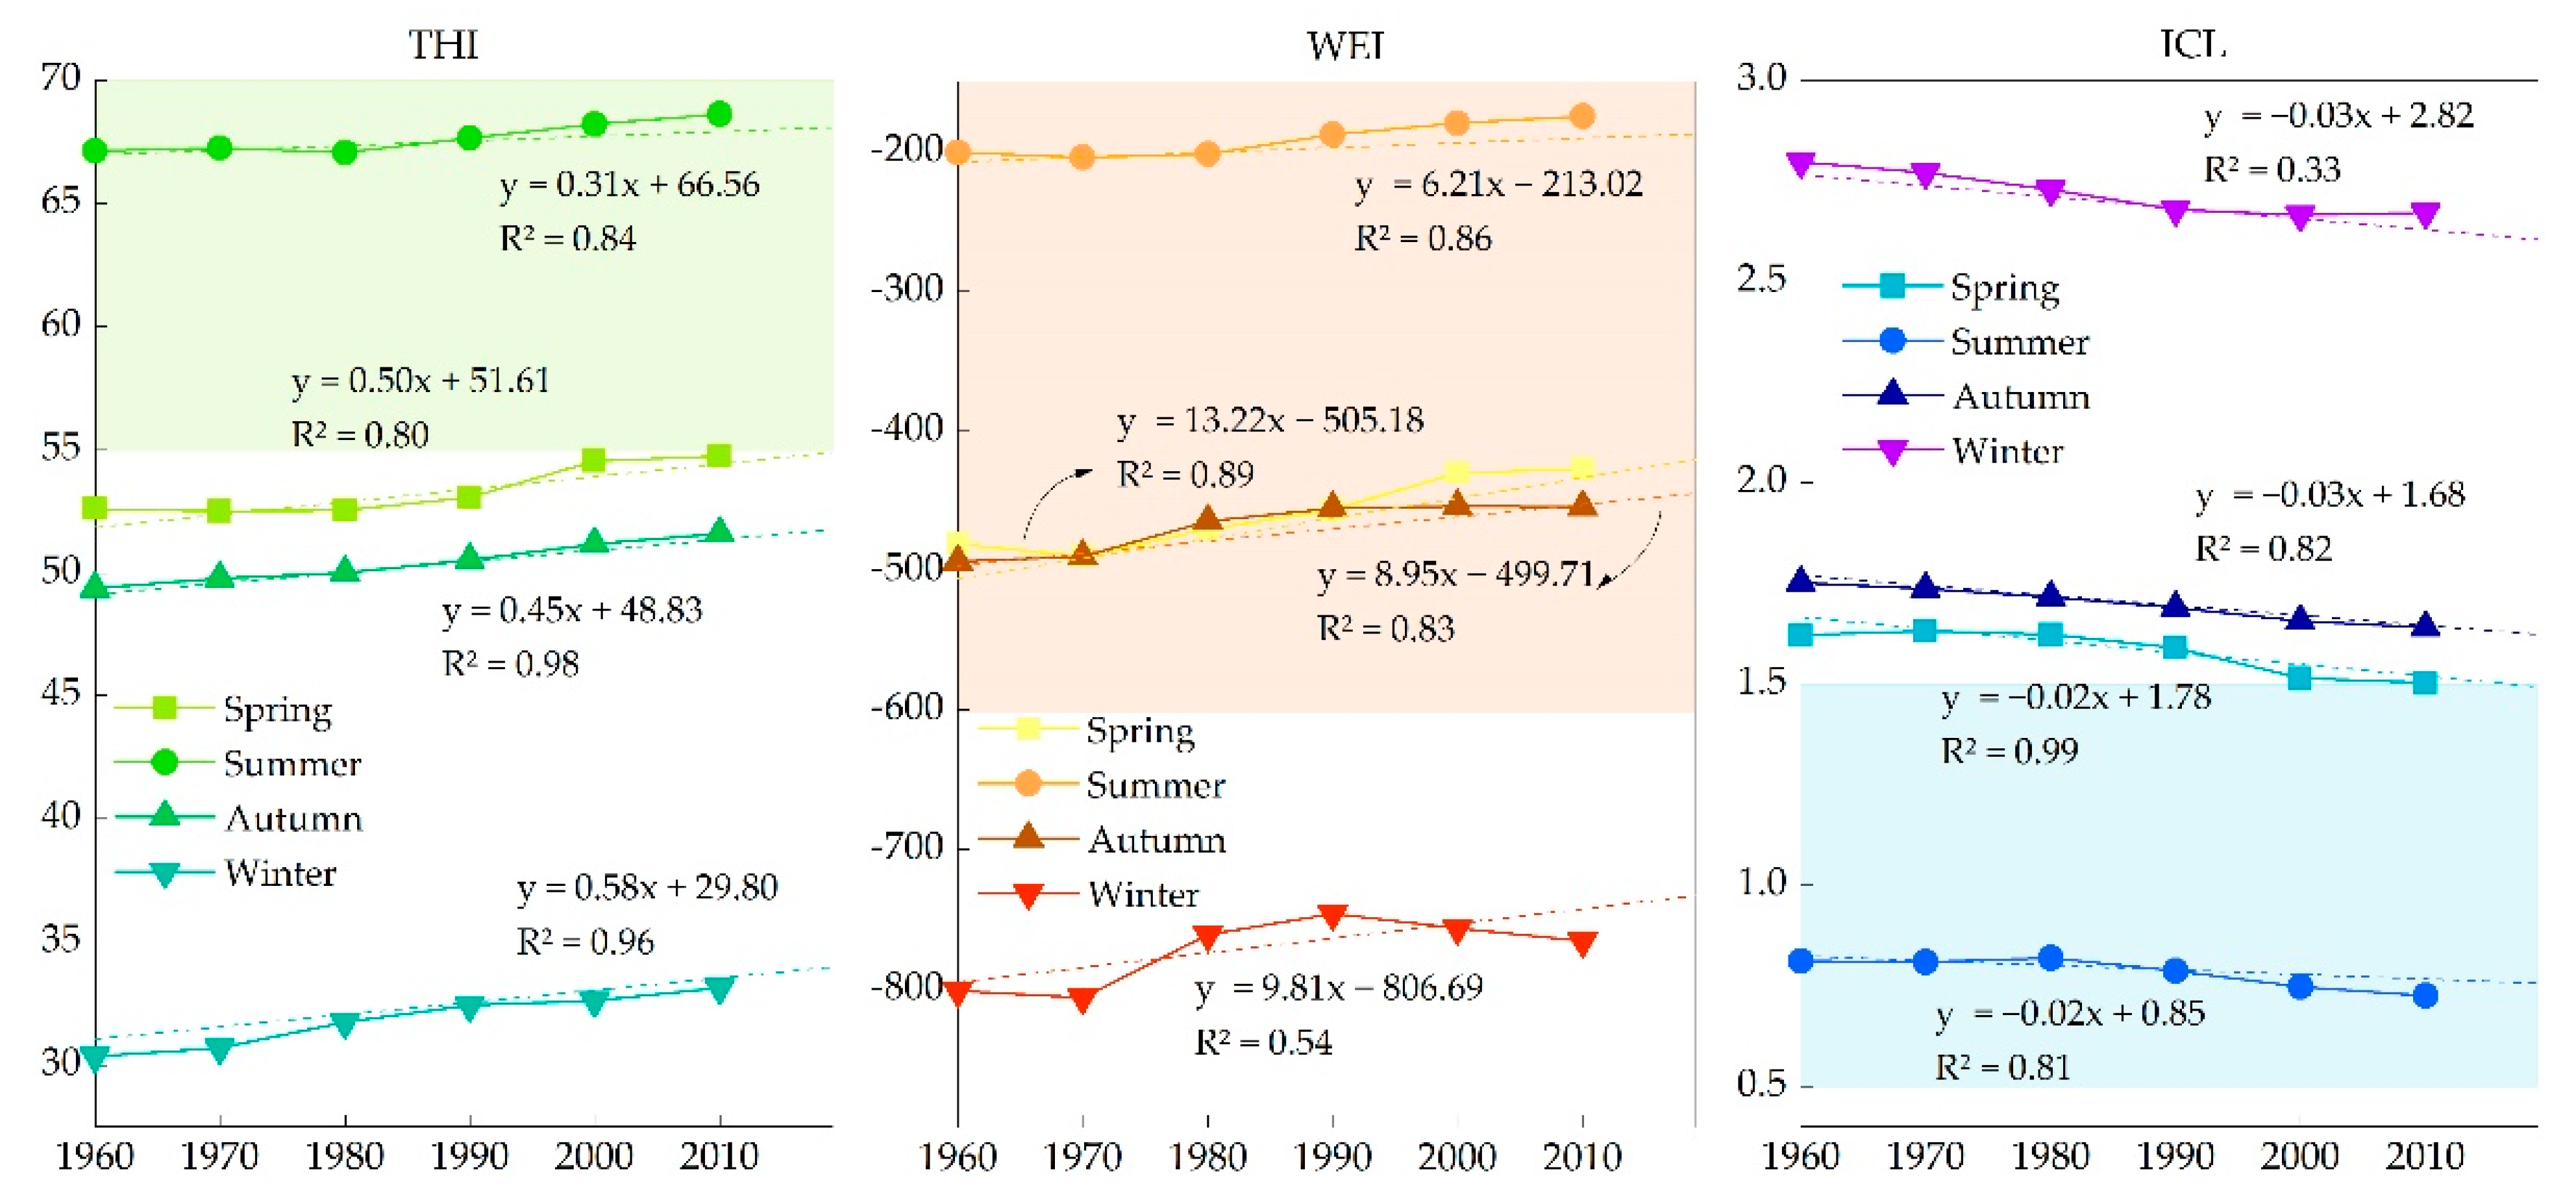
However, the current research on climate comfort in the Northwest is mostly for a single city or a single province, and there are few studies on the comfort of the entire Northwest (including Shaanxi, Gansu, Ningxia, Qinghai, and Xinjiang). Furthermore, there is a relative lack of long-time scale (60 years) studies on, and regular analysis of, changing climate comfort characteristics. Especially since the 1950s, against the background of global warming and the accelerating trend of warming, the climate comfort period in Northwest China is bound to change to varying degrees, which will have an important impact on the human settlement environment and tourism resources in the future. Based on this, this article builds a comprehensive climate comfort index based on 60 years of climate statistics, using temperature and humidity index (THI), wind efficiency index, (WEI), and clothing index (CCI). This paper systematically analyzes the spatiotemporal evolution of the 60-year tourism climate comfort of 30 representative cities in Northwest China against the background of climate warming. The paper calculates the statistical comfort period distribution through hierarchical assignment and weighting, and uses kriging spatial interpolation and spatial clustering to deeply study the change types and trends of the climate comfort index. It further analyzes the characteristics of the spatial range changes of different comfort levels against the background of climate change, in order to explore the best travel time in each region. This reveals the differences in the temporal and spatial distribution of climate comfort in different regions in the study area, so as to provide a theoretical basis for the rational development of tourism climate resources.

2. Data Sources and Research Methods

2.1. Data Source

The meteorological data in this article come from the China Meteorological Data Network (https://data.cma.cn/), which mainly includes the monthly average temperature, relative humidity, and average wind speed of major tourist cities in Northwest China from 1960 to 2019. The 30 ground meteorological observation stations in the northwestern region were selected according to the principles of urban tourism scale, climate representativeness, tourism representativeness, and spatial dispersion. The distribution of research areas and stations is shown in Figure 1a, and Figure 1b shows the division of climate types in Northwest China. The four seasons are divided into spring from March to May, summer from June to August, autumn from September to November, and winter from December to February.

2.2. Research Methods

2.2.1. Evaluation Index of Climate Comfort

Based on previous studies [30,42,44,45], this paper selects three general indexes in the evaluation index of tourism climate comfort, including temperature and humidity index (THI), wind efficiency index (WEI), and clothing index (ICL), as follows:
  • Temperature and humidity index (THI). This indicator reflects the heat exchange between the human body and the surrounding environment through the combination of temperature and humidity [40]. The value of THI can be compared with the corresponding human body experience, as shown in Table 1. The calculation formula is:
    T H I = ( 1.8 t + 32 ) 0.55 ( 1 f ) ( 1.8 t 26 )
    where THI is the temperature and humidity index; t is the temperature in Celsius (°C); f is the relative humidity (%).
  • Wind efficiency index (WEI). It refers to the influence of wind speed and air temperature on the heat loss of the naked human body. It considers the heat dissipation of the body surface and the heat gain of the human body after solar radiation. Its physical meaning refers to the amount of heat exchange per unit area of the body surface when the skin temperature is 33 °C (positive value is heat absorption, a negative value is heat dissipation) [45,46]. The value of WEI can be compared with the corresponding human body experience, as shown in Table 2. The calculation formula is:
    W E I = ( 10 V + 10.45 V ) ( 33 t ) + 8.55 S
    where WEI is the wind chill index; V is the wind speed (m/s); t is the temperature in Celsius (°C); S is the sunshine hours (h/d).
  • Clothing index (ICL). The above two models only consider the impact of climatic factors on the naked skin of the human body, but in some cases the human body can change the discomfort caused by the climate through clothing [22]. The standard model for calculating the ICL was proposed by Australian scholar Freitas [47]. This model has been widely used in practical research. The value of ICL can be compared with the corresponding clothing, as shown in Table 3. The calculation formula is:
    I C L = 33 t 0.155 H H + a   R cos α ( 0.62 + 19 V ) H
    where ICL is the clothing index; t is the temperature in Celsius (°C); H is 75% of the human body’s metabolic rate (W/m2), the human body’s metabolic rate under light activity is 116 W/m2, and the value used in this paper is 87 W/m2; a is the human body’s absorption of solar radiation, which is related to the body’s posture, clothing albedo, and the sun’s direct radiation, scattering and reflection. The value in this paper is 0.06, which corresponds to black clothing; R is the solar radiation received by a unit area of land with vertical sunlight, generally taking the solar constant R = 1367 W/m2 [31]; α is the solar altitude angle. This article uses the average conditions of various regions, assuming that the latitude is β, and the altitude angle of the sun in summer is 90 − β + 23°26′, the height of the sun is 90 − β − 23°26′ in winter. The sun is located near the equator in spring and autumn, and the average solar height is 90 − β; V is the average wind speed at a height of 2 m from the ground, the unit is m/s.
Starting from the three most important factors affecting climate comfort, this article first calculated the THI, WEI, and ICL of each station, and conducted a qualitative analysis of the tourism climate comfort of each city. Taking the CCI as the basic reference condition for the classification of comfort levels, five levels are divided according to the temperature and humidity index, wind efficiency index, and clothing index, which are the most suitable, suitable, less suitable, unsuitable, and extremely unsuitable, respectively. To quantitatively evaluate the comfort of tourism climate, 1, 3, 5, 7, and 9 are used to assign values to provide a basis for the quantitative analysis and comparison of various factors and the use of exponential weighting to comprehensively evaluate the comfort of tourism climate.

2.2.2. Comprehensive Climate Comfort Index (CCI)

To comprehensively reflect the above three indicators, they are converted into relative human feelings. Based on the THI, WEI, and ICL, the above indexes are assigned corresponding grades; finally, the CCI is calculated according to the weights [1]. The calculation formula is:
CCI = 0.6 X T H I + 0.3 X W E I + 0.1 X I C L
where CCI is the comprehensive climate comfort index; XTHI, XWEI, and XICL are graded assignments of THI, WEI, and ICL respectively. In order to quantitatively evaluate the comfort of tourism climate, the values of 9, 7, 5, 3, and 1 are respectively used to reflect its comfort level. The weight coefficients of each index are 0.6, 0.3, and 0.1. Based on Ma Lijun et al.’s climate comfort classification standards and symbol [1], we stipulate, as shown in Table 4, that the higher the value, the higher the climate comfort level.

2.2.3. Kriging Spatial Interpolation Method

To study the distribution characteristics of tourism climate comfort in Northwest China, this paper uses ArcGIS 10.4 software for spatial interpolation. Among various spatial interpolation methods, the advantage of kriging interpolation is the ability to fully consider the spatial correlation of known data points. Among them, co-kriging can consider the influence of terrain factors such as elevation, and the accuracy is relatively high [48]. Therefore, this paper chooses to use the co-kriging interpolation method to interpolate the climate comfort index using the elevation data of the study area sites to obtain the spatial distribution of climate comfort in the northwest region to characterize the distribution characteristics of climate comfort in the northwest region.

3. Results and Analysis

3.1. Variation Characteristics of THI, WEI, and ICL

3.1.1. Annual Scale Change

Table 5 shows the annual scale change characteristics of the THI, WEI, and ICL in the Northwest region in the past 60 years. The THI and WEI have shown an increasing trend, while the ICL has shown a decreasing trend. The THI varies from 49.94 to 51.74, with an increasing trend of 4.05/10a. The cyclical trend takes 1989 as the demarcation point, and the THI fluctuated at an average of 49.96. After 1989, the rate of increase was relatively large, and although the human body still feels that it is in the range of “cold, sub-uncomfortable”, the increase is more obvious. The change range of the WEI varies from −501.43 to −469.87, and the increasing trend is 93.10/10a. The cyclical trend takes 1999 as the demarcation point, the increase rate was faster before this, and the increase rate was slightly slower after 1999. The WEI is currently in the “cool wind, sub-uncomfortable” range, and this kind of slightly cold feeling is decreasing; the human body’s perception of cold is more obvious. The changing trend of the ICL is relatively stable, from 1.75 in 1960 to 1.65 in 2019, with a decreasing trend of 0.23/10a. The appropriate clothing is common winter casual wear, which is in the “sub-discomfort” range. However, the decreasing trend of the ICL shows that the thickness of people’s clothes is gradually decreasing, which indirectly indicates that the temperature in the northwestern region has shown an upward trend in the past 60 years.

3.1.2. Seasonal Scale Changes

Figure 2 shows the seasonal variation characteristics of the THI, WEI, and ICL in Northwest China in the past 60 years. It can be seen that the annual difference of a single index is large. The index values of spring and autumn are relatively close, while the index values of summer and winter are quite different. Among them, THI and ICL are comfortable values in summer, and WEI is comfortable values in spring, summer, and autumn. According to the calculation of the monthly average value in Table 3, the average values of THI, WEI, and ICL in spring are 53.36, −463.48, and 1.58. The human body feels slightly cold (sub-uncomfortable) and cool wind (sub-comfort), appropriate to wear as common winter clothes (sub-uncomfortable). The average values of the three indexes in summer are 67.53, −197.36, and 0.79. The human body feels warm (sub-comfort) and warm wind (sub-comfort), suitable for wearing shirts and casual clothes (comfort). The average value of the three indexes in autumn is 50.44, −470.66, and 1.70. The human body feels slightly cold (sub-uncomfortable), cool wind (sub-comfortable), and it is necessary to wear common winter clothing (sub-uncomfortable). The average values of the three indexes in winter are 32.52, −764.11, and 2.69. The human body feels extremely cold (very uncomfortable), has slightly cold wind (sub-uncomfortable), and needs to wear a down jacket or fur sweater products (very uncomfortable).
THI is increasing year by year, with the largest in summer and the smallest in winter, with large differences between months. The increasing trend in spring is the largest, which is 5.10/10a. Obviously, climate change has a greater impact on spring, which also shows that temperature and relative humidity in spring are increasing year by year. The WEI varies greatly during the study period and shows an increasing trend year by year. Therefore, the difference in the perception of wind chill by the human body is also large. The increasing trend in spring is the most significant, which is 142.52/10a, indicating that the temperature and wind speed in spring is gradually increasing. The WEI in summer is the largest, and the WEI in winter is the smallest, but the increasing trend is second only to that in spring, indicating that the temperature and wind speed in winter is increasing year by year, and the wind chill perceived by the human body is decreasing. The ICL is the largest in winter and the smallest in summer. It generally shows a gradual decrease trend. The decreasing trend of the ICL in autumn is significant, which is −0.3/10a, which shows that the weather factors such as temperature, wind speed, and sunshine duration in autumn are also increasing year by year, and the clothing thickness is gradually decreasing.

3.2. Distribution Characteristics of Comprehensive Climate Comfort Index

3.2.1. Distribution Characteristics of the Comprehensive Climate Comfort Index during the Year

The spatial distribution characteristics of the annual variation of the comprehensive climate comfort index in Northwest China are shown in Figure 3. It can be seen from Figure 3 that the CCI (Comprehensive Climate Comfort Index, the same below) fluctuates between 2.48 and 6.47, and the overall rating is “sub-comfortable”. This is due to the vastness of the northwestern region, the complex terrain, and the large differences in human sensations brought about by different regions. Among them, the areas with high CCI are mainly distributed in southeastern Gansu (Wudu) and southern Shaanxi (Ankang and Shangxian), with comfort values ranging from 5.93 to 6.47, which belong to the “sub-comfortable” level. The area belongs to the temperate monsoon climate. The factors affecting the comfort index of this area may be caused by the extremely hot weather in summer, which makes people feel extremely hot. Appropriate cooling and summer sheltering methods can help improve human comfort. The CCI of Hami and Kashgar in Xinjiang and Baoji and Hanzhong in Shaanxi is the second place, with a comfort value ranging from 5.60 to 5.70, which belongs to the “sub-comfortable” level. In terms of average level, the climate in the above two regions is more suitable throughout the year, which is suitable for the comprehensive development and utilization of people’s living and tourism resources. The relatively low CCI in Hezuo, Yushu, and Tuotuohe areas may be due to the high altitude, relatively low annual average temperature, and the human body feeling extremely cold. Suitable warmth and cold protection help improve human comfort.

3.2.2. Seasonal Characteristics of Comprehensive Climate Comfort Index

Figure 4 shows the spatial distribution characteristics of the seasonal variation of the Comprehensive Climate Comfort Index (CCI) in Northwest China. It can be seen from Figure 4 that the spatial distribution characteristics of the CCI in different seasons are generally similar. In spring and autumn, the comfort index in the east and west is higher than that in the central region, and in winter and summer, the comfort index in the east is higher than that in the west.
The spring CCI (Figure 4a) varies from 2.07 to 7.60 as a whole. Among them, the western region (Aksu, Hami, and Kashgar) and the southeast region (Shang County, Ankang, Wudu, and Tianshui) have a comfort value of 7.13–7.60, and the human body feels “comfortable”. The Tuotuohe area has the lowest comfort value, only 2.07. The human body feels “uncomfortable”. The reason may be that the area is deep in the hinterland of the Qinghai-Tibet Plateau, the terrain is closed, the weather is changeable, and the temperature is low all year round.
The summer CCI (Figure 4b) varies from 3.53 to 9.00. There are large differences between different regions, but generally speaking, summer “comfort” and “sub-comfort” levels account for the majority, of which high comfort values are concentrated in the eastern region. Central and eastern Gansu (Jiuquan, Zhangye, Wuwei, Yuzhong, Xifeng), Ningxia (Zhongwei, Guyuan), central and eastern Qinghai (Golmud, Xining), and the Altay region of Xinjiang all belong to the “comfort” level, with a range of changes between 7.13 and 9.00. The “sub-comfortable” regions were distributed in Hanzhong, Ankang, Turpan (the lowest comfort value is 3.53), and Tuotuohe. The reason for the “sub-uncomfortable” level in the first three regions may be the high temperature in summer and the warm feeling of the human body. Therefore, it is not suitable to travel, and proper cooling and sheltering methods are particularly important. The Tuotuohe area may be caused by the low average temperature. In addition, there was no “uncomfortable” area in the Northwest in summer.
The autumn CCI varies from 2.07 to 7.13 (Figure 4c). Except for a few areas, it was distributed in a more obvious band. There are three areas with high comfort levels, namely the west, north-central, and southeast regions. Among them, Ankang and Shang counties in the southeast have the largest CCI (7.00–7.13), and the human body feels “comfortable”. The “uncomfortable” areas in autumn were only distributed in the Tuotuohe (2.07). In addition, other areas were classified as “sub-comfortable” or “sub-uncomfortable”, with pleasant weather and suitable for tourism and travel.
The winter CCI (Figure 4d) was generally low, varying between 1.00 and 4.60, and the overall comfort level distribution trend decreases from southeast to northwest. The “sub-comfortable” areas are only distributed in Wudu (5.2), Gansu, and the “sub-uncomfortable” areas are distributed in southern Shaanxi (Baoji, Hanzhong, Shangxian, Ankang). Other areas are in the “uncomfortable” range, and daily cold and frost protection are extremely important.
In summary, the CCI levels in spring, summer, and autumn in Northwest China were basically “sub-comfortable” levels, and the winter CCI is “uncomfortable” levels. In general, the CCI index levels are ranked as summer > spring > autumn > winter. Therefore, it is particularly important to formulate scientific and reasonable travel plans and arrangements for the comfort index of different seasons.

3.3. Variation Types and Trends of Comfort Evaluation Indicators and Climate Comprehensive Comfort Index

According to formula (4), we calculated the THI, WEI, ICL, and CCI of representative cities in Northwest China in 1960 and 2019. Figure 5 shows the spatial change types and trend changes of the comfort evaluation index and the comprehensive comfort index in Northwest China. Taking the difference between two-time points as variables, it was divided into four types using co-kriging interpolation and spatial reclassification methods. A negative difference indicates that the comfort level of the corresponding evaluation index is decreasing, and a positive difference indicates that the comfort level is increasing. Through spatial reclassification, the types of growth or decrease were further divided into three different sub-types: low-speed growth (or decrease), medium-speed growth (or decrease), and high-speed growth (or decrease). The overall performance of CCI shows an increasing trend from south to north (Figure 5a), the comfort index centered on Turpan and Hami is increasing rapidly, and cooperation is decreasing. In addition, there are some cities where the comfort level has not changed significantly. The overall trend of THI (Figure 5b) is increasing from southeast to northwest. Yushu in southeastern Qinghai shows a decreasing trend, while Hotan, Aksu, Karamay, and Turpan in the west and north of Xinjiang are high-growth areas. It was found that these cities are mostly distributed in basins and oasis plains, indicating that topographical factors related to temperature and humidity changes play an important role. Compared with the THI, the WEI has a more obvious band-like distribution (Figure 5c) that gradually increases from the southeast to the northwest. The high-speed growth areas are Altay, Karamay, Aksu, Turpan, and Korla. The medium-speed growth areas are Kashgar, Hotan, and Hami. The areas to the east of Xinjiang are all low-speed growth areas, and the distribution of the reduction area is not obvious. It can be seen that as the latitude increases, the temperature and wind speed also tend to increase. ICL also shows a more obvious strip-like distribution (Figure 5d), showing a trend of decreasing from southeast to northwest, especially in Xinjiang, where people’s clothing thickness gradually decreases. There is no increased area, the reason for which may be related to the increase in temperature and decrease in wind speed.
Through the analysis of the types of changes in the above-mentioned climate comfort evaluation index, we found that the climate comfort in the study area has changed significantly. The comfort of cities near the north increases faster than the southern cities. The higher the latitude, the greater the change and the lower the latitude. The smaller the change, or even no change.

3.4. Distribution of Climatic Comfort Periods and Changes in the Range of Different Comfort Levels

3.4.1. Distribution within the Year of the Climate Comfort Period

Based on the climate comfort classification standard of Ma Lijun et al. [1], we divided the comprehensive climate comfort index into four levels: comfort, sub-comfort, sub-discomfort, and discomfort. The higher the value of the comfort index, the higher the comfort level. Table 6 shows the changes in different climate comfort periods of representative cities in Northwest China from 1960 to 2019. It can be seen from Table 6 that Wudu has a comfortable period of up to 7 months, Hezuo and Yushu have only a comfortable period of one month, and Tuotuohe does not have a comfortable period. The average monthly “comfort period” in the study area is 4.1 months. Each city has a sub-comfort period. Korla and Hotan have a sub-comfort period of 5 months, and the monthly average “sub-comfort period” is 3.2 months. The distribution of sub-discomfort periods in the study area in the past 60 years is relatively small. Most cities have only one month, except Hanzhong and Turpan (5 months). The monthly average “sub-discomfort period” is 1.8 months. In addition, there are no uncomfortable periods in Altay, Karamay, and Hotan. The longest “discomfort period” is the Tuotuohe (7 months), which was mainly caused by the low temperature in winter and the coldness of the human body. Wudu and Ankang have no discomfort period distribution, and the monthly average “discomfort period” is 3.6 months. According to the changes in the comfort index during the year, they were divided into two types. “Summer-friendly” includes 13 cities such as Jiuquan. During the year, the comfort level changes in an inverted “U” shape. “Spring and autumn-friendly” includes 17 cities including Yulin. The city’s comfort level during the year showed an “M” type change, and there was no “winter-friendly” city in the study area.
Take the comprehensive climate comfort as the “comfortable period” and the “comfortable period” as the criteria for suitable travel months for analysis. We found that there were no cities suitable for tourism in the major tourist cities in Northwest China from January to February and November to December (except for some cities in the subtropical monsoon climate zone). There are 29 cities suitable for tourism in May and September. Followed by June, there are 28 cities suitable for tourism. There are 27 cities suitable for tourism in July and August, and 26 cities suitable for tourism in April and October.

3.4.2. Changes in the Range of Climate Comfort Levels

Figure 6 compares the spatial variation range of the annual and seasonal climate comfort levels in Northwest China in 1960 and 2019. The color from light to dark represents the comfort level from low to high. It can be seen from Figure 6 that in the past 60 years, the range of comfort levels in different seasons has changed significantly. On the whole, the range of the comfort zone has become significantly larger, and the range of the discomfort zone has not changed significantly.
Figure 6a,b show the changes in the spatial range of climate comfort levels throughout 1960 and 2019. It can be seen that the comfort zone was only distributed in Ankang in 1960. The range of comfort zones increased significantly in 2019. The newly added comfort zones include Hanzhong, Shangxian, Turpan, and Hami. During the 60 years, the range of the sub-comfort zone expanded to the south and north, respectively, and the range of the sub-discomfort zone was reduced. The discomfort zone only appeared in the Tuotuohe.
Comparing Figure 6c and Figure 6d, it can be found that the range of the comfort zone and the discomfort zone in spring has increased significantly, showing an obvious band-like distribution, and the level changes between regions are quite different. In the spring of 1960, the comfort zone was only distributed in Kashgar in the west and Ankang in the southeast. In the spring of 2019, Hotan, Aksu, and Korla in Xinjiang were added to the comfort zone, and Hanzhong, Baoji, Tongchuan, and Shang counties in the southeast were added. The scope of the sub-comfort zone is shrinking, while the scope of the discomfort zone is expanding northward. The newly added cities are Hezuo and Xining.
Comparing Figure 6e and Figure 6f, the changes between different comfort levels in summer are small, and the boundaries of different comfort levels are clearer. What is certain is that the range of comfort zones is also increasing, mainly in central and eastern Gansu, northeastern Qinghai, most of Ningxia, and northern Shaanxi. The newly added comfort zones include Dulan, Zhongwei, Yinchuan, Tianshui, and Yulin. The range of sub-comfort zone and discomfort zone change is not obvious, and the sub-comfort zone accounts for a relatively large proportion in the study area.
Comparing Figure 6g and Figure 6h, there was no comfort zone distribution in the autumn of 1960, and the comfort zone was only distributed in Ankang in 2019. Overall, the sub-comfort zone accounts for a relatively large proportion, mainly distributed in the plains in the eastern northwest and the oasis plains in Xinjiang. In 2019, the scope of the sub-comfort zone was expanded to Altay, Jiuquan, Zhangye, and Wuwei, and the sub-comfort zone occupies a relatively large area and the area tends to expand northward. Qinghai, southeastern Xinjiang, and southwestern Gansu are sub-discomfort zones, and the discomfort zones were only distributed in Tuotuohe.
Comparing Figure 6i and Figure 6j, the overall comfort level in winter is relatively low, there is no comfort zone and sub-comfort zone distribution, and the discomfort zone in the study area accounts for a relatively large proportion. In the winter of 1960, the less comfortable zones were distributed in Wudu, Tianshui, Hanzhong, Baoji, Ankang, Shangxian, and Tongchuan. In the winter of 2019, Tongchuan became an uncomfortable zone. The scope of the sub-discomfort zone is shrinking, indicating that the climate comfort in winter is declining, and people need to take timely measures to keep out the cold and plan travel plans reasonably.
Generally speaking, the range of “comfort zone” increases in spring and summer, slightly increases in autumn, and there is no comfort zone in winter. The range of comfort zone is spring > summer > full year > autumn; “sub-comfort zone” decreases in spring and summer. In autumn, there is no sub-comfort zone in winter. The range of sub-comfort zone is autumn > summer > all year > spring; “sub-discomfort zone” increases in spring, but decreases in autumn and winter, and there is no sub-discomfort zone in summer. It is the whole year > autumn > spring > winter; the “uncomfortable zone” does not change significantly in autumn and winter, but the increasing trend is significant in spring. The range of discomfort zone is arranged in winter > spring > summer.

4. Discussion

With the acceleration of urbanization and global warming, the climatic comfort of the human living environment has undergone major changes, and there are differences in regional temporal and spatial characteristics [49,50,
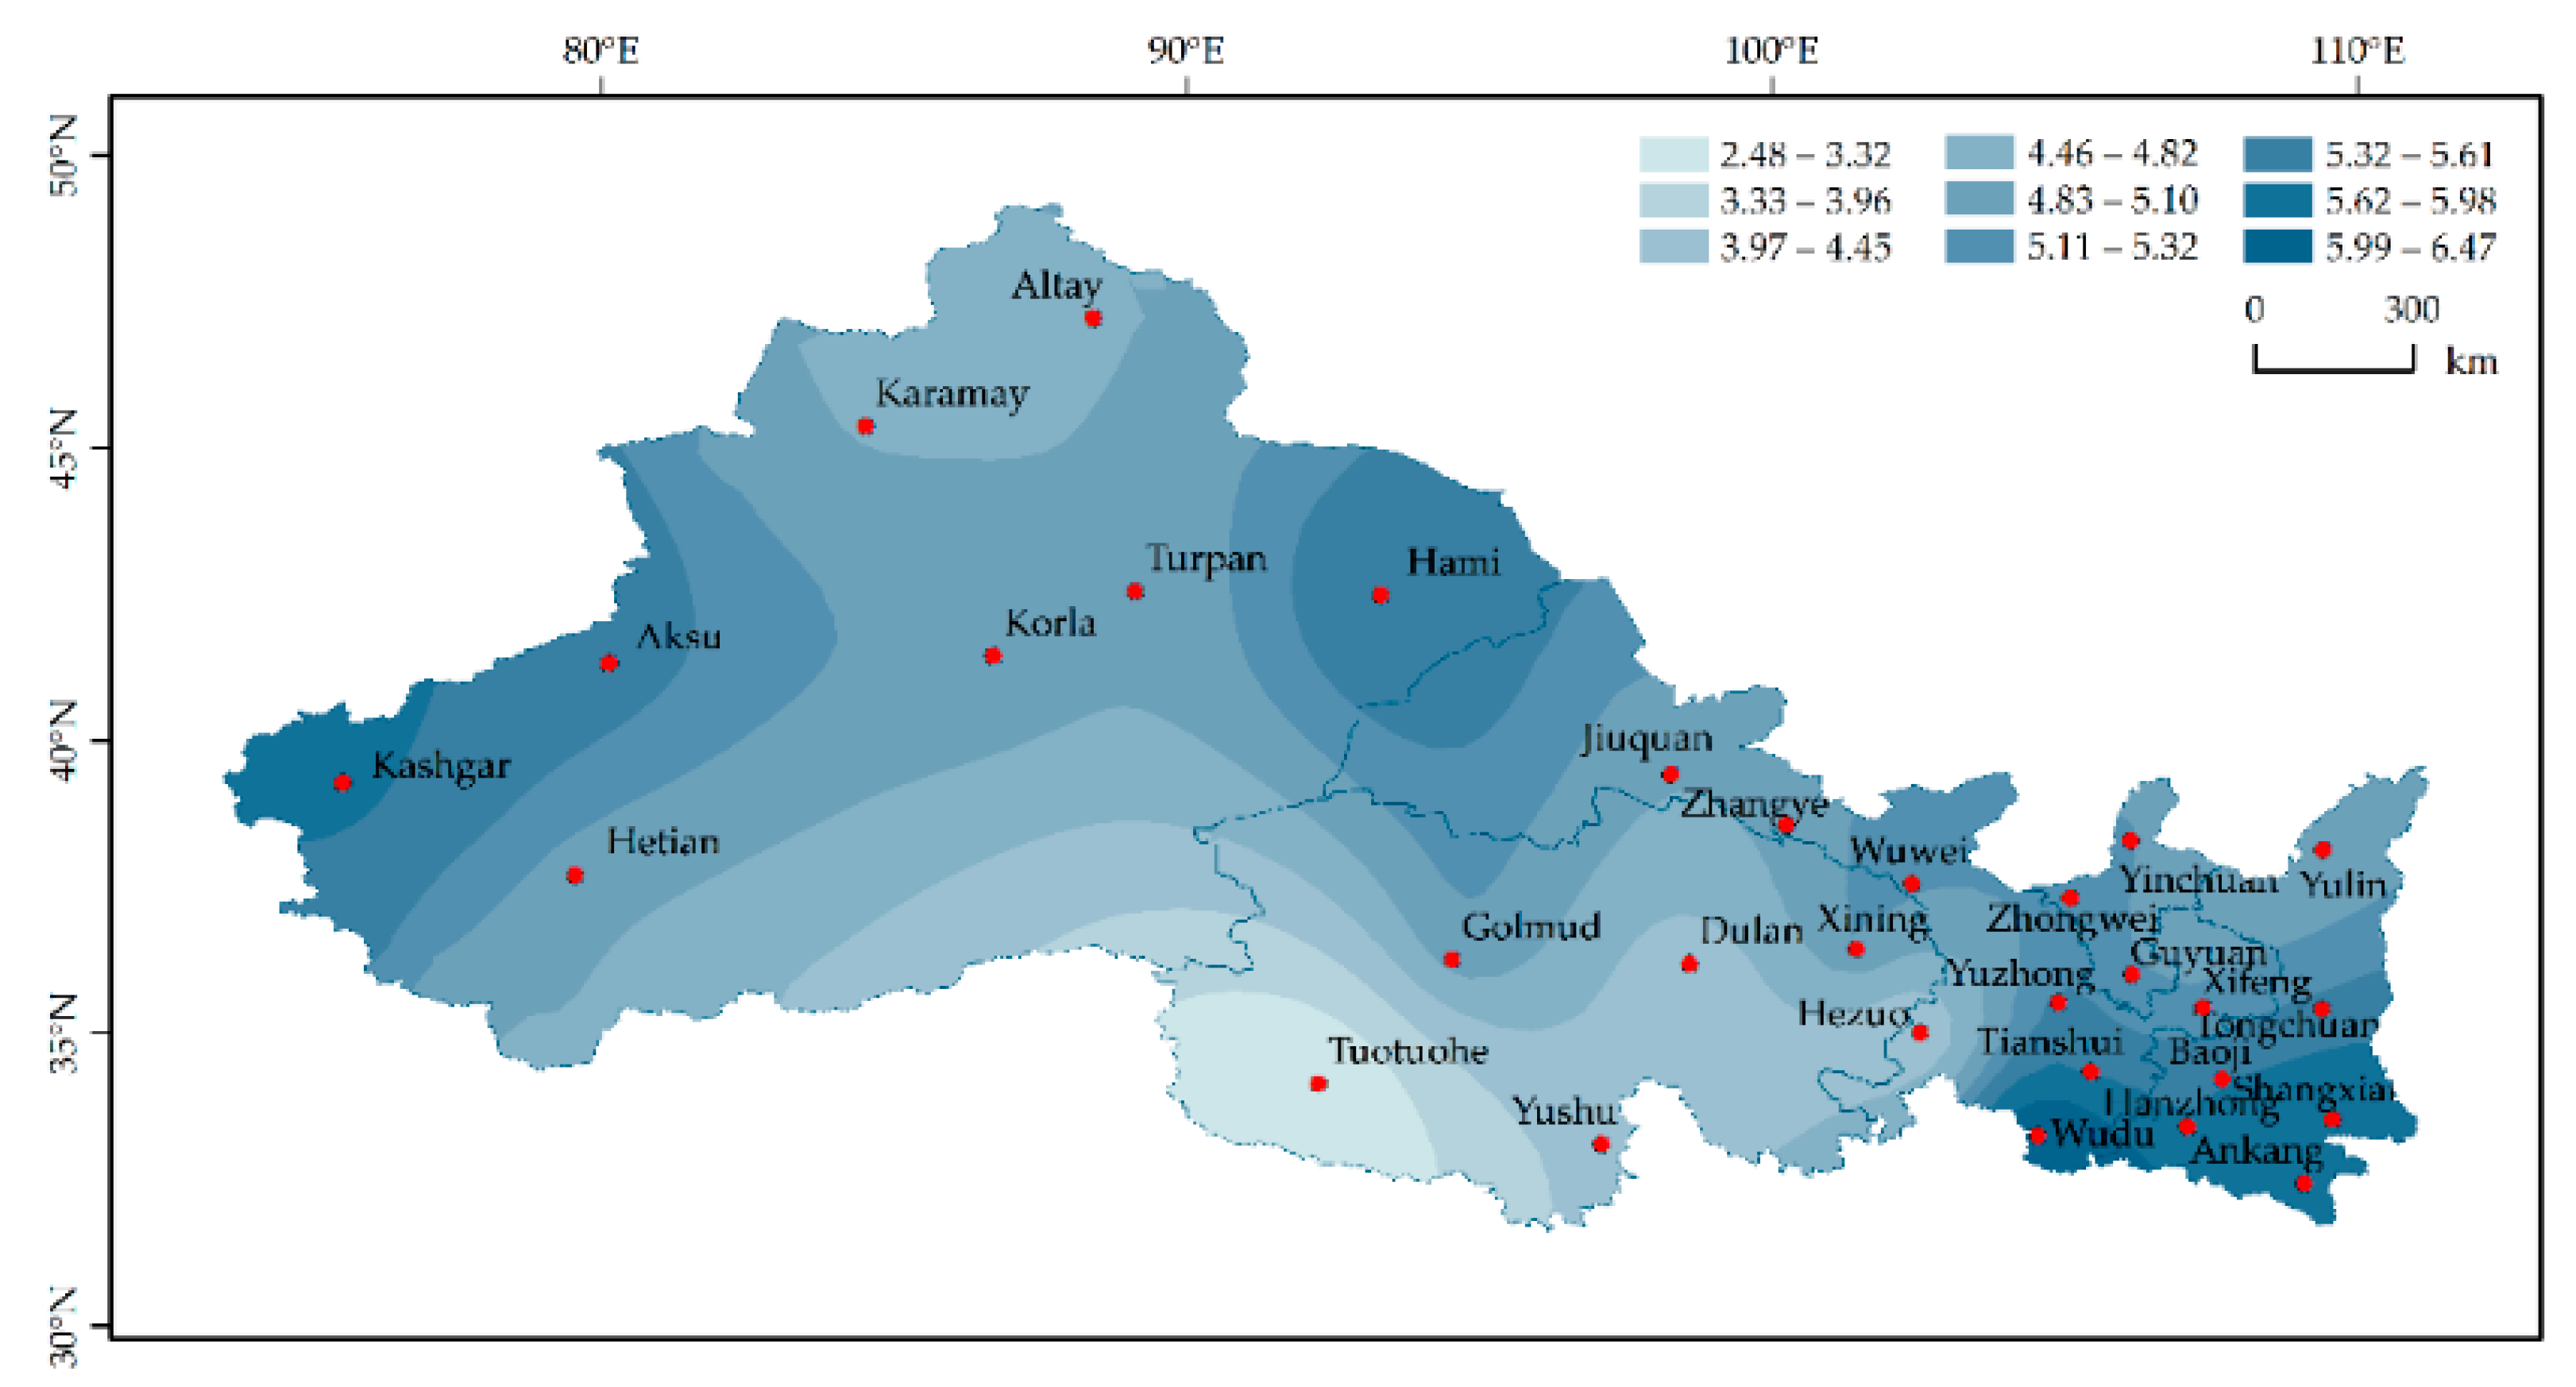
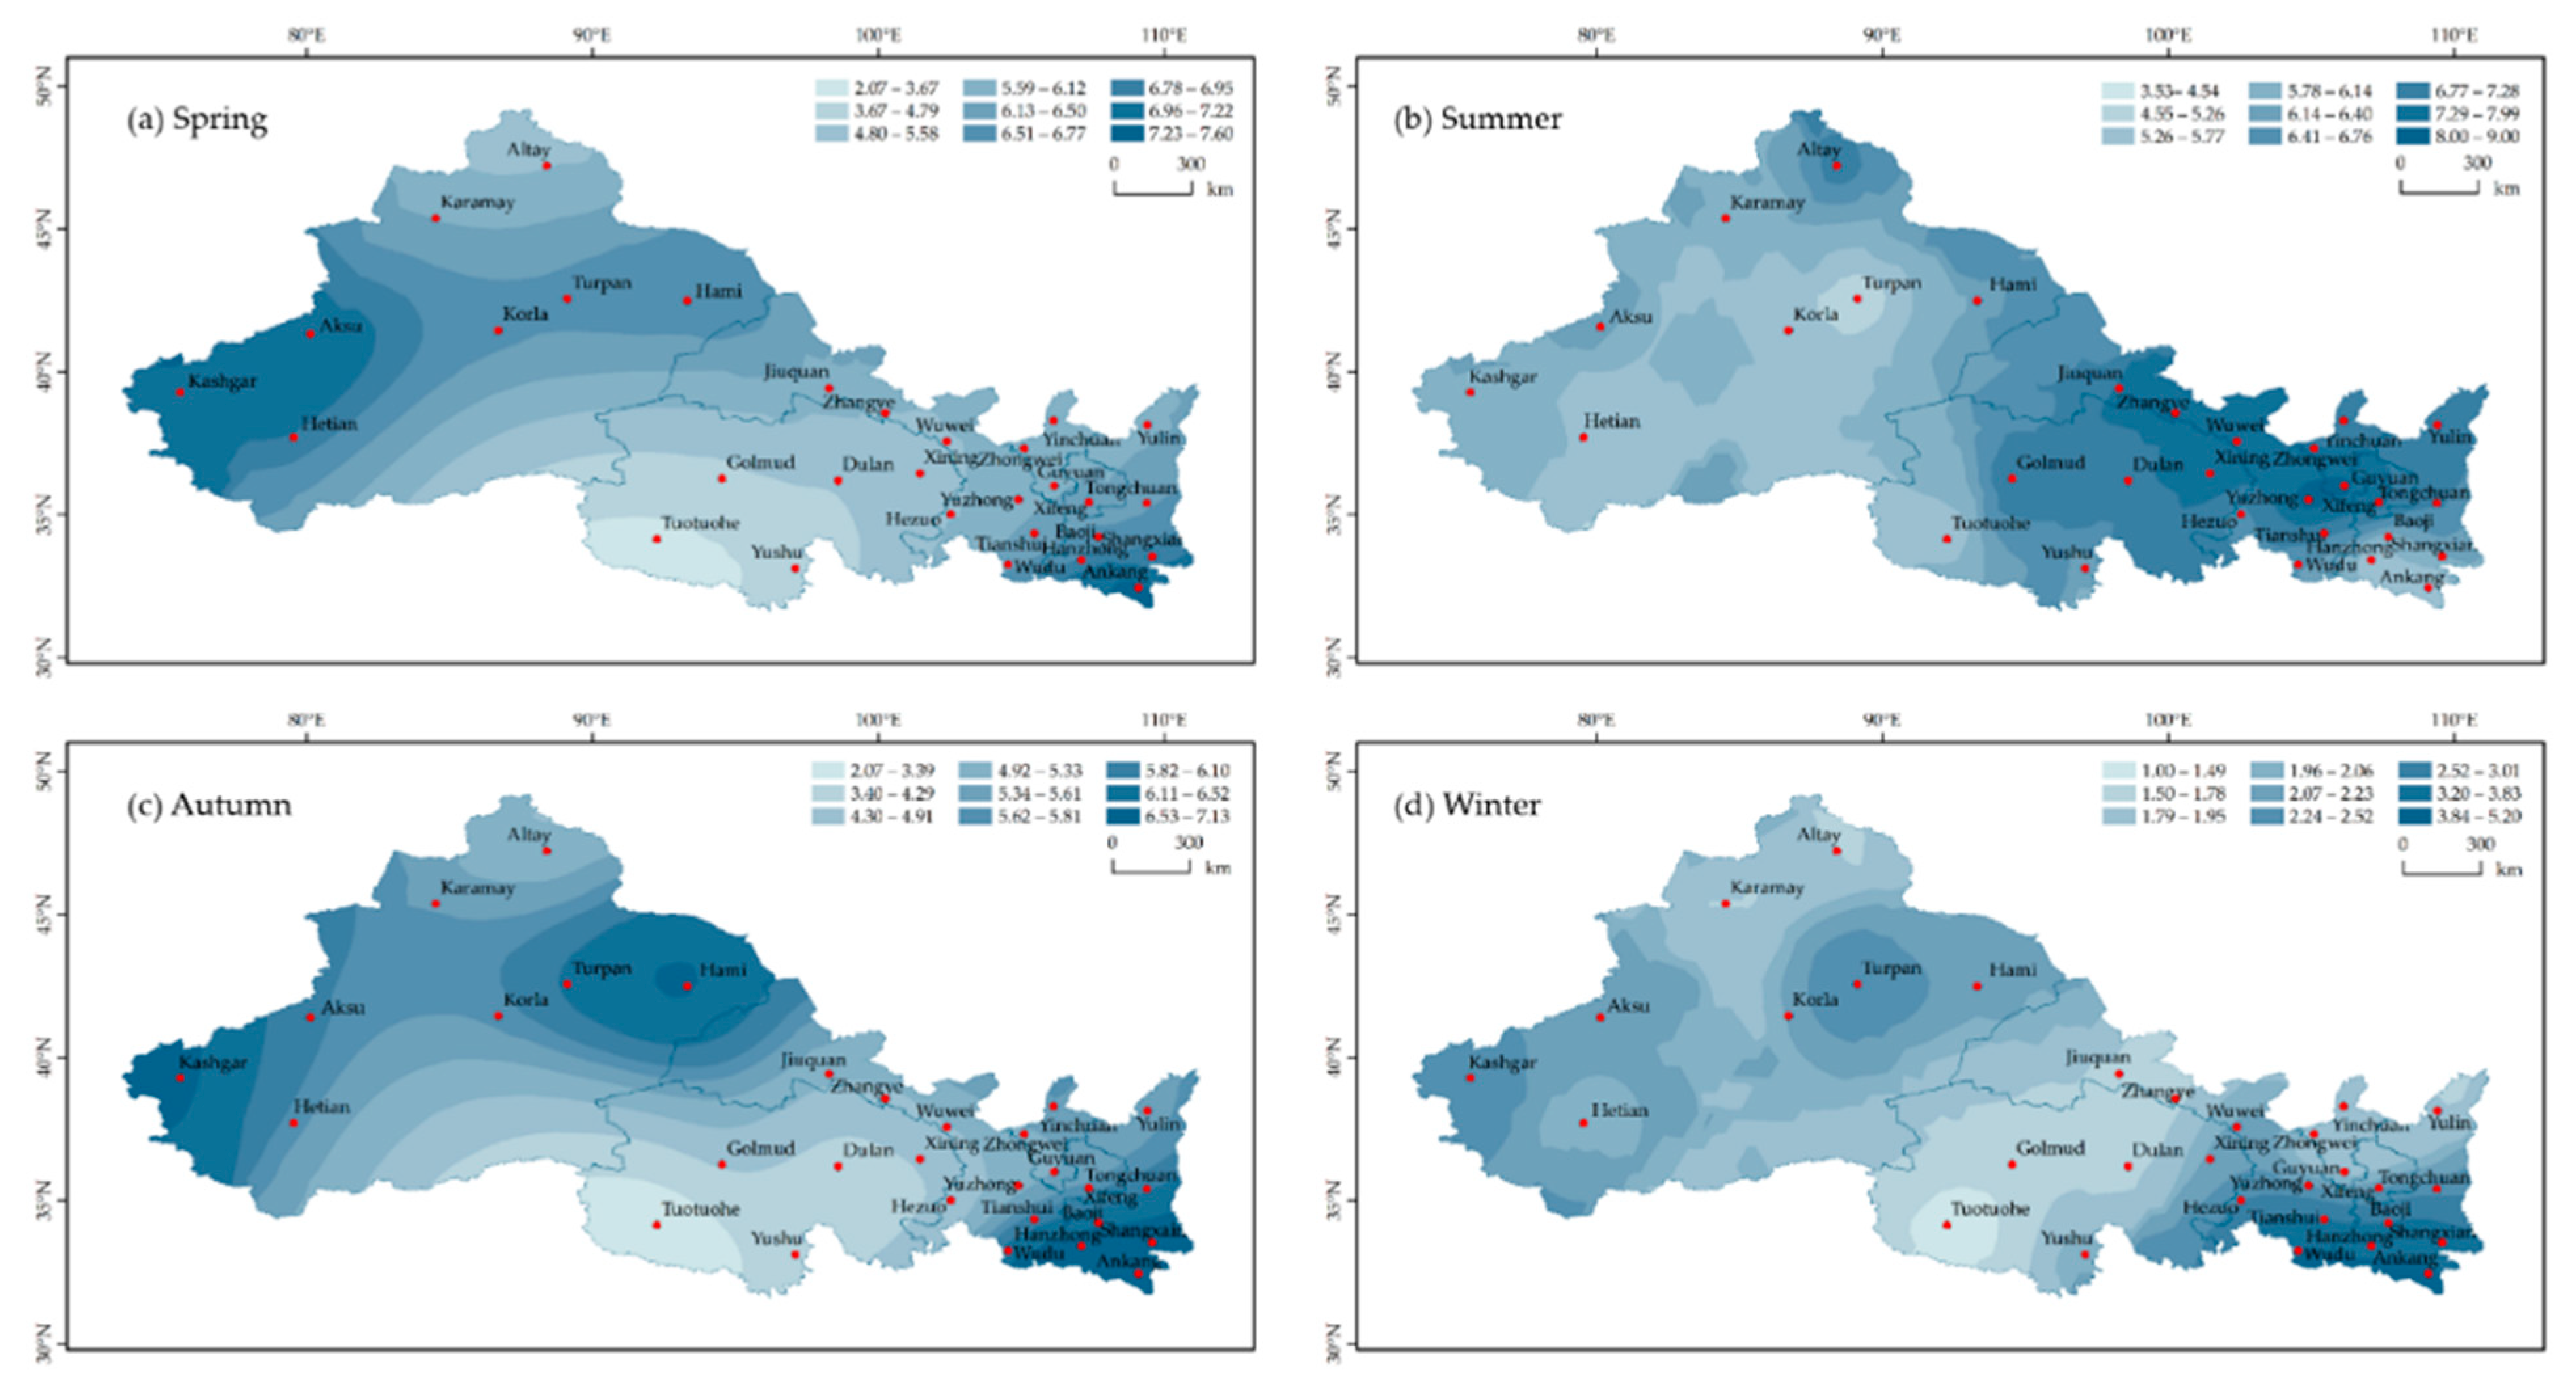
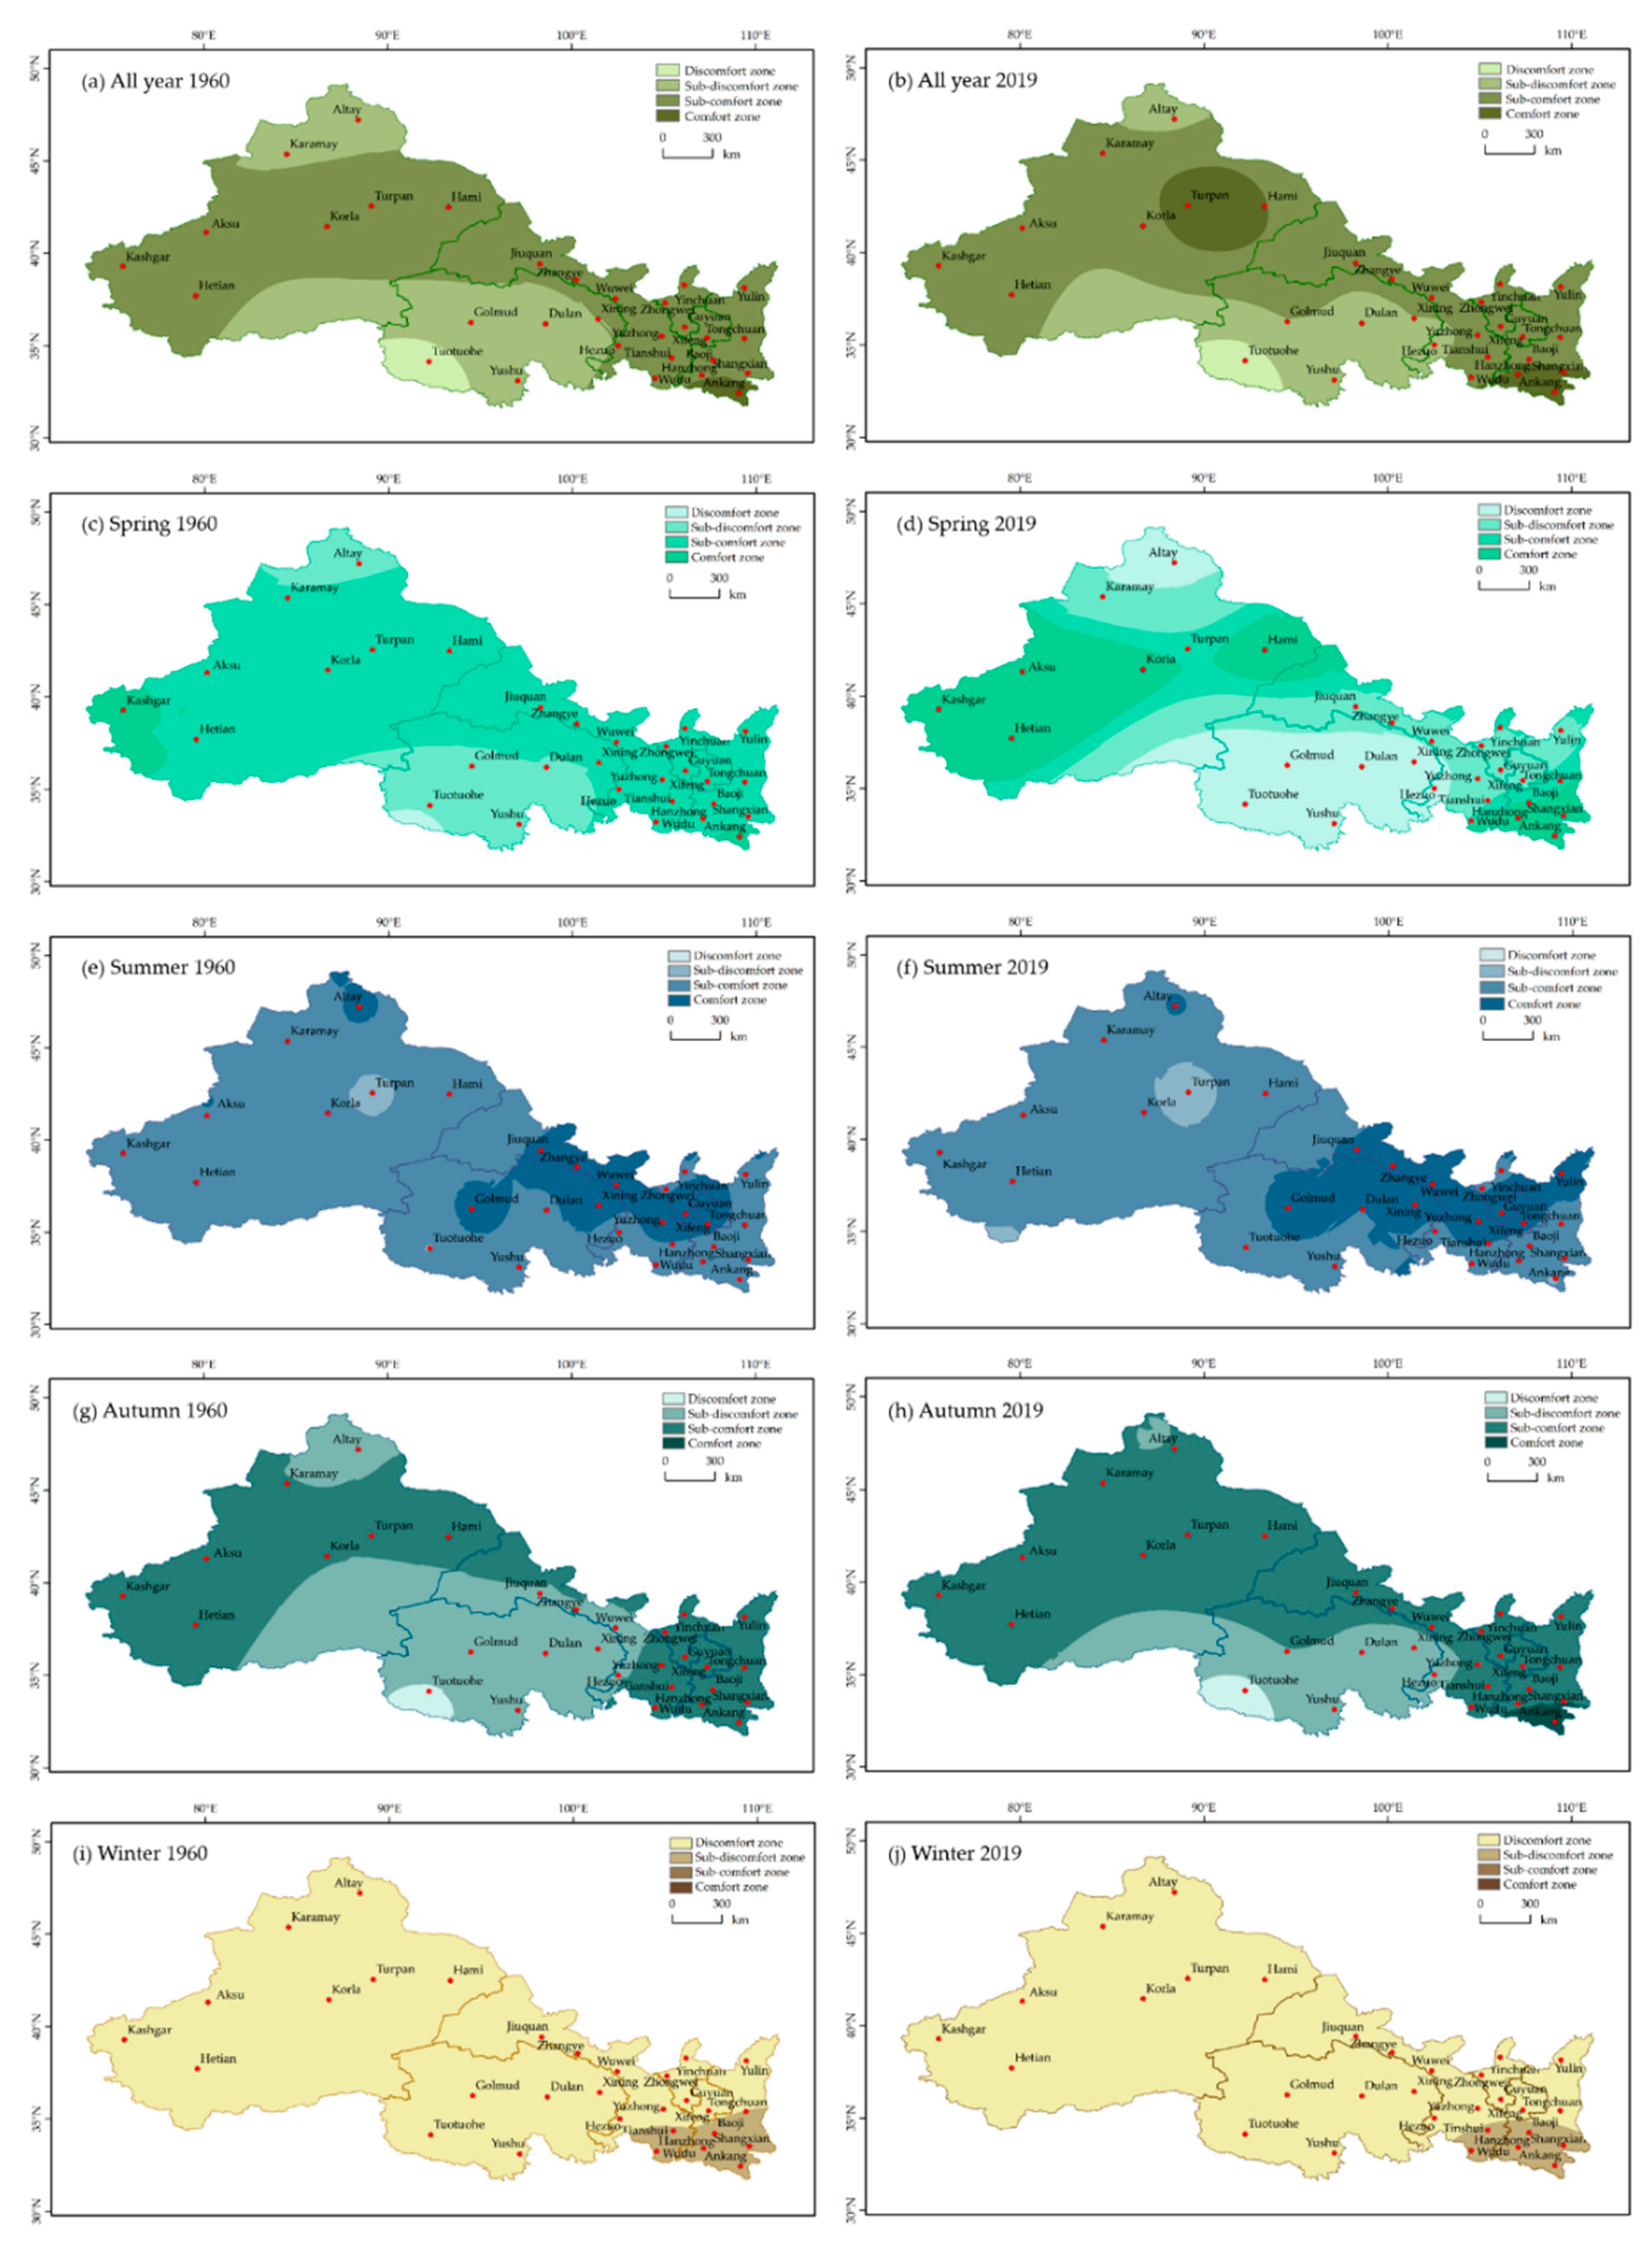
51]. The climate comfort of a specific area is an important indicator of climate change that affects the human living environment. It is a comprehensive manifestation of coordinating the construction of regional ecological civilization, coping with climate change and disaster prevention and mitigation, and is the basic guarantee for realizing regional green and sustainable development. Based on THI, WEI, ICL, and CCI, this paper establishes a comprehensive climate comfort evaluation model and uses this model to complete the analysis of climate comfort in 30 representative cities in Northwest China. The results show that the annual average climate comfort in Northwest China ranges from south to the northwest in an upward trend that is gradually significant. Among them, the summer climate comfort value is the largest, and the range of the comfort zone increases significantly in spring and summer. May and September have the most cities suitable for tourism. This is consistent with the results of previous studies [51,52].
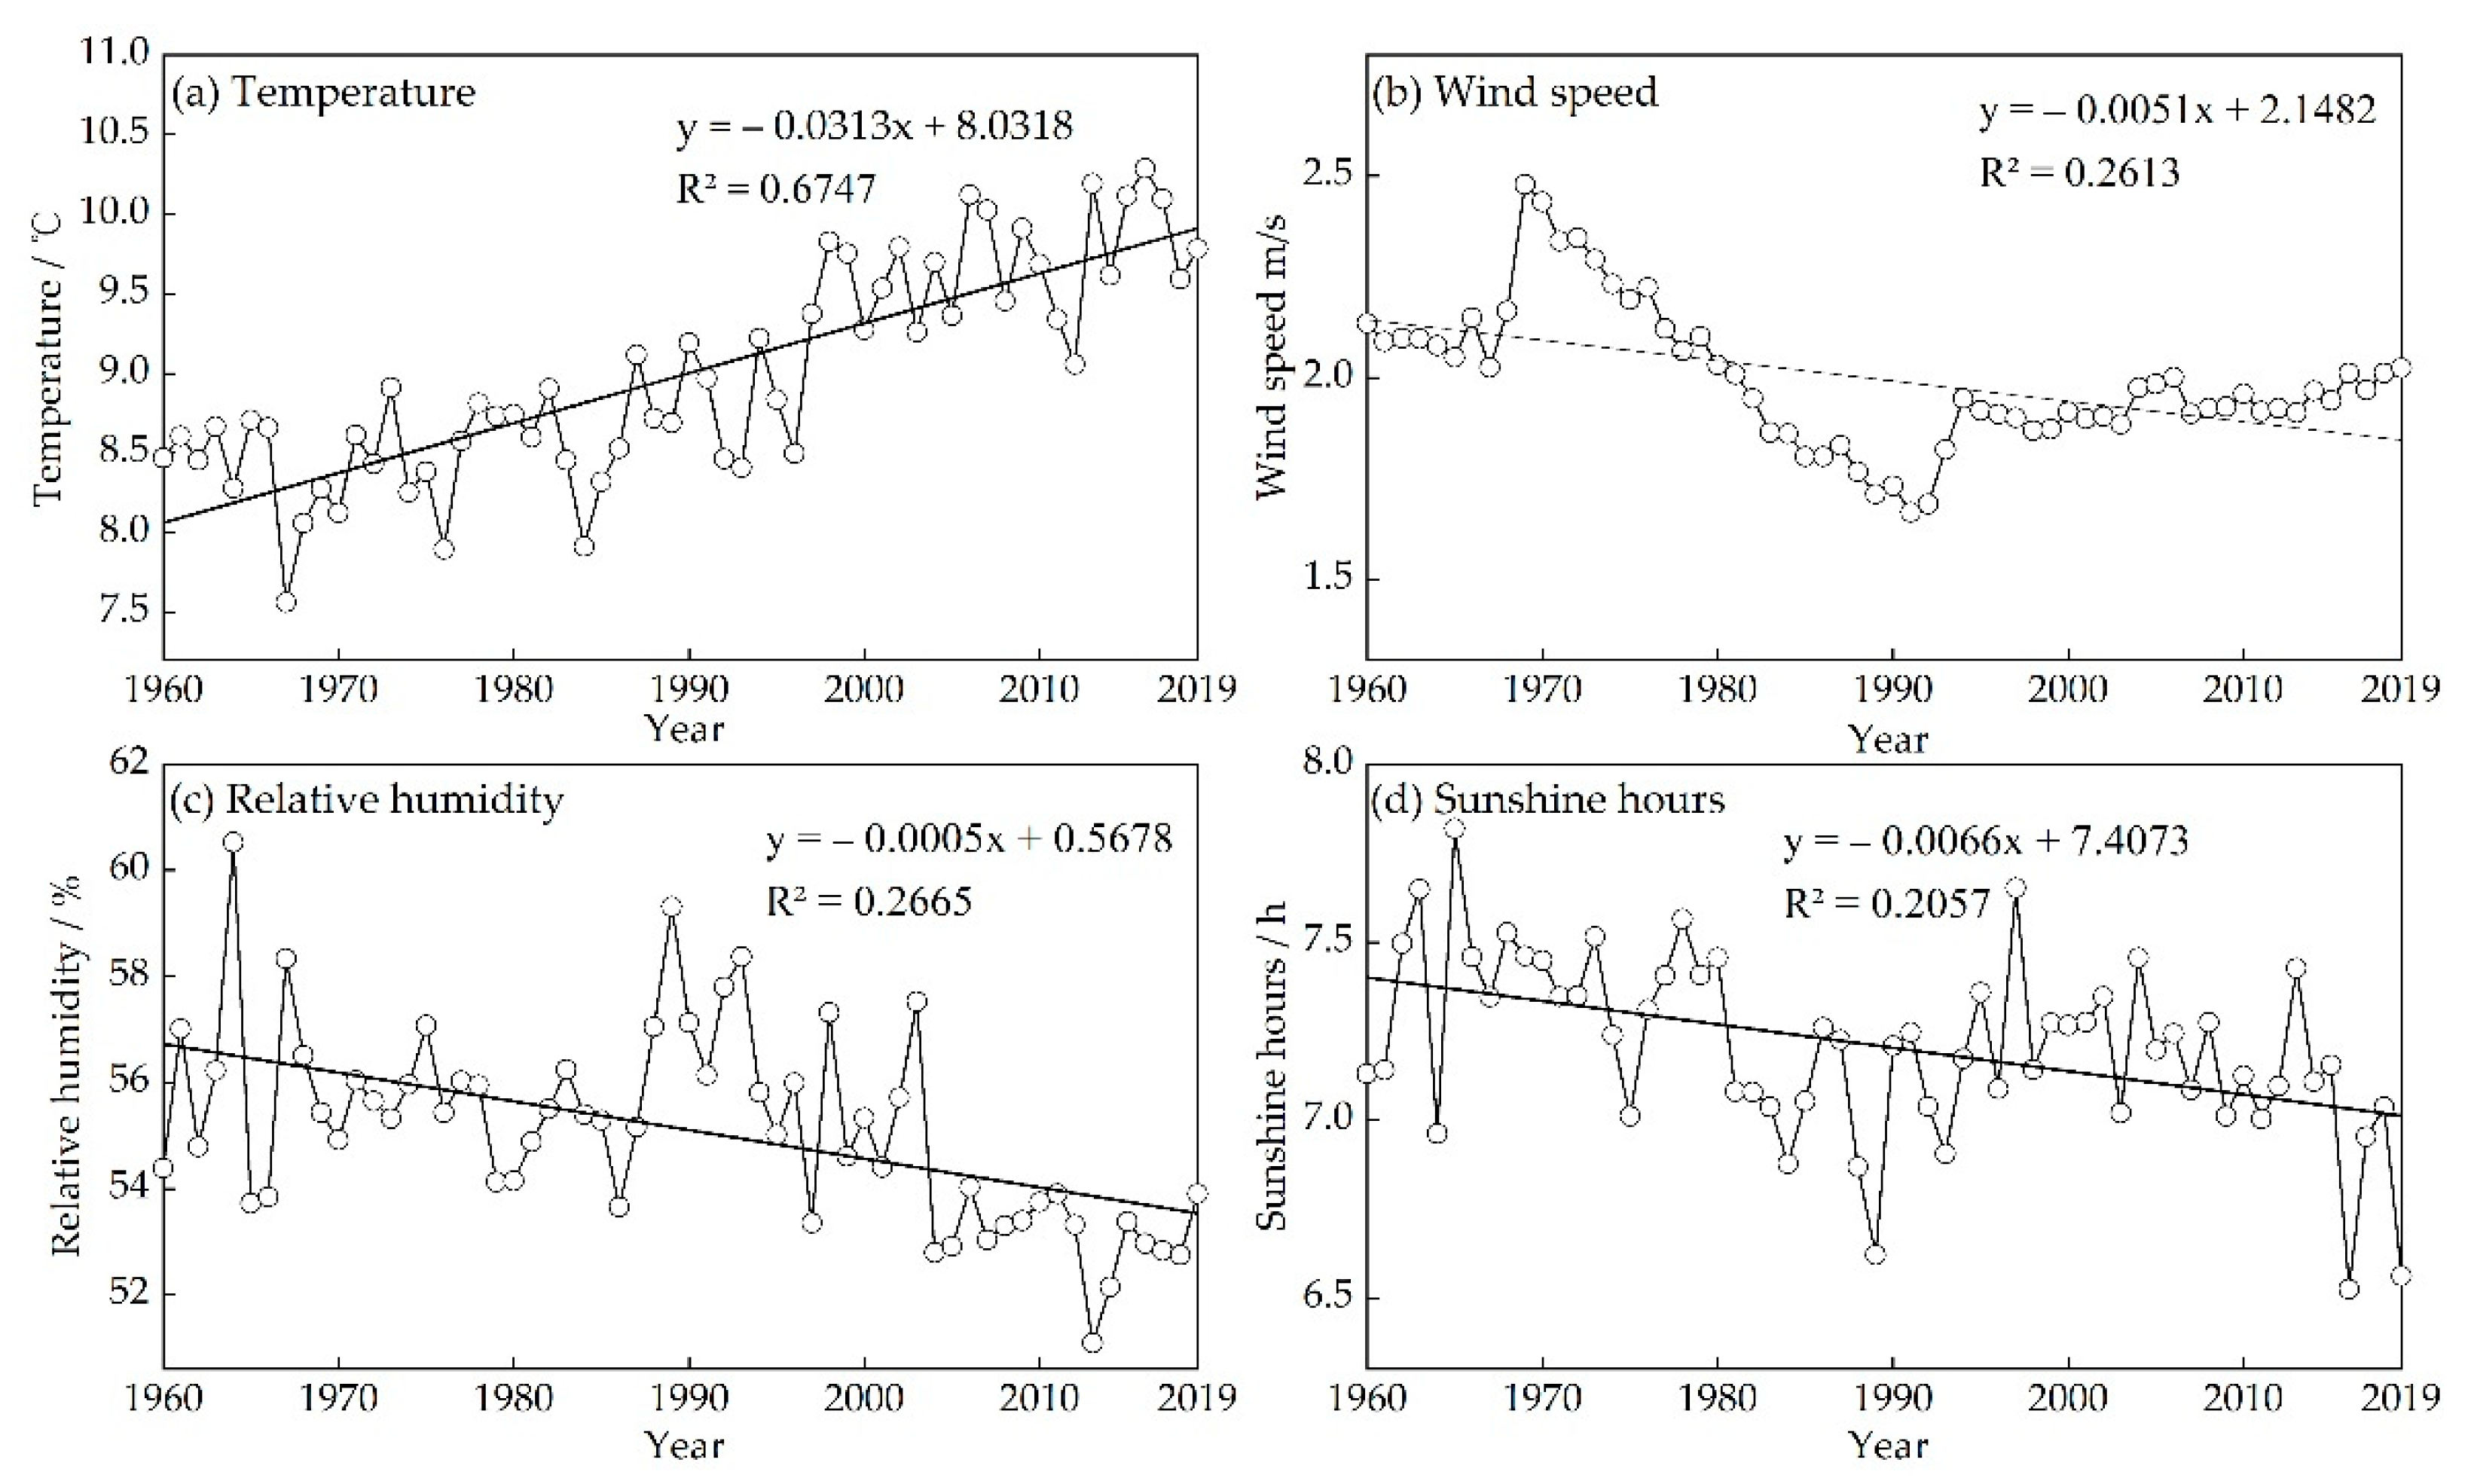
In recent years, different regions in the Northwest have also been conducting evaluations on urban climate comfort, which not only helps to promote the construction of ecological civilization, but also an important breakthrough for the development of a green economy and circular economy. From 1960 to 2019, with the increase in average temperature in the northwest region, the decrease in average wind speed, relative humidity, and sunshine hours (Figure 7) all have certain effects on THI, WEI, and ICL. Table 7 shows the correlation coefficients between various meteorological elements and the comfort evaluation index. It is found that the trend of warming temperature and decreasing wind speed in the northwest region increases the climate comfort index (correlation coefficient is 0.88, p < 0.01) and extends the local comfortable period of travel. The decrease in sunshine duration may affect the increase of wind speed (correlation coefficient of 0.47, p < 0.01) and the increase of clothing index (correlation coefficient of 0.48, p < 0.01). The decrease in relative humidity may reduce the number of sunshine hours (correlation coefficient is −0.81, 
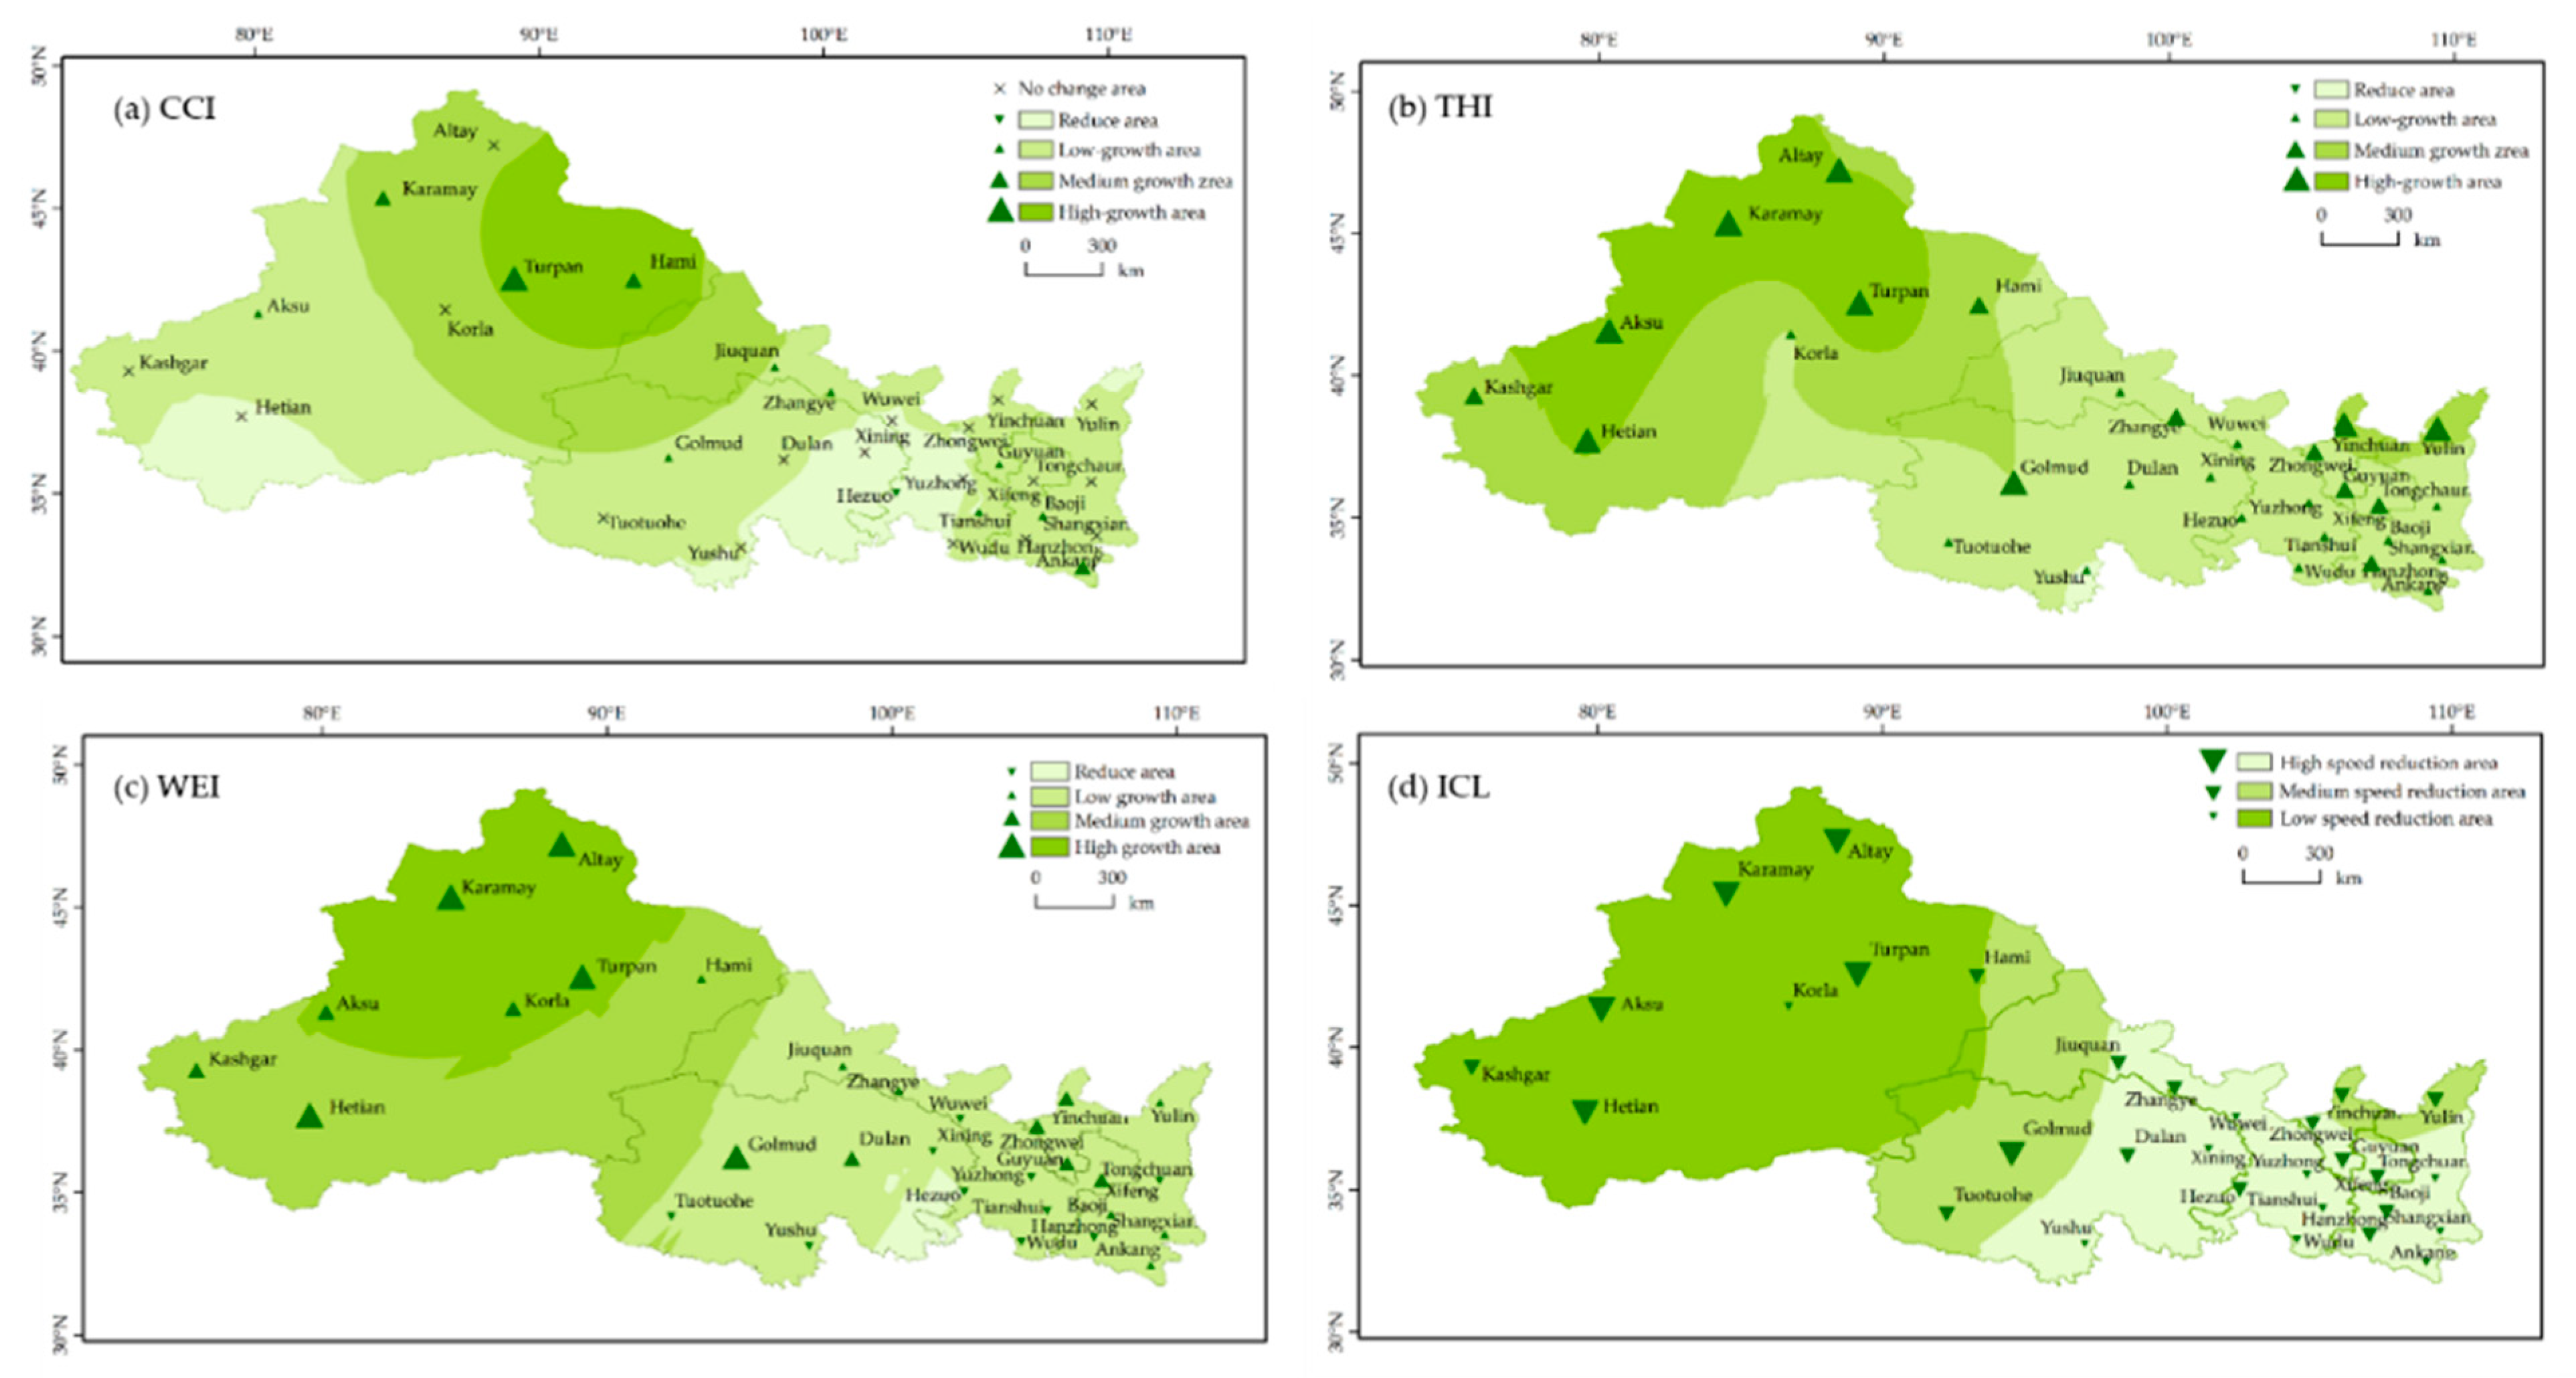
p < 0.01). These all affect the increase in climate comfort and are not conducive to the development of tourism activities. According to the research in this article, the climate comfort level in the study area has changed significantly. The comfort level of cities close to the north increases faster than that of the southern city, indicating that the annual comprehensive comfort index of cities with higher latitudes is on the rise, which is conducive to the development of urban tourism. The annual comprehensive comfort index of cities with lower latitudes is on a downward trend, and the climate comfort period is shortened, which inhibits the development of urban tourism. In different altitude areas, as the altitude increases, the climate comfort index is the most affected by temperature. The influence of sunshine hours gradually increases but the change is not obvious. The influence of wind speed first decreases and then increases. The degree of influence of humidity gradually decreases. In summary, the climate comfort index in Northwest China may be the result of the combined effect of latitude, altitude, and related human factors. It can be seen that the climate comfort index is used to comprehensively evaluate and analyze the differences in climate change between regions and the sensitivity of the human body to climate. On the one hand, it can scientifically guide people to travel and appropriately change their behaviors in accordance with climate change, and provide a reference for the sustainable development of Northwest China and the improvement of human settlements. On the other hand, it can guide the production and life of human society, and conduct meteorological services and tourism planning by studying the trend and distribution of climate comfort.
The impact of global climate change on the tourism industry in Northwest China is a “double-edged sword”. Although global climate change in recent years has brought certain challenges to human life, for mid-to-high altitude areas, the main cause of uncomfortable weather is the influence of cold air in winter, and the increase in temperature mitigates the influence of cold air in winter, making the climate comfort develop from uncomfortable to a comfortable range. In addition, climate change has also had a positive impact on off-season tourism in Northwest China [53], which can prolong the tourism season in the area and reduce the adverse effects of climate fluctuations. Therefore, the development of tourism not only helps to mitigate climate change but also continuously adapts to climate change. At the same time, for the sensitive and vulnerable areas of climate change, adaptive and alternative tourism products should be developed, including reasonably planning for the protection of glacier landscapes and strengthening the development and protection of sensitive resources such as wetlands and lakes. Fully protecting ecological tourism resources will improve the utilization rate of tourism resources, and accelerate the sustainable development of tourism resources [54,55].
The comprehensive comfort evaluation index constructed in this paper based on three climate indexes can reflect the degree of regional climate comfort to a certain extent, but its construction method and classification standards still need to be further studied in detail. Since the evaluation of comfort was related to meteorological factors, as well as the characteristics of the underlying surface, eyeballs, air quality, etc., further research is necessary. In addition, the terrain conditions in Northwest China are complex, with plateaus, mountains, basins, and other types of landforms, and different landforms have different climatic conditions. In the future, after the regional automatic weather station data passes strict quality control, we can try to make full use of the regional automatic weather station data to carry out more refined climate comfort analysis and research in Northwest China.

5. Conclusions

Based on the monthly THI, WEI, ICL, and the comprehensive index constructed from 1960 to 2019, this paper explored the temporal and spatial distribution characteristics of climate comfort in Northwest China, and obtained the following conclusions:
  • The change trends of the comfort indexes in Northwest China over the past 60 years are quite different. The THI and the WEI have shown an upward trend, with a significant increase in the spring, a downward trend in the ICL, and a significant decrease in the autumn. The CCI showed an increasing trend, with the largest increases in southeastern Gansu and southern Shaanxi. The increasing trend in spring and autumn is that the east and west are larger than the central, and the east is greater than the west in winter and summer. The overall comfort of the four seasons is summer > spring > autumn > winter.
  • Through the study of the change types and trends of each evaluation index, we found that the THI is increasing from the southeast to the northwest. It was mainly affected by topographical factors. Cities with larger increases are mostly distributed in basins and oasis areas. The WEI shows an increasing trend from southeast to northwest, and its changes were mainly affected by latitude. The ICL shows a decreasing trend from southeast to northwest, which may be due to the increase in temperature and the decrease in wind speed. The changing trend of the CCI shows that the increase in the north is greater than that in the south, and the higher the latitude, the greater the change, and the lower the latitude, the smaller the change.
  • In terms of the distribution of comfort periods in various cities from 1960 to 2019, calculations show that the distribution of comfort periods is about 4.1 months, the sub-comfort period is 3.2 months, the sub-discomfort period is 1.8 months, and the discomfort period is 3.6 months. Taking “comfort period” and “sub-comfort period” as the criteria for suitable tourist months, we can see that there are no cities suitable for tourism in January–February and November–December. There are 29 cities suitable for tourism in May and September, and next is June, when there are 28 cities suitable for tourism. “Summer-friendly” includes 13 cities including Jiuquan, “spring and autumn-friendly” includes 17 cities such as Yulin, and there is no “winter-friendly” city.
  • Comparing the different climate comfort levels in 1960 and 2019, it is found that the climate “comfort zone” in Northwest China is expanding, with a significant increase in spring and summer, but no “comfort zone” in winter; the “sub-comfort zone” decreases in spring and summer and increases in autumn. There is no “sub-comfort zone” in winter; the “sub-discomfort zone” increases in spring, decreases in autumn and winter, and there is no “sub-discomfort zone” in summer; the increasing trend of “discomfort zone” is more obvious in spring, but not obvious in other seasons.

Author Contributions

Conceptualization, M.Z. and X.Y.; software, X.Y.; formal analysis, X.Y.; writing—original draft preparation, X.Y.; writing—review and editing, Y.Z., H.X. and J.W.; project administration, M.Z.; funding acquisition, M.Z. All authors have read and agreed to the published version of the manuscript.

Funding

This research was funded by the Scientific Research Program of Higher Education Institutions of Gansu Province No. 2018C-02.

Institutional Review Board Statement

Not applicable.

Informed Consent Statement

There are no human subjects in this article and informed consent is not applicable.

Data Availability Statement

Not applicable.

Acknowledgments

Thank you very much for the support from the Scientific Research Program of Higher Education Institutions of Gansu Province No. 2018C-02; thank you also to the editors and reviewers for their valuable comments on this article.

Conflicts of Interest

The authors declare no conflict of interest.

References

  1. Ma, L.J.; Sun, G.N. Evaluation of tourism climate comfortableness of coastal cities in the eastern China. Prog. Geogr. 2009, 28, 713–722. [Google Scholar]
  2. Turner, S.C.; Arens, E.A. ASHRAE STANDARD Thermal Environmental Conditions for Human Occupancy; ASHRAE: Peachtree Corners, GA, USA, 2010. [Google Scholar]
  3. Yan, Y.C.; Yue, S.P. Advances in assessment of bioclimatic comfort conditions at home and abroad. Adv. Earth Sci. 2013, 28, 1119–1125. [Google Scholar]
  4. Houghton, F.C.; Yaglou, C.P. Determining equal comfort lines. J. Am. Soc. Heat. Vent. Eng. 1923, 29, 165–176. [Google Scholar]
  5. Burton, A.C.; Snyder, R.A.; Leach, W.G. Damp cold vs. dry cold. specific effects of humidity on heat exchange of unclothed man. J. Appl. Physiol. 1955, 8, 269–278. [Google Scholar] [CrossRef] [PubMed]
  6. Thom, E.C. A new concept for cooling degree days. Airconditioning Heat. Vent. 1957, 54, 73–80. [Google Scholar]
  7. Terjung, W.H. Physiologic climates of the conterminous United States: A bioclimatic classification based on man. Ann. Assoc. Am. Geogr. 1966, 56, 141–179. [Google Scholar] [CrossRef]
  8. Oliver, J.E. Climate and Man’s Environment: An Introduction to Applied Climatology; John Wiley & Sons Inc.: New York, NY, USA, 1973. [Google Scholar]
  9. Lise, W.; Tolrs, J. Impact of climate on tourism demand. Clim. Chang. 2002, 55, 429–449. [Google Scholar] [CrossRef]
  10. Richardson, R.B.; Loomis, J.B. Adaptive recreation planning and climate change: A contingent visitation approach. Ecol. Econ. 2004, 50, 83–99. [Google Scholar] [CrossRef]
  11. Maddison, D. In search of warmer climates? The impact of climate change on flows of British tourists. Clim. Chang. 2001, 49, 193–208. [Google Scholar] [CrossRef]
  12. Feng, J.P. An ananlysis of the climatic resources of tourism of YunTai Mountain. Sci. Meteorol. Sin. 1996, 16, 396–400. [Google Scholar]
  13. Liu, F.; Liu, H.E. A comprehensive assessment of the rational tourist capacity for Huangshan Mountains. Tour. Trib. 1996, 11, 32–34. [Google Scholar]
  14. Fan, Y.Z.; Guo, L.X. The climate suitability of tourism at the coastline destinations of China. J. Nat. Resour. 1998, 13, 304–311. [Google Scholar]
  15. Yang, X.W.; Bu, X.X. The tourism climate guide of Huangshan area. Meteorol. Mon. 1999, 25, 50–54. [Google Scholar]
  16. Feng, L.M.; Jiang, X.W. Evaluation and thorough exploitation of the tourism climate resources in MT. Lushan. J. Jiangxi Norm. Univ. Nat. Sci. Ed. 2003, 27, 173–176. [Google Scholar]
  17. Jianjun, T.A.O.; Bing, Q.U.A.N. Exploitation on tourist climate resources in the mountainous regions of Hunan: A case study of Mt. Hengshan and Mt. Xuefengshan. Trop. Geogr. 2009, 29, 172–176. [Google Scholar]
  18. Zhang, J.G.; Feng, Y.F. A study of the climate pleasantness evaluation of Guizhou province. Tour. Trib. 1991, 6, 50–53. [Google Scholar]
  19. Liu, C.Y. A preliminary study on Jigong Mountain’s tourism climate. Areal Res. Dev. 1996, 15, 73–74. [Google Scholar]
  20. Wang, J.L.; Wang, P. Climate comfort index for tourism in Zhongdian, Yunnan. Trop. Geogr. 1999, 19, 235–239. [Google Scholar]
  21. Xu, D.H.; Zhu, R. The sensation of human to temperature & humility & wind speed and the clothing. J. Appl. Meteorol. Sci. 2000, 11, 430–439. [Google Scholar]
  22. Lu, L.; Xuan, F.G. An approach to seasonality of tourist flows between coastland resorts and mountain resorts: Examples of Sanya, Beihai, Mt. Putuo, Mt. Huangshan and Mt. Jiuhua. Acta Geogr. Sin. 2002, 57, 731–740. [Google Scholar]
  23. Liu, Q.C.; Wang, Z. Climate suitability index for city tourism in China. Resour. Sci. 2007, 29, 133–141. [Google Scholar]
  24. Wang, H.F. Research on Analysis and Evaluation of Climate Comfort Degree for Tourist in Shanxi Province. Ph.D. Thesis, Shanxi University, Taiyuan, China, 2007. [Google Scholar]
  25. Chen, Y. Climate Comfort Evaluation of Tourism in Jilin Province. Ph.D. Thesis, Northeast Normal University, Changchun, China, 2009. [Google Scholar]
  26. Ma, L.J.; Sun, G.N. Evaluation on tourism climate comfort degree of hot cities in China. J. Shaanxi Norm. Univ. Nat. Sci. Ed. 2009, 37, 96–102. [Google Scholar]
  27. Ma, L.J.; Sun, G.N. A study on variations of the tourism climate comfort degree in five typical cities in eastern china during the last 50 years. Resour. Sci. 2010, 32, 1963–1970. [Google Scholar]
  28. Xie, W.; Ren, L.X. A study on spatial and temporal distribution of temperature-humidity index in China based on MODIS data. Geogr. Geo-Inf. Sci. 2006, 22, 31–35. [Google Scholar]
  29. Zheng, Y.F.; Yu, Y.J. Influence of meteorological parameters on human comfort index. Meteorol. Sci. Technol. 2007, 35, 827–831. [Google Scholar]
  30. Tian, Z.H.; Zheng, D.W. Quantitative evaluation of climatic suitability for tourism in the Beijing mountainous area. Resour. Sci. 2008, 30, 1746–1851. [Google Scholar]
  31. Cao, Y.Q.; Gao, L. Regional characteristics of climate comfort in summer in Liaoning during past 30 years. Sci. Geogr. Sin. 2016, 36, 1205–1211. [Google Scholar]
  32. Ma, L.J.; Sun, G.N. Correlative analysis on climate comfortable degree and monthly variations of tourists in Beijing. J. Arid Land Resour. Environ. 2009, 23, 95–100. [Google Scholar]
  33. Zhu, B.W.; Ha, C.Z. Relationship between tourism climate comfort and passenger traffic in Qinghai Haibei area. Meteorol. Environ. Sci. 2014, 37, 83–87. [Google Scholar]
  34. Intergovernmental Panel on Climate Change (IPCC). Climate Change 2013: The Physical Science Basis. Contribution of Working Group I to the Fifth Assessment Report of the Intergovernmental Panel on Climate Change; Stocker, T.F., Qin, D., Plattner, G.-K., Tignor, M., Allen, S.K., Boschung, J., Nauels, A., Xia, Y., Bex, V., Midgley, P.M., Eds.; Cambridge University Press: Cambridge, UK, 2013. [Google Scholar]
  35. Tao, C.W.; Jiang, C. Projection of future changes in climate in Northeast China using a CMIP5 multi-model ensemble. Chin. J. Geophys. 2016, 59, 3580–3591. [Google Scholar]
  36. Piao, S.; Ciais, P.; Huang, Y.; Shen, Z.; Peng, S.; Li, J.; Zhou, L.; Liu, H.; Ma, Y.; Ding, Y.; et al. The impacts of climate change on water resources and agriculture in China. Nature 2010, 467, 43–51. [Google Scholar] [CrossRef] [PubMed]
  37. Bao, Z.X.; Qi, X.H. Effects of weather/climate on tourism demand: Research advances and perspectives. J. Subtrop. Resour. Environ. 2019, 14, 60–67. [Google Scholar]
  38. Chen, Y.Y.; Ding, Y.J. Assessment of climate and environment changes in China (II): Measures to adapt and mitigate the effects of climate and environment changes. Clim. Chang. Res. 2005, 1, 51–57. [Google Scholar]
  39. Qin, D.H. Climate change science and sustainable development. Prog. Geogr. 2014, 33, 874–883. [Google Scholar]
  40. Ma, L.J.; Sun, G.N. Evaluation of tourism climate comfortableness in Shaanxi province. Resour. Sci. 2007, 29, 40–44. [Google Scholar]
  41. Ma, L.J.; Sun, G.N. Evaluation of climate comfort index for tourism hot-spot cities in west China. Arid Land Geogr. 2009, 32, 791–797. [Google Scholar]
  42. Li, D.; Yang, Z.P. Tourism climate and its comfort degree in Urumqi. Arid Zone Res. 2014, 31, 404–409. [Google Scholar]
  43. Wu, L.; He, B.Y. Evaluation of tourism climate comfort degree in Turpan. J. Anhui Agric. Sci. 2015, 1, 110–113. [Google Scholar]
  44. Yu, Z.K.; Sun, G.N. An analysis of climate comfort degree and tourism potential power of cities in northern China in summer to the north of 40° N. J. Nat. Resour. 2015, 30, 327–339. [Google Scholar]
  45. Cao, H.W.; Wang, S.X. Evaluation of climate suitability for urban human settlement in Beijing-Tianjin-Hebei region. J. Glaciol. Geocryol. 2017, 39, 435–442. [Google Scholar]
  46. Luo, S.Z.; Ju, K.Y. Analysis of the temporal variation in climatic comfortable period for tourism in Xining, 1954–2011. J. Glaciol. Geocryol. 2013, 35, 1193–1201. [Google Scholar]
  47. Freitas, C. Human climates of northern China. Atmos. Environ. 1979, 13, 71–77. [Google Scholar] [CrossRef]
  48. He, H.Y.; Guo, Z.H.; Xiao, W.F. Review on spatial interpolation techniques of rainfall. Chin. J. Ecol. 2005, 10, 1187–1191. [Google Scholar]
  49. Lu, S.; Wang, B.P. Variation characteristics and comprehensive division of climate comfort degree from 1971 to 2010 in Shaanxi province. J. Arid Meteorol. 2015, 33, 987–993. [Google Scholar]
  50. Sun, M.S.; Li, S. Empirical indices evaluating climate comfortableness: Review and prospect. Tour. Trib. 2015, 30, 19–34. [Google Scholar]
  51. Sun, M.S. Climate Comfort Period in Chinese Mainland: Its Spatial Evolution and Prediction. Master’s Thesis, East China Normal University, Shanghai, China, 2015. [Google Scholar]
  52. Pan, L. Research on Climate Comfort of Major Tourist Cities in Northwest Five Provinces. Master’s Thesis, Xinjiang Normal University, Urumqi, China, 2018. [Google Scholar]
  53. Huang, H.P. Regional Differences of Tourism Seasonality in China and Development Strategy Research. Master’s Thesis, East China Normal University, Shanghai, China, 2016. [Google Scholar]
  54. Li, Q.J.; Wang, L.E. Conflicts and coordination of tourism resource use in protected areas in China. Prog. Geogr. 2020, 39, 2105–2117. [Google Scholar] [CrossRef]
  55. Xu, Y.Q. Sustainable development of tourism and ecological protection of tourism. Tour. Overv. 2021, 1, 61–63. [Google Scholar]
Figure 1. Overview of Northwest China: (a) digital elevation model and representative station; (b) division of climate types in Northwest China (the classification is based on the Atlas of National Geographic Map of China (https://www.osgeo.cn/map/mc7fa), compiled by the editorial board of National Geographic Map of China. The figure mainly shows the temperate continental climate, temperate monsoon climate, plateau alpine climate, and subtropical monsoon climate).
Sustainability 13 10111 g001
Figure 2. Seasonal changes of THI, WEI, and ICL (calculated from the decadal average). Note: the shaded part is the comfort and sub-comfort range of the corresponding index.
Sustainability 13 10111 g002
Figure 3. Distribution characteristics of CCI annual average values in Northwest China from 1960 to 2019.
Sustainability 13 10111 g003
Figure 4. Distribution characteristics of CCI seasonal average values in Northwest China from 1960 to 2019 (a) Spring, (b) Summer, (c) Autumn, (d) Winter.
Sustainability 13 10111 g004
Figure 5. Types and Trends of Spatial Changes of THI, WEI, ICL, and CCI in Northwest China (a) CCI, (b) THI, (c) WEI, (d) ICL.
Sustainability 13 10111 g005
Figure 6. Seasonal changes of different climate comfort levels in Northwest China (a) All year 1960, (b) All year 2019, (c) Spring 1960, (d) Spring 2019, (e) Summer 1960, (f) Summer 2019, (g) Autumn 1960, (h) Autumn 2019, (i) Winter 1960, (j) Winter 2019.
Sustainability 13 10111 g006
Figure 7. The change characteristics of meteorological elements in the past 60 years in Northwest China (a) Temperature, (b) Wind speed, (c) Relative humidity, (d) Sunshine hours.
Sustainability 13 10111 g007
Table 1. THI classification standards and assignments (the shaded value is the value range where the human body feels comfortable).
Rating ValueHuman SensationSymbolAssignment
≤40Extremely colde (extremely uncomfortable)1
40–45Coldd (uncomfortable)3
45–55Slightly coldc (less comfortable)5
55–60Coolb (sub-comfort)7
60–65Slightly coolA (comfort)9
65–70WarmB (sub-comfort)7
70–75HotterC (less comfortable)5
75–80SultryD (uncomfortable)3
≥80Extremely stuffyE (extremely uncomfortable)1
Table 2. WEI classification standards and assignments (the shaded value is the value range where the human body feels comfortable).
Rating ValueHuman SensationSymbolAssignment
≤−1000Extremely colde (extremely uncomfortable)1
−800–−1000Cold windd (uncomfortable)3
−600–−800Slightly cold windc (less comfortable)5
−300–−600Cool windb (sub-comfort)7
−200–−300Comfortable windA (comfort)9
−50–−200Warm airB (sub-comfort)7
80–−50Slightly warm windC (less comfortable)5
160–80Hot airD (uncomfortable)3
≥160Extremely hotE (extremely uncomfortable)1
Table 3. ICL classification standards and assignments (the shaded value is the value range where the human body feels comfortable).
Rating ValueAppropriate DressSymbolAssignment
≥2.5Down or fur clothinge (extremely uncomfortable)1
1.8–2.5Casual clothes plus coatd (uncomfortable)3
1.5–1.8Common winter clothingc (less comfortable)5
1.3–1.5Common clothing for spring and autumnb (sub-comfort)7
0.7–1.3Shirts and casual clothesA (comfort)9
0.5–0.7Light summer clothesB (sub-comfort)7
0.3–0.5Short sleeve cardiganC (less comfortable)5
0.1–0.3Tropical unlinedD (uncomfortable)3
≤0.1Tropical thin unlinedE (extremely uncomfortable)1
Table 4. CCI classification standards and symbol [1].
Rating ValueSymbol
1 < CCI ≤ 3uncomfortable
3 < CCI < 5sub-discomfort
5 ≤ CCI < 7sub-comfortable
7 ≤ CCI ≤ 9comfortable
Table 5. Changes of THI, WEI, and ICL in Northwest China from 1960 to 2019.
Annual1960s1970s1980s1990s2000s2010s
THI49.7149.8750.0450.6351.5351.77
WEI−501.27−505.15−482.15−468.72−461.89−462.69
ICL1.761.751.741.701.661.65
MonthJan.Feb.Mar.Apr.MayJun.
THI29.2436.1045.4154.1460.33 **65.57 *
WEI−795.81−731.98−601.53−449.99 *−318.73 *−218.93 **
ICL2.892.562.071.571.20 **0.91 **
MonthJul.Aug.Sep.Oct.Nov.Dec.
THI68.57 *67.12 *60.00 **50.78 *40.1131.26
WEI−170.90 *−196.90 *−318.32 *−458.99 *−632.97−754.11
ICL0.77 **0.85 **1.23 **1.722.302.76
Note: The annual value is the average of ten years, and the 1960s represents the average of 1960–1969, the same below. The monthly value is the average value from 1960 to 2019. ** means the index is a comfortable month in the month, * means a sub-comfortable month.
Table 6. Distribution of different CCI and comfort periods of major cities in Northwest China from 1960 to 2019.
CCIJan.Feb.Mar.Apr.MayJun.Jul.Aug.Sep.Oct.Nov.Dec.
Yulin *1.61.63.65.68.47.26.07.28.45.62.41.6
Tongchuan *2.22.45.45.88.47.85.87.28.45.63.62.2
Baoji *2.44.25.47.07.85.85.65.87.87.05.43.0
Hanzhong *3.04.25.67.27.85.84.64.67.87.25.64.2
Shangxian *2.43.65.47.09.07.25.85.89.07.05.43.6
Ankang *4.25.45.68.47.85.84.44.47.28.45.44.2
Jiuquan ^1.61.63.65.67.27.87.27.27.05.42.41.6
Zhangye ^1.61.63.65.68.47.87.27.27.05.42.21.6
Wuwei ^2.22.23.65.68.47.87.27.27.25.62.42.2
Yuzhong ^2.22.23.65.67.09.09.09.07.05.42.42.2
Xifeng ^1.62.23.65.67.27.87.87.87.05.63.62.2
Hezuo ^2.22.22.24.25.45.67.05.85.44.22.22.2
Wudu *4.27.27.27.87.87.25.85.87.87.05.64.2
Tianshui *2.22.45.47.09.07.25.87.28.45.64.22.4
Yinchuan *1.62.23.65.69.07.25.87.29.05.62.42.2
Zhongwei *1.62.24.85.68.47.85.87.88.45.62.41.6
Guyuan ^1.61.63.65.67.09.07.89.07.05.42.41.6
Golmud ^1.61.63.65.46.87.29.08.46.85.42.21.6
Dulan ^1.61.63.44.85.67.07.07.05.63.61.61.6
Xining ^2.22.23.65.46.87.29.09.05.65.42.42.2
Tuotuohe ^1.01.01.01.63.63.65.45.43.61.61.01.0
Yushu ^2.22.23.64.25.65.67.05.65.64.22.22.2
Altay ^1.61.62.25.67.27.87.27.87.05.42.21.6
Karamay *1.61.62.47.09.05.85.65.89.05.62.41.6
Turpan *2.24.25.69.05.63.63.43.67.07.64.22.2
Aksu *2.22.25.47.29.07.25.87.29.05.63.02.2
Korla *1.62.45.47.27.85.85.65.87.85.63.62.2
Hotan *2.23.65.68.47.87.05.65.87.87.05.42.2
Hami *1.62.25.47.08.45.85.05.89.05.62.41.6
Kashgar *2.22.45.67.29.07.05.65.89.07.04.22.2
Note: The darker the color, the higher the degree of comfort, and vice versa; “*” means “spring and autumn suitable” city; “^” means “summer suitable” city.
Table 7. Correlation coefficient between meteorological elements and climate comfort evaluation index.
CCITHIWEIICLSvtf
CCI-0.884 **0.856 **−0.876 **−0.476 **−0.528 **0.882 **0.332
THI0.884 **-0.934 **−0.987 **−0.508 **−0.540 **0.989 **0.249
WEI0.856 **0.934 **-−0.961 **−0.441 *−0.727 **0.957 **0.227
ICL−0.876 **−0.987 **−0.961 **-0.484 **0.551 **−0.999 **−0.252
S−0.476 **−0.508 **−0.441 *0.484 **-0.472 **−0.485 **−0.812 **
v−0.528 **−0.540 **−0.727 **0.551 **0.472 **-−0.539 **−0.362 *
t0.882 **0.989 **0.957 **−0.999 **−0.485 **−0.539 **-0.254
f0.3320.2490.227−0.252−0.812 **−0.362 *0.254-
Note: ** indicates a significant correlation at the 0.01 level, * indicates a significant correlation at the 0.05 level.
Publisher’s Note: MDPI stays neutral with regard to jurisdictional claims in published maps and institutional affiliations.

