Article

Determinants of Physical Activity Practices in Metropolitan Context: The Case of Lisbon Metropolitan Area, Portugal

Centre of Geographical Studies, Institute of Geography and Spatial Planning, Universidade de Lisboa, Edifício IGOT, Rua Branca Edmée Marques, Cidade Universitária, 1600-276 Lisboa, Portugal
*
Author to whom correspondence should be addressed.
Sustainability 2021, 13(18), 10104; https://doi.org/10.3390/su131810104
Submission received: 18 August 2021 / Revised: 5 September 2021 / Accepted: 7 September 2021 / Published: 9 September 2021
(This article belongs to the Special Issue Physical Activity and Sustainable Healthy Lifestyles)

Abstract

:
Physical activity is an important health determinant for people’s quality of life and well-being. This study intends to (1) identify how the practice of physical activity fits into families’ daily lives; and (2) verify to what extent the practice of physical activity is influenced by the urban model, family composition, and family perceptions. A survey was applied to 410 families (corresponding to 1006 individuals) in Lisbon Metropolitan Area (LMA), Portugal, focusing on different physical activities—gym, swimming, walking/trekking/hiking, and cycling. Results are based on descriptive and bivariate data analysis and show the existence of asymmetries in the practice of physical activity in LMA. The urban context impacts the choice and frequency of physical activity practices. The typology of family and age proved to be more differentiating factors than income, being reinforced by daily lives (e.g., daily movements, transport modes, etc.). Positive self-perceptions of quality of life and health levels are also conducive to more active practices, contrary to negative perceptions of the neighborhood that are related to practices in peripheral destinations. Conclusions highlight the need for differentiated measures of physical activity promotion according to the territories and communities’ characteristics in a multilevel approach.

1. Introduction

Health is not just only about the existence or absence of disease. As various determinants contribute to the health of the individual, an intervention oriented to health determinants in all possible sectors (e.g., environment, employment, transport, education) is the key to improve the health status of populations [1]. Simultaneously, policies, strategies, programs, and actions related to health should be conducted in a broad context, through a holistic and integrated plan, and in an intersectoral way [2,3].
“Habits and lifestyles of individuals” as health determinants are gaining a relevant role in discussions. This includes subjects such as alcohol consumption, smoking, excess of salt and sugar diet, physical inactivity, and stress, among others [4]. These factors are especially evident in urban areas that concentrate a large part of the population [5].
In particular, the human body was designed to move, so regular physical activity is essential to maintain its functioning properly and in a beneficial and disease-free manner [6,7,8], namely due to its positive influence on the secondary prevention of coronary heart disease, stroke, heart failure, pre-diabetes, obesity, and cancer, among other ailments, in some cases being more effective than medication [9,10,11,12,13,14,15]. The benefits are also felt at the mental and social levels, since they contribute to the improvement of the individuals’ functional performance, preserving their freedom, independence and autonomy and, consequently, making them less vulnerable to physiological and psychological effects [16]. Furthermore, involvement in physical activity helps in the prevention and control of risk behaviors such as the consumption of tobacco, alcohol, and other substances, unhealthy diets, and violence [6,17], benefiting not only the individual person but society as a whole in present and future generations [18].
Nevertheless, only a small part of the population practices physical activities [19]. For example, in Portugal, in 2016, 84.3% of adolescents between 11 and 17 years of age (78.1% for boys and 90.7% for girls) showed an insufficient level of physical activity. Similar situation was verified in Europe (82.1%, 77.5% for boys and 87% for girls) [20]. The situation among adults in Portugal is not auspicious either, with almost 60% of men and 70% of women not practicing any type of physical activity [21], with the worst values in older age groups (in 2019, more than three-quarters of the population between 55 and 74 years old and more than 85% of the population aged 75 or more years did not perform any physical activity [22]).
Physical activity patterns are influenced by individual and community factors, including social and physical environment factors [23,24,25,26].
Urban characteristics based on land use occupation and urban density have strong influence on the quality of urban areas, for example, by affecting the number and optimization of available services or infrastructures, generating inequalities among attractive and well-equipped areas versus segregated and disqualified areas [27,28,29,30,31,32]. Thus, geography and urban planning acts as a differentiator of populations’ health, since urban characteristics promote distinct practices and different health status, showing that “space and place carry a polysemy resulting from the overlapping of social dynamics, capable of generating spatially significant differences with important reflexes on the health of groups” [29] (p. 70).
In this context, a high density and diversity of facilities promotes the practice of physical activity. Individuals living in areas served by multiple facilities tend to use their free time in a healthier way [33,34]; in contrast, a greater distance to practice sites is demonstrated to be a prominent factor in reducing the number of users [35,36], especially when it comes to children. The same goes for open and green spaces, which were proved to have a positive correlation with healthy behaviors and life satisfaction [37]. Hence, accessibility and distribution of parks, green spaces, and other infrastructure should be considered in city planning, given their potential for enhancing physical activity practices, especially for young people [38]. Even urban mobility could contribute to more active behaviors through the choice of active modes (walking, cycling), which benefit from an adequate urban environment (e.g., cycle lanes) [39,40].
On the other hand, the relationship between sociodemographic individual characteristics and physical activity practices highlights gender differences [27,41,42], with the practices being more common in the male gender, except for walking. Age is also a relevant factor [42]. Naturally, our capabilities for physical practices change with the years as our body changes as well. Through a systematic review [43], a set of barriers to physical activity was classified, especially for the elderly, based on three dimensions:
  • Intrapersonal dimension: age; sex; physical problems; fear of falling; fatigue; lack of interest or motivation; pain; laziness; financial cost; individual beliefs; household chores; security concerns; single or widower status; unpleasant experience; lack of self-discipline; low level of education; heavy weight, among others;
  • Interpersonal dimension: having no companion; family responsibilities; inadequate information; social pressure; need to spent time with other activities; lack of exercise clubs devoted to youth, among others;
  • Environmental dimension: physical barriers to walking; season and weather, namely very high or low temperature or rain; lack of facilities for exercise; high traffic; inappropriateness of the timing of sports classes; lack of personal safety; difficulty commuting and distance from home to sports facilities.
The typology of families is also worthy of attention, as it is a conditioning factor of individuals daily management. Its combination with certain sociodemographic and socioeconomic characteristics can generate distinct predispositions to physical activity practices. For example, more educated parents positively influence their children’s behavior [44].
Several socioeconomic factors cause interferences too [24,31,32,45]. Based on studies conducted in developed countries, the probabilities of participation in some type of physical activity (except for walking) are affected by economic variables: individuals with lower incomes tend to use their free time with sedentary practices, while those with higher incomes tend to practice more physical activity [34]. Thus, higher incomes correspond to lower tendency to practice activities that deteriorate individual health and an increase in activities that produce health improvements, especially when investment is required [41].
Based on the above conditions, participation in physical activity during daily life should be studied [46,47]. Higher working time and time devoted to family obligations tend to decrease the probability of participating in any type of physical activity. Based on a European Union study, gender inequality emerges in terms of total hours worked (paid and unpaid work), with women having a longer working time than men [48]. In fact, in European Union countries, as in Portugal, men spend more time on paid work, but women spend much more on unpaid work [48,49]. Since the practice of physical activity, on working days, occurs during the time of unpaid work, asymmetries between genders naturally arise [50]. Furthermore, time conflicts derived from the difficulty of daily temporal organization, or time squeeze, result in: collapse of work–family temporal division; inability to perform a certain activity due to the impossibility of fitting it into the schedule; and/or accumulation of stress due to the exigence of performing several tasks in restricted time spaces [51,52].
In recent years, it has been observed that individuals and families have more complex structures of mobility and relations between working and non-working times, reflected in more distant and time-consuming commutes, multiplication of journeys with different objectives (work, culture, leisure, etc.), and difficulty in using public transportation, among others [28,52,53,54]. Studies point out that there is an inverse relation between time spent in daily commuting and time spent in leisure and physical activities [29], a pattern that is influenced by sociodemographic characteristics (e.g., income, education levels, the presence of children in the household) [27,55]. One of the consequences, is the increase in the motorization rate to solve the difficulties of discrepancy between public transport availability in time and frequency and the needs of families that need to reduce travel time spent.
Lastly, individuals’ perceptions can condition their attitudes, whether they be self-perceptions of individual conditions (e.g., health conditions, quality of life) or perceptions of the quality of the urban environment (e.g., cleanliness, safety, quality of neighborhood) that surrounds them [23,44,56]. The social safety of an environment is a key factor affecting physical activity. For example, walking as a recreational activity is associated with the aesthetics of the neighborhoods, residential density, the mixture of land uses, safety against crime and proximity to parks [57]. Furthermore, the perception of safety, in addition to an appealing built environment, incites the practice of physical activity [58,59].
Hence, territories and populations are inseparable; thus, urban planning and management should be used to work towards better quality of life and health levels, considering the social, cultural, and economic contexts and the needs of inhabitants [40]. For example, it should be ensured that individuals living in socioeconomically vulnerable areas have similar access and accessibility levels for equipment or areas passable for practicing any physical activity (from low to high intensity level), compared with those living in socio-economically privileged areas [41,60,61]. A collaborative relation between political-administrative entities in a multilevel approach (from local to metropolitan level) should be considered for more sustainable, inclusive, and healthy urban planning [4,31,62,63].
This article has two objectives: (1) identify how the practice of physical activity fits into families’ daily lives; and (2) verify to what extent the practice of physical activity is influenced by the urban model, family composition, and family perceptions. The accomplishment of the two objectives, depends on the answers to these research questions applied to the Lisbon Metropolitan Area (LMA), Portugal:
  • Does an urban occupation model generate distinct practices of physical activity?
  • Is income a differentiating factor when compared with other sociodemographic characteristics of households?
  • Can individual perceptions of oneself and of the neighborhood promotes physical activity practices?

2. Materials and Methods

2.1. Study Design and Sampling

This article presents the results of a survey carried out among the population of LMA, Portugal. Lisbon Metropolitan Area, surrounding the capital of Portugal and located along the Atlantic seaboard, comprises 18 municipalities on two banks separated by the Tagus River, and concentrates 27.8% of the national population (2,863,272 inhabitants in 2019) in 3% of the country’s area, generating a very high population density (950 inhab./km2 in LMA compared with 111 inhab./km2 in Portugal, in 2019) [64]. Overall, in 2019, the working age population predominated (62%), and the proportion of elderly people (65 or more years; 22%) exceeded the young people (until 17 years, inclusive; 16%) [65].
The survey, designed by A. Louro, N. Marques da Costa, and E. Marques da Costa, had the objective to identify the population’s daily life practices to propose healthy urban planning solutions. It was applied between April and September of 2018, in person, with a random selection of respondents that answered anonymously. All subjects gave their informed consent for inclusion before their participation in the study.
The application areas were based on the selection of eleven parishes (Figure 1a) considering the following criteria: distance to Lisbon city center (the capital), the population size representativeness based on a ring system, and specific urban characteristics, seeking to obtain different urban realities (Figure 1b). The collection of primary data was part of A. Louro’s PhD on urban mobility and healthy cities and P. Franco’s master’s thesis on physical activity and healthy cities. The comprehensiveness of the data collected (at thematic and spatial levels) has allowed us to more deeply investigate some subjects, such as the subject of this article.
Using the Raosoft® Sample Size Calculator tool and considering the total of 1,147,775 private households (the statistical concept used by the National Institute of Statistics, Portugal) living in LMA in 2011 [64], a minimum of 385 surveys was defined for a confidence level of 95% and a margin of error of 5%. In total, 417 inquiries were applied, 410 were considered valid, and 7 were withdrawn as they were considered incomplete, resulting in a confidence level of 95.45% and a margin of error of 4.90%. This set of surveys represents a total of 1006 individuals (Table 1).
The survey allowed the collection of: (i) the characteristics of all elements of the household; (ii) the demand patterns for goods, services, and activities in the context of their daily lives (Where? When? How? How often?); and (iii) individual perceptions of quality of life, health, and quality of the neighborhood. It was in the context of the demand for goods and services that information on physical activity practices was collected, namely for specific activities—gym, swimming, walking/trekking/hiking, and cycling. These four activities were chosen for their diversity in terms of associated cost, the need for specific equipment and/or infrastructure (e.g., indoor vs. outdoor), their association with the possibility of executing activities with diverse levels of physical intensity, and their status as common activities in urban areas. It should be noted that this study does not consider the factors “duration of physical activity” and “level of intensity of physical activity”.

2.2. Data Processing and Statistical Analysis

From the survey applied to families in the LMA, descriptive and bivariate analyses were processed as data analysis. To synthesize the diverse collected data, the research team proposes a classification of profiles of families based on the practicing of physical activities, as well as proposing a scale of intensity of physical activity practices based on the diversity and frequency of activities practiced. Hence, the study follows the following steps:
  • Descriptive and bivariate data analysis to understand the physical activity practices of the families, namely the characteristics of the demands (Which activities are developed? Where are the practices? When do they occur?);
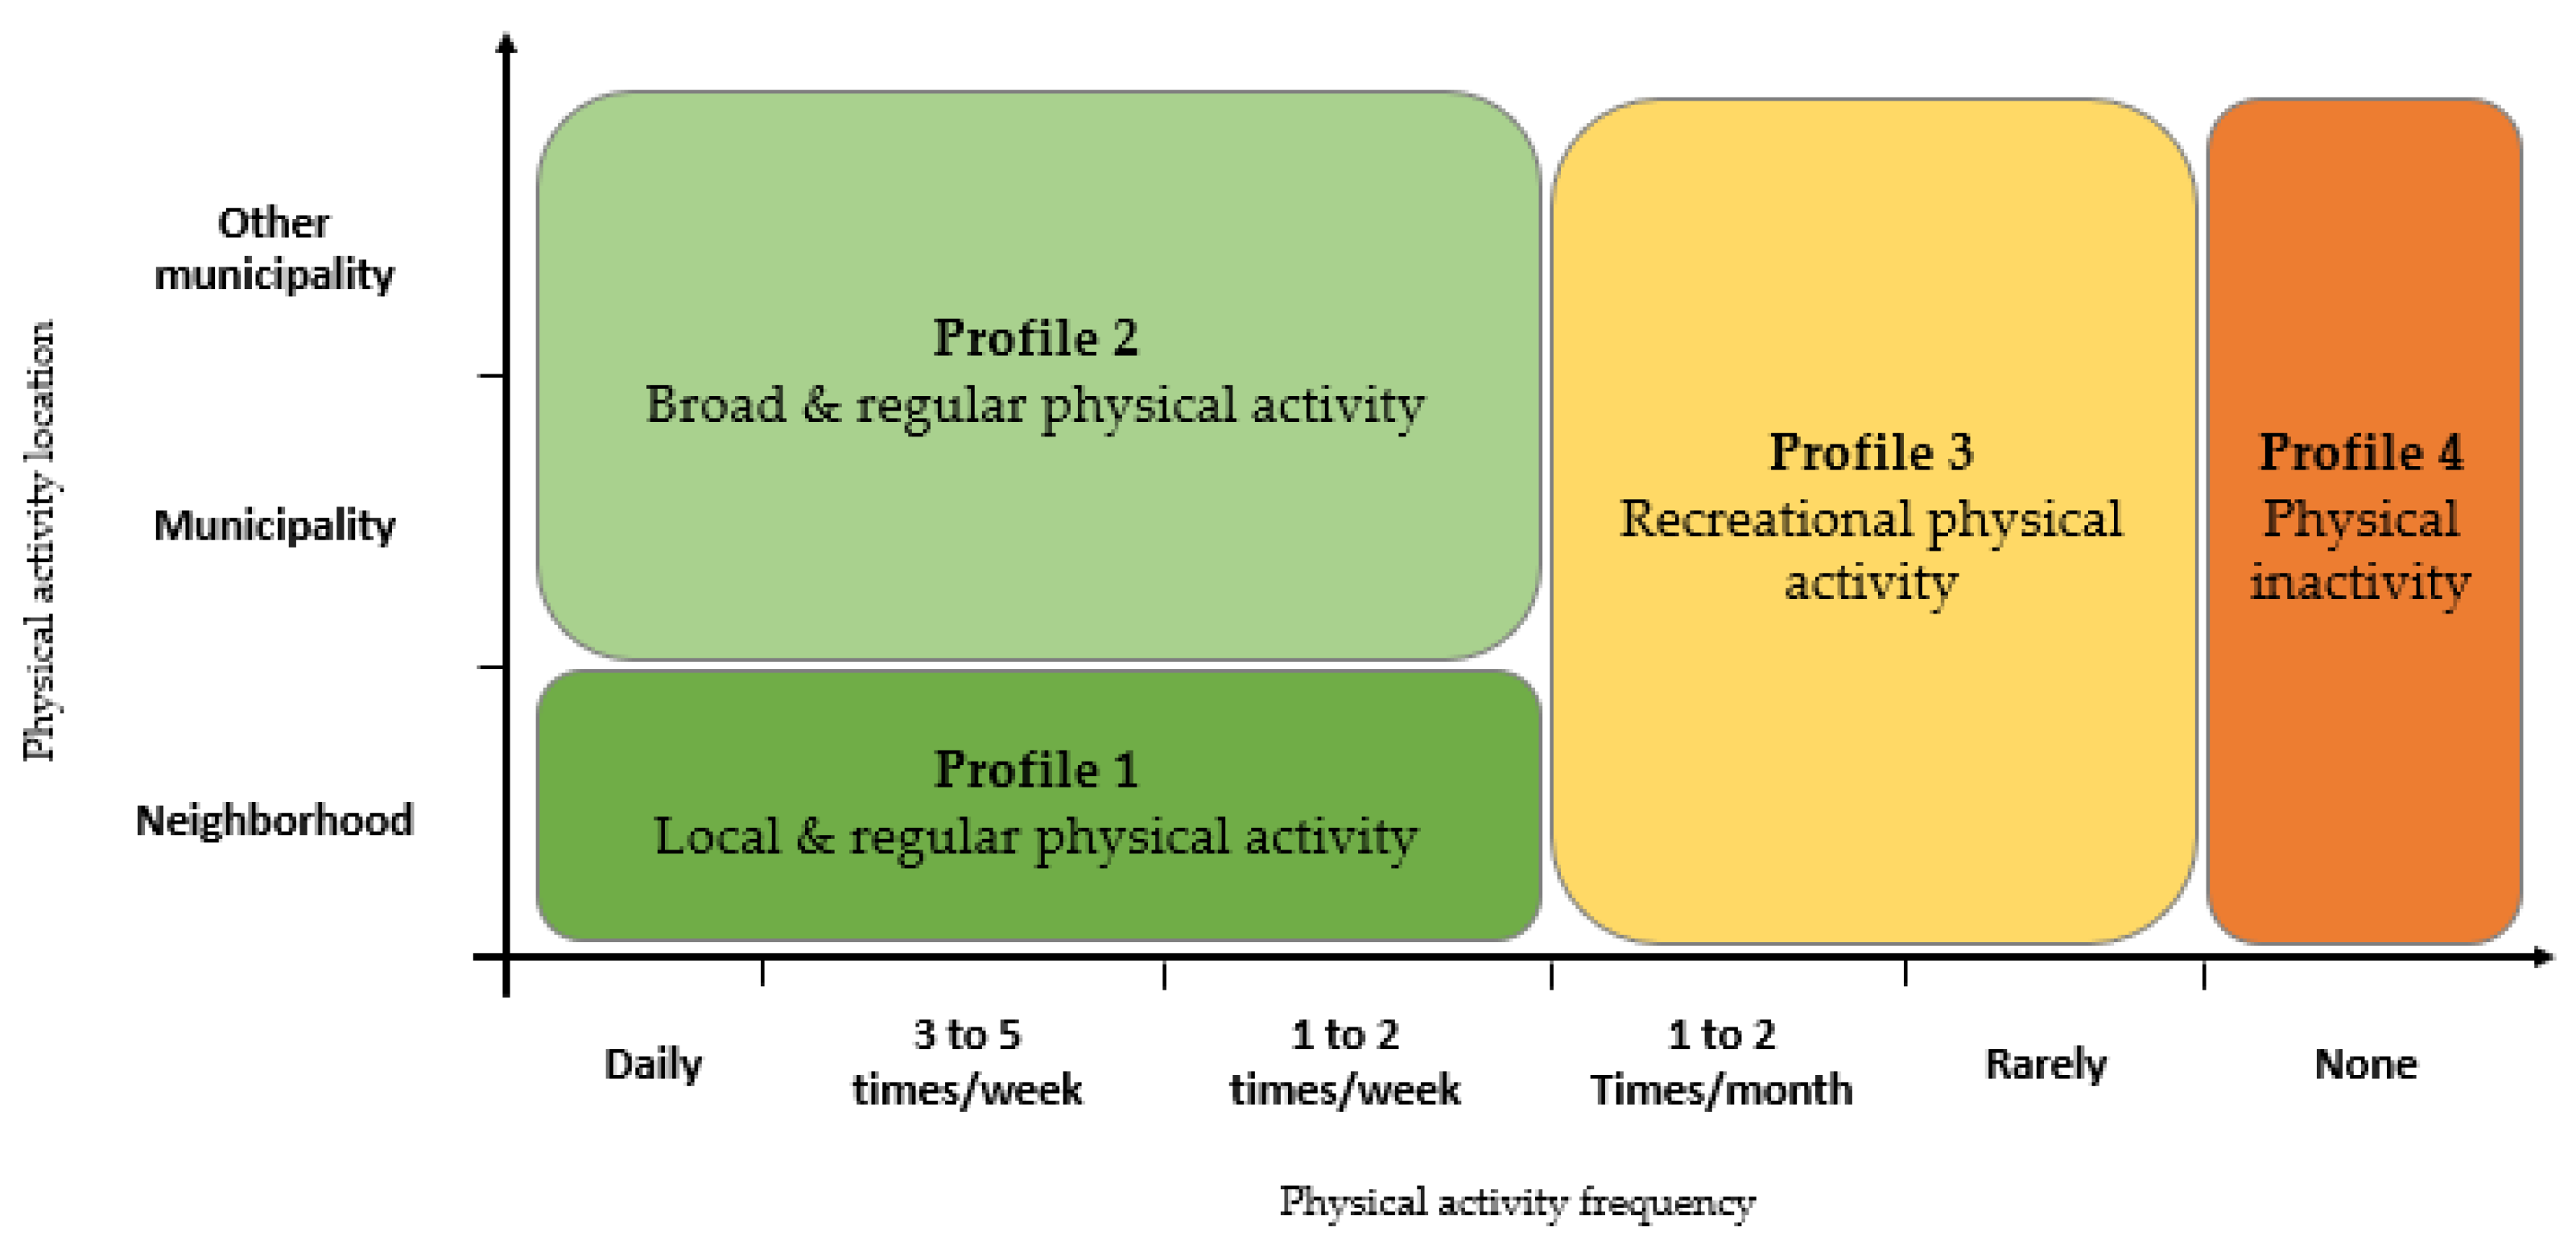
  • Definition of four physical activity profiles of families (based on frequency and location of the practice of each physical activity in study) and analysis of the profiles’ distribution by each physical activity. Physical activity profiles of families followed the scheme shown in Figure 2:
    • Profile 1. Local and regular physical activity—representing families that practice a certain activity at least once a week in the neighborhood of residence.
    • Profile 2. Broad and regular physical activity—representing families that practice a certain activity at least once a week in the municipality (excluding the neighborhood of residence) or in another municipality.
    • Profile 3. Recreational physical activity—representing families that practice a certain activity with low regularity (maximum of twice a month);
    • Profile 4. Physical inactivity—representing families that do not practice a certain activity at all.
  • Definition of the intensity level of physical activity of families. The intensity level is calculated through the average of the weight given by the physical activity profile of each family for every physical activity. The weights are as follows: 2 points for Profiles 1 and 2; 1 point for profile 3; 0 points for profile 4. The level of intensity is thus between 0, representing families that do not perform any of the physical activities, and 2, representing families that perform the four studied activities (gym, swimming, walking, and cycling) frequently (twice a week minimum). This produced four levels of physical activity intensity:
    • Level 1. Totally inactive family (0)—representing families that practice none of the four activities;
    • Level 2. Slightly active family (0.25 to 0.5)—representing families that practice some activity but not in a regular manner;
    • Level 3. Moderately active family (0.51 to 1.25)—representing families that practice some activities in a regular and/or in a recreational manner;
    • Level 4. Very active family (1.26 to 2.0)—representing families that practice several of the studied activities in a regular manner.
  • Bivariate data analysis of the relationship between the previous profiles and intensity of physical activity level of families and various territorial and individual specificities:
    (i)
    the urban model of the neighborhood, addressing the importance of built environment for physical activity practices and the uttermost importance of this aspect to planning and policymakers [36,66,67];
    (ii)
    the characteristics of the household (e.g., sociodemographic, and socioeconomic characteristics, following the many works that account for aspects such as economic status, family dimension, and others as major factors affecting physical activity practices [34,41,45,67];
    (iii)
    individual perceptions of oneself and of the urban environment, building on the notion that perceived realities impact physical activity habits [23,57].

3. Results

3.1. Physical Activity Practices in the LMA

3.1.1. Physical Activity in the Daily Life of Families

Of the 410 interviewed households in the LMA, 51% assumed the practice of some kind of physical activity (independent of the member of the family), with “walking/hiking/trekking” being the most evident (23%), followed by the gym (19%) (Table 2). This means that none of the members of half of families practice any of the studied physical activities.
The frequency of practice is quite varied, with 13% declaring performing physical activity daily and 17.6% declaring a very regular practice (3 to 5 times a week); walking prevails (except commuting walking that was excluded from the study); about 42% register physical activities once or twice a week, while the remaining 28% assume that they do physical activity with “no regularity”.
It is especially in the vicinity of residence that physical activity is carried out (67%). A second option is in the municipality of residence (22%), largely due to a matter of personal taste or proximity to home. A small percentage of respondents go to another municipality, justified by the demand for very specific areas (e.g., forest areas, walking trails). Considering the transportation mode, the survey results confirm the positive contribution of soft modes in the search for places to practice physical activities (60%) with a large contribution to sustainable development and health. In contrast, there is a still-relevant use of individual transport (28%), benefiting from its speed, comfort, and flexibility, even for short distances.
Therefore, it is important to understand how physical activity is present in the daily lives of families. It is observed that practices are differentiated between the days of the week (e.g., prevalence of the search for gyms during the week and the use of bicycles for non-commuting purposes on the weekend, while swimming and walking/trekking/hiking have balanced demands between weekdays and weekends; Figure 3). The frequency of activities is also variable: the search for a gym or swimming pool is quite regular, with visits predominating once or twice a week. On the other hand, walking presents the highest percentage of daily activity (both during the week and weekends). Although cycling registered a less regular demand (1 to 2 times a month or rarely), it appears with some relevance in the weekend.
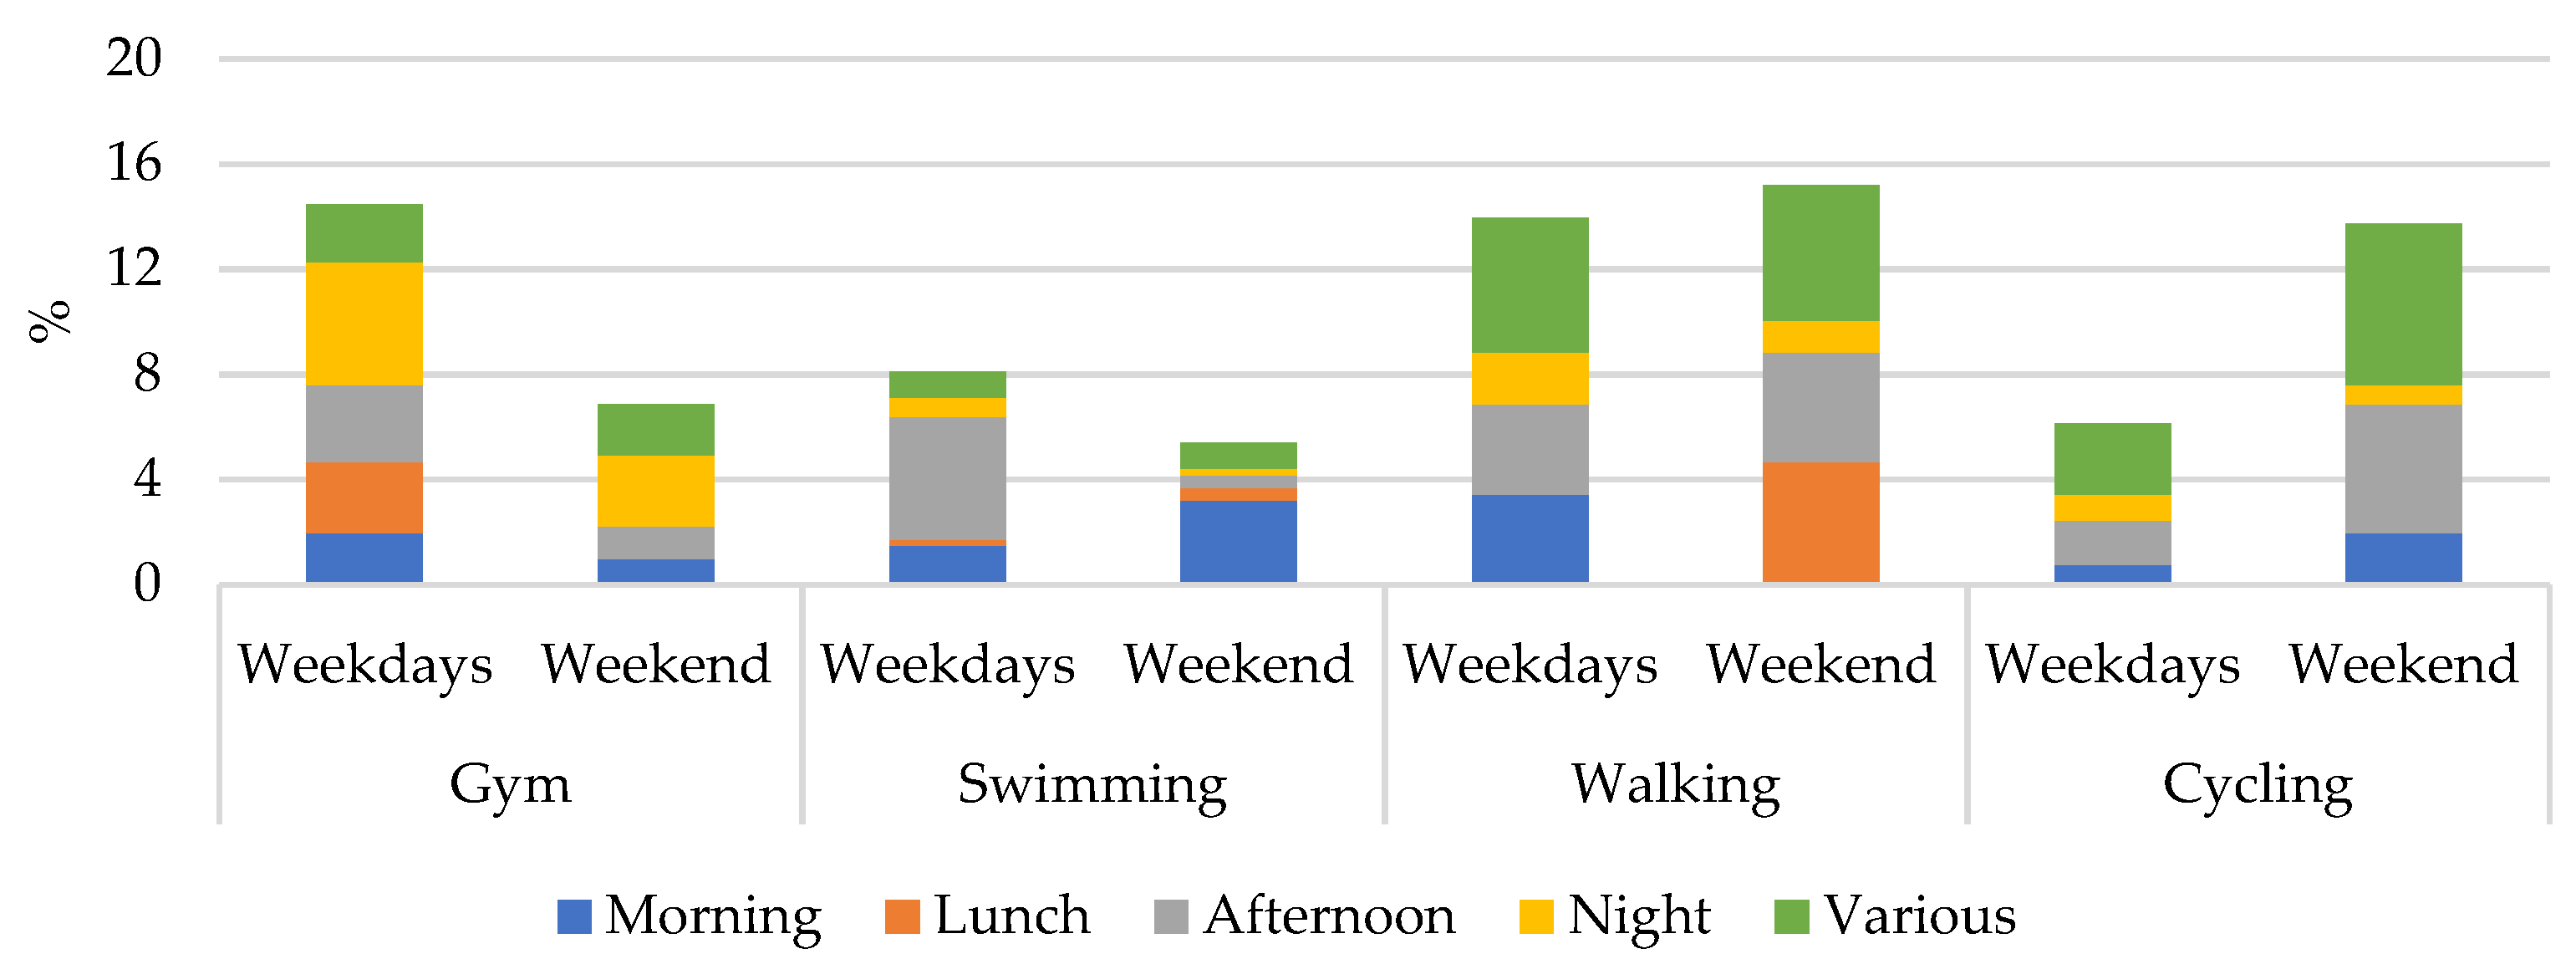
The distribution of activities in the different periods of the day is also distinct (Figure 4). The period selection depends on several factors—the work situation of individuals, the constraint of equipment, and green spaces’ schedules, among others. For example, the search for gyms is highlighted at lunchtime on weekdays (especially as part of working day), but also at night. Swimming is especially popular in the afternoon on weekdays and in the morning on the weekend. Regarding walking and cycling activities, demand is highlighted in the afternoon, regardless of day of the week, and, unlike previous activities, there is a considerable proportion of families in which demand is not just for only one period of the day, but several periods, justified by the reduced schedule limitations in carrying out these activities.

3.1.2. Physical Activity Profile and Intensity Level of Families

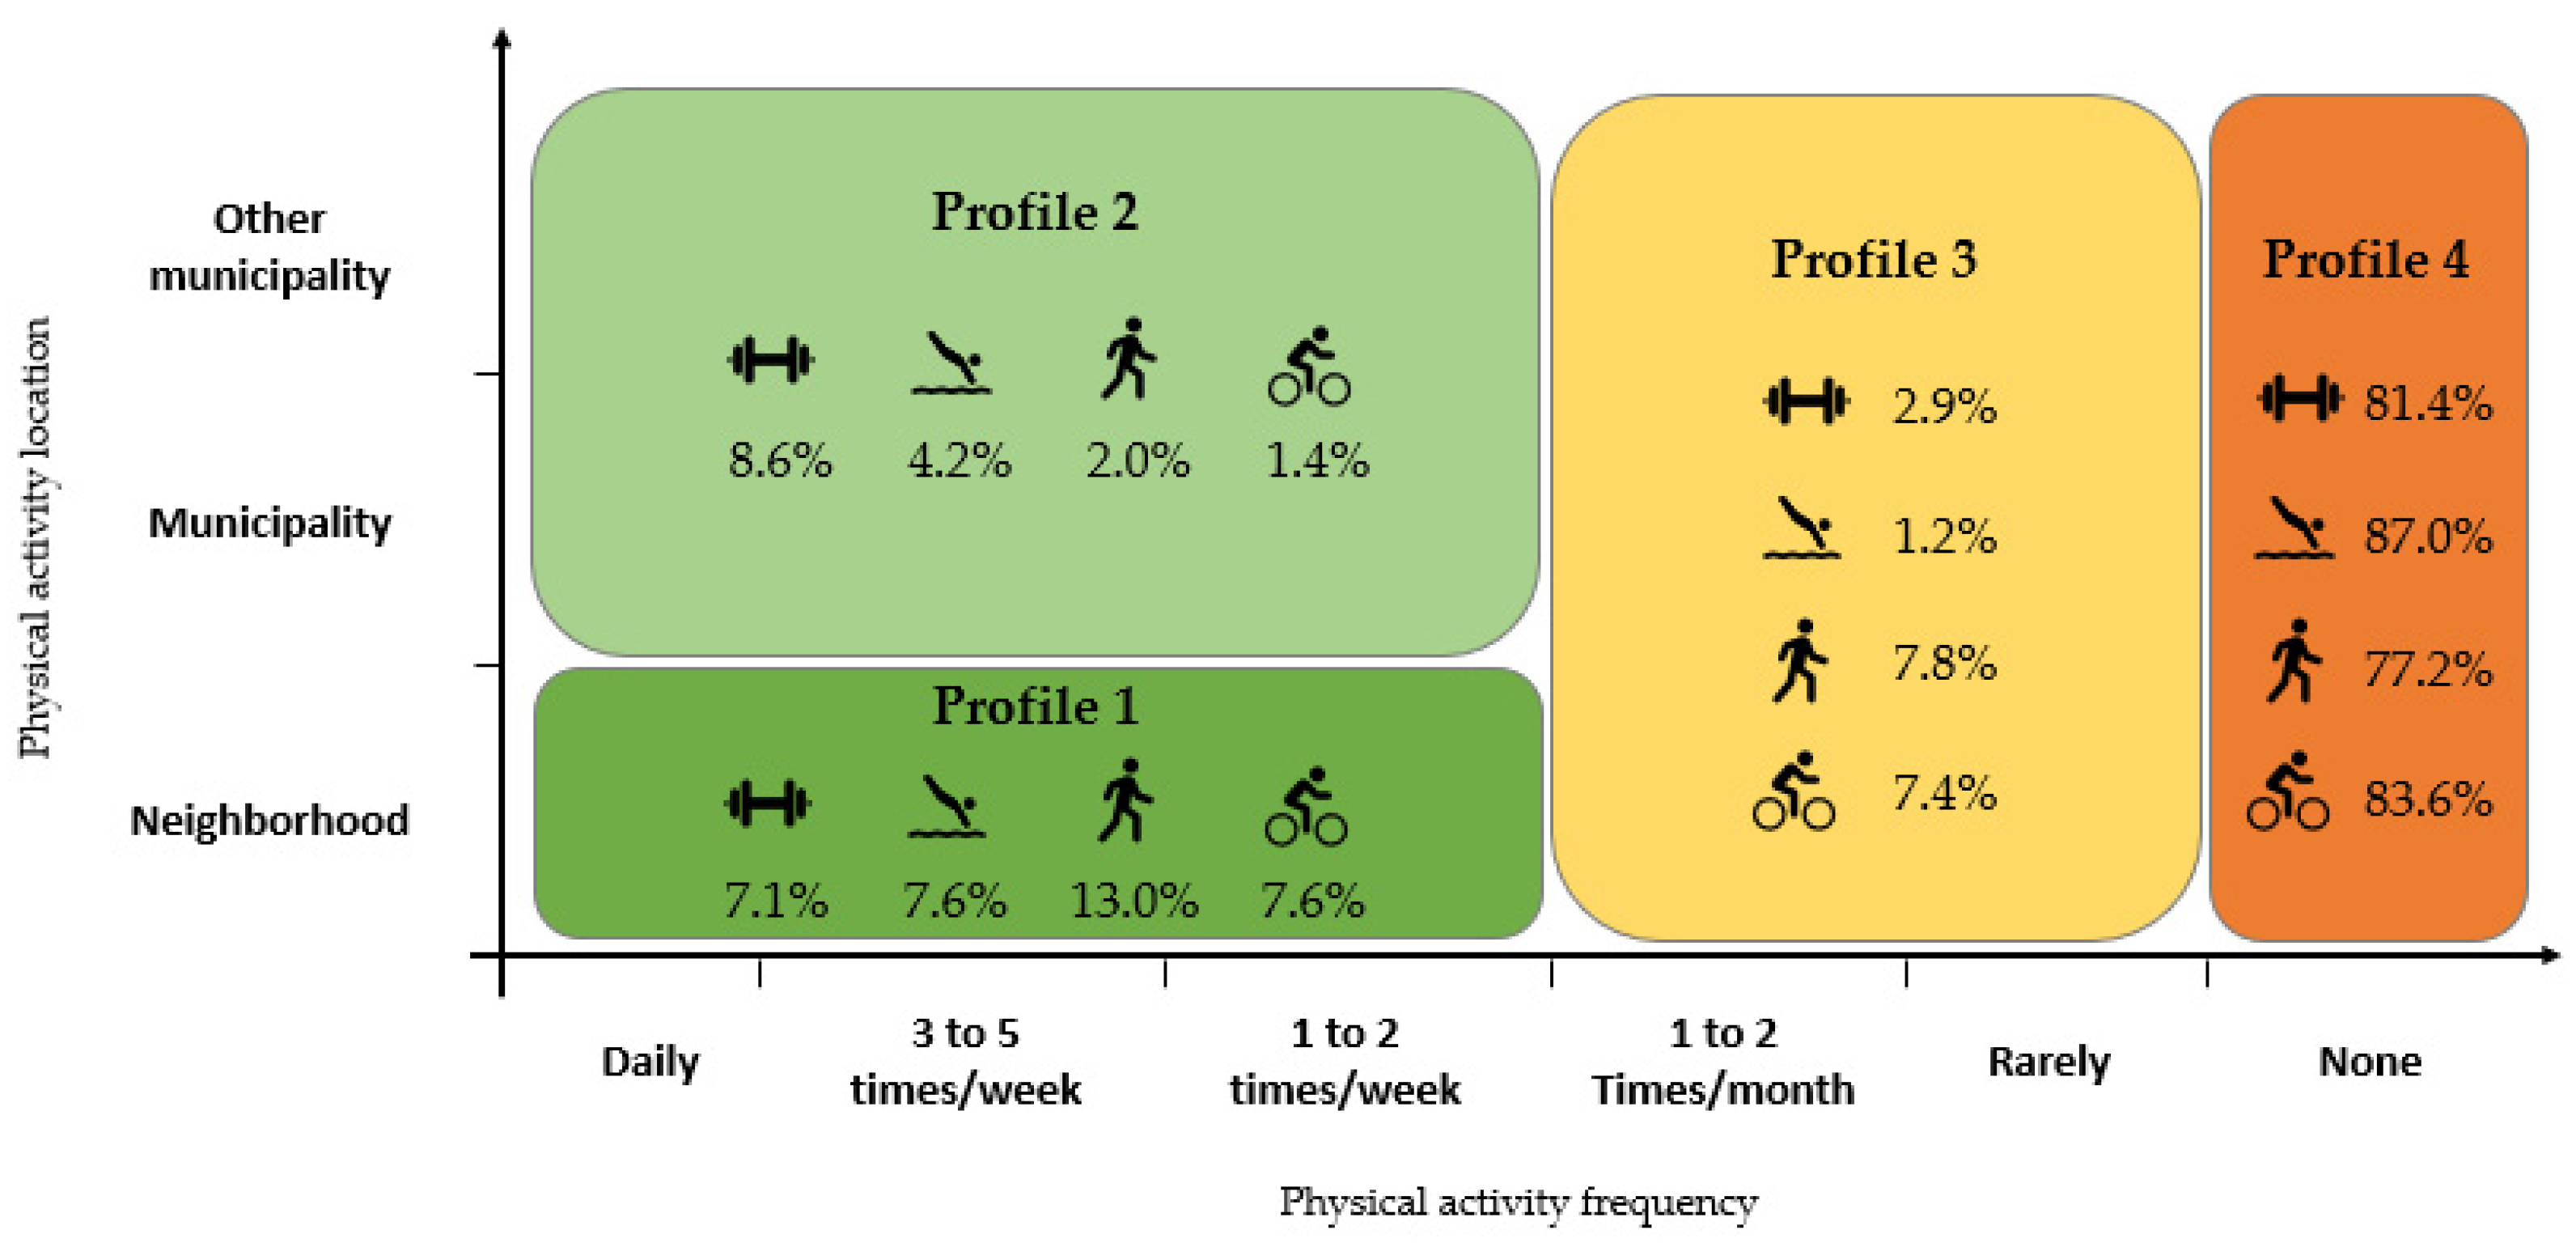
Based on the frequency and location of physical activity practices in LMA, four profiles of families were designed and analyzed for the four activities under study (Figure 5). In all activities, the most evident was profile 4 “Physical inactivity”, which is associated with families that do not perform a certain activity at all, with values between 77% of families in the case of “walking/trekking/hiking” and 87% in the case of “swimming”.
Next is profile 1 “Local and regular physical activity”, representing families that practice at minimum one activity at least once a week in the neighborhood. This is particularly evident when referring to “walking/trekking/hiking” (13%) and, in the remaining activities, between 7.1% for “gym”, 7.6% for “swimming”, and 7.6% for “cycling”.
The remaining two profiles have relatively small representativeness, with some highlights. For Profile 2, “Broad and regular physical activity”, which requires practicing a certain activity at least once a week beyond the neighborhood, the search for “gyms” and “swimming pools” stands out (8.6% and 4.2% of families). Profile 3, “Recreational physical activity”, represents families that practice a certain activity with low regularity (maximum twice a month). It corresponds especially to the practice of “walking/trekking/hiking” (7.8%) and “cycling” (7.4%).
The presented intensity level of families’ physical activity intends to synthetize the behavior of families related to the four studied activities (Figure 6). Combining the physical activity profiles of families, we find that almost half are “Totally inactive families” (49%), as none of the individuals practice any of the four studied activities at all. More than two-thirds are “Slightly active families” (37%), as they practice only one activity in a regular manner or several on a recreational basis. The remaining families present a more dynamic daily life, with 11% as “Moderately active families” and only 3% as “Very active families”, that is, practicing at least three to four activities on a regular basis.

3.2. Relation between Physical Activity and Urban and Individual Characteristics

Based on the previous literature review, the urban model could be one of the key factors in promoting physical activity in the daily life of families. As presented in Section 3.1, our sample corresponds to a proportional distribution of surveys based on metropolitan rings. Hence, the results are analyzed based on these rings.
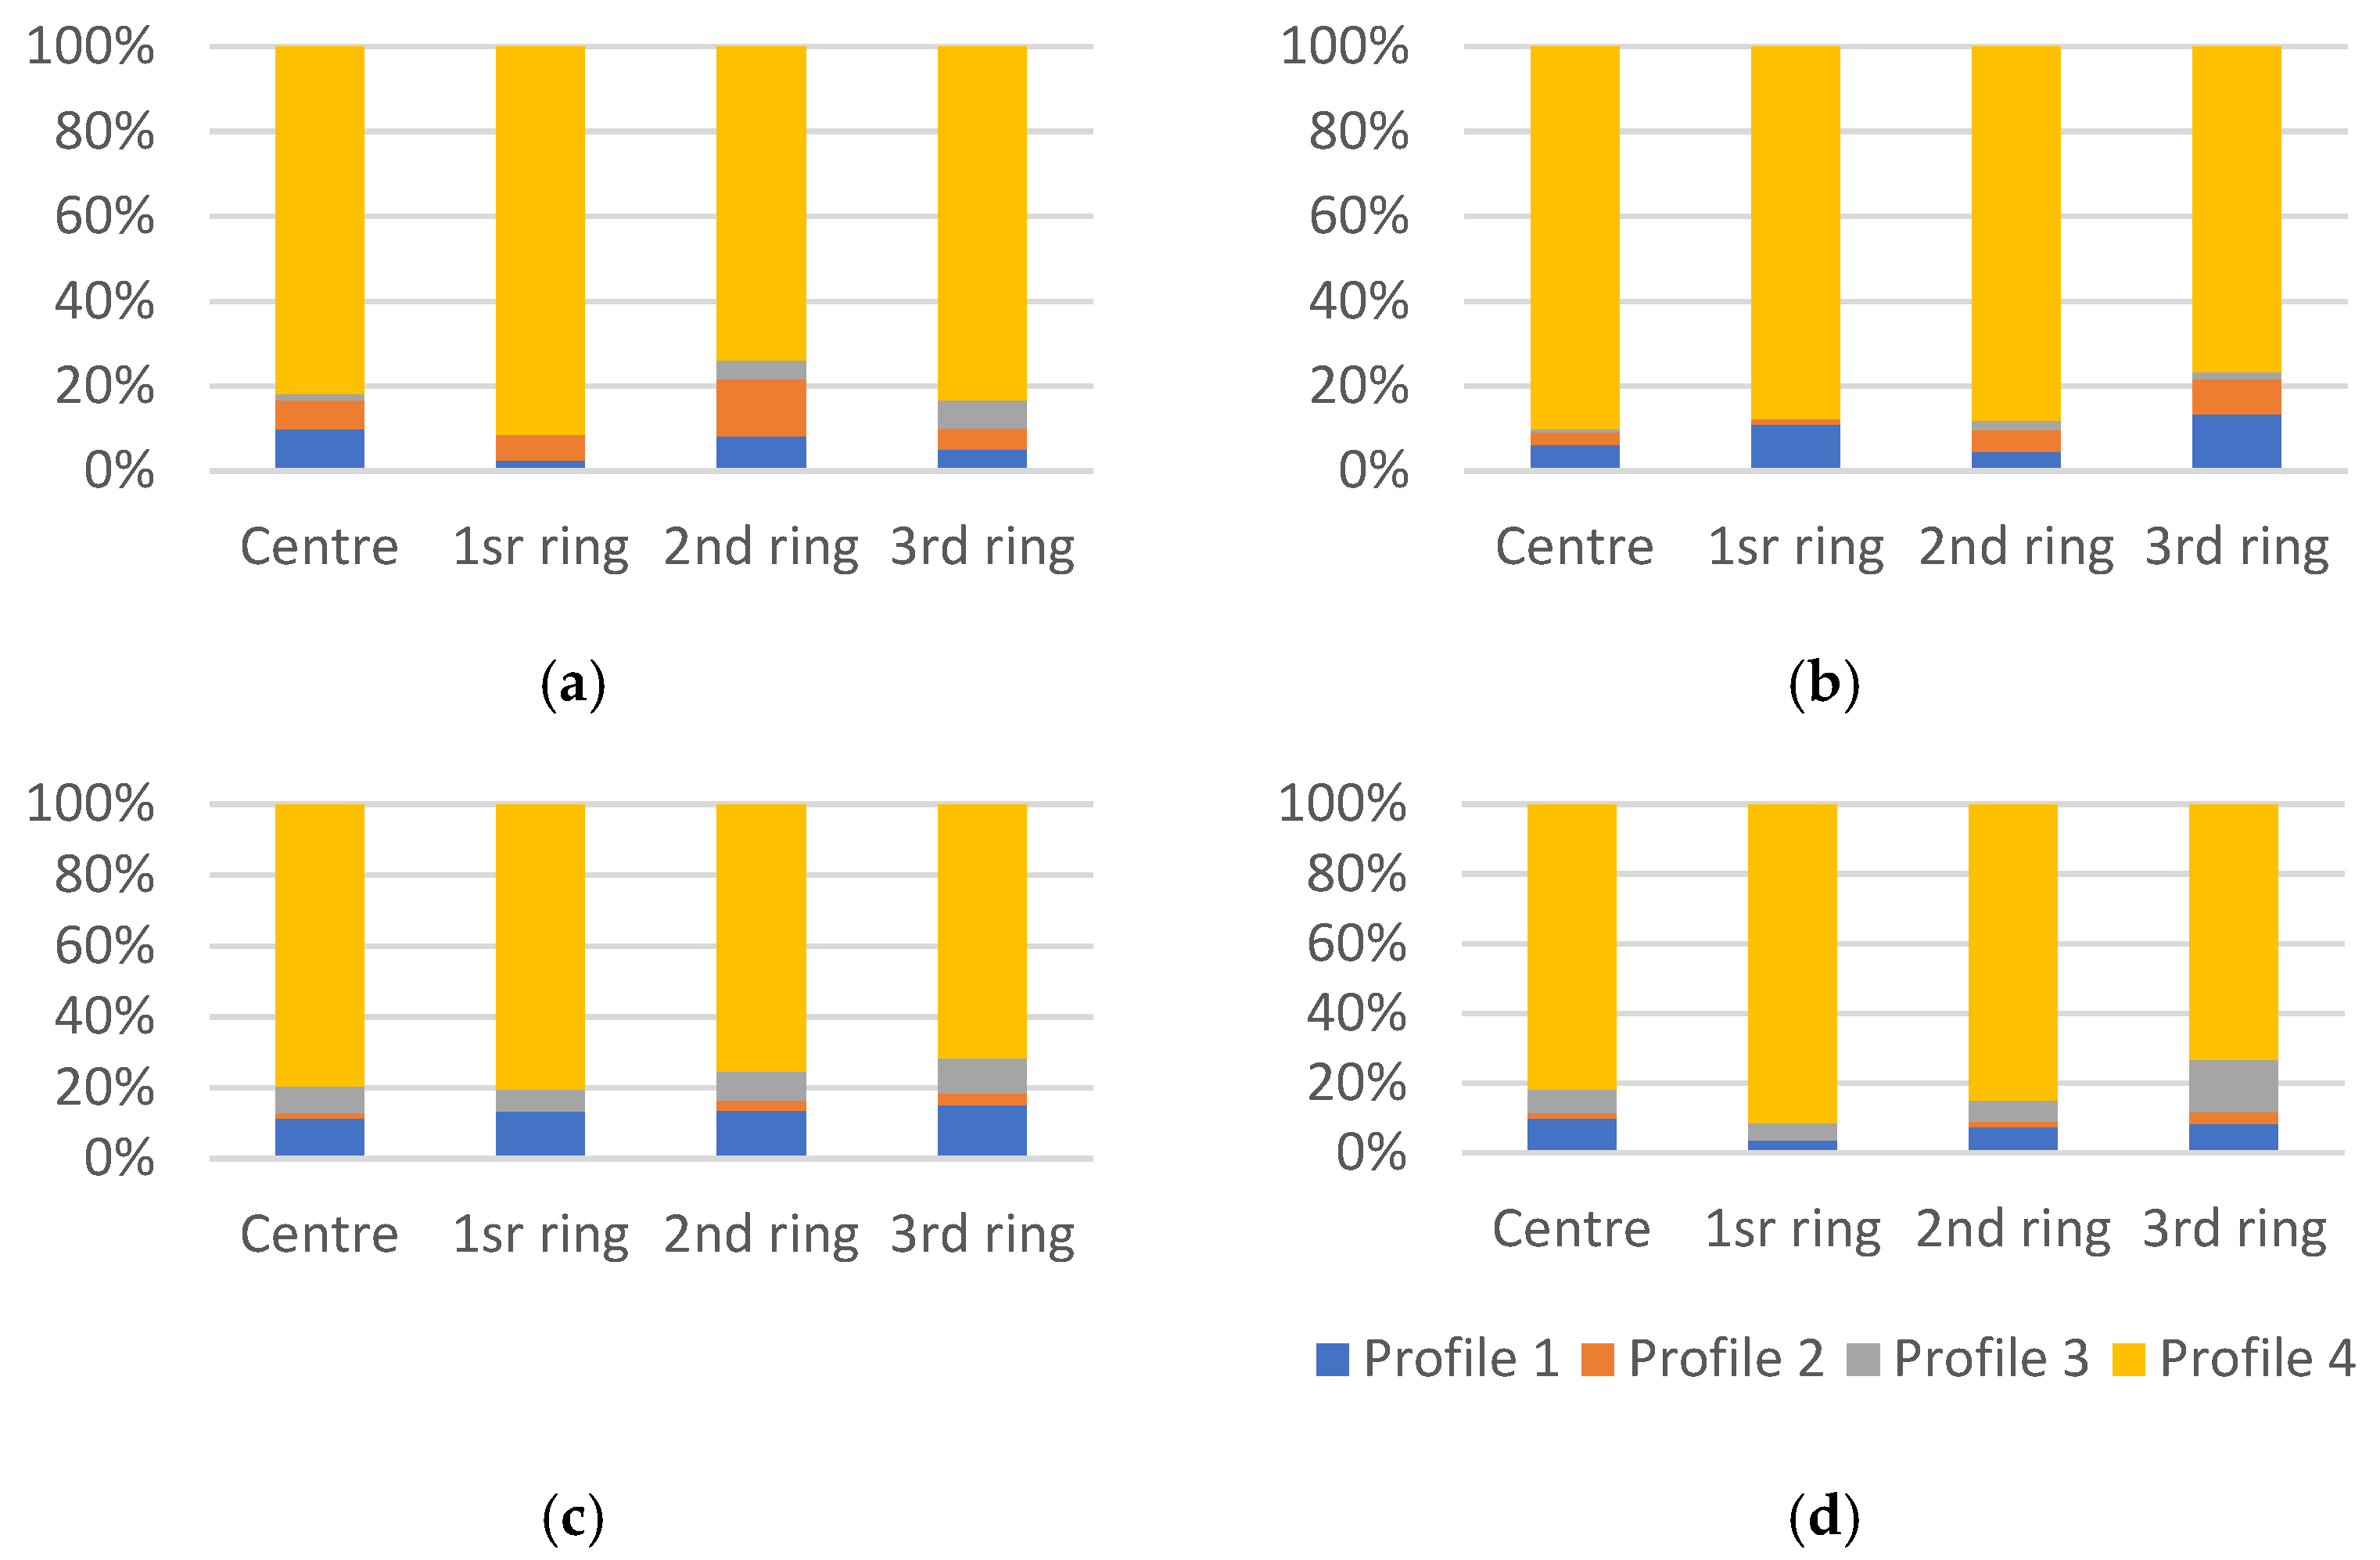
The search for the physical activities under study by metropolitan rings reveals different patterns (Figure A1). For example, the demand for gyms stands out especially in the second ring, where the “Broad and regular physical activity” family profile predominates; followed by the search in the Center, where the “Local and regular physical activity” profile prevails. The demand for swimming pools and walking increases for the peripheries; while cycling registered an important share in the Center. In general, the proportion of families that perform these activities, is relatively similar between rings, highlighting the neighborhood proximity factor and equipment’s availability.
Analyzing the intensity level of families’ physical activity by ring of residence (Figure 7), and assuming that the urban density decreases from the city of Lisbon, the center of the LMA, to the peripheries, we see that in the first ring, representing the suburbs of Lisbon city, there is a greater proportion of “Totally inactive families” (about 57%), contrary to the third ring, which is farther from Lisbon and has a peri-urban profile (40%). It is in the two most distant rings (second and third) that there are more “Very active families” (5% and 8%, respectively), while the proportion of “Slightly active families” is similar among all rings.
On the other hand, household characteristics based on family (e.g., ages and sex of each member, income, health condition, among others) are also relevant elements too.
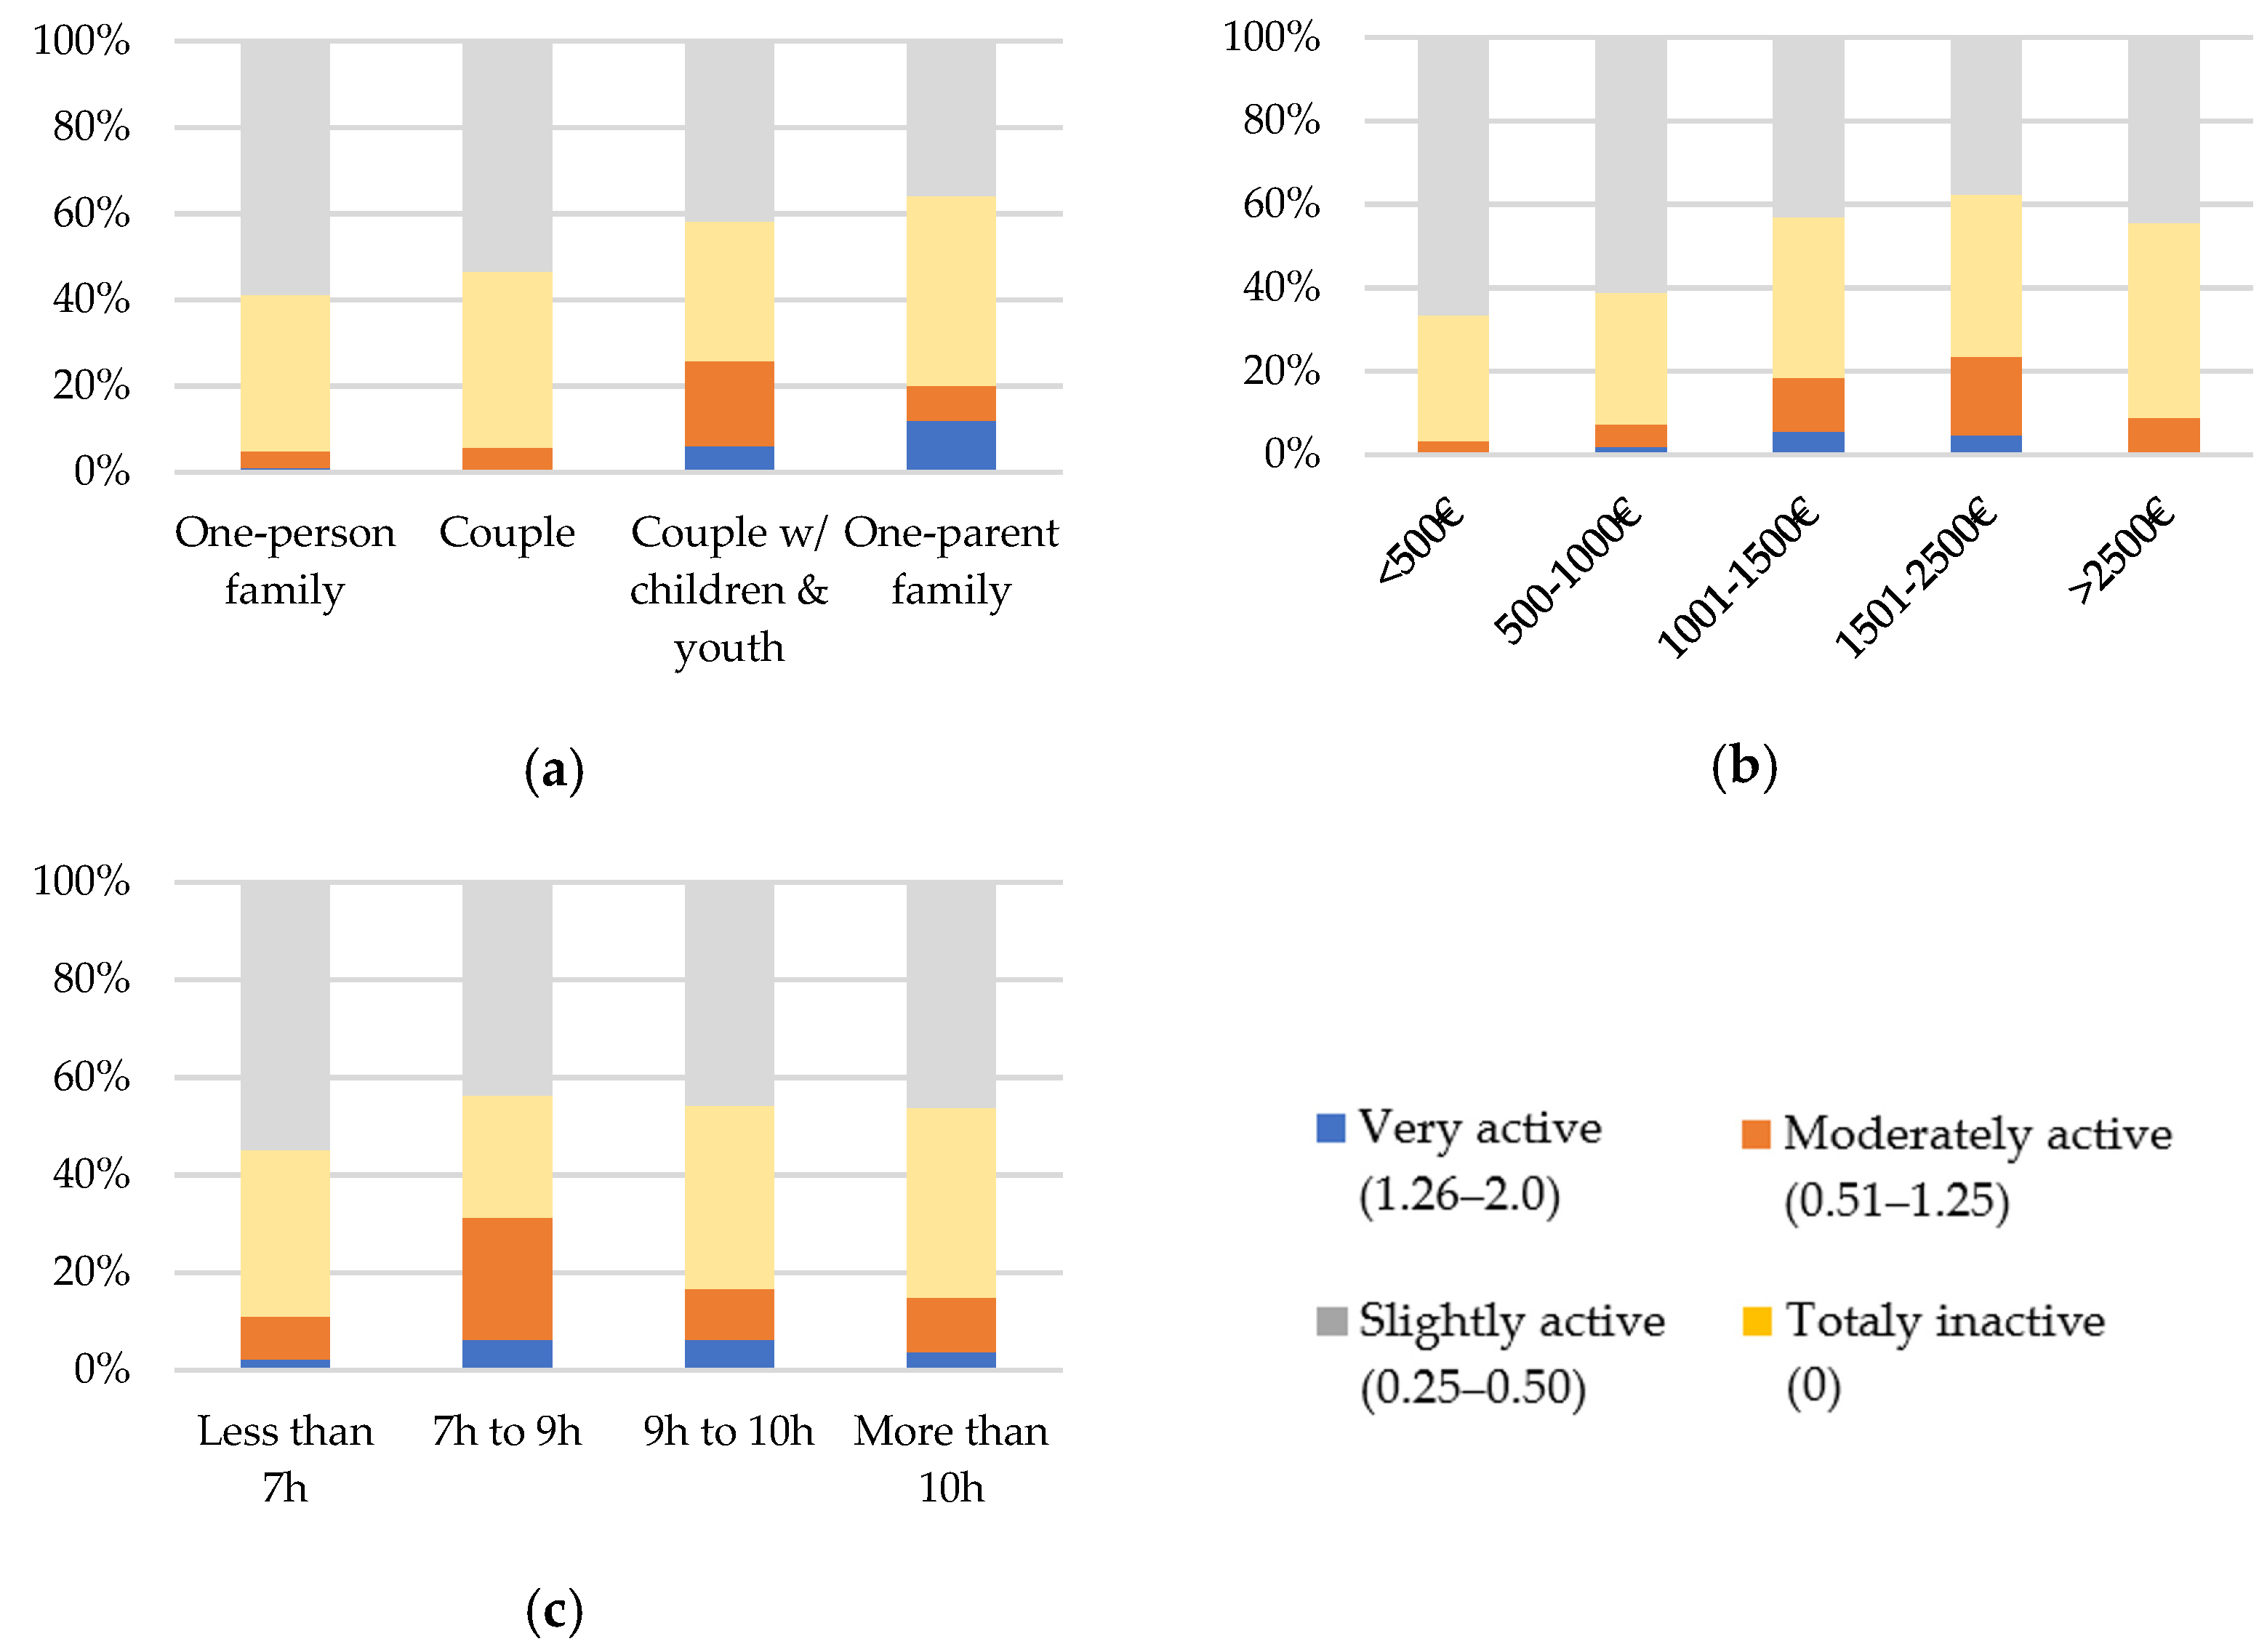
It was observed that the existence of children and young people in the household is a major factor that enhances the practice of physical activities, either as intense physical exercise or as leisure/entertainment activity (Table 3). Conversely, families with one or more elderly people show behaviors that penalize physical activity. Families with only one individual showed a lower propensity to practice physical activity (41% of these families claim to practice any of the activities studied, regardless of their frequency), unlike families with children, whether the family contains a couple (58%) or a single parent (64%) (Table 4). The search for the various physical activities under study by family typology is also differentiated. The existence of children and young people in the family leads to more accentuated swimming practices (22% of couples with children, 28% of one-parent families) and cycling (30% of couples with children, 24% of one-parent families). The one-parent families’ predilection for walking/trekking/hiking as physical activity is also noteworthy (33%), along with the search for one-person families (21%) and couples without children (26%). Finally, there is some balance in the search for gyms between the various types of families, with a slightly higher prevalence in couples with children (22%).
As was seen partially before and is evident in the synthetic intensity level of physical activity, the family typology revealed to be decisive: families with children and youth (1) are more likely to practice any physical activity on a regular or recreational basis, and (2) represent higher proportions of families with a “Very active” physical activity levels (Figure 7).
Households with higher incomes demonstrate more active physical activity levels (Figure 8), enhanced, for example, by the ability to purchase material and pay fees, for example, for the gym or swimming pool. It is in the intermediate classes of income that the “Very active” and “Moderately active” families are seen more often.
The number of hours spent outside the home for work by the respondent is not strongly correlated with the practice of physical activity by the family (Figure 8), as it was the group of respondents who spent fewer hours outside the home that had lower rates of active practice. Despite the fact that time spent away from home for work could be a constraint to the practice of physical activity, it is noteworthy that some of the practices are embedded throughout the day (e.g., practice at lunchtime near the workplace), as was seen previously in Section 3.1.
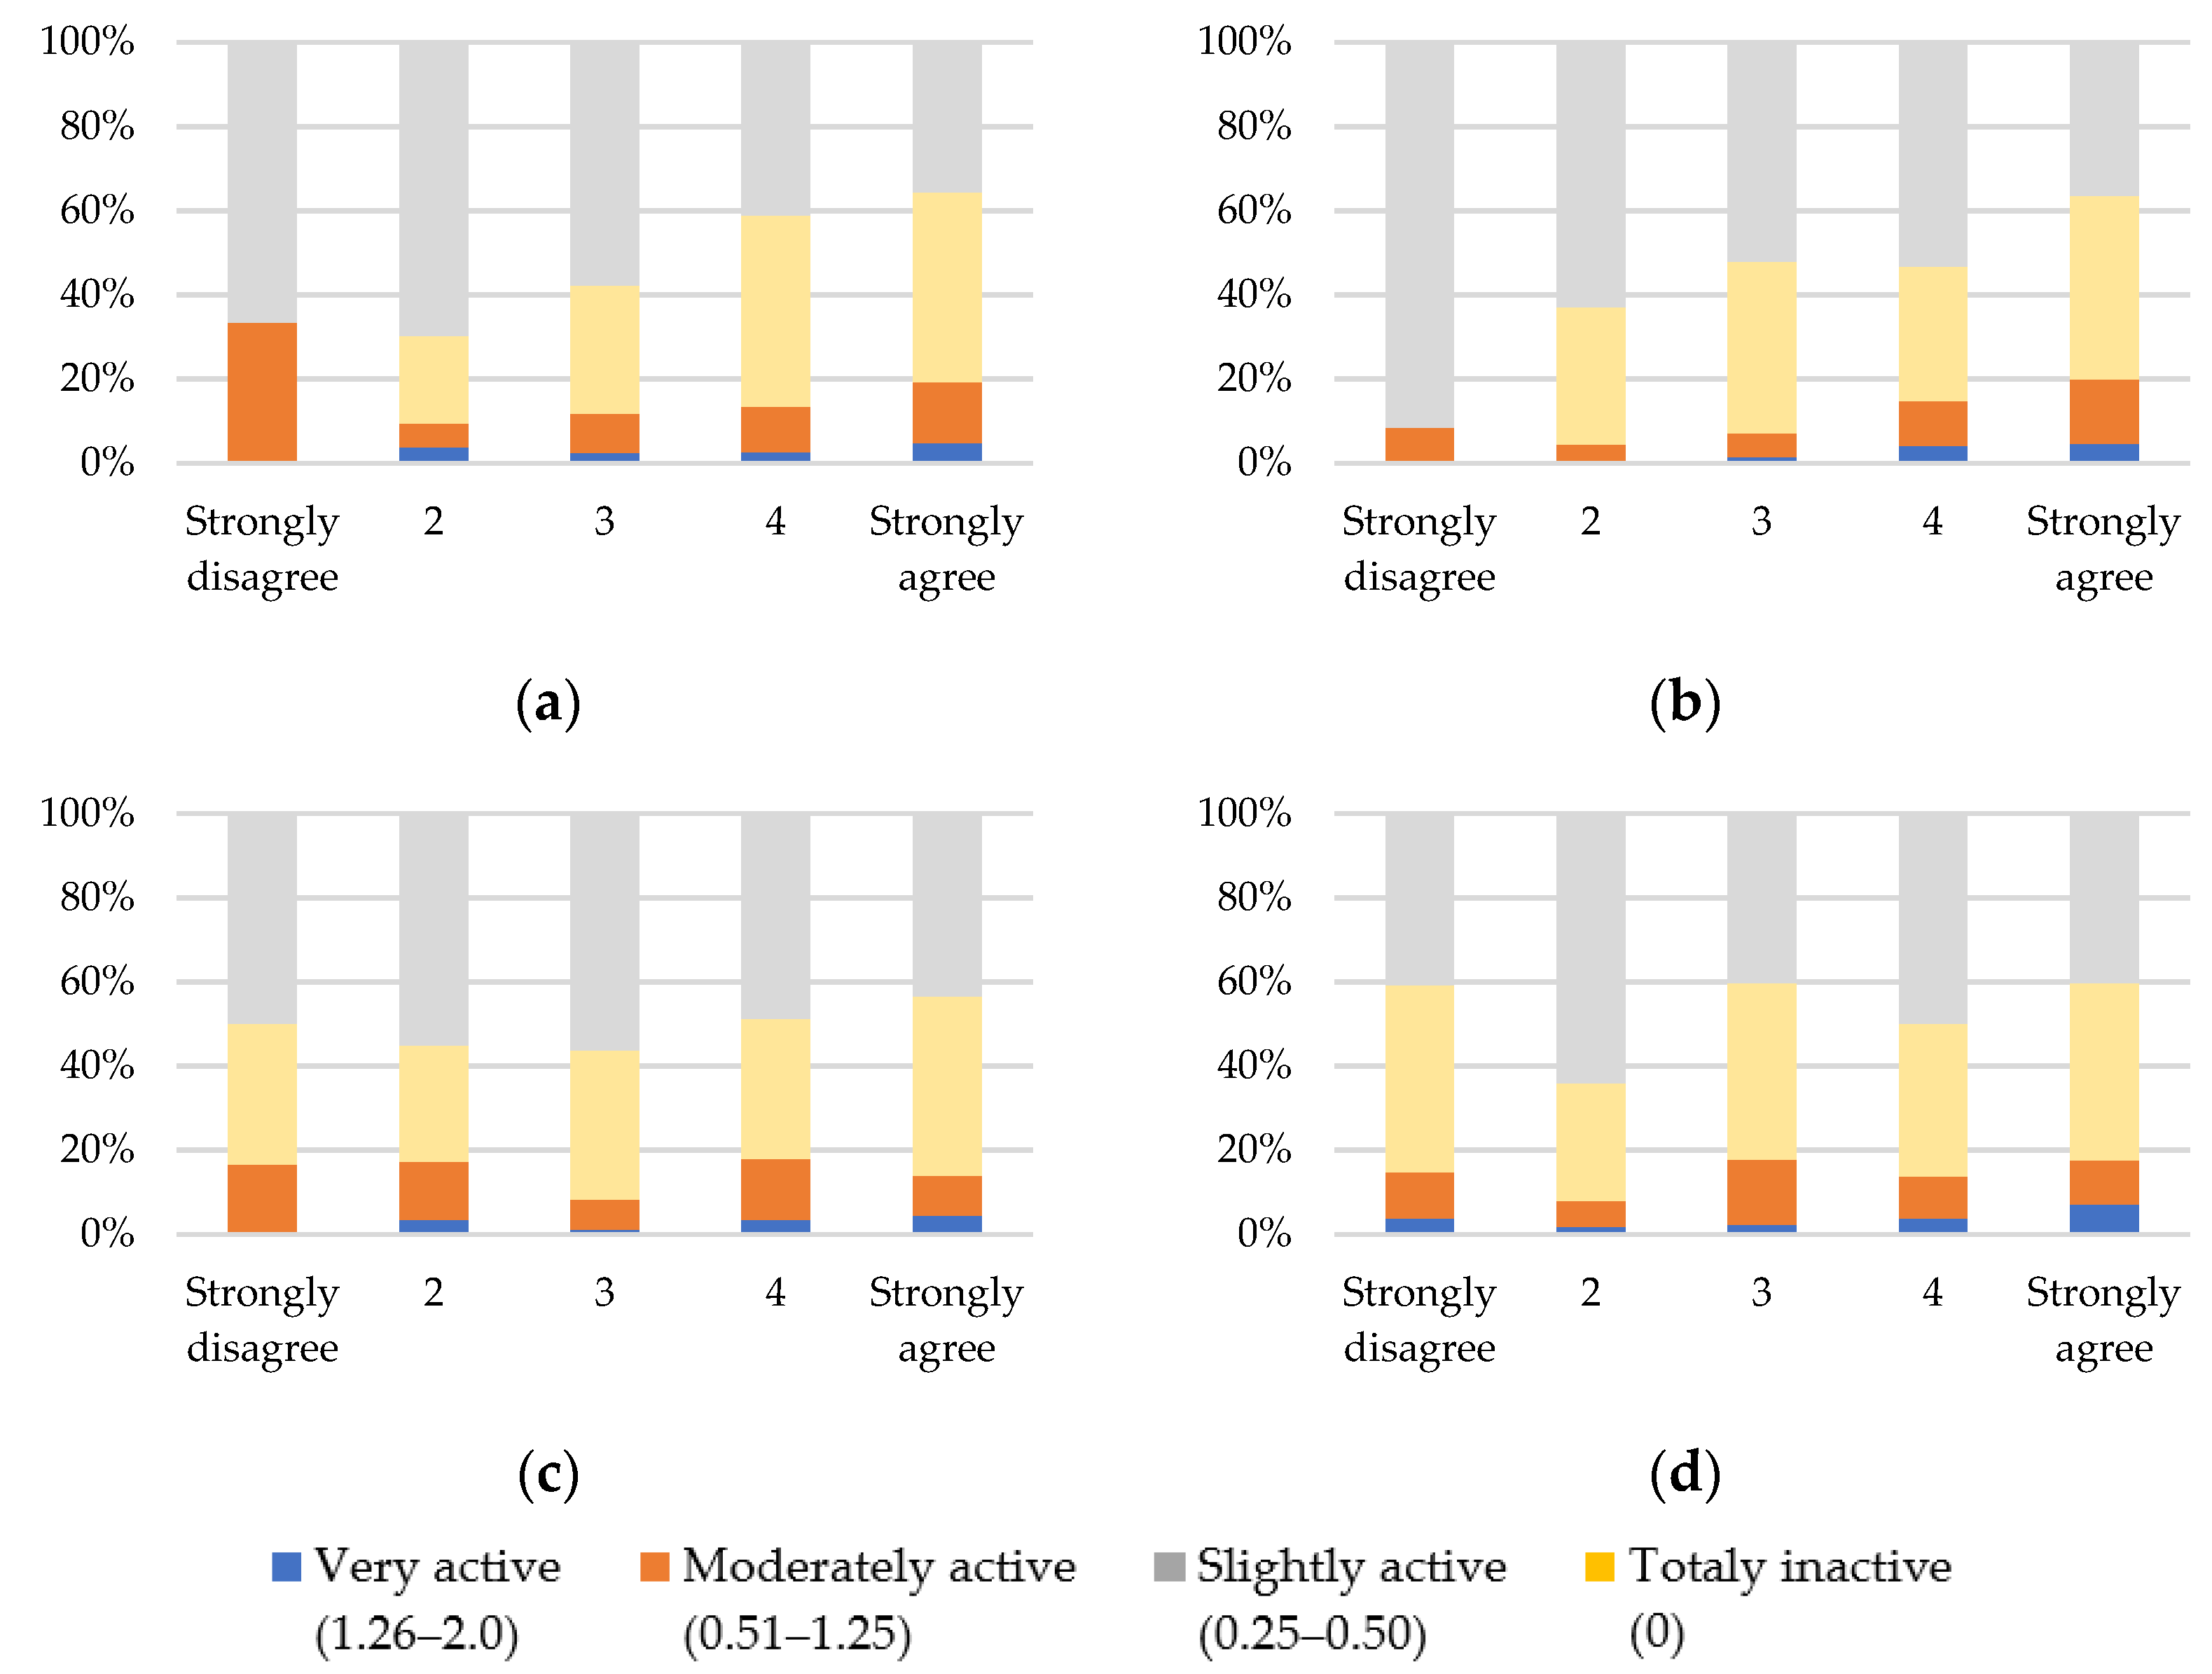
Lastly, perceptions of some individual or territorial aspects can influence the appetence for the practice of physical activity. For example, the self-perception of a good quality of life is revealed to be a positive influence factor on the practice of the analyzed physical activities (Figure 9a,b): there is a higher proportion of families that execute physical activity (even at a slightly active level) within the groups that consider themselves to have a good quality of life, where the “Very active” families emerge. This phenomenon is even more evident when related to self-perception of health level, finding the same pattern: individuals who self-assessed as “healthy person” represent families more likely to practice physical activity.
The different levels of likelihood of living in the neighborhood did not reveal a direct connection with the activity level of families (Figure 9c,d). However, if we deepen the analysis by type of activity, this is a positive influencing factor for walking or cycling, denoting greater proportions of families who carry out these activities and enjoy living in their current area of residence. This evidence is not verified in the case of the search for gyms and swimming pools. As previously mentioned, the feeling of safety for walking or cycling around the neighborhood of residence turned out not to be an influencing factor in the practice of activities, especially walking or cycling, with which it has a direct connection.

4. Discussion

The high physical inactivity in LMA contradicts the targets of the National Program for the Promotion of Physical Activity, which proposed one third of adults exercising/sporting frequently and 70% of adolescents practicing physical activity at least three times a week [21].
Scheduled activities, e.g., swimming or hydro gymnastic classes [68], as well as other paid activities, result in a more regular practice, although a higher weekly frequency of activity at gymnasiums is correlated with a perceived lower importance of price [31], a perception that was reinforced by emergent low-cost models of sports equipment, especially for lower-income families [69]. In turn, walking is considered a daily activity with an inclusive nature independent of sex, ethnicity, age, education, income level, reduced costs and needed skills, and it can be used to travel the required distances [70]. More intense activities such as hiking and trekking that promote the contact with nature [71] were revealed as only residual.
The search for areas for physical activity, especially in the neighborhood proved the existence of local responses [27,31], consistent with other studies [26] that identified homes, neighborhoods, schools, and recreational environments as main destinations. Distant destinations are due to: (1) proximity to workplace, which allows for efficiently inserting this task into daily lives; and (2) requirement of specific infrastructure (e.g., gym, swimming pool) or areas (e.g., bike paths, forest areas) [36]. Soft modes (on foot or by bicycle) were the most used transport modes, influenced by proximity; followed by car travel, to better adjust to the working and non-working time management [53,71], family characteristics (e.g., children), and to external conditions and time constraints (e.g., equipment schedules, weather conditions) [27,41].
As for the urban model, the first metropolitan ring (suburban) presented the greatest physical inactivity, influenced by (1) urban disqualification (caused by accelerated and dense construction intended to address the housing deficit in Lisbon city center), and, therefore, lack of sufficient equipment, infrastructure, and open spaces for physical activity; and (2) the daily lives of families, e.g., the time spent working and commuting [27].
On the other hand, irregular practices and/or practices focused on only one of the studied activities does not depend on the location of families, contrary to more active practices that predominate in the more distant rings, where the built environment is mixed with green and forest spaces. Additionally, work in the neighborhood of residence and short trips as commutes prevail here [40], which promotes time savings that can be invested in physical activities. This is evident with the notable demand for outdoor activities (walking/trekking/hiking and cycling) in the more peripheral areas, even for recreational purposes.
The characteristics of families proved to be fundamental, especially “age” and “family typology”. For instance, LMA families with children or young people stand out in terms of practice of physical activity, as sport or as leisure. Other studies identified that these families understand the benefits of physical activity for health, especially for children, but reported difficulties in managing daily life to justify the practice [72]. Families with children and young people look especially for swimming pools, boosted by diverse classes and schedules and justified by the importance of the acquired skills [68]. The search for gyms has little relationship with the type of family, benefiting from great timetable flexibility and, consequently, a remarkable capacity to fit into daily lives [31,68].
Contrarily, families with elderly members were less likely to practice physical activity. The reasons were already studied, mainly related to intrapersonal and interpersonal domains (e.g., health status, loss of performance capabilities, fear of falling, lack of time, sedentary behavior, social support of family) [16,73]. Hence, activities with lower intensity can be fundamental to an active life for them [43]. On the other hand, families with only one individual revealed lower predisposition to practice physical activities.
Higher rates of physical activity practices were observed in families with intermediate monthly income compared to families with lower and higher incomes, against the expected in the last case. Traditionally, there is a positive correlation between higher income and the practice of physical activity [34,41], related to the financial capability to support these activities and with the knowledge about healthy lifestyles.
Regarding individual perceptions, self-perceived good health status and quality of life were correlated with greater levels of physical activity of families, considering that the previous aspects are related to age, physical capabilities, and family income, according to these and other studies [23,24]. In contrast, perception of urban conditions around residence, namely the likelihood of living in that area or the safety conditions for walking or cycling, did not demonstrate a clear relationship with practices. Hence, a negative perception of the characteristics of the neighborhood may not be decisive in not performing physical activity, but it may be the trigger for seeking physical activity in more distant places (e.g., better equipped areas, near work).
This study revealed several limitations. The first limitation concerns the number of studied activities (only four). Despite the justified choice and diversity, physical activity profiles and intensity levels of families are biased based on this fact. The second limitation is related to the grouped reading by family, not differentiating the practices of each individual. A refined reading would allow the differentiation by age and sex, in addition to the characteristics already studied (income, family typology, residence, perceptions). The last limitation concerns the level of analysis. Although the analysis was performed at a metropolitan level differentiated by rings, the reality is that each neighborhood presents a specific urban and social context that is relevant to encourage or discourage the practice of physical activity. Hence, the reproduction of the study at a local level could be a fundamental piece in order to achieve more adequate policies.
In synthesis, the high level of inactivity of metropolitan families should be noted carefully by the physical activity promoters and urban planners in order to reverse the situation [13,14,15]. Hence, this study should be developed to include the relationship between the practice of physical activity and the urban context, considering, for example, the level of urbanization of the neighborhood and/or the network of existing equipment (e.g., gyms, swimming pools, bike paths, etc.) [30,34]. In this sense, a multilevel approach to this study would support local policies of physical activity promotion as well as those related to the equipment network, transport and urban planning [27,31].
The COVID-19 pandemic radically changed the daily lives of families, including physical activity practices [74,75,76]. For example, in Portugal, gyms and swimming pools were closed for long periods and, when open, were subject to major constraints [77]. On the other hand, the pandemic triggered other physical activities, such as walking or cycling near home or in forest or coastal areas, as these were the permitted activities [78], resulting in large floods of visitors in urban green parks and riverside areas. Google Analytics registered distinct dynamics within LMA (e.g., more evident searching for open spaces in municipalities less dense than and more distant from Lisbon city) [79]. It remains to be seen whether this behavior will be long-term. Future studies should consider too the impacts of teleworking on the daily lives of families and their new time management.

5. Conclusions

A better knowledge of the patterns of physical activity practices and their relation with families’ and territories’ characteristics is fundamental to promoting multisector policies involving physical activity, health and urban planning perspectives, contributing to obtaining more active and livable urban environments [8,40,66]. Given the relevance of physical activity practices and the existent national and European orientations, the practice of physical activity in LMA is below expectations, as the prevailing “Totally inactive families” show [20,21].
The insertion of physical activities in the daily lives of families was strongly diverse based on the variety, frequency, and location of practices. Territory, individual characteristics and perceptions of neighborhood and activity are determinants of physical activity practices. More peripheral and less urbanized areas in LMA were related to more active families (for reasons including, e.g., the existence of more open and green spaces that potentiate the practice of outdoor activities), contrary to the reality of the dense suburbs located in the first ring peripheral to Lisbon city center. A higher income did not prove to be the conditioning factor of active practices based on the four studied physical activities (perhaps, richer people practice more expensive activities); families with children or young people tend to be more active, while households with elders are not so much. Finally, perceptions of individuals, especially about their health status and quality of life and less about the urban environment where they live, show a positive correlation with the practice of physical activity. These conclusions are fundamental to supporting future differentiated strategies for physical activity promotion at a metropolitan level.

Author Contributions

Conceptualization, A.L., P.F. and E.M.d.C.; methodology, A.L. and P.F.; formal analysis, A.L.; investigation, A.L., P.F. and E.M.d.C.; resources, A.L., P.F. and E.M.d.C.; writing—original draft preparation, A.L., P.F. and E.M.d.C.; writing—review and editing, E.M.d.C.; visualization, A.L.; supervision, E.M.d.C. All authors have read and agreed to the published version of the manuscript.

Funding

This research was supported by Portuguese national funds through the Fundação para a Ciência e a Tecnologia (FCT, I.P.), under the grants «UIDB/GEO/00295/2020» and «UIDP/GEO/00295/2020».

Institutional Review Board Statement

The study was conducted according to the guidelines of the Declaration of Helsinki, the Law n. 58/2019 (National Official Journal, n. 151/2019, Serie I of 2019-08-08), concerning the protection of people with regard to the processing of personal data and the free movement of such data, and the Code of Conduct and good practices of University of Lisbon (Order n. 6441/2015, of 9th June 2015).

Informed Consent Statement

Informed consent was obtained from all subjects involved in the study.

Data Availability Statement

All data included in this study are available upon request by contact with the corresponding author.

Acknowledgments

A. Louro acknowledges Nuno Marques da Costa (IGOT-ULisboa) for his supervision of the PhD thesis, particularly in the survey’s elaboration and application, which allowed the development of this study. P. Franco and E. Marques da Costa (supervisor) acknowledge to Nuno Marques da Costa (IGOT-ULisboa) and A. Louro the possibility of using the survey in his master’s thesis.

Conflicts of Interest

The authors declare no conflict of interest. The funders had no role in the design of the study; in the collection, analyses, or interpretation of data; in the writing of the manuscript; or in the decision to publish the results.

Appendix A

Figure A1. Relation between families’ physical activity profiles and residence ring of LMA by physical activity, (a) gym; (b) swimming; (c) walking/trekking/hiking; (d) cycling.
Sustainability 13 10104 g0a1

References

  1. Carrapato, P.; Correia, P.; Garcia, B. Determinante da saúde no Brasil: A procura da equidade na saúde. Saude Soc. 2017, 26, 676–689. [Google Scholar] [CrossRef] [Green Version]
  2. Marmot, M.; Allen, J.; Bell, R.; Bloomer, E.; Goldblatt, P. WHO European review of social determinants of health and the health divide. Lancet 2012, 380, 1011–1029. [Google Scholar] [CrossRef]
  3. Marmot, M.; Bell, R. Fair society, healthy lives. Public Health 2012, 126, S4–S10. [Google Scholar] [CrossRef] [PubMed]
  4. Marques da Costa, E.; Kállay, T. Impacts of Green Spaces on Physical and Mental Health—Thematic Report. EU, URBACT. Available online: https://urbact.eu/impacts-green-spaces-physical-and-mental-health-thematic-report (accessed on 30 August 2021).
  5. World Urbanization Prospects—United Nations. Available online: https://population.un.org/wup/Download/ (accessed on 10 June 2021).
  6. Baptista, F.; Silva, A.M.; Santos, D.A.; Mota, J.; Santos, R.; Vale, S.; Ferreira, J.P.; Raimundo, A.; Moreira, M.H. Livro Verde da Actividade Física; IDP: Lisboa, Portugal, 2011. [Google Scholar]
  7. Poitras, V.J.; Gray, C.E.; Borghese, M.M.; Carson, V.; Chaput, J.-P.; Janssen, I.; Katzmarzyk, P.T.; Pate, R.R.; Connor Gorber, S.; Kho, M.E. Systematic review of the relationships between objectively measured physical activity and health indicators in school-aged children and youth. Appl. Physiol. Nutr. Metab. 2016, 41, S197–S239. [Google Scholar] [CrossRef]
  8. Valdés-Badilla, P.A.; Gutiérrez-García, C.; Pérez-Gutiérrez, M.; Vargas-Vitoria, R.; López-Fuenzalida, A. Effects of physical activity governmental programs on health status in independent older adults: A systematic review. J. Aging Phys. Act 2019, 27, 265–275. [Google Scholar] [CrossRef] [PubMed]
  9. Naci, H.; Ioannidis, J.P.A. Comparative effectiveness of exercise and drug interventions on mortality outcomes: Metaepidemiological study. Br. J. Sports Med. 2015, 49, 1414–1422. [Google Scholar] [CrossRef] [PubMed] [Green Version]
  10. Blair, S.N.; Cheng, Y.; Holder, S.; Barlow, C.E.; Kampert, J.B. Physical Activity or Cardiorespiratory Fitness. Med. Sci. Sport. Exerc. 2001, 33, S275. [Google Scholar] [CrossRef]
  11. Jakicic, J.M.; Kraus, W.E.; Powell, K.E.; Campbell, W.W.; Janz, K.F.; Troiano, R.P.; Sprow, K.; Torres, A.; Piercy, K.L. Association between bout duration of physical activity and health: Systematic review. Med. Sci. Sport. Exerc. 2019, 51, 1213–1219. [Google Scholar] [CrossRef]
  12. Warburton, D.E.R.; Nicol, C.W.; Bredin, S.S.D. Health benefits of physical activity: The evidence. CMAJ 2006, 174, 801–809. [Google Scholar] [CrossRef] [Green Version]
  13. World Health Organization. Steps to Health: A European Framework to Promote Physical Activity for Health; WHO Regional Office for Europe: Copenhagen, Denmark, 2007. [Google Scholar]
  14. World Health Organization. Recommended Amount of Physical Activity; WHO Regional Office for Europe: Copenhagen, Denmark, 2008. [Google Scholar]
  15. World Health Organization. NCDs|Global Action Plan on Physical Activity 2018–2030: More Active People for a Healthier World, WHO; World Health Organization: Copenhagen, Denmark, 2019. [Google Scholar]
  16. Zaitune, M.P.D.A.; Barros, M.B.D.A.; César, C.L.G.; Carandina, L.; Goldbaum, M. Fatores associados ao sedentarismo no lazer em idosos, Campinas, São Paulo, Brasil. Cad. Saude Publica 2007, 23, 1329–1338. [Google Scholar] [CrossRef] [Green Version]
  17. Cavill, N.; Kahlmeier, S.; Racioppi, F. Physical Activity and Health in Europe: Evidence for Action; World Health Organization: Copenhagen, Denmark, 2006. [Google Scholar]
  18. World Health Organization. Good Health Starts with Healthy Behaviour; World Health Organization: Copenhagen, Denmark, 2011. [Google Scholar]
  19. Miles, L. Physical activity and health. Nutr. Bull. 2007, 32, 314–363. [Google Scholar] [CrossRef]
  20. The Global Health Observatory—Indicators. Available online: https://www.who.int/data/gho/data/indicators (accessed on 10 December 2020).
  21. Direção-Geral da Saúde. Programa Nacional Para a Promoção da Atividade Física; DGS: Lisboa, Portugal, 2019. [Google Scholar]
  22. Inquérito Nacional de Saúde—Instituto Nacional de Estatística. Available online: https://www.ine.pt/xportal/xmain?xpid=INE&xpgid=ine_destaques&DESTAQUESdest_boui=414434213&DESTAQUESmodo=2 (accessed on 10 December 2020).
  23. Kretschmer, A.C.; Dumith, S.C. Prática de atividade física no lazer e ambiente percebido: Um estudo de base populacional com adultos e idosos do Sul do Brasil. Rev. Bras. Epidemiol. 2020, 23, 1–13. [Google Scholar] [CrossRef]
  24. Bolívar, J.; Daponte, A.; Rodríguez, M.; Sánchez, J.J. The Influence of Individual, Social and Physical Environment Factors on Physical Activity in the Adult Population in Andalusia, Spain. Int. J. Environ. Res. Public Health 2010, 7, 60–77. [Google Scholar] [CrossRef] [Green Version]
  25. Bauman, A.; Reis, R.; Sallis, J.; Wells, J.; Loos, R.; Martin, B. Correlates of physical activity: Why are some people physically active and others not? Lancet 2012, 380, 258–271. [Google Scholar] [CrossRef]
  26. Kelso, A.; Reimers, A.K.; Abu-Omar, K.; Wunsch, K.; Niessner, C.; Wäsche, H.; Demetriou, Y. Locations of Physical Activity: Where Are Children, Adolescents, and Adults Physically Active? A Systematic Review. Int. J. Environ. Res. Public Health 2021, 18, 1240. [Google Scholar] [CrossRef]
  27. Marques da Costa, E.; Fumega, J.; Louro, A. Defining sustainable communities: Development of a toolkit for policy orientation. J. Urban Regen. Renew. 2013, 6, 278–292. [Google Scholar]
  28. Flood, S.M.; Moen, P. Healthy Time Use in the Encore Years: Do Work, Resources, Relations, and Gender Matter? J. Health Soc. Behav. 2015, 56, 74–97. [Google Scholar] [CrossRef] [PubMed] [Green Version]
  29. Nossa, P. Abordagem Geográfica da Oferta e Consumo de Cuidados de Saúde. Doctorate Thesis, Universidade do Minho, Guimarães, Portugal, 2005. [Google Scholar]
  30. Franco, P.; Marques da Costa, E. Atividade física no quotidiano familiar das periferias: Uma visão a partir de Rio de Mouro—Sintra. Finisterra 2021, 56, 183–203. [Google Scholar] [CrossRef]
  31. Malta, F.S.; da Costa, E.M.; Magrini, A. Socio-environmental vulnerability index: A methodological proposal based on the case of Rio de Janeiro, Brazil/Indice de vulnerabilidade socioambiental: Uma proposta metodológica utilizando o caso do Rio de Janeiro, Brasil. Cien Saude Colet 2017, 22, 3933–3944. [Google Scholar] [CrossRef] [PubMed] [Green Version]
  32. Malta, F.S.; Marques da Costa, E. Socio-Environmental vulnerability Index: An Application to Rio de Janeiro-Brazil. Int. J. Public Health 2021, 66, 584308. [Google Scholar] [CrossRef]
  33. Gomes, D.F.; Dias, M.; Martins, F.; Damásio, A.; Campos, F. Relação entre frequência de prática e importância atribuída pelos praticantes. Phys. Educ. Sport. Pedagog. 2020, 6, 20–25. [Google Scholar] [CrossRef]
  34. Cohen, D.A.; Han, B.; Derose, K.P.; Williamson, S.; Marsh, T.; Raaen, L.; McKenzie, T.L. Promoting physical activity in high-poverty neighborhood parks: A cluster randomized controlled trial. Soc. Sci. Med. 2017, 186, 130–138. [Google Scholar] [CrossRef]
  35. Gómez, A.; Costa, C.; Santana, P. Acessibilidade e utilização dos espaços verdes urbanos nas cidades de Coimbra (Portugal) e Salamanca (Espanha). Finisterra 2014, 49, 49–68. [Google Scholar] [CrossRef] [Green Version]
  36. Greer, A.E.; Castrogivanni, B.; Marcello, R. Park Use and Physical Activity Among Mostly Low-to-Middle Income, Minority Parents and Their Children. J. Phys. Act. Health 2017, 14, 83–87. [Google Scholar] [CrossRef]
  37. Gintoli, I.; Bellisario, V.; Squillacioti, G.; Caputo, M.; Borraccino, A.; Dalmasso, P.; Bono, R.; Lemma, P. Urbanization and greenness in HBSC survey: Association with life satisfaction and health complaints. Eur. J. Public Health 2020, 30, ckaa166.099. [Google Scholar] [CrossRef]
  38. Matisziw, T.C.; Nilon, C.H.; Wilhelm Stanis, S.A.; LeMaster, J.W.; McElroy, J.A.; Sayers, S.P. The right space at the right time: The relationship between children’s physical activity and land use/land cover. Landsc. Urban Plan. 2016, 151, 21–32. [Google Scholar] [CrossRef] [Green Version]
  39. Jáuregui, A.; Lambert, E.V.; Panter, J.; Moore, C.; Salvo, D. Scaling up urban infrastructure for physical activity in the COVID-19 pandemic and beyohd. Lancet 2021, 398, 370–372. [Google Scholar] [CrossRef]
  40. Louro, A.; Marques da Costa, N. Mobilidade urbana e municípios saudáveis na AML: Tendências entre as últimas duas décadas (2000 e 2010). Finisterra 2019, 54, 71–95. [Google Scholar] [CrossRef]
  41. Morseth, B.; Jacobsen, B.K.; Emaus, N.; Wilsgaard, T.; Jørgensen, L. Secular trends and correlates of physical activity: The Tromsø Study 1979-2008. BMC Public Health 2016, 16, 1215. [Google Scholar] [CrossRef] [Green Version]
  42. Fan, X.; Zhu, Z.; Zhuang, J.; Liu, Y.; Tang, Y.; Chen, P.; Cao, Z.B. Gender and age differences in the association between living arrangement and physical activity levels among youth aged 9–19 years in Shanghai, China: A cross-sectional questionnaire study. BMC Public Health 2019, 19, 1030. [Google Scholar] [CrossRef] [Green Version]
  43. Meijer, E.; Goris, A.; Wouters, L.; Westerterp, K.R. Physical inactivity as a determinant of the physical activity level in the elderly. Int. J Obes. 2001, 25, 935–939. [Google Scholar] [CrossRef] [Green Version]
  44. Pereira, M.; Mota, J.; Nogueira, H.; Santos, M. Determinantes ambientais e sociais nos níveis de actividade física dos adolescentes. Utilização de metodologias SIG. Finisterra 2012, 46, 107–118. [Google Scholar] [CrossRef] [Green Version]
  45. Du, J.; Yagihashi, T. Health capital investment and time spent on health-related activities. Rev. Econ. Househ. 2017, 15, 1215–1248. [Google Scholar] [CrossRef] [Green Version]
  46. Dumuid, D.; Olds, T.; Sawyer, S.M. Moving beyond more: Towards a healthy balance of daily behaviours. Lancet 2021, 398, 373–374. [Google Scholar] [CrossRef]
  47. García, J.A. Time use patterns of Spanish people at weekends: In search of what, who and when. Leis. Stud. 2017, 36, 793–810. [Google Scholar] [CrossRef]
  48. Parent-Thirion, A.; Macías, E.F.; Hurley, J.; Vermeylen, G. Fourth European Working Conditions Survey; Office for Official Publications of the European Communities: Dublin, Ireland, 2007. [Google Scholar]
  49. Torres, A.; Brites, R.; Lapa, T.; Haas, B.; Steiber, N. First European Quality of Life Survey: Time Use and Work—Life Options over the Life Course; Office for Official Publications of the European Communities: Dublin, Ireland, 2007. [Google Scholar]
  50. Cerin, E.; Mitáš, J.; Cain, K.L.; Conway, T.L.; Adams, M.A.; Schofield, G.; Sarmiento, O.L.; Reis, R.S.; Schipperijn, J.; Davey, R.; et al. Do associations between objectively-assessed physical activity and neighborhood environment attributes vary by time of the day and day of the week? IPEN adult study. Int. J. Behav. Nutr. Phys. Act. 2017, 14, 34. [Google Scholar] [CrossRef] [Green Version]
  51. De Sousa, M.; Reeve, C.L.; Peterman, A.H. Development and Initial Validation of the Perceived Scarcity Scale (PScS). Stress Health 2019, 36, 131–146. [Google Scholar] [CrossRef]
  52. Rudd, M. Feeling short on time: Trends, consequences, and possible remedies. Curr. Opin. Psychol. 2019, 26, 5–10. [Google Scholar] [CrossRef]
  53. Naegele, G.; Barkholdt, C.; de Vroom, B.; Andersen, J.G.; Krämer, K.; Andersen, J.G.; Krämer, K. A new organization of time over working life—Results from a European Foundation research project of the same name. In Soziale Lebenslaufpolitik; Naegele, G., Ed.; VS Verlag für Sozialwissenschaften: Wiesbaden, Germany, 2010; pp. 110–137. [Google Scholar] [CrossRef]
  54. Louro, A.; Marques da Costa, N. Indicadores de transporte e mobilidade urbana para cidades saudáveis—Caso da Área Metropolitana de Lisboa, Portugal. GeoUERJ 2017, 30, 99–121. [Google Scholar] [CrossRef] [Green Version]
  55. Yun, H.Y. Neighborhood Built Environments, Walking, and Self-Rated Health among Low-Income Older Adults in St. Paul, Minnesota. Sustainability 2021, 13, 3501. [Google Scholar] [CrossRef]
  56. Herazo-Beltrán, Y.; Pinillos, Y.; Vidarte, J.; Crissien, E.; Suarez, D.; García, R. Predictors of perceived barriers to physical activity in the general adult population: A cross-sectional study. Braz. J. Phys. Ther 2017, 21, 44–50. [Google Scholar] [CrossRef] [PubMed]
  57. Sugiyama, T.; Cerin, E.; Owen, N.; Oyeyemi, A.L.; Conway, T.L.; Van Dyck, D.; Schipperijn, J.; Macfarlane, D.J.; Salvo, D.; Reis, R.S.; et al. Perceived neighborhood environmental attributes associated with adults[U+05F3] recreational walking: IPEN Adult study in 12 countries. Health Place 2014, 28, 22–30. [Google Scholar] [CrossRef] [Green Version]
  58. Ou, J.Y.; Levy, J.I.; Peters, J.L.; Bongiovanni, R.; Garcia-Soto, J.; Medina, R.; Scammell, M.K. A walk in the park: The influence of urban parks and community violence on physical activity in Chelsea, MA. Int. J. Environ. Res. Public Health 2016, 13, 97. [Google Scholar] [CrossRef] [PubMed]
  59. Rees-Punia, E.; Hathaway, E.D.; Gay, J.L. Crime, perceived safety, and physical activity: A meta-analysis. Prev. Med. 2018, 111, 307–311. [Google Scholar] [CrossRef] [PubMed]
  60. Corburn, J. Equitable and healthy city planning: Towards healthy urban governance in the century of the city. In Healthy Cities: The Theory, Policy, and Practice of Value-Based Urban Planning; de Leeuw, E., Simos, J., Eds.; Springer: New York, NY, USA, 2017; pp. 31–41. [Google Scholar]
  61. Corburn, J. Urban place and health equity: Critical issues and practices. Int. J. Environ. Res. Public Health 2017, 14, 117. [Google Scholar] [CrossRef] [PubMed] [Green Version]
  62. Hoehner, C.M.; Brennan, L.K.; Brownson, R.C.; Handy, S.L.; Killingsworth, R. Opportunities for Integrating Public Health and Urban Planning Approaches to Promote Active Community Environments. Am. J. Health Promot. 2003, 18, 14–20. [Google Scholar] [CrossRef] [PubMed]
  63. Louro, A.; Marques da Costa, N.; Marques da Costa, E. From livable communities to livable metropolis: Challenges for urban mobility in Lisbon Metropolitan Area (Portugal). Int. J. Environ. Res. Public Health 2021, 18, 3525. [Google Scholar] [CrossRef]
  64. Censos da População—Instituto Nacional de Estatística. Available online: https://censos.ine.pt/xportal/xmain?xpid=CENSOS&xpgid=censos2011_apresentacao (accessed on 12 April 2018).
  65. Corine Land Cover—Copernicus. Available online: https://land.copernicus.eu/pan-european/corine-land-cover (accessed on 29 May 2021).
  66. Ferdinand, A.O.; Sen, B.; Rahurkar, S.; Engler, S.; Menachemi, N. The relationship between built environments and physical activity: A systematic review. Am. J. Public Health 2012, 102, e7–e13. [Google Scholar] [CrossRef] [PubMed]
  67. King, A.C.; Stokols, D.; Talen, E.; Brassington, G.S.; Killingsworth, R. Theoretical approaches to the promotion of physical activity: Forging a transdisciplinary paradigm. Am. J. Prev. Med. 2002, 23, 15–25. [Google Scholar] [CrossRef]
  68. Pereira Neiva, H.; Brandão Faíl, L.; José Silva, A.; Almeida Marinho, D. Caracterização dos utilizadores de piscinas em Portugal: Práticas usuais e motivações. RIAA 2019, 3, 3–7. [Google Scholar] [CrossRef]
  69. Almeida, D. A Emergência Low-Cost: Drivers que Influenciam o Comportamento do Consumidor na Escolha do Ginásio. Master’s Thesis, ISCTE Business School, Lisbon, Portugal, 2017. Available online: https://repositorio.iscte-iul.pt/handle/10071/16367 (accessed on 18 May 2021).
  70. Louro, A.; Marques da Costa, N.; Marques da Costa, E. Sustainable Urban Mobility Policies as a Path to Healthy Cities—The Case Study of LMA, Portugal. Sustainability 2019, 11, 2929. [Google Scholar] [CrossRef] [Green Version]
  71. Mitten, D.; Overholt, J.R.; Haynes, F.I.; D’Amore, C.C.; Ady, J.C. Hiking: A Low-Cost, Accessible Intervention to Promote Health Benefits. Am. J. Lifestyle Med. 2018, 12, 302–310. [Google Scholar] [CrossRef] [PubMed]
  72. Thompson, J.L.; Jago, R.; Brockman, R.; Cartwright, K.; Page, A.S.; Fox, K.R. Physically active families—De-bunking the myth? A qualitative study of family participation in physical activity. Child Care Health Dev. 2010, 36, 265–274. [Google Scholar] [CrossRef] [PubMed]
  73. Yarmohammadi, S.; Mozafar Saadati, H.; Ghaffari, M.; Ramezankhani, A. A systematic review of barriers and motivators to physical activity in elderly adults in Iran and worldwide. Epidemiol. Health 2019, 41, e2019049. [Google Scholar] [CrossRef] [PubMed]
  74. Sousa, P.; Marques da Costa, N.; Marques da Costa, E.; Ricoca Peixoto, V.; Campos Fernandes, A.; Gaspar, R.; Duarte-Ramos, F.; Abrantes, P.; Leite, A. COMPRIME—COnhecer Mais PaRa Intervir MElhor: Preliminary Mapping of Municipal Level Determinants of COVID-19 Transmission in Portugal at Different Moments of the 1st Epidemic Wave. Port. J. Public Health 2021, 38, 18–25. [Google Scholar] [CrossRef]
  75. Marques da Costa, E.; Marques da Costa, N. O processo pandémico da COVID-19 em Portugal Continental. Análise geográfica dos primeiros 100 dias. Finisterra 2020, 55, 11–18. [Google Scholar] [CrossRef]
  76. Long, T.Q. Individual Subjective Well-Being during the COVID-19 Pandemic. Sustainability 2021, 13, 7816. [Google Scholar] [CrossRef]
  77. Jornal de Negócios. Ginásios e Piscinas Voltam a Funcionar. Saiba Quais as Regras que Terá de Seguir. Available online: https://www.jornaldenegocios.pt/economia/coronavirus/detalhe/ginasios-e-piscinas-voltam-a-funcionar-saiba-quais-as-regras-que-tera-de-seguir (accessed on 27 April 2021).
  78. Sábado. Covid-19: Lisboetas Saem à Rua Para Passear e Praticar Exercício Físico. Available online: https://www.sabado.pt/portugal/detalhe/covid-19-lisboetas-saem-a-rua-para-passear-e-praticar-exercicio-fisico (accessed on 27 May 2021).
  79. Google. COVID-19 Community Mobility Reports (Portugal). Available online: https://www.gstatic.com/covid19/mobility/2021-08-09_PT_Mobility_Report_pt-PT.pdf (accessed on 27 May 2021).
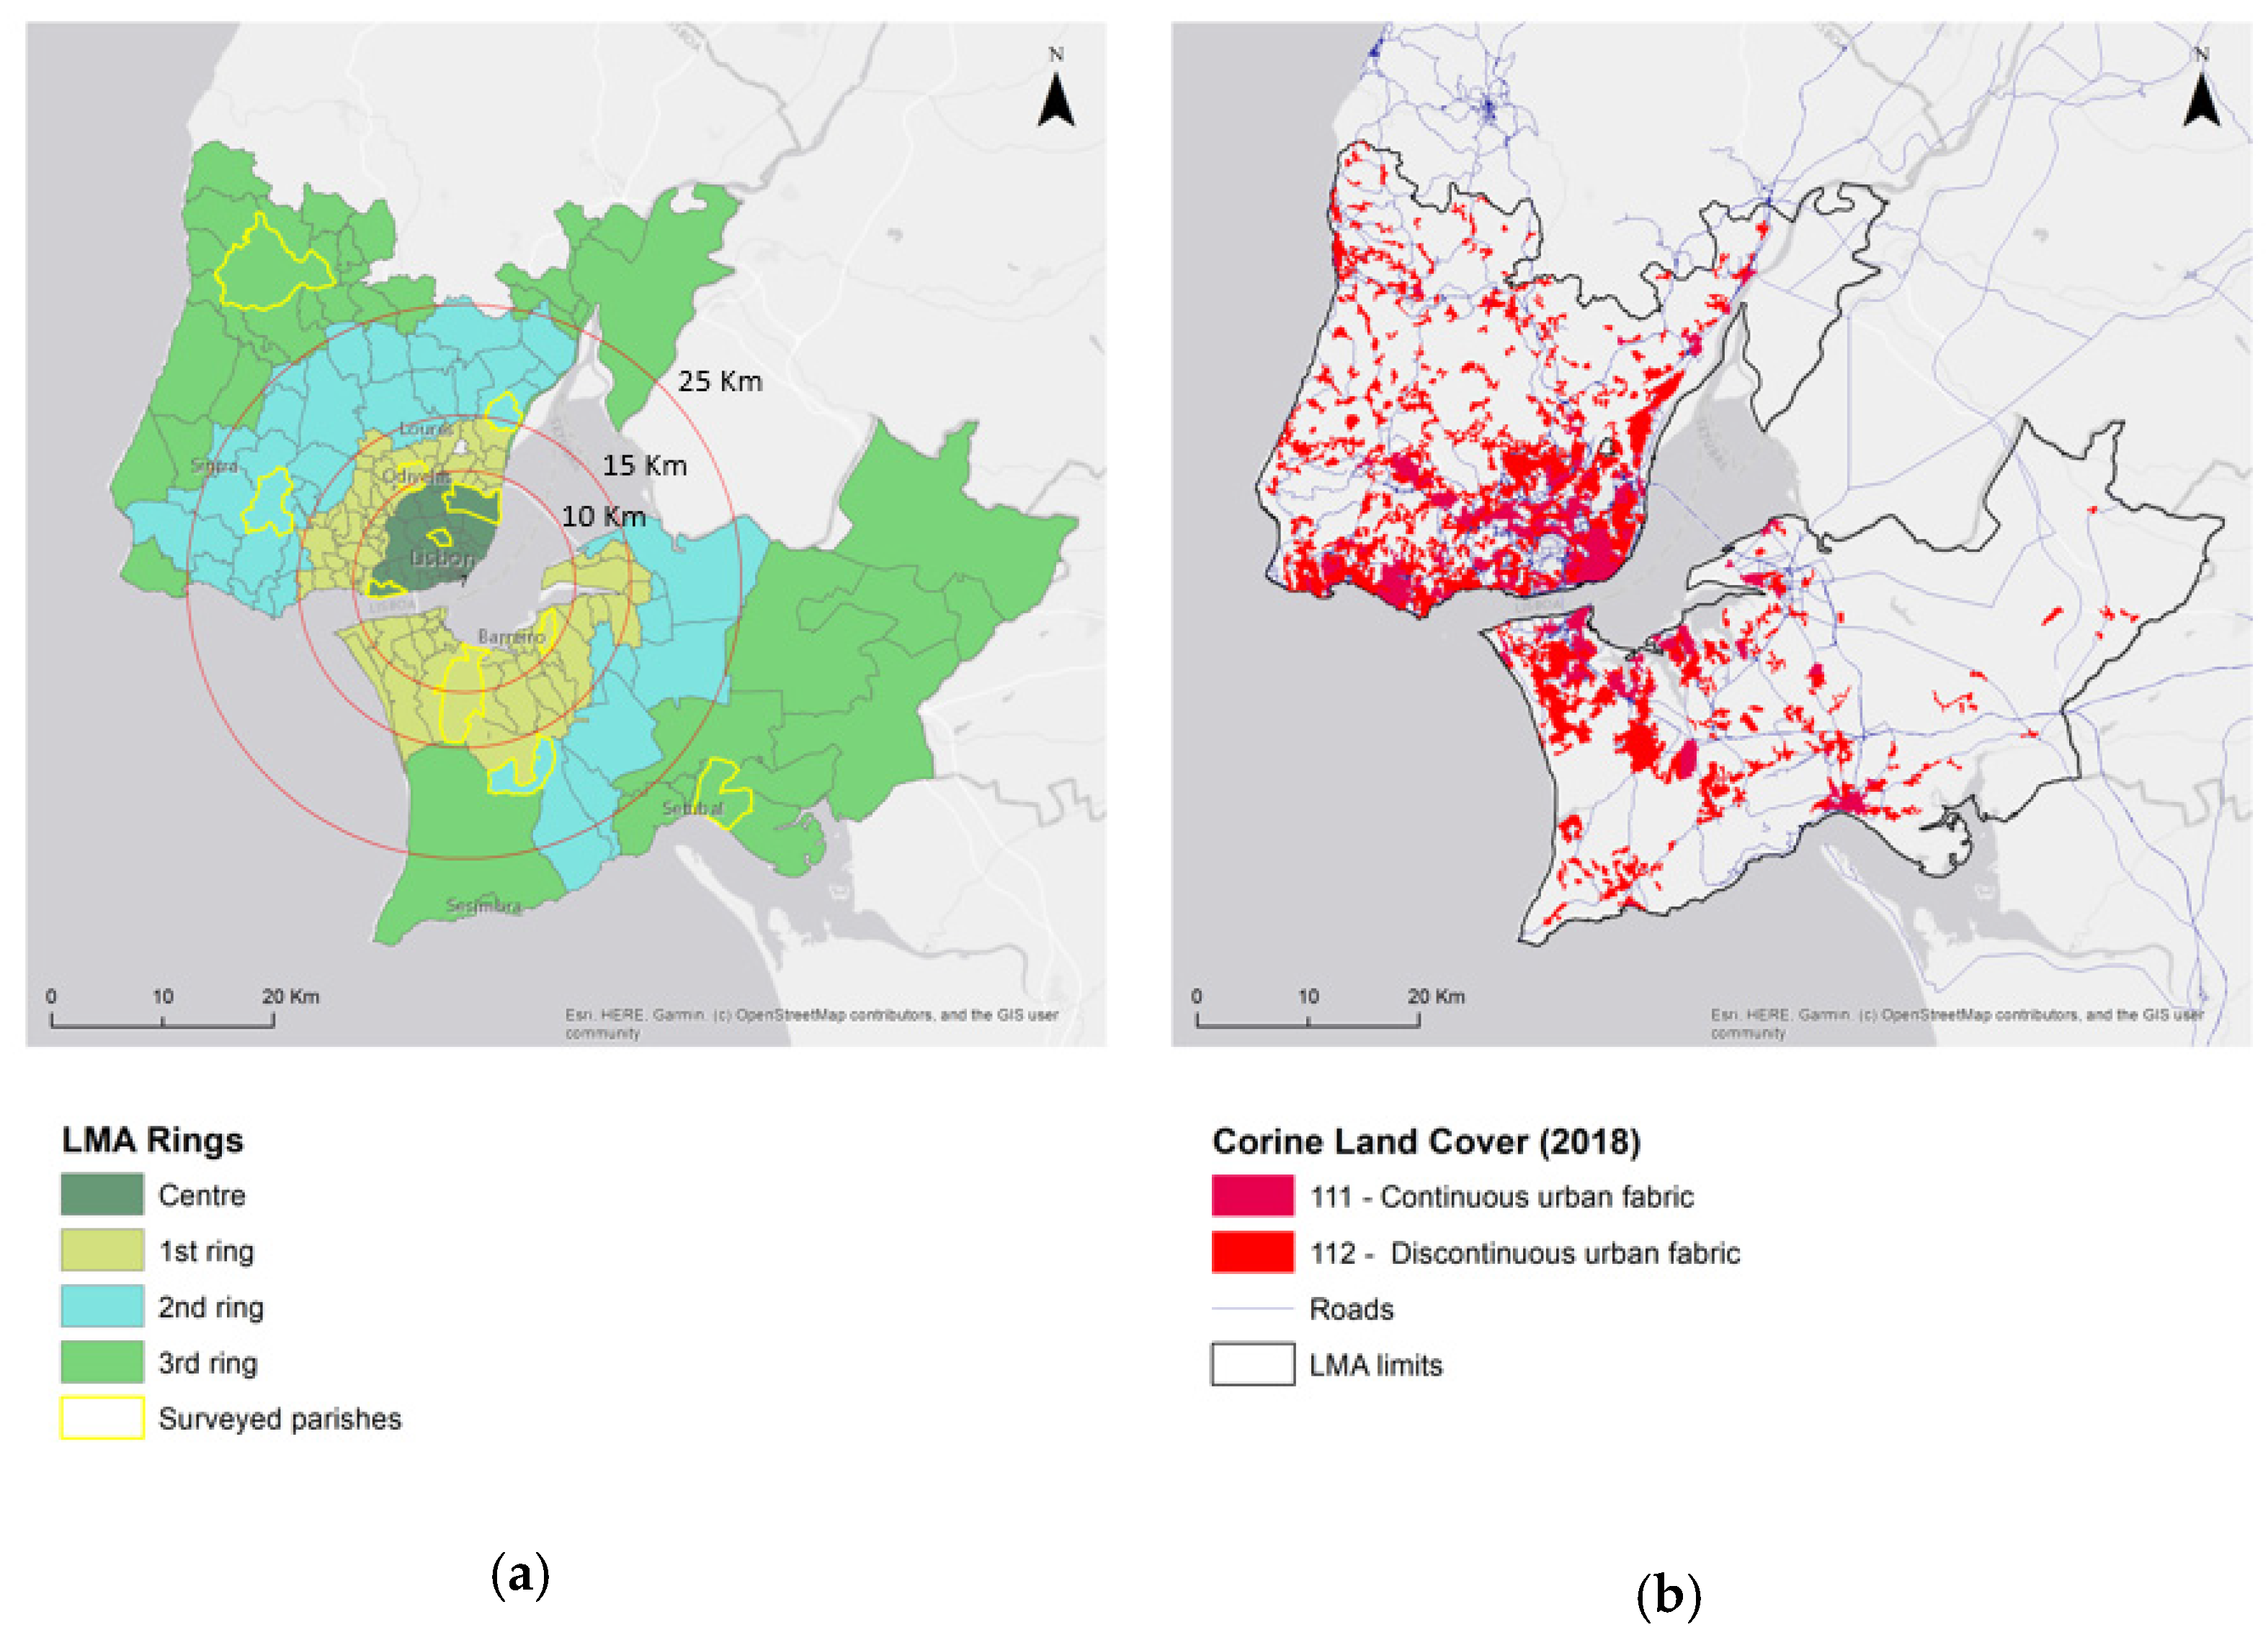
Figure 1. Lisbon Metropolitan Area: (a) Parishes by ring and location of the surveyed parishes; (b) Land use: continuous and discontinuous urban fabric, in 2018.
Sustainability 13 10104 g001
Figure 2. Scheme of physical activity profiles of families.
Sustainability 13 10104 g002
Figure 3. Frequency of physical activity practice vs. day of the week (weekday or weekend) for each physical activity.
Sustainability 13 10104 g003
Figure 4. Most frequent period of the day for physical activity practice vs. day of the week (weekday or weekend) for each physical activity.
Sustainability 13 10104 g004
Figure 5. Proportion of families according to their physical activity profiles for each activity.
Sustainability 13 10104 g005
Figure 6. Proportion of families according to their levels of physical activity intensity.
Sustainability 13 10104 g006
Figure 7. Level of physical activity intensity of families according to ring of the Lisbon Metropolitan Area (Center represents Lisbon city, and the 3rd ring is the most peripheral).
Sustainability 13 10104 g007
Figure 8. Level of physical activity intensity of families according to: (a) typology of family; (b) monthly income; (c) time out of home.
Sustainability 13 10104 g008
Figure 9. Level of physical activity intensity of families according to: (a) the self-perception of quality of life; (b) the self-perception of health status; (c) the likelihood level of living in the neighborhood; (d) the feeling of safety to walk or cycle in the neighborhood.
Sustainability 13 10104 g009
Table 1. Sample structure according to LMA population (private households and residents).
Census (INE, 2011)Survey (2018)
Private HouseholdsResidentsPrivate HouseholdsResidents
n%n%n%n%
Center486,04442.31,135,34340.313232.230430.2
1st ring235,38420.5589,15120.98420.521421.3
2nd ring293,78425.6761,30627.013432.733733.5
3rd ring132,56311.5330,07611.76014.615115.0
Total1,147,775100.02,815,876100.0410100.01006100.0
Table 2. Physical activity in LMA—practice, frequency, location, and transport mode.
Practice of Physical Activityn%
Practice of, at least, one physical activityNo20049.0
Yes20851.0
Type of activity 1Gym7618.6
Swimming5313.0
Walking/hiking/trekking9322.8
Cycling6716.4
Frequency 2Daily3813.1
3 to 5 times a week5117.6
1 to 2 times a week12041.5
1 to 2 times per month3712.8
Rarely4314.9
Most frequent location 2In the parish of residence19367.0
In the municipality of residence6422.2
Another municipality196.6
Don’t know/Don’t answer124.2
Transport mode used 2Soft modes17359.9
Collective transports124.2
Individual transports8128.0
Combination of modes82.8
Don’t know/Don’t answer155.2
1 16% of the interviewed registered two or more activities. 2 Based on the positive answers about the practice of several activities (n = 288).
Table 3. Relation between physical activity practices and sociodemographic characteristics.
Practice of Physical ActivityYesNo
n%n%
Typology of householdsOne-person family4241.26058.8
Couple without children4146.64753.4
Couple with children8658.16241.9
One-parent family1664.0936.0
Others2351.12248.9
Existence of children and youth (until 17 years old)Yes7461.24738.8
No13446.715353.3
Existence of elders (65 or more years old)Yes4742.76357.3
No16154.013746.0
Table 4. Relation between physical activity practices and family typology.
Practice of Any Physical Activity by Type of Family Sustainability 13 10104 i001
Gym
Sustainability 13 10104 i002
Swimming
Sustainability 13 10104 i003
Walking/Trekking/Hiking
Sustainability 13 10104 i004
Cycling
One-person family
Sustainability 13 10104 i005 41.2%
15.7%5.9%20.6%6.9%
Couple without children
Sustainability 13 10104 i006 46.6%
17.0%5.7%26.1%4.6%
Couple with children
Sustainability 13 10104 i007 58.1%
21.6%22.3%19.6%29.7%
One-parent family
Sustainability 13 10104 i008 64.0%
16.0%28.0%32.9%24.0%
Publisher’s Note: MDPI stays neutral with regard to jurisdictional claims in published maps and institutional affiliations.