1. Introduction
For a clean and sustainable production, the brewing and beverage industry is challenged to optimize its energy efficiency [
1]. Facing environmental challenges, high energy costs and a growing public awareness, including the United Nations sustainable development goals [
2], the global brewing industry is required to produce more sustainably. Large brewery groups, in particular, publish ambitious targets regarding a more sustainable production [
3,
4,
5]. When discussing sustainable production, different issues, which should be considered at the same time, must be taken into account [
6]. In addition to the material efficiency of the materials of the primary production, energy efficiency plays a particularly important role [
7,
8]. The material efficiency requires knowledge of the previous production processes. With the help of a simulation, which is also mentioned as a tool for optimization in the course of the digital factory [
9,
10], the energy efficiency can be improved [
11]. The simulation is primarily used for the holistic analysis of complex production systems and is suitable for uncovering the optimization potential without interrupting the ongoing production [
12,
13]. The beverage industry is challenged by the conflicting demands of high product quality and diversity and cost-effective production. Increasing energy efficiency and flexible production can sustainably reduce costs and consequently increase competitiveness [
14,
15]. However, simulation studies are usually associated with high costs and require a high level of expertise, especially for modeling complex systems [
16]. In addition, a comprehensive database is essential for the success of simulation studies [
12]. However, these data are subject to uncertainty. This presents insurmountable barriers for a sustainable production for small and medium-sized enterprises (SME) [
17,
18]. The beverage industry, whose production is very energy- and media-intensive [
1], is characterized by small companies: 90% of the German brewing landscape consists of small and medium-sized breweries [
19]. About 30% of the electrical energy demand and about 25% of the thermal energy demand can be attributed to bottling/packaging [
1,
12]. Accordingly, this complex and multi-layered area holds a potential for increasing energy and media efficiency. Osterroth et al. [
20] provides a detailed overview of the consumption structure in beverage bottling plants.
An overview of the simulation and other methods for increasing energy efficiency in batch-oriented processes and the discrete packaging area in the beverage industry is given by Bär and Voigt [
12]. Publications in the bottling area consider a wide variety of aspects [
21,
22,
23,
24], mostly with a focus on increasing efficiency, but not on energy and media consumption [
25,
26,
27,
28]. Approaches considering an increase in energy and media efficiency are limited with regard to various factors. To enable simple, quick, and cost-effective analyses and optimizations for SMEs, these barriers must be overcome.
To map real behavior, the entire beverage bottling plant, with its interlinkages, must be considered [
29]. Few approaches deal only with partial areas or machines or selected types of energy and media. Dilay et al. [
30] describe the detailed optimization of a tunnel pasteurizer by investigating the energy impact of various input parameters. As a result, various concepts were presented regarding a structural modification of the machine to achieve considerable savings of thermal and electrical energy. In their green brewery concept, Muster-Slawitsch et al. [
31] describe the increase of energy efficiency and the use of renewable energy sources in the brewery—inter alia, in the bottling area. The reuse of thermal energy through hot water management is investigated and optimized. The simulation of water flows in a dairy is used by Marchini et al. [
32]. The impact of the plant layout on water consumption is investigated using two use cases, and savings of 7.2% are achieved in theory. Using the integration of life-cycle assessment in a discrete-event based simulation, Johansson et al. [
33] simulate an aseptic packaging line for fruit juices. The entire plant is examined in terms of its emissions and waste, and a validation is carried out by comparing with real consumption values. It is shown that discrete-event simulation is a suitable tool for the rapid and cost-effective estimation of optimizations.
The complexity of the methods poses another challenge with respect to their ease of use. Hubert et al. [
34] present a simulation based on reference networks. An approach for optimizing wastewater production by scheduling processes in a beverage bottling plant is presented. Compared to a genetic algorithm approach, 10% of wastewater could be saved and water demand reduced accordingly. A validation based on real data is not carried out, which is another cornerstone of the approaches described in the literature. Furthermore, water consumption is simulated with regard to chemical oxygen demand, a criterion of water quality [
35]. A validation with real data shows the good fit of the simulation. Based on an extensive database, Osterroth et al. [
36] analyzed the electrical energy consumption of the machines at a beverage bottling plant in detail. The operating state depended on the consumption behavior of the individual units and is proven, and time-dependent consumption levels within the states are introduced. An extensive validation underpins the method, which, however, covers only electrical energy. Forster [
37] describes a holistic approach to the modeling and simulation of beverage bottling plants with regard to energy and media consumption. The discrete-event simulation environment Plant Simulation is used, and a model is represented by predefined components. Various energy and media consumptions are machine-specifically simulated using state models, and the results are outlined by way of example. However, no detailed insight is given into how energy and media consumption are mapped. The validation is also insufficiently presented and does not provide any information about the suitability of the method. Information on the framework conditions, such as the production process, is not given. The inclusion of a production plan enables a description of the energy consumption during inactive production times [
38]. Hubert [
39] describes in a comprehensive work a simulation based on reference networks of a beverage bottling plant over a period of one week regarding the electrical and thermal ernergy demand as well as the water consumption. The failure behavior of certain aggregates of the plant is described by a Weibull distribution for the operation and the failure, and, furthermore, the start-up as well as the production and the final phase of the bottling process are described. It is shown that the bottling area is one of the main consumers of the above-mentioned energy and media types and therefore represents an enormous potential for improving energy and media efficiency. Simulation studies for the entire brewery, based on the variation of production schedules by adjusting the start times of the respective recipes, were carried out to reduce the electric peak loads. Savings in the double-digit percentage range were achieved. The work describes an interesting holistic approach, whereas no validation with real data takes place. To overcome the mentioned barriers, user-friendly modeling and the automatic generation of simulation models are recommended.
However, the available database, which is usually insufficient, poses a challenge, in particular for validation [
40,
41]. There are numerous applications for validating simulations, such as the comparison with other models or with recorded data [
42]. The choice of the appropriate validation technique depends on the degree of subjectivity [
42,
43]. Osterroth et al. [
36] use the average percentage deviation (APD) and Theil’s inequality coefficient (TIC) for the statistical validation of the simulation results, which tests the credibility of the model. This method is also used in some other publications [
44,
45,
46,
47]. Al-Hawari et al. [
25] and Johansson et al. [
33] both use the simple comparison of simulation results with the results of reality for the validation of their model.
The barriers listed are taken up in this work, and a method for the automatic generation of simulation models for the holistic simulation of energy and media consumption for beverage bottling plants is developed.
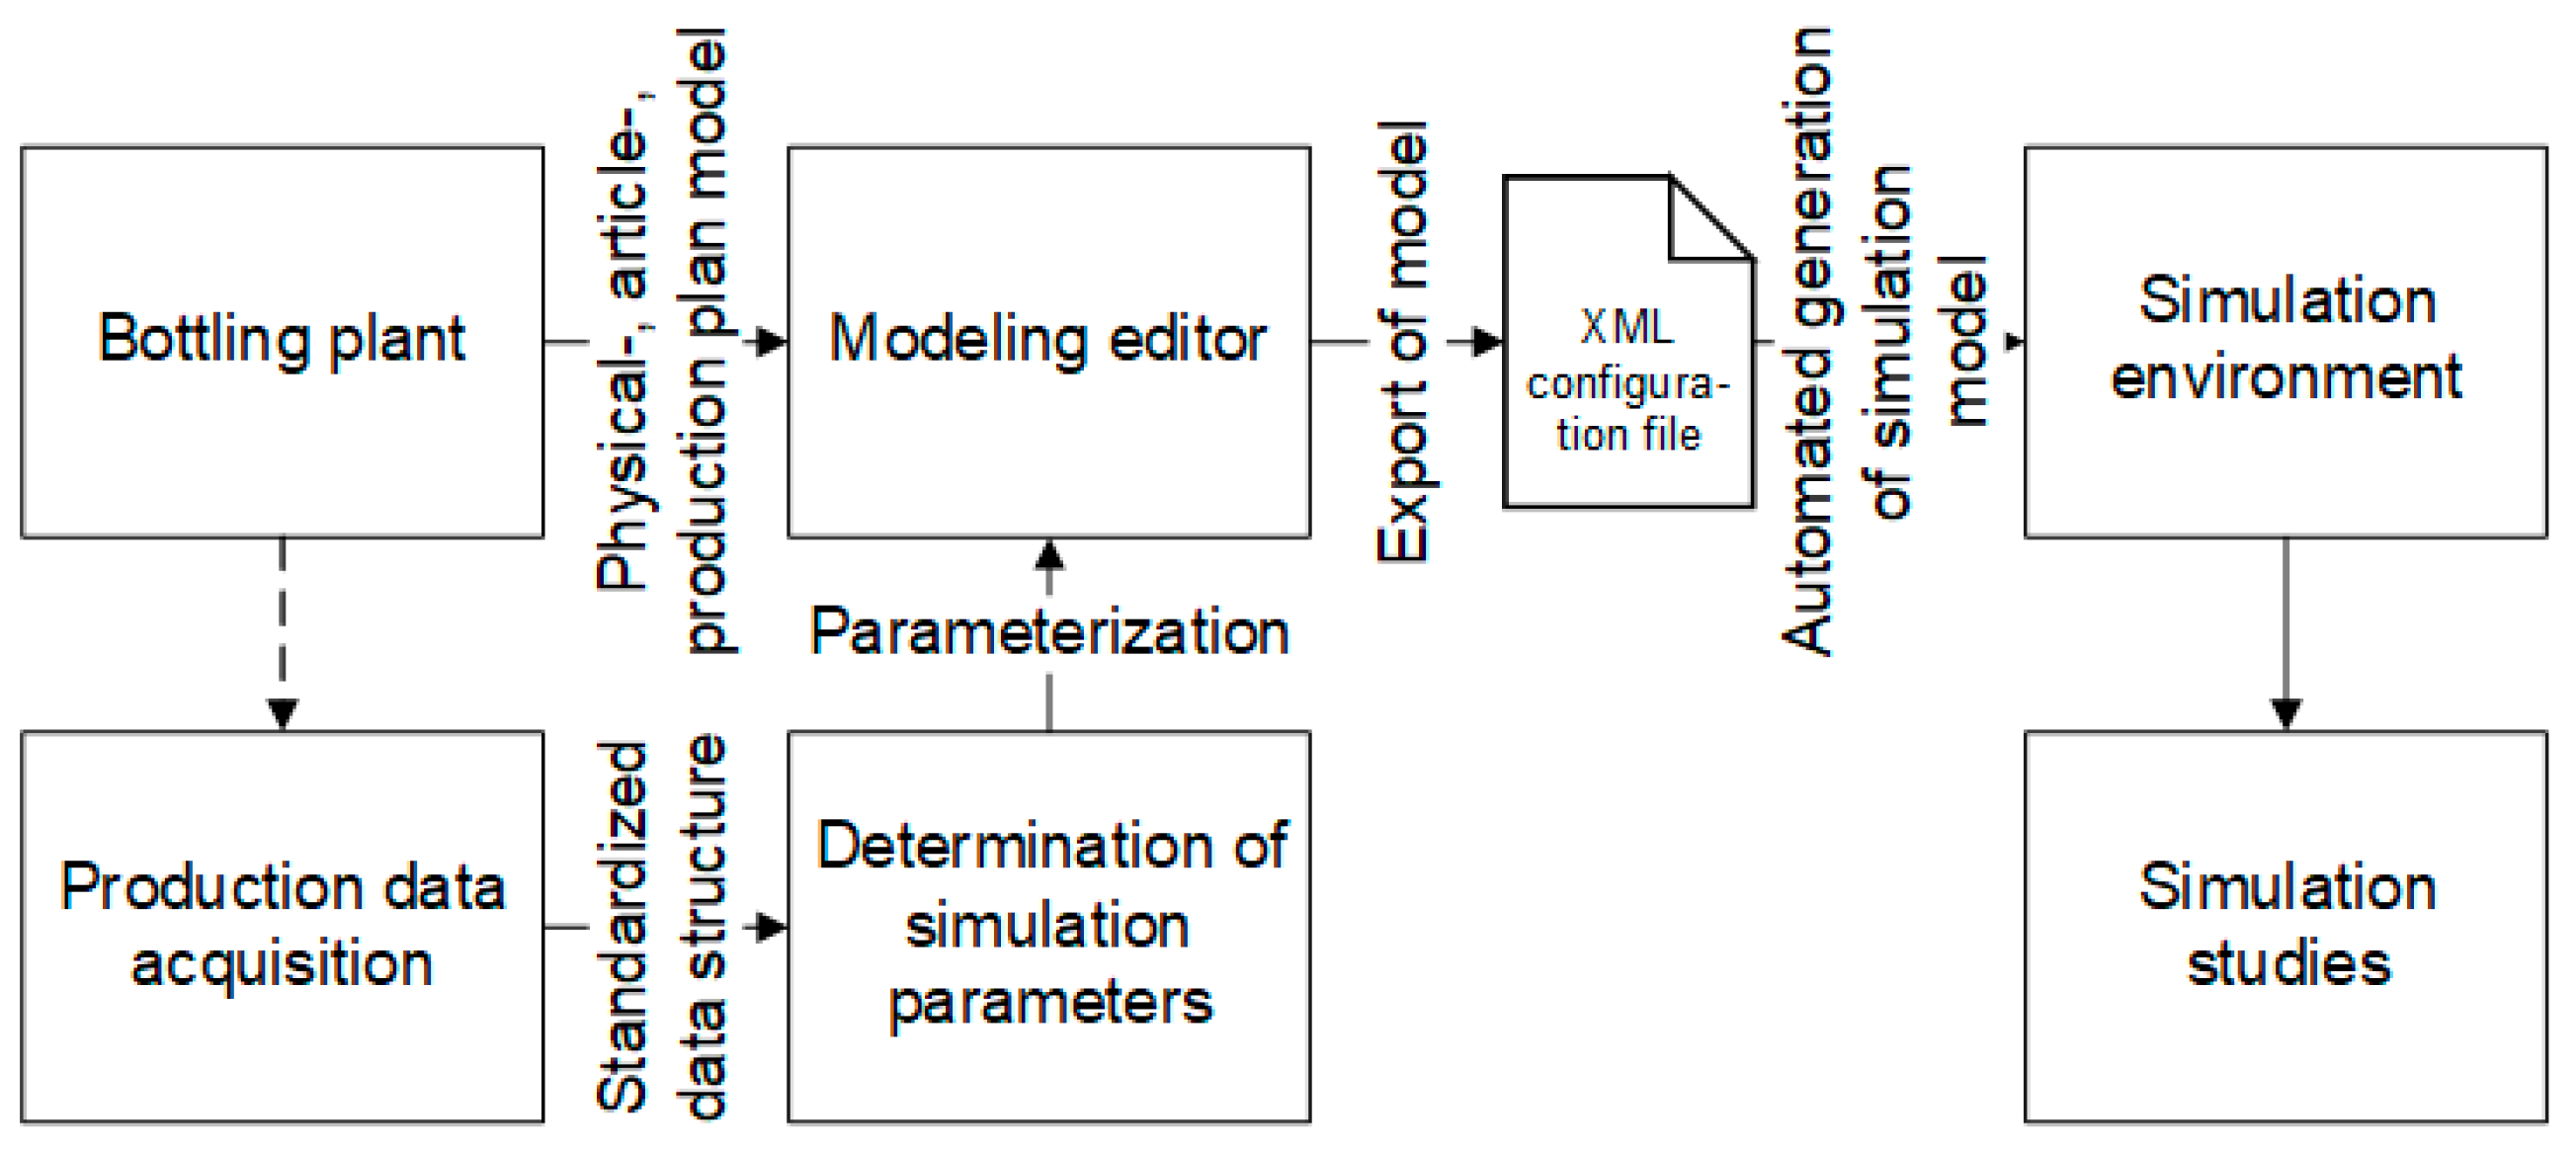
Figure 1 shows an overview of the approach in its major steps. For a simple and fast modeling of complex production systems, an already presented modeling concept, implemented in a user-friendly software, was used [
48]. With an extensive database, it was possible to model and parameterize beverage bottling plants with regard to the physical plant, the articles, and the production plan. The simulation model is automatically generated via an extensible markup-language (XML)-based configuration file in a time-discrete simulation environment. A holistic production plant with regard to all energy and media demands, including a production plan, could be simulated. The methodology is validated in detail and use cases are applied in this work.
2. Beverage Bottling Plant Investigated and Database
The subject of the study is an industrial refillable glass beverage bottling plant for mineral water and soft drinks of one of the 10 largest mineral water companies in Germany (according to sales) [
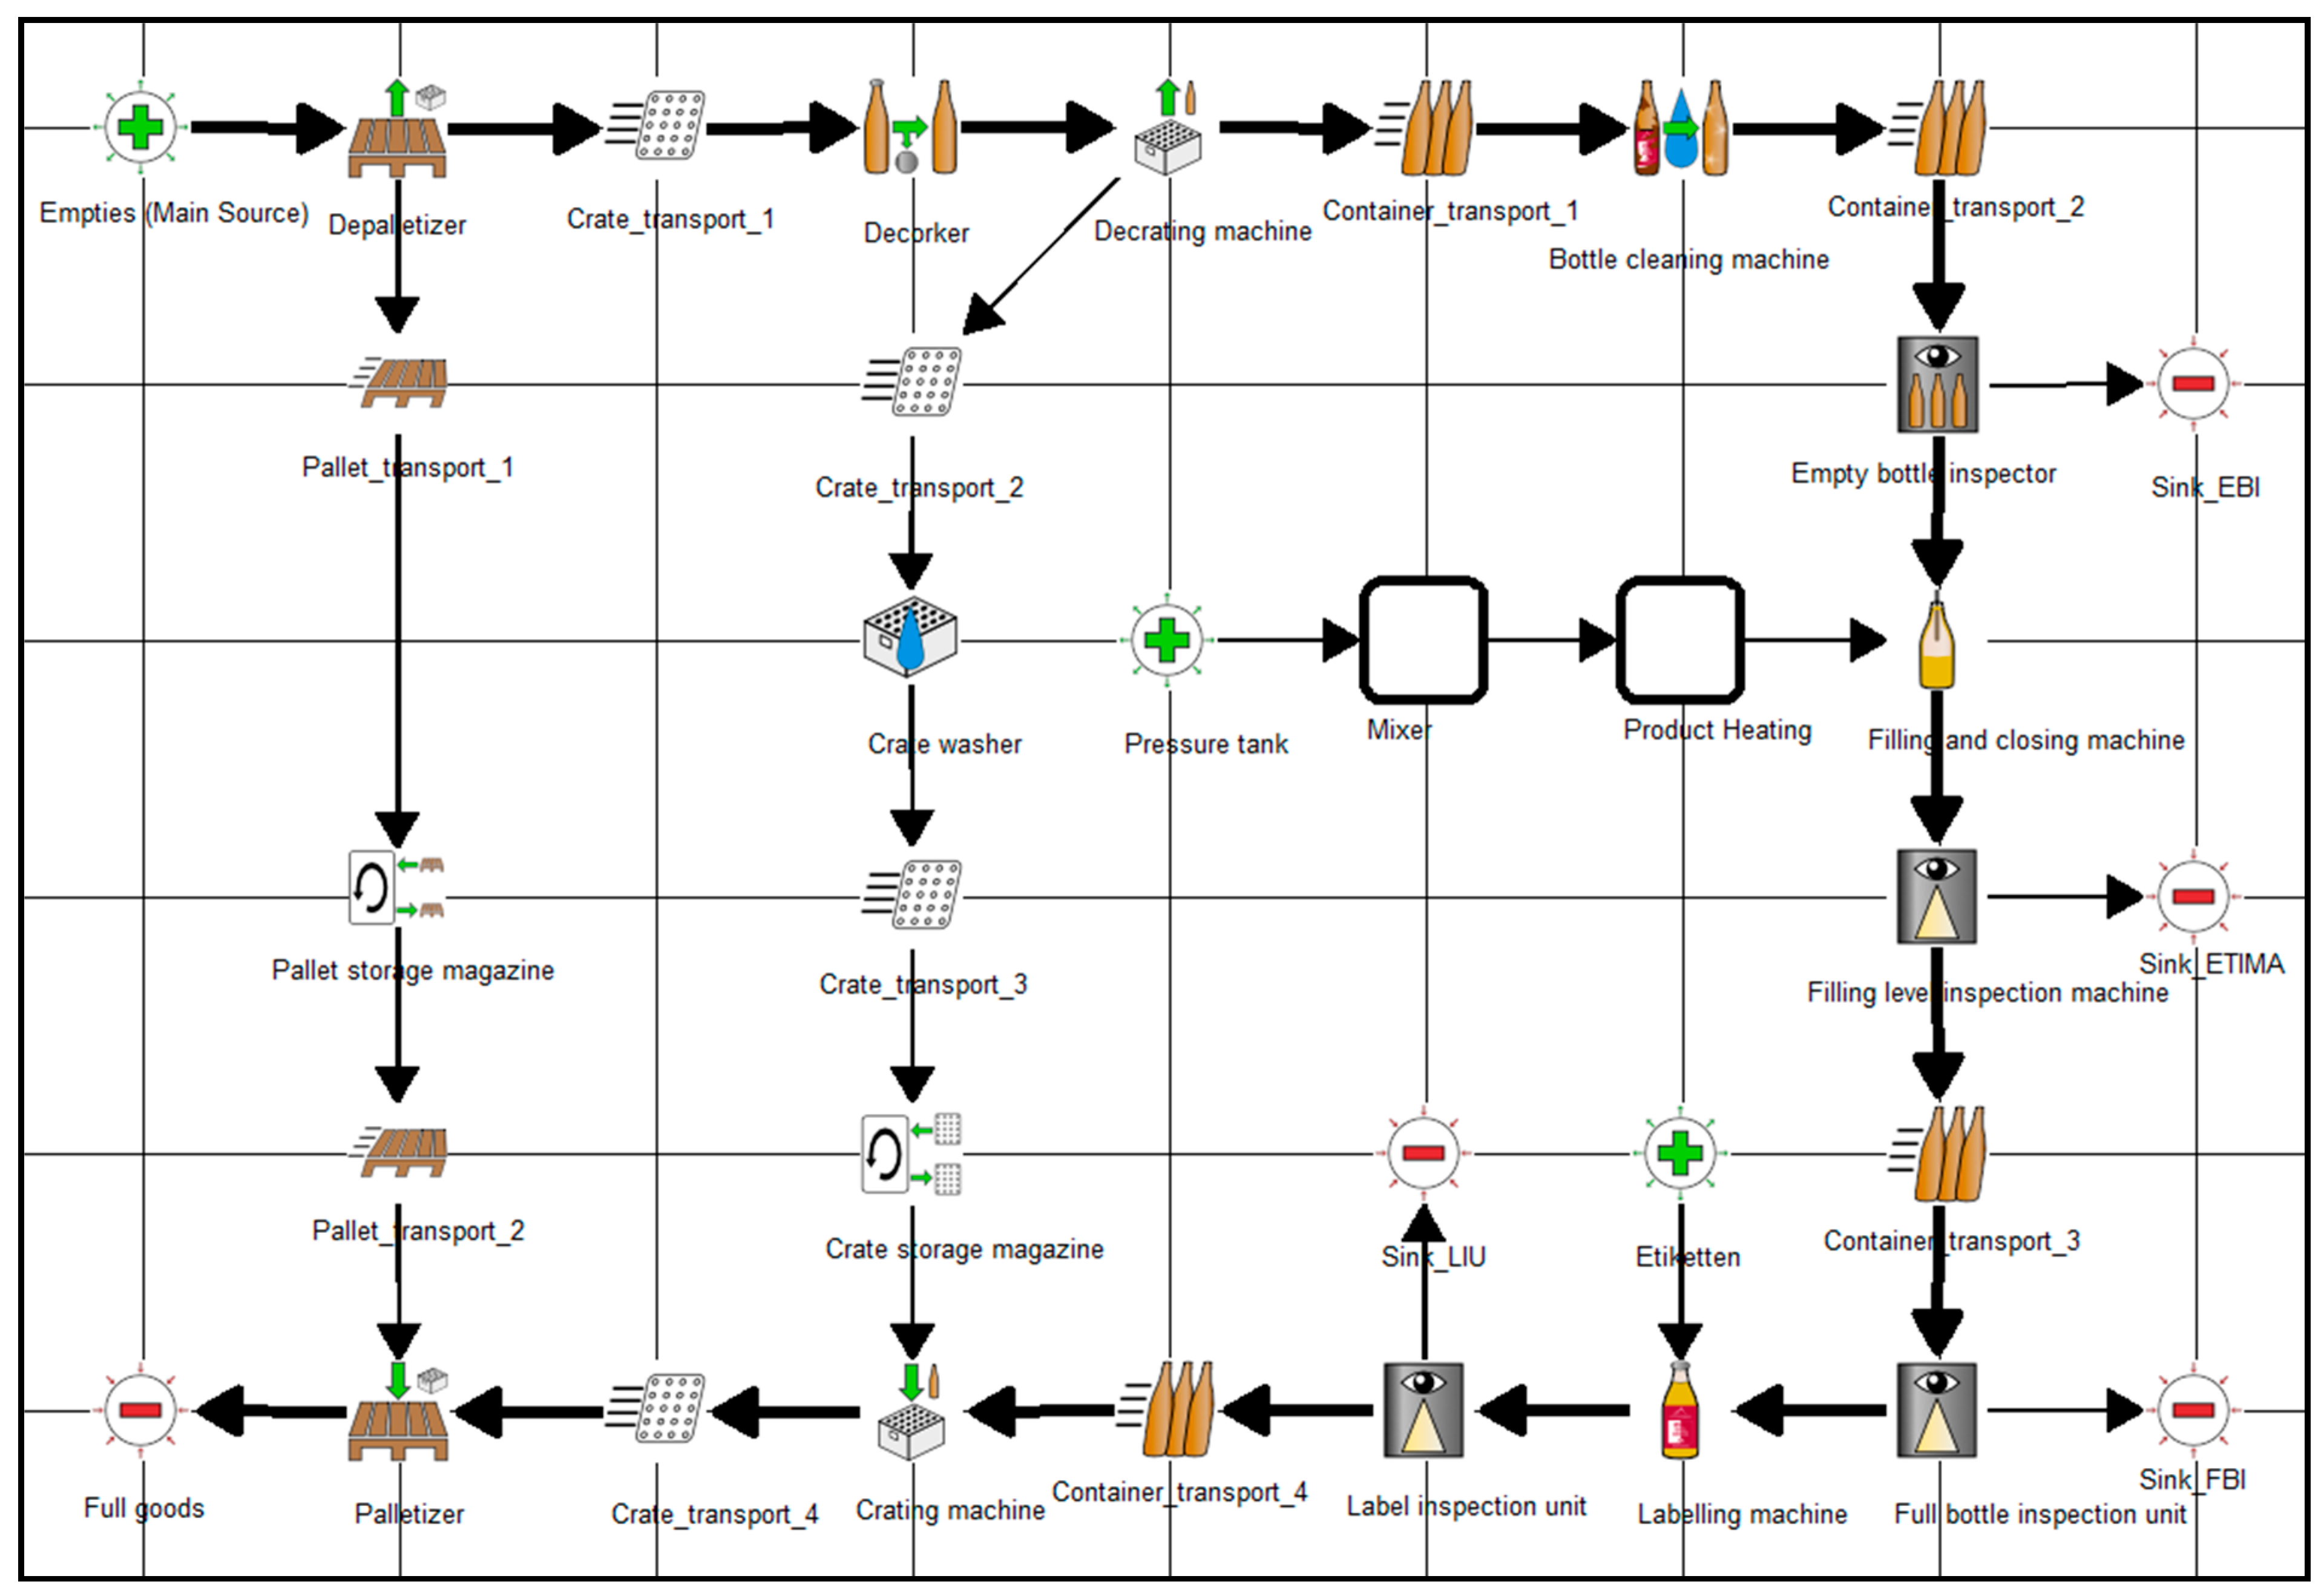
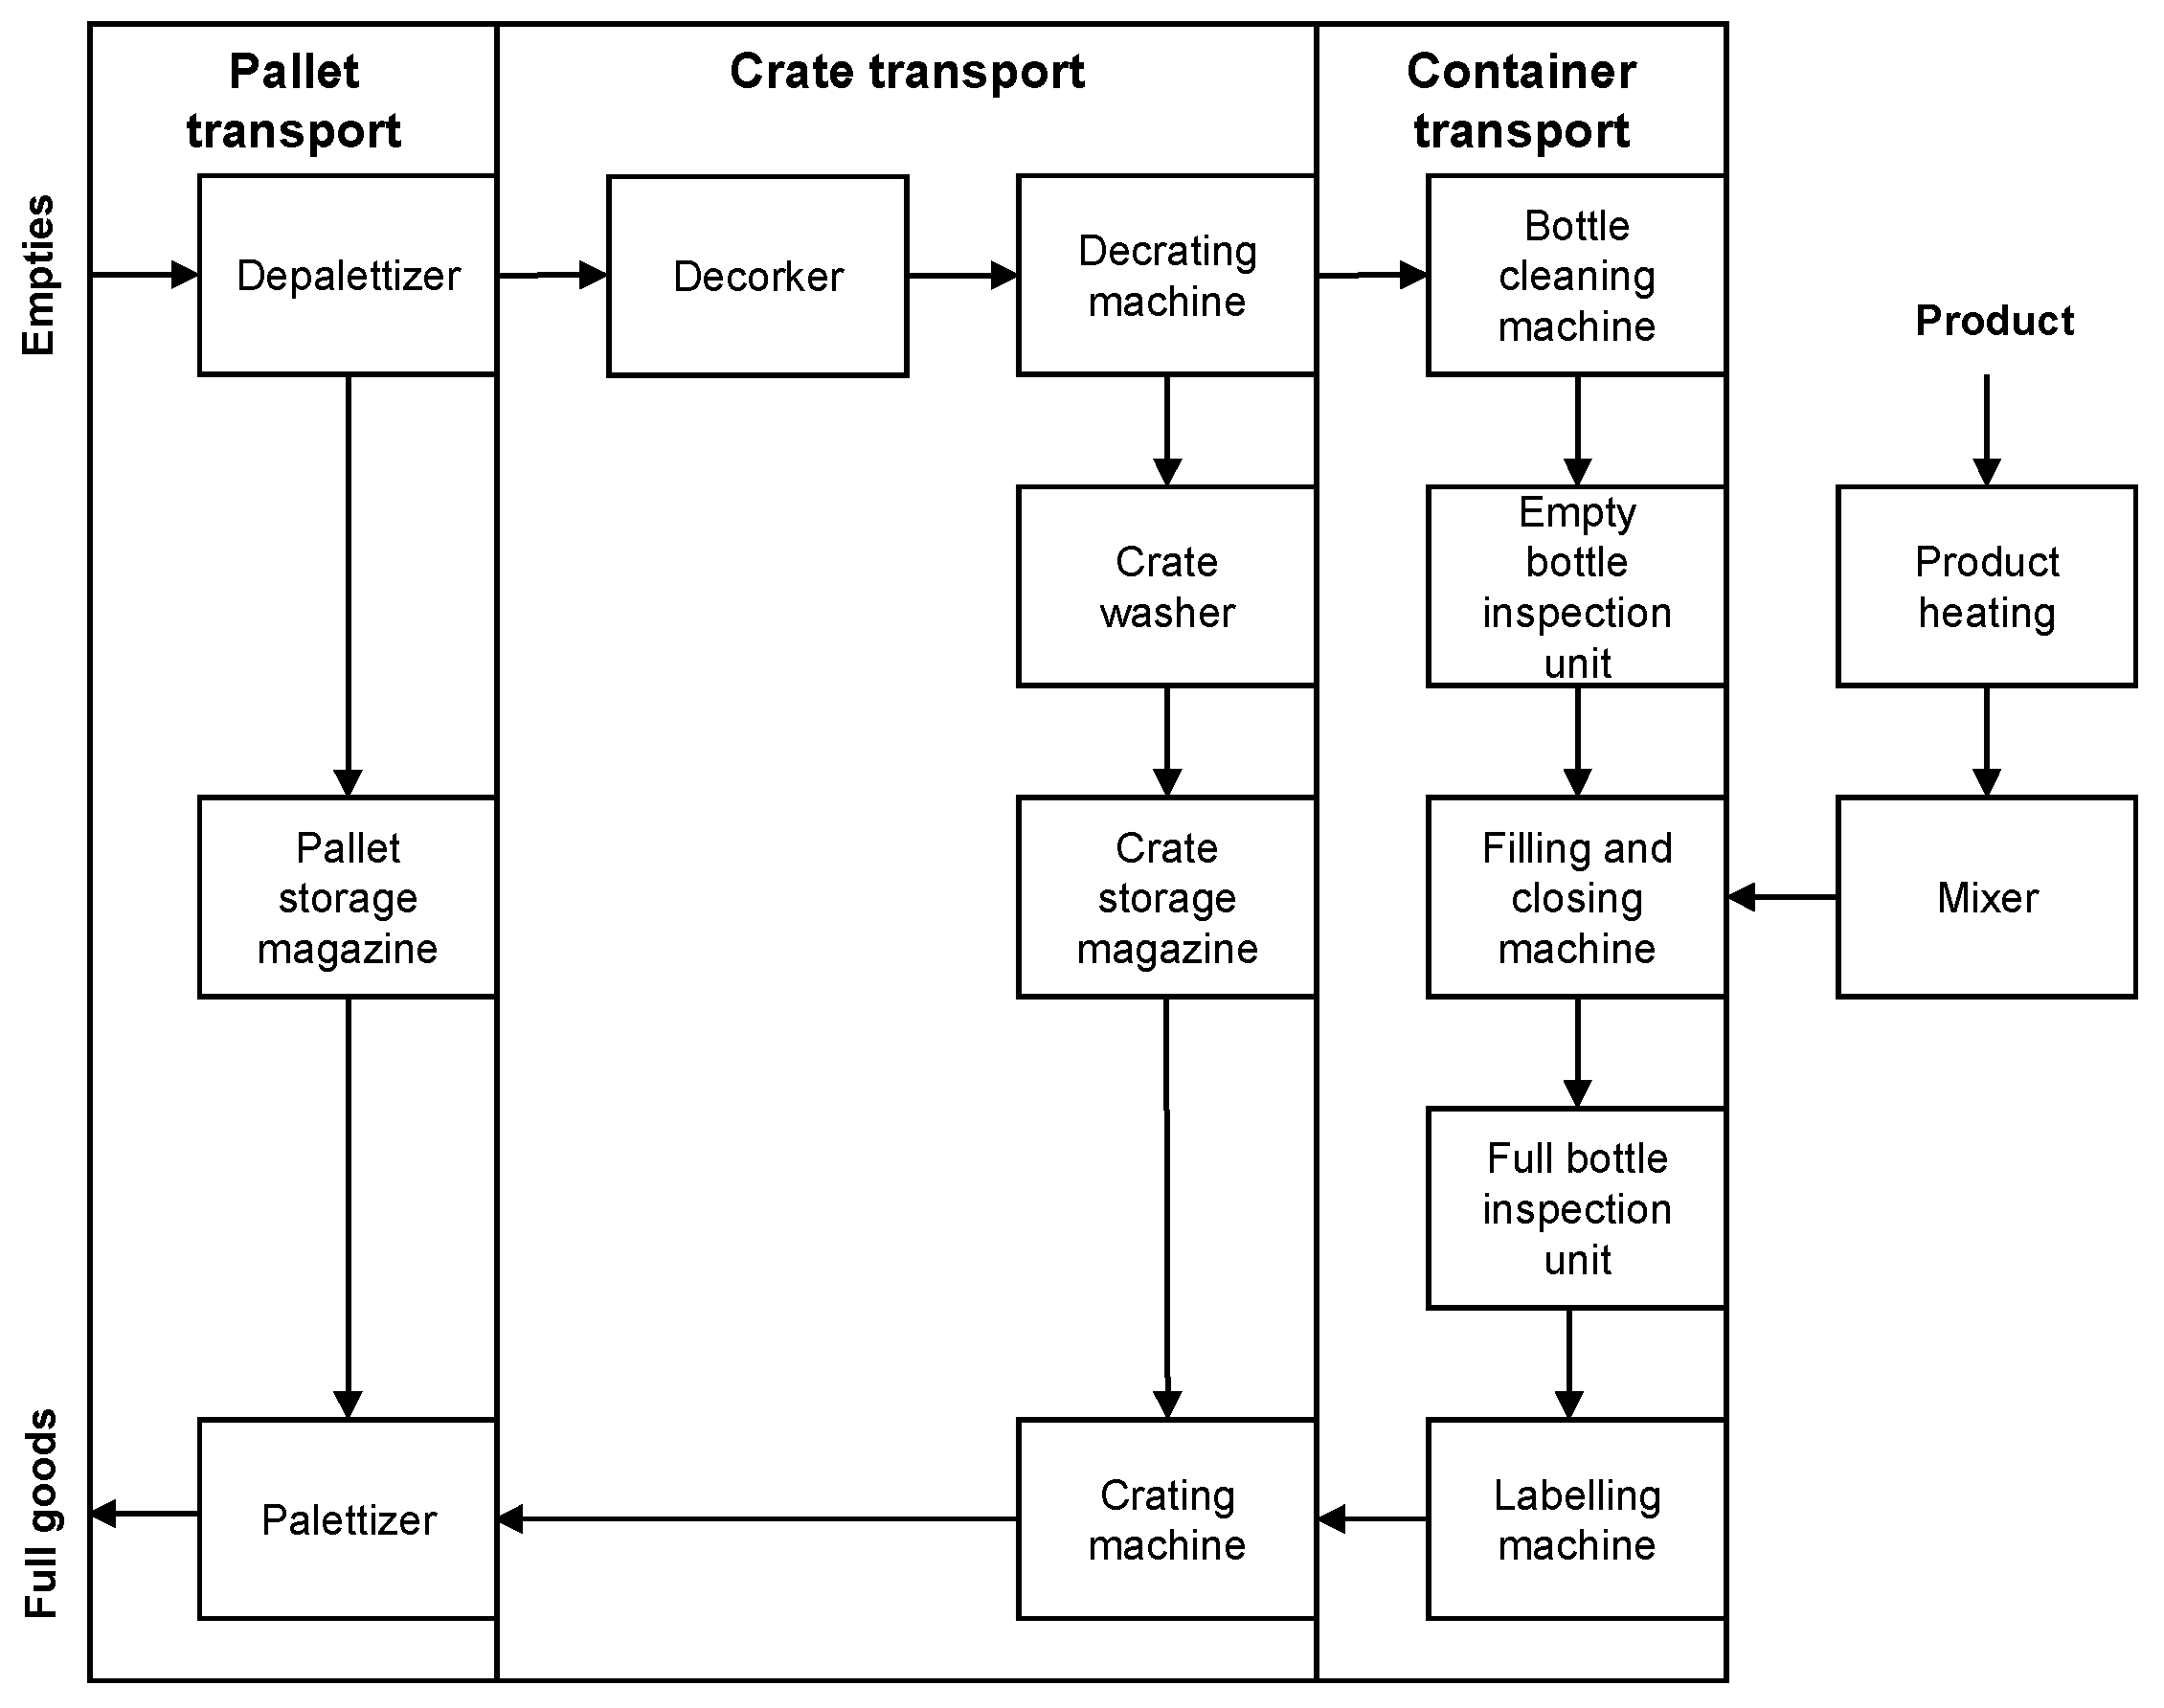
49]. The main product of the plant includes mineral waters, which are distributed nationwide. The plant is shown in simplified form in
Figure 2 and generally represents the schematic structure of this type of plant. The plant is divided into three sections, depending on the transport equipment used (pallets, crates, and containers). The interlinking of the conveyors enables the buffering of downtimes caused, for example, by the failures of individual machines. If the buffer time of the conveyors is exceeded, downtimes lead to failure propagation, which is characterized as a lack or tailback situation.
The empties are brought into the plant on pallets, and the crates are destacked by the depalletizer. The empty crates pass through the unscrewing machine, and the glass bottles are unpacked by the decrating machine onto the container conveyor. The bottles are transported to the bottle cleaning machine, where they are cleaned and disinfected. The bottles are inspected for damage and remaining impurities by the empty bottle inspector and are then filled and capped with product in the filling and closing machine. The filled bottles are inspected in the full bottle inspection machine for, e.g., glass splinters, and labels are applied in the labeling machine. The bottles are then packed in previously cleaned crates in the crating machine and stacked on pallets by the palletizer. The crate bypass stream is represented in simplified form by a crate magazine, since a complex throughput system for the crate transport is implemented in the real plant. In the pallet stream, the pallets are also buffered in a magazine.
In addition, a returnable PET beverage bottling plant is used as part of a use case. The plant follows the scheme shown above but differs in the additional machines and in the design of some machines. For example, a sniffer which detects the previous product of a bottle and rejects the unwanted bottles accordingly is used. In addition, a rinser and a flash pasteurizer are in operation. The filling process is further described in detail, among others, by Manger [
50].
Both plants are connected to an in-house data acquisition system (DAQ). The mode, operating status, and electrical energy consumption of each individual unit (see
Figure 3) are recorded every two seconds. In addition, the demand for thermal energy, water, CO
2, and compressed air is recorded for the entire plant. The data points follow the declaration of the Weihenstephan Standards [
51], which are a standardized data interface between the individual machines and a higher-level system. It defines the unique and standardized semantics of the individual data points as well as the transmission method. This makes it possible to receive and process equivalent data from each machine, regardless of the manufacturer.
The database of the returnable glass bottling plant comprises two measurement campaigns, the first covering a period of two months and the above-mentioned data scope. In contrast to the period of the second measurement campaign, the first data collection was characterized by an almost continuous production (apart from the weekend). For external reasons, the beverage bottling plant was in operation for only about 3 days per week during the second period (4 weeks). The individual units were equipped with measuring devices for recording the demand for compressed air and were connected to the DAQ. Further, units such as the empty bottle inspector, the full bottle inspector, and the decorker were added to the current measurement. The only consumer of thermal energy and water is the bottle cleaning machine, as its warm wastewater is used for the crate washer. The filling machine is the only unit requiring CO2 for the production of certain articles. A manufacturing execution system (MES) served as a source, for both plants, for detailed plans, which includes the production times, quantities of the articles produced, and long downtimes, caused by failures as well as maintenance and cleaning. The database for the returnable PET bottling plant comprises a period of 2 months, including data points such as the mode, the operating state, as well as the electrical energy demand of all machines.
The measured data from the DAQ are converted to a uniform data structure, which also serves as the structure for the data generated by the simulation. The data within the structure are divided into interval data, which include information such as the mode and operating state, and timestamp data, which cover all data, such as consumption values. The corresponding machines as well as data points are referenced via keys, which allows for an easy extension of the data structure.
3. Energy Consumption Behavior
Based on the findings of Osterroth et al. [
36], the operating state-related consumption behavior of packaging machines is used in the modeling and simulation and assigned to the following energy and media types: electrical energy, thermal energy, compressed air, water, and CO
2. The time-dependent intermediate-level application is omitted due to the granularity of the modeling on the unit level (see Chapter 5). In the definition of the consumption levels, the operating mode (WS_Cur_Mode) and the operating state (WS_Cur_State) [
51], which is described by a state model, are used.
Table 1 shows the assignment of the individual modes and states, which appear in the real data, to the consumption levels.
O
L is described by the off-mode (inactive) in the data point WS_Cur_Mode. This is present in standstill, e.g., on a weekend in which no production is planned. It is proven that most of the units also have a demand for energy and media in this case [
36]. During production, the listed operating states (WS_Cur_State) can be present. These are basically divided into the normal operation of the machine (C
L), a lack or tailback situation (D
L1), as well as failure situations (D
L2).
4. Determination of Simulation-Relevant Parameters
For an automatic determination of simulation parameters, such as consumption levels as well as parameters for the description of the failure behavior, an evaluation software was developed. The parameters can be specific to various evaluation criteria, such as article-based, container type-based, or based on any time periods.
The mean consumption levels of the individual energy and media types are calculated in the intervals in which the same operating state is present. In addition to the machine-specific determination of the total consumptions, a detailed statistical evaluation of the consumption values (weighted mean value, standard deviation, variance, standard error, and 95% confidence interval) is performed.
Failure behavior is determined using the operating state of a machine [
22]. The TTR (Time To Repair) refers to the duration of downtime, while the downtime-free running time between two successive downtimes is defined as TBF (Time Between Failures). To determine the TTR, the times of the states of the D
L2 are combined, and for the TBF, the states of the D
L1 as well as C
L are combined (see
Table 1). The availability results are shown in Formula (1).
In addition, the operating and downtimes are examined with regard to the distribution curve of the failure behavior. The suitability of the Weibull, negative exponential, and lognormal distributions was examined by Voigt [
22], whereby the Weibull and exponential distribution achieve the best fit. This could be confirmed graphically by means of histograms and QQ-plots, including the chi-square test. The neg. exponential distribution is used in this work because random failures with a constant failure rate are assumed, and this describes the behavior sufficiently accurately. Moreover, the exponential distribution can only be described by one variable (β) [
22].
Apart from the data from the DAQ, it is necessary to determine further parameters directly in the plant. Therefore, the topological data of the plants as well as all machines and transport equipment were determined as part of performance analyses in accordance with DIN 8743 [
52]. The set performance of all individual units was analyzed using measuring light barriers and manually by means of a minimum triple determination. Further, the capacities per filling article of the individual units as well as the global rejection rates of inspection machines were determined. All buffer sections were investigated with regard to their buffer capacities and times.
5. Modeling Approach
Since modeling is one of the biggest barriers for SMEs, a modeling editor, presented by Bär et al. [
48], was used. The editor was developed with special attention to a user-friendly and simple application to enable modeling for users without a specific pre-qualification. This was successfully validated and demonstrated by using a systematic test and exemplary simulation studies. The holistic modeling of production systems with respect to their energy and media consumption is made possible by the use of context-free modeling columns. The editor generates a standardized XML-based configuration file, which contains all required simulation-relevant parameters and structures of the columns, for any subsequent simulation environment. The parameters must be entered manually in the modeling editor. Numerous help functions support the user, and the modeling can be simplified and accelerated. The modeling approach implements existing standardizations, such as ANSI/ISA S88 [
53]. The modeling columns consist of a physical model to represent real existing plants, a process model to represent batch production processes by an article model and a production plan model. The modeling depth of the editor is to the unit level (e.g., the filling machine). This is mainly related to the scope of the required parameters as well as to the complexity and accuracy of the models and is sufficiently discussed by Bär et al. [
48]. If the batch-oriented production process is modeled, the process model, which describes the energy and media consumption behavior at the process operation level, is used. The article model allows for the modeling of different filling articles, which can be produced on the process cells of the physical model. Each unit can be parameterized with regard to its consumption and performance-describing parameters, but also with regard to the container type, as well as the packaging ratios. The production plan model describes the production to be processed in the simulation. It comprises, inter alia, a shift plan for the definition of the production and non-production times [
52], e.g., a weekend, when no production is planned. Further, a sequence plan, which determines the sequence of the articles and quantities to be produced, is defined. In a matrix table, the required changeover and cleaning times, which are required between the articles in the sequence model, are determined.
6. Simulation Environment
All simulation studies were carried out using the “PacSi” simulation environment [
54] developed by SimPlan AG, Dresden, Germany. The software follows a discrete-time approach with regard to the applied simulation method and is based on a simulation of the material flow. The simulation environment is further described by Römisch and Weiß [
55] and was used for various applications [
21,
56]. Model creation within the software is based on building blocks, which differ fundamentally in functionality, the separation and merging of material flows, and parameter sets. The individual units are assigned a stochastic failure behavior, and failure propagation is achieved by the chaining of the machines by transport devices.
Failure behavior is described by the variation, by means of a random number generator, of the seed key, which initializes a random number stream. Thus, these streams for the MTTR and MTBF are newly generated according to the distribution function (negative exponential) with each simulation run, and the times and durations of the failures are varied. Therefore, different results are obtained with each simulation run, whereby statistical certainty can be achieved over long simulation durations, on the one hand, and multiple repetitions of the experiments, on the other.
In the scope of this work, the simulation environment was extended by numerous functions. The most important extension is the automatic generation of simulation models based on the configuration file of the modeling editor. The different specific building blocks of the modeling editor are therefore mapped to the existing ones of the simulation environment. By using a coordinate system as well as the edges of the elements in the modeling editor, the topology and logical structure can be reformulated in the simulation environment. During simulation model creation, the parameter sets of all units are loaded from the configuration file and reformulated if necessary, and the simulation model is parameterized. A special feature here is the integration of a production plan, i.e., the shift plan, the sequence of different recipes and articles, as well as the changeover matrix. This is mainly solved by sources, elements in which material is released in the simulation, by storing the non-production times as well as the times between the recipes/articles and their specific article number. This indexing allows for an element-specific parameter change and thus enables a recipe/article-specific simulation within the production plan. Non-production times defined by the shift model are also a special feature, as the newly implemented off-consumption level (OL) is active in this time. Consumption in the production times is described by the respective operating state. The simulation results, which are generated every second, are stored in a SQLite database.
7. Evaluation, Verification, and Validation
The aim of verification and validation is to reduce the erroneous statements of simulation studies and thus to minimize the risk of the resulting wrong decisions. Verification involves the transformation of a model from one type of representation to another. In the present case, the correct transformation of the model from the modeling editor to a simulation model is meant. Validation, in turn, is to ensure the correct behavior of the model in relation to the original model. The validity of the model for the specific application purpose is checked [
42].
For validation, the corresponding periods were simulated with 10 repetitions. The simulation results of the cumulative consumption of the entire plant and the individual units were each statistically examined. The mean values were compared with the corresponding real values, and the percentage deviations were calculated. Furthermore, the consumption values with regard to the individual filling orders were determined and compared with the real values. The production counter of the filling machine constitutes the reference point for the end or start of a filling order. In parallel, the production quantities and times were determined and compared with the real values. Use cases should, among other things, reveal the optimization potential with regard to the energy and media efficiency of the beverage bottling plants investigated in the validation periods presented. The savings achieved should be higher than the deviations determined in the validation to avoid erroneous statements.
8. Results
8.1. Validation Periods and Parameter Determination
Two different time periods considering different factors are available for validation. Validation period 1 comprises the electrical energy demand of the units, and an extensive production schedule including non-production times such as a weekend is simulated. Validation period 2 includes the full energy and media demand of the units of the beverage bottling plant, but a shorter time period with only two articles is included.
Consumption parameters were article-specifically determined for period 1 and container-type specifically for period 2, due to the insufficient article-specific database here. According to Sargent [
57], the orders of the articles produced within the validation periods were not included in the periods of consumption parameter determination. The values describing the failure behavior of the machines were determined specifically for the corresponding orders in the validation periods. A detailed overview of the validation periods with regard to the articles produced as well as the production times and quantities is given in
Table 2.
The real data recorded by the DAQ of the production plan were converted to the presented data structure, and the simulation-relevant parameters were determined automatically by executing a self-programmed software in MATLAB 2020b. This resulted in a total of approximately 1250 parameters for all five articles.
Table A1 (
Appendix A) shows the state-related energy and media-specific mean consumption data for each consumption level, including the 95% confidence interval, and the failure behavior data (within the validation period) exemplary for article 4. The correct operating status reports of the individual units were randomly checked during operation. The changeover times between the individual articles for possible required conversions or cleaning were taken from the validation periods of the real data. The basis for this is the production counter of the filling machine (no increment over a longer period means a changeover). Due to the lack of repetitions, it was not possible to consider several changeover periods.
8.2. Model of a Beverage Bottling Plant
The beverage bottling plant investigated in this work was modeled in the described editor (
Figure 3) and is a more detailed version, as already presented by Bär et al. [
48]. The main differences are due to the representation of further units, such as inspection machines, decorker, etc., which could be examined within the scope of the additional data acquisition. The main material flow (thick arrows) starts with the main source at the top left and runs clockwise to the source at the bottom left. The two secondary flows (thin arrows) for pallets and crates are located on the left side and in the middle, respectively. The articles produced in the validation periods were modeled with article-specific parameters in each case.
The present model covers a much larger scope than already presented, since numerous articles, including their article- or container-specific parameters, are modeled. In addition, the schedule within the production plan was parameterized with the articles and production quantities per filling order listed in
Table 2. The changeover times were transferred to the matrix to define the times between the individual articles. The shift times for validation period 1 could be determined from the real data (non-production from Saturday 08:30 am to Monday 07:00 am) and were parameterized in the modeling editor.
8.3. Verification and Validation
8.3.1. Model and Simulation Verification
A verification of the model creation and the function of the simulation environment was performed by hand in three steps. Therefore, the configuration file from the modeling editor was loaded in the simulation environment, and the model was generated automatically. The topology of the beverage bottling plant and the correct connection of the elements were successfully checked. After a simulation run is started, the respective unit- and article-specific parameters are loaded. By regularly stopping the simulation to check all articles, the parameters were successfully compared with those of the model in the modeling editor. A verification of the correct functioning of the simulation environment was performed using the result data, which were analyzed, on the one hand, using the open source software HeidiSQL_11, which allows access to, and the viewing of the SQLite databases; and, on the other hand, via the described evaluation tool. In particular, the application of the correct consumption levels with regard to the operating status of the individual unit was checked. In addition, the main source, which is the origin of the main flow and thus represents the production plan, was checked for correct functioning with regard to production quantities and changeover times. In all cases, the verification was carried out continuously with the development process of the simulation environment and was successfully completed.
8.3.2. Validation of Energy and Media Demand in Period 1
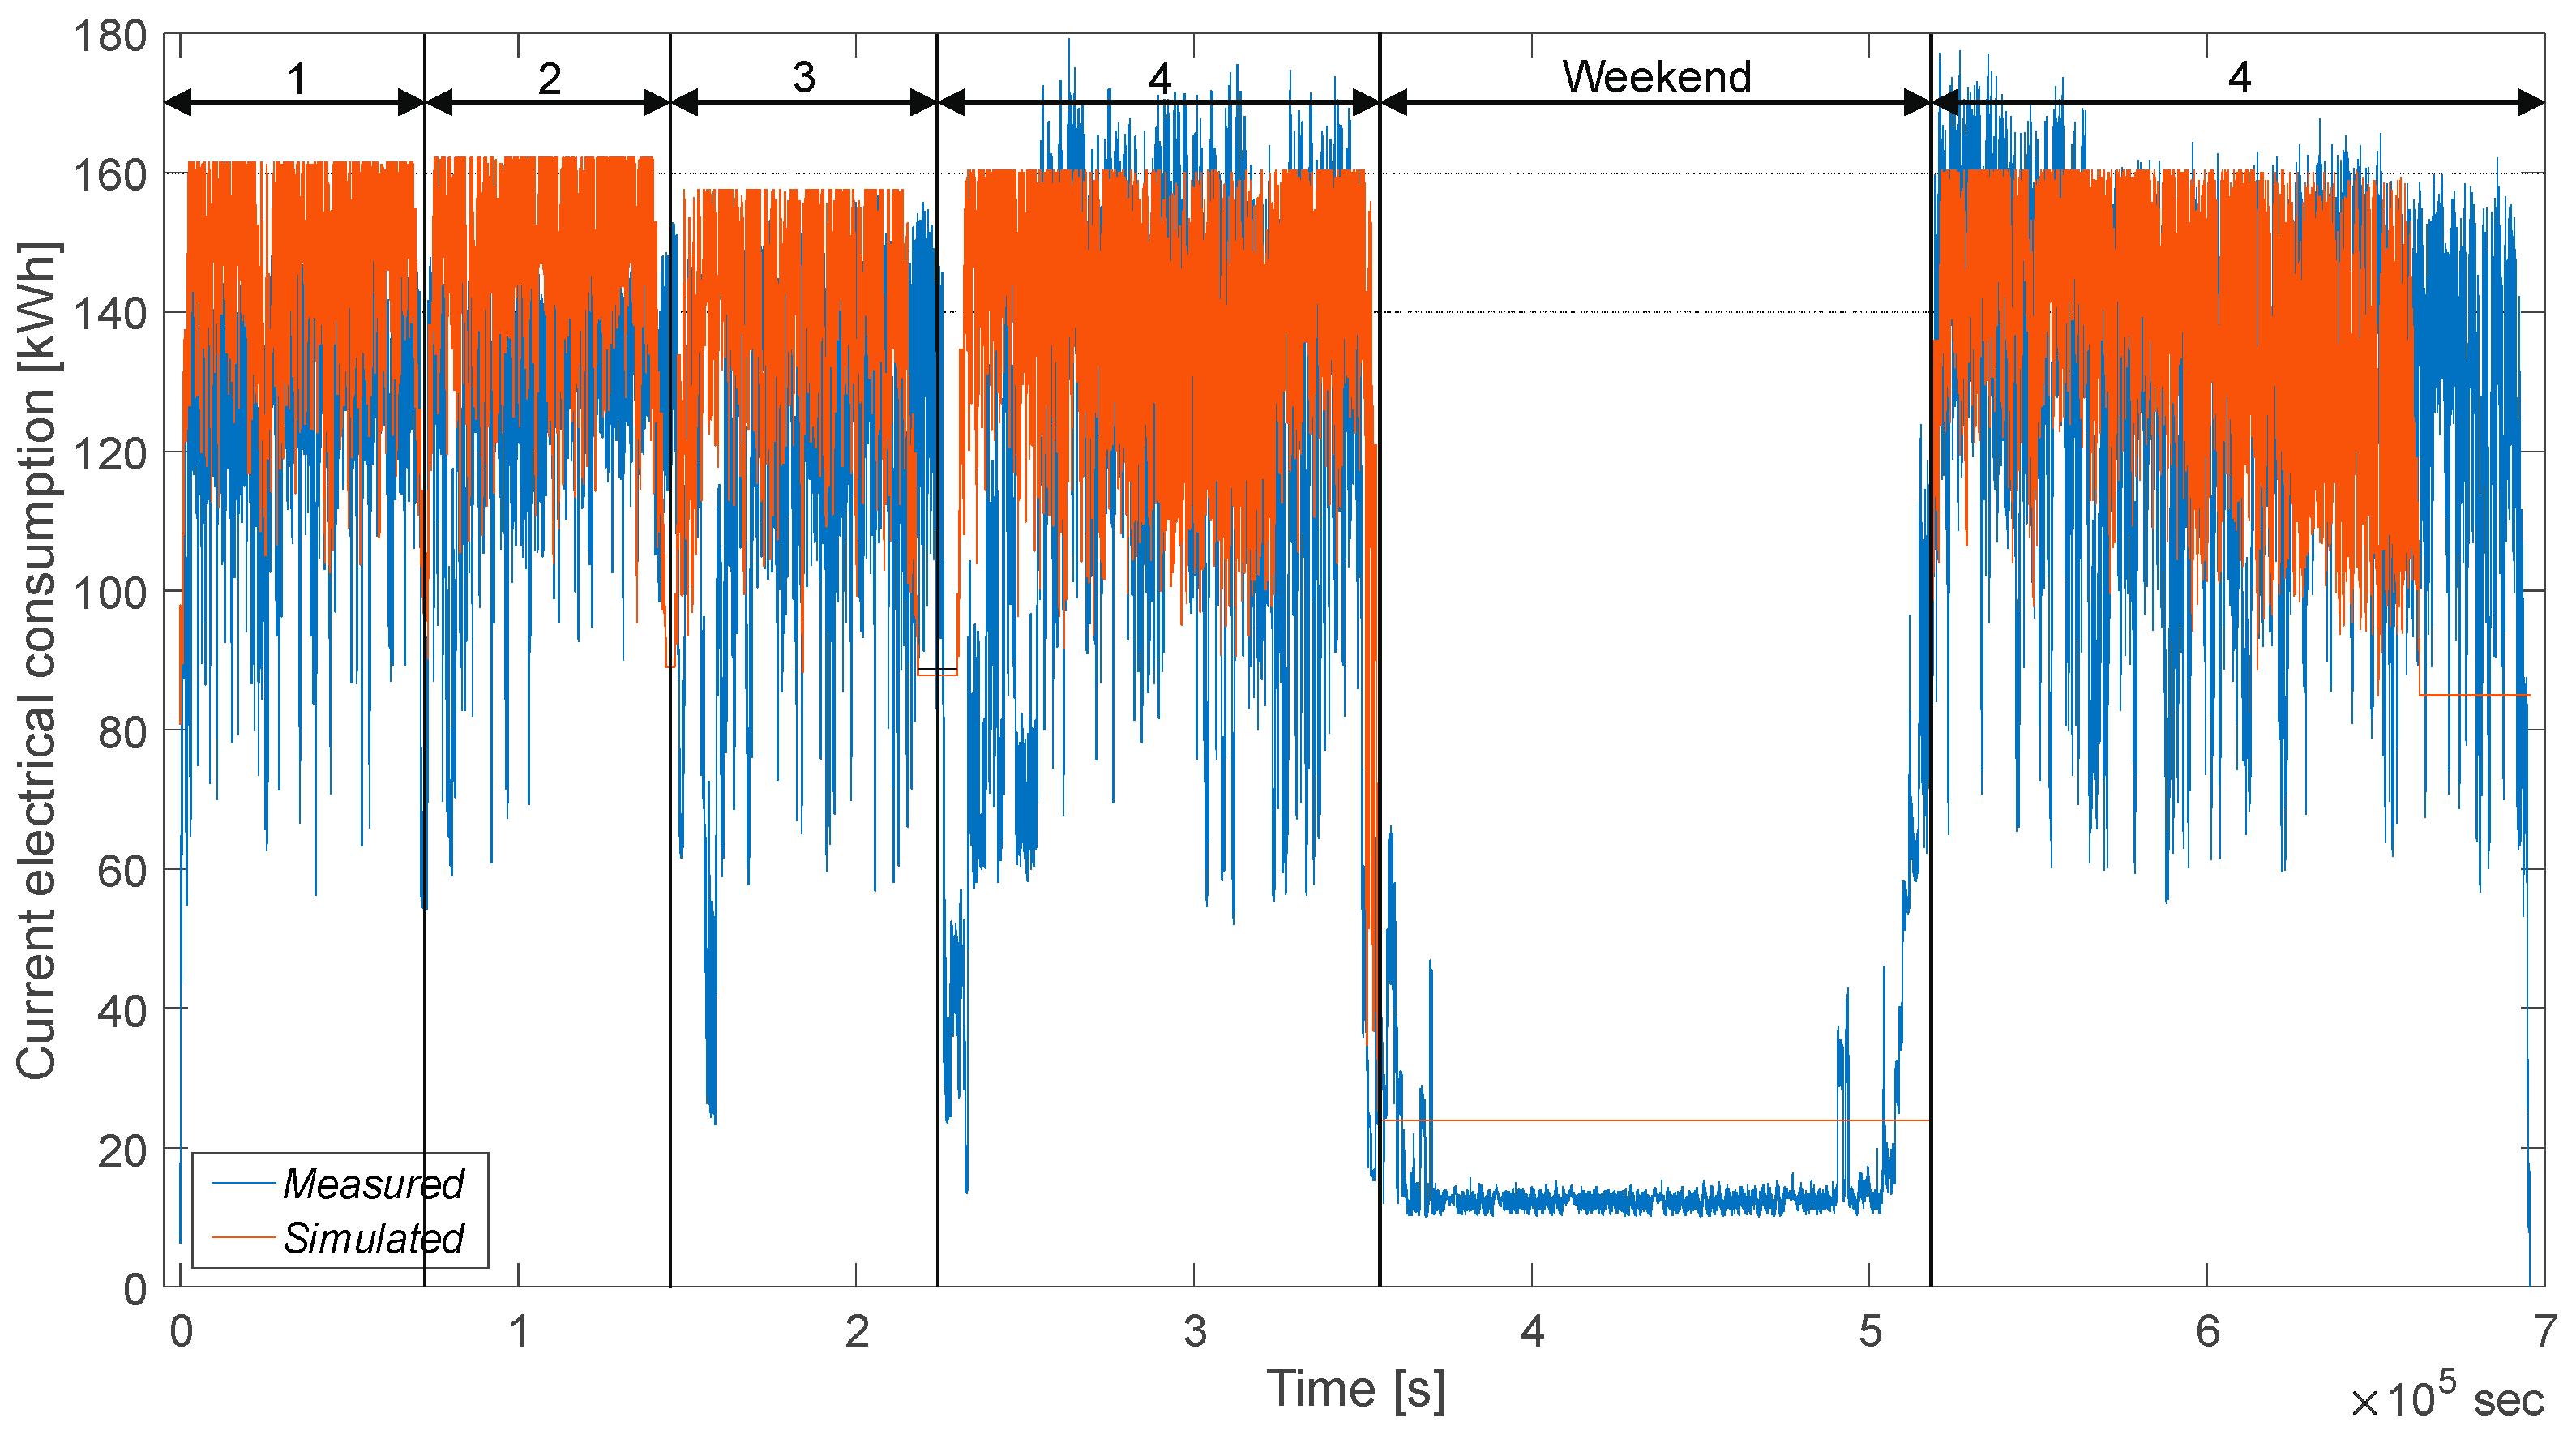
The focus in the first period is on electrical energy consumption and on the complex production plan.
Figure 4 shows the measured and simulated electrical energy consumption of the beverage bottling plant. The subdivision shows the four articles, which differ by a distinct total power requirement, as well as the production-free weekend, which represents idle time (duration 46.25 h) [
52].
The production quantities of all articles show a deviation of less than ±0.1% compared to the real production counter of the filling machine. The production times of article 1 and 2 are within a range of approx. −6–8% compared to the determined real-time periods. Article 3 shows a deviation of approx. −4.5%. Article 4 shows a total deviation of −11.2%, i.e., an accelerated production within the simulation.
Table 3 shows the mean values of the simulated data and the percentage deviation of these data from the real data for the entire period, as well as the individual production periods of the articles. Starting with the entire plant, the individual units are listed in descending order of their electrical energy demand. No measured data are available for the decorker, empty bottle inspector, and full bottle inspector, as these could only be included in validation period 2. The bottle cleaning machine, the crate conveyors, and the mixer could be clearly identified as the main consumers of electrical energy. These account for about 70% of the total amount of electrical energy and consistently show a very small percentage of deviation from the measured data. The bottom 50% of the units account for only 12.3% of the total amount of electrical energy. Over the entire period, a percentage deviation of 0.33% for the electrical energy demand of the entire plant could be determined. In the article-specific validation, it is noticeable that units such as the filling machine, the pallet transport, and the depalletizer show quite high deviations. The large deviations at article 4 are due to a long downtime (lack of staff in the plant and in the supply) at the beginning of the article, which can be explained by the malfunction reports. Since long downtimes only occur very rarely due to the failure behavior distribution, the simulated production runs faster and reaches the planned production quantity earlier.
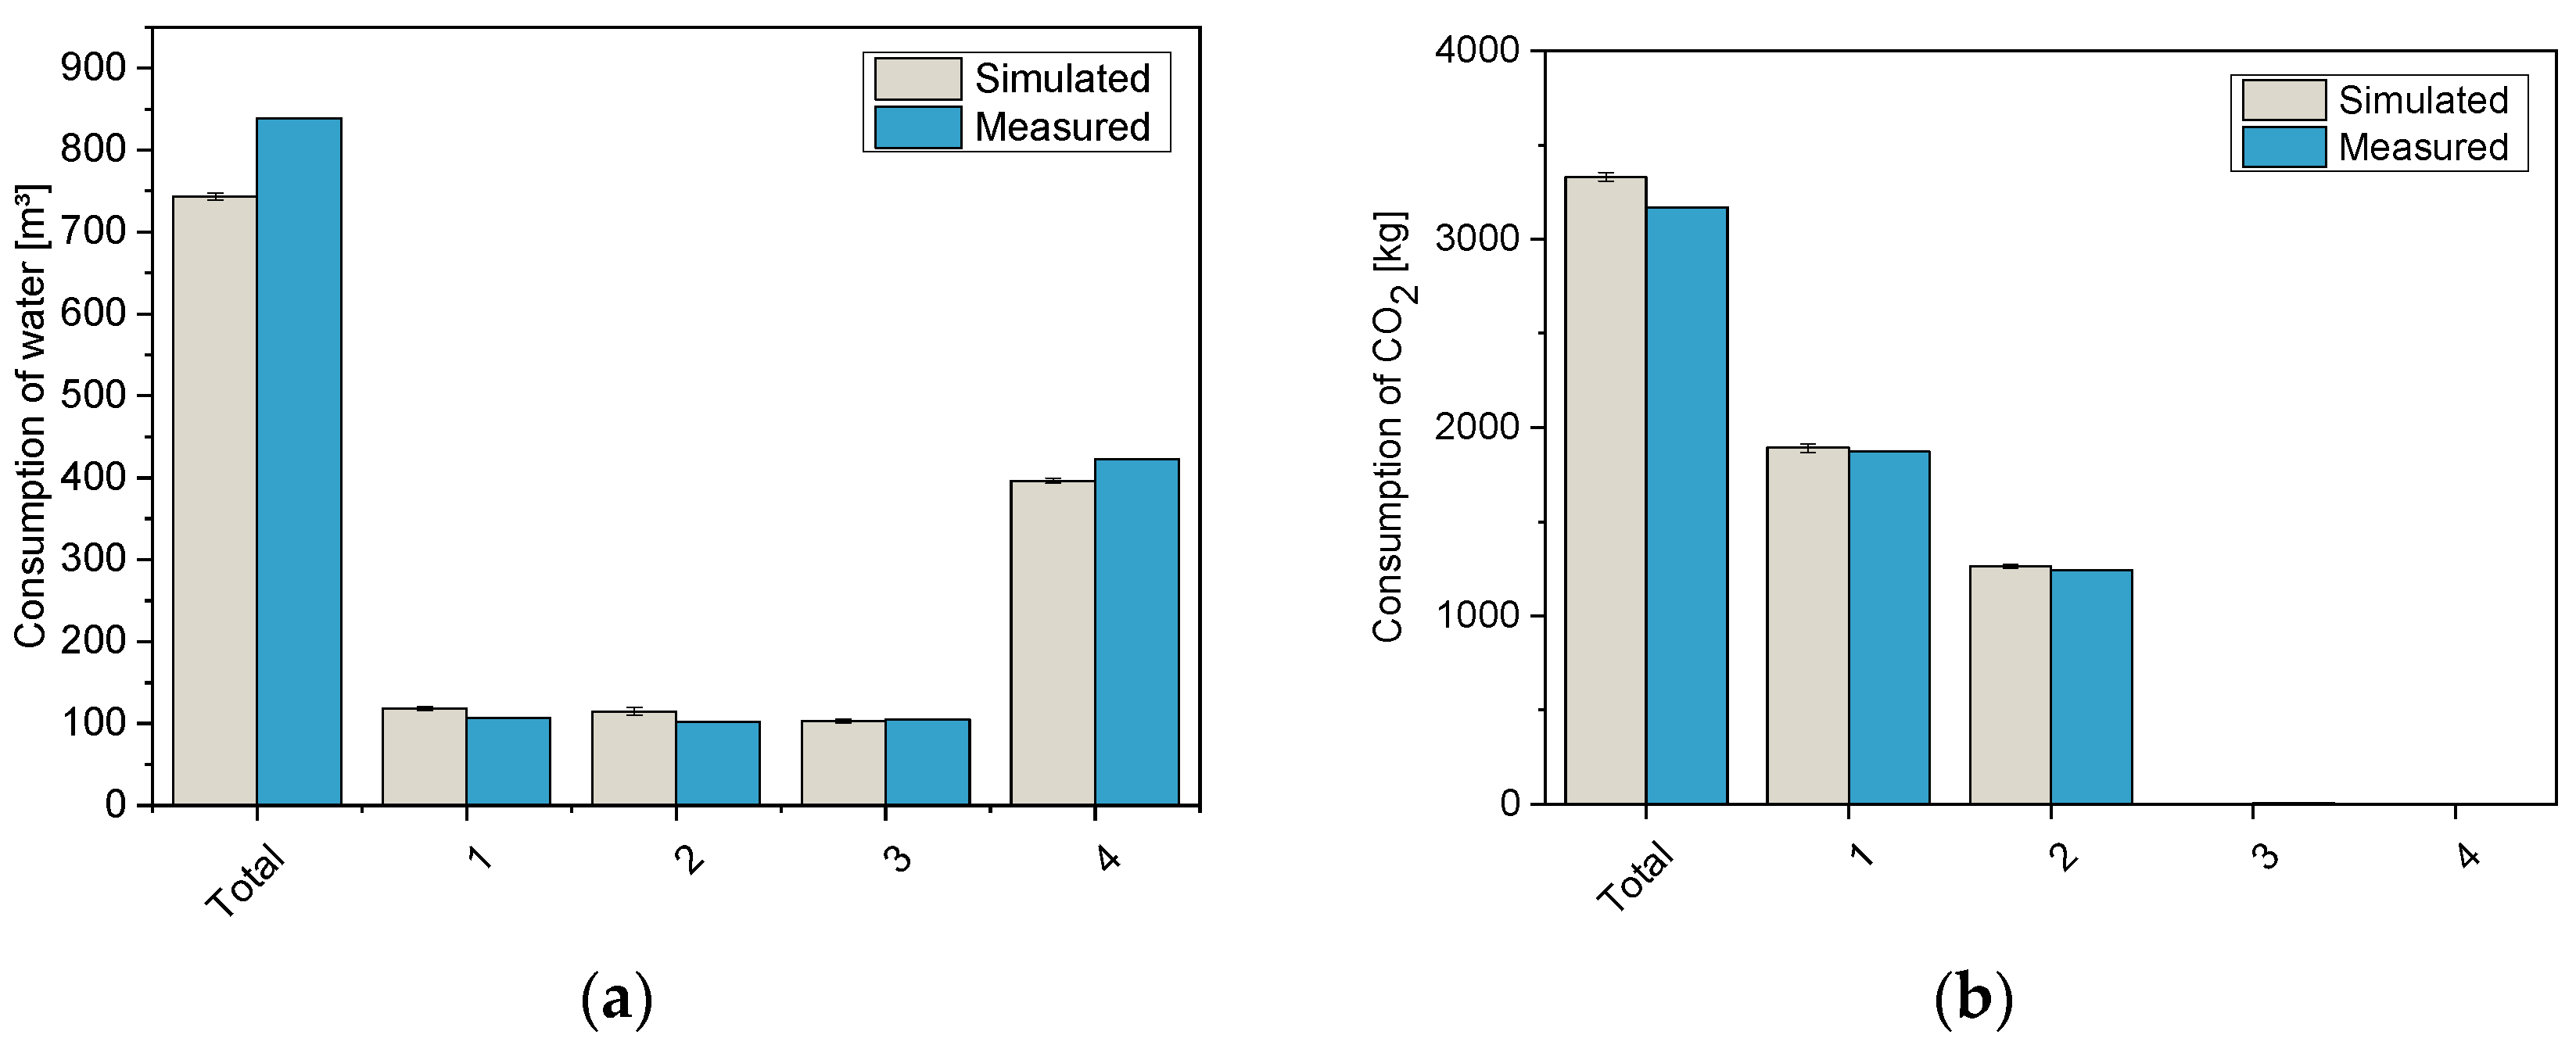
Figure 5 shows the consumptions of water and CO
2 within validation period 1. Since articles 3 and 4 are “mineral water still”, no CO
2 is required. The total consumption shows a deviation of approximately 5% compared to the measured value. The water consumption of the bottle cleaning machine shows an overall deviation of −11%.
8.3.3. Validation of Energy and Media Demand in Period 2
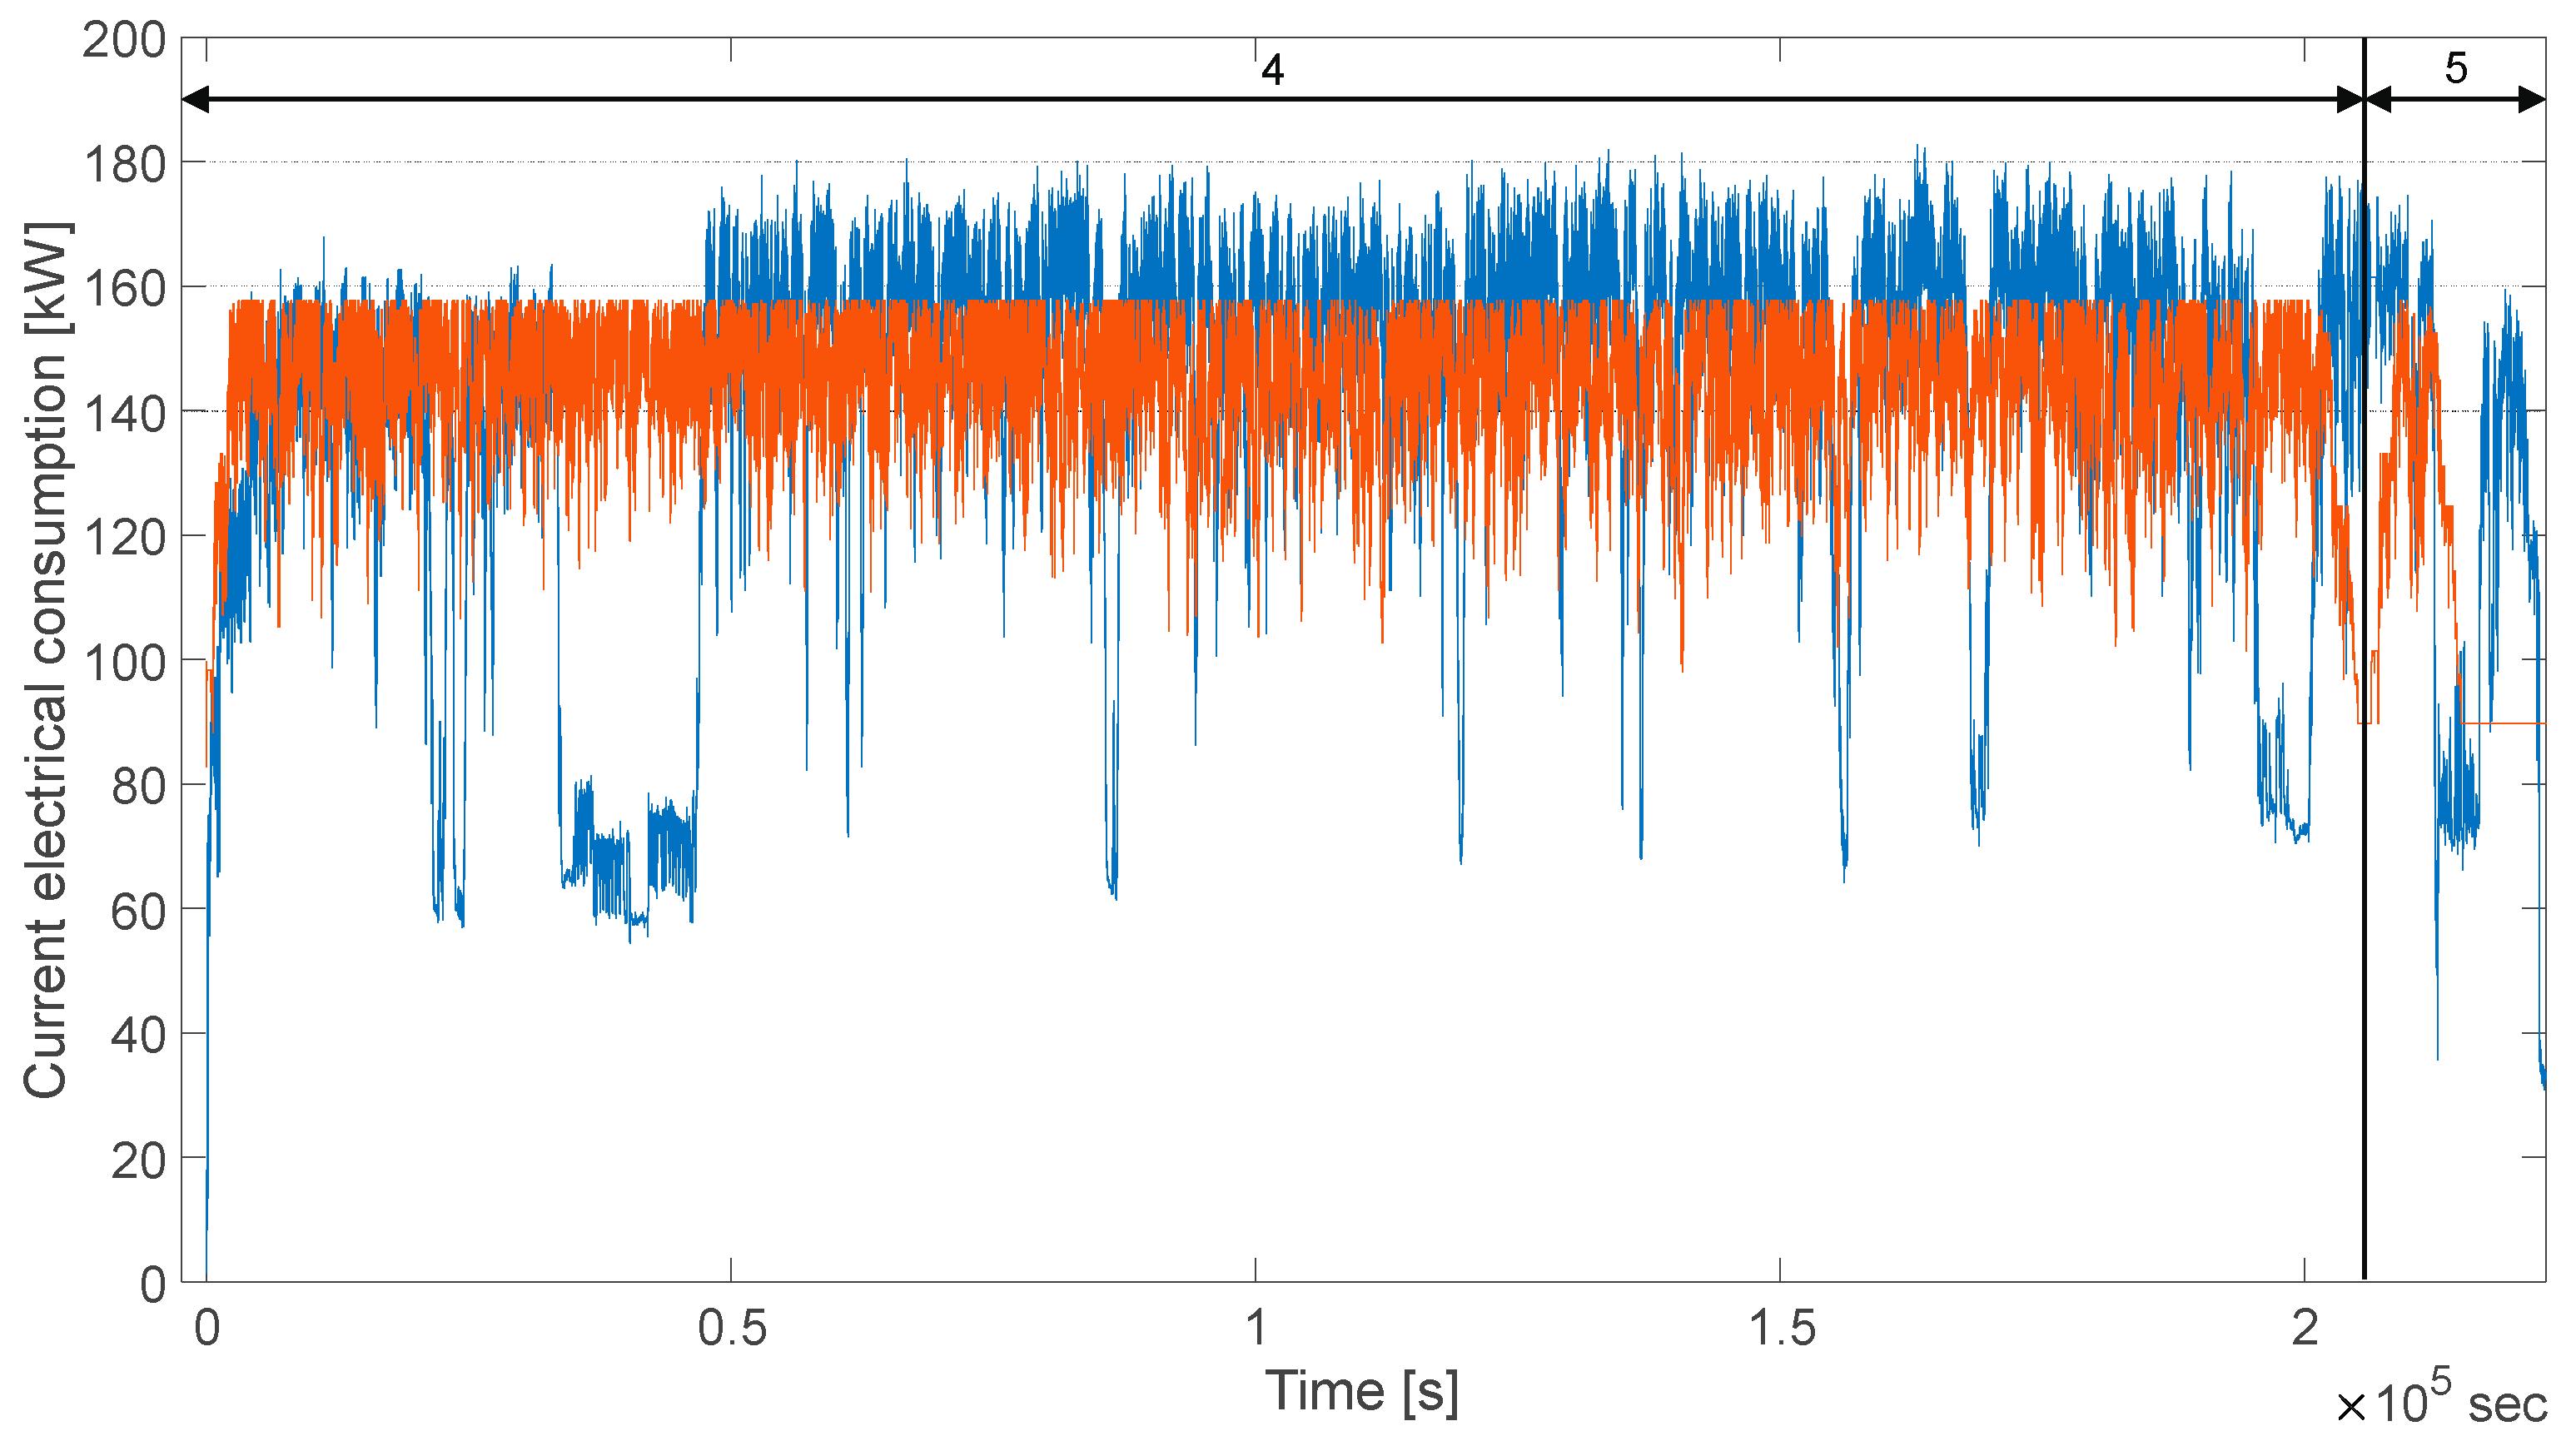
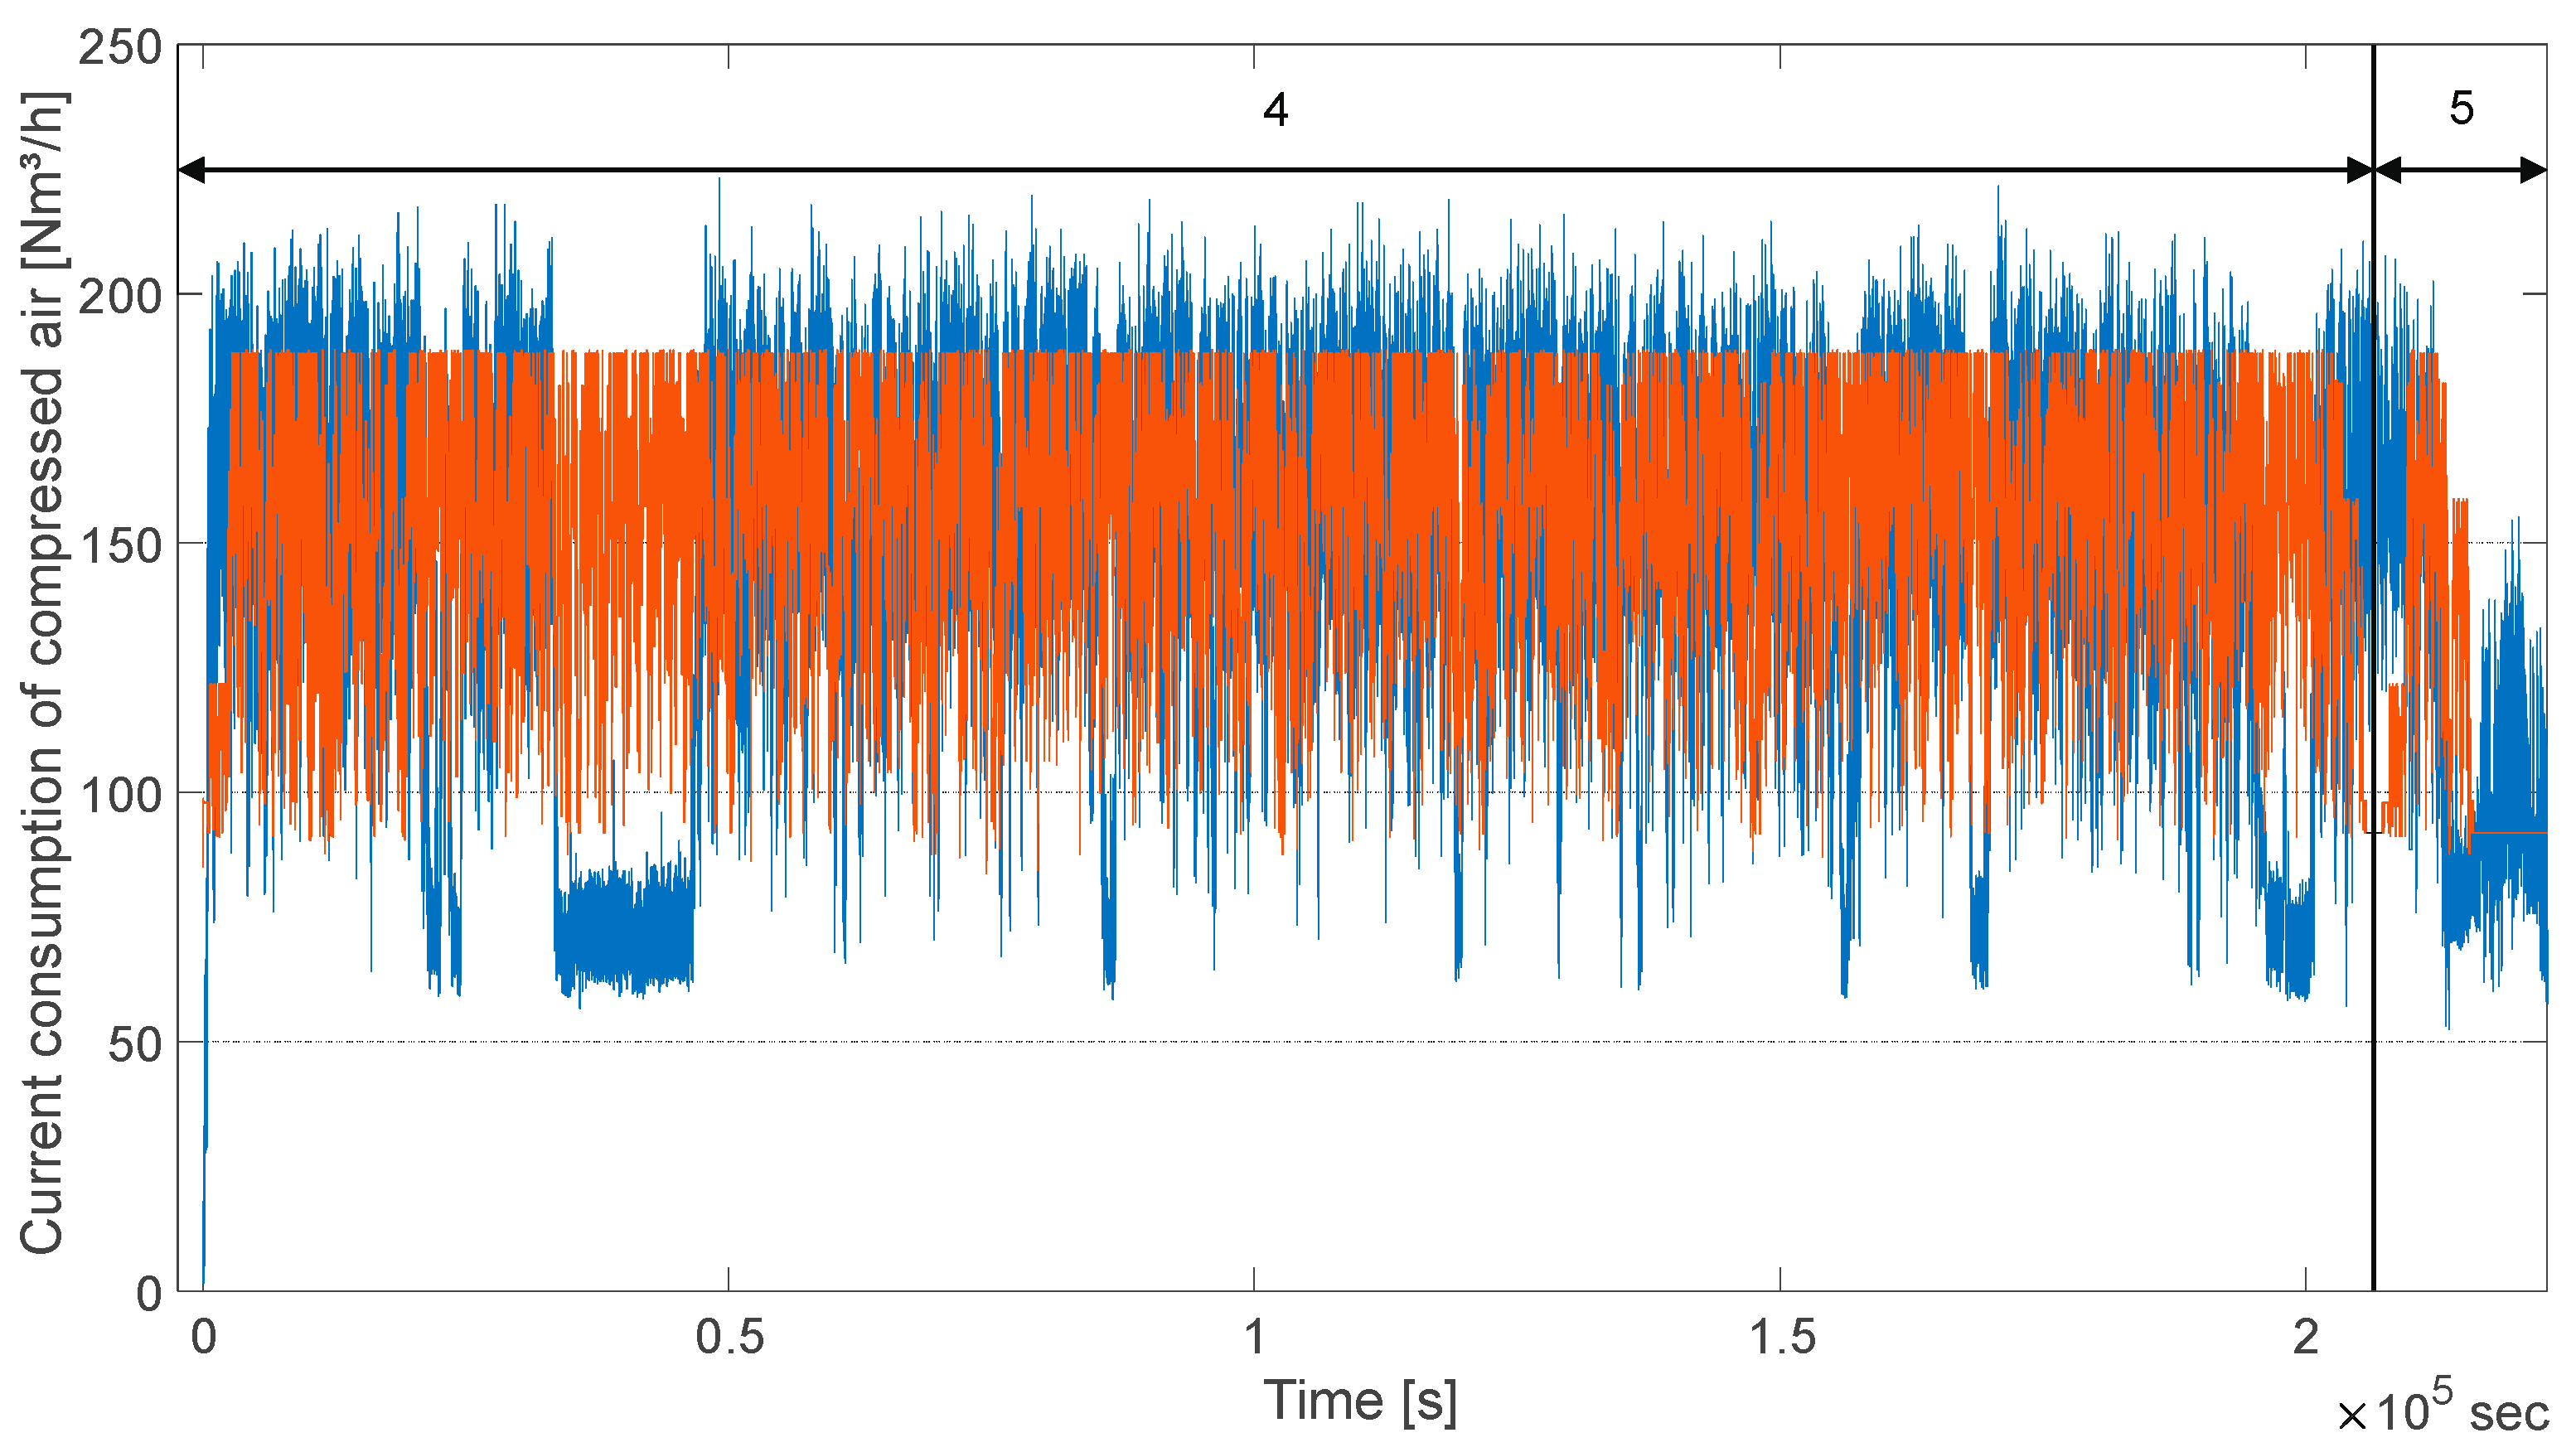
Validation period 2 is primarily used to validate the compressed air and thermal energy consumption. The parameters determined were also used in validation period 1. The production quantities of both articles (4 & 5) show a deviation of less than ±0.1% compared to the real production counter. The production times of articles 4 and 5 show a small deviation of approx. −3 to −3.5% compared to the production times required in reality.
Figure 6 shows the current electrical energy demand and
Figure 7 the current demand for compressed air of the bottling plant (measured versus simulated). In each figure, a downtime (approximately 5 h) due to a technical defect can be seen at the beginning as well as at the end. During the remaining production period of article 4, the output of the filling machine was increased, while the filling machine in the simulation runs with the parameterized set performance. The changeover to article 5 (production time 1.7 h) can be seen toward the end of the simulation.
Table 4 shows the electrical energy consumption in validation period 2. An overall good fit with a percentage deviation of 0.14% is achieved, as the largest consumers show a small deviation (about ±3%). Units such as the depalletizer and palletizer, together with the container transport, show the largest deviations. The deviations (electrical energy and compressed air) of the time period of article 4 correspond to the values of the entire period. The deviations for article 5 are noticeably higher, as the article covers only 2.7% of the total time and is therefore strongly affected by the delimitation method of the articles.
Table 5 shows the consumption of compressed air for validation period 2. The four largest consumers account for about 70% of the total compressed air demand. The small deviations between the simulated and measured data of these units result in a small overall deviation. For units such as the decorker and the cycle-based depalletizers and palletizers, there are large deviations. Due to the small share of the consumption of the product heating, the high deviations are not decisive to a good agreement of the total consumption.
A comparison of the CO2 consumption values is not useful, as CO2 is needed only for article 5. The values of the thermal energy demand deviate by a total of +13.61% and the values of the water consumption by +6.14%. These occasionally large deviations are due to the relatively short validation period.
8.4. Application of the Method in Use Cases
In one use case, the replacement of the main consumer, the bottle cleaning machine (year of construction 2012), was analyzed. During parameter determination, it was ascertained that the consumption values for thermal energy and water significantly exceed the values during the warranty acceptance test after the completion of the plant. Water demand was determined to be 284 mL/bottle (originally 140 mL/bottle) and the thermal energy demand 15.5 Wh/bottle (originally 9.5 Wh/bottle). In addition, the availability of the bottle cleaning machine has noticeably decreased, from 90% to 86%. The background to the changes is unclear. To be able to examine the effects on the overall system in validation period 2, the consumption levels of the individual operating states and performance values were adjusted according to the original values. These values agree with the currently common values determined by Osterroth et al. [
20], as well as with the authors’ own empirical values. The adjusted model was simulated with a tenfold repetition and compared with the total values of the validation. As shown in
Table 6, enormous savings of thermal energy and water demand were determined. Since the bottle washer is the sole consumer of these types of energy and media, there is a direct connection. The demand for electrical energy of the entire system is also influenced. The water savings alone correspond to a cost saving per year in the mid five-digit range (at an average water price of 2 € per m
3 and a production time of 5 days for 50 weeks a year). Added to this are the sustainable aspects of reduced wastewater production and the required purification of the water.
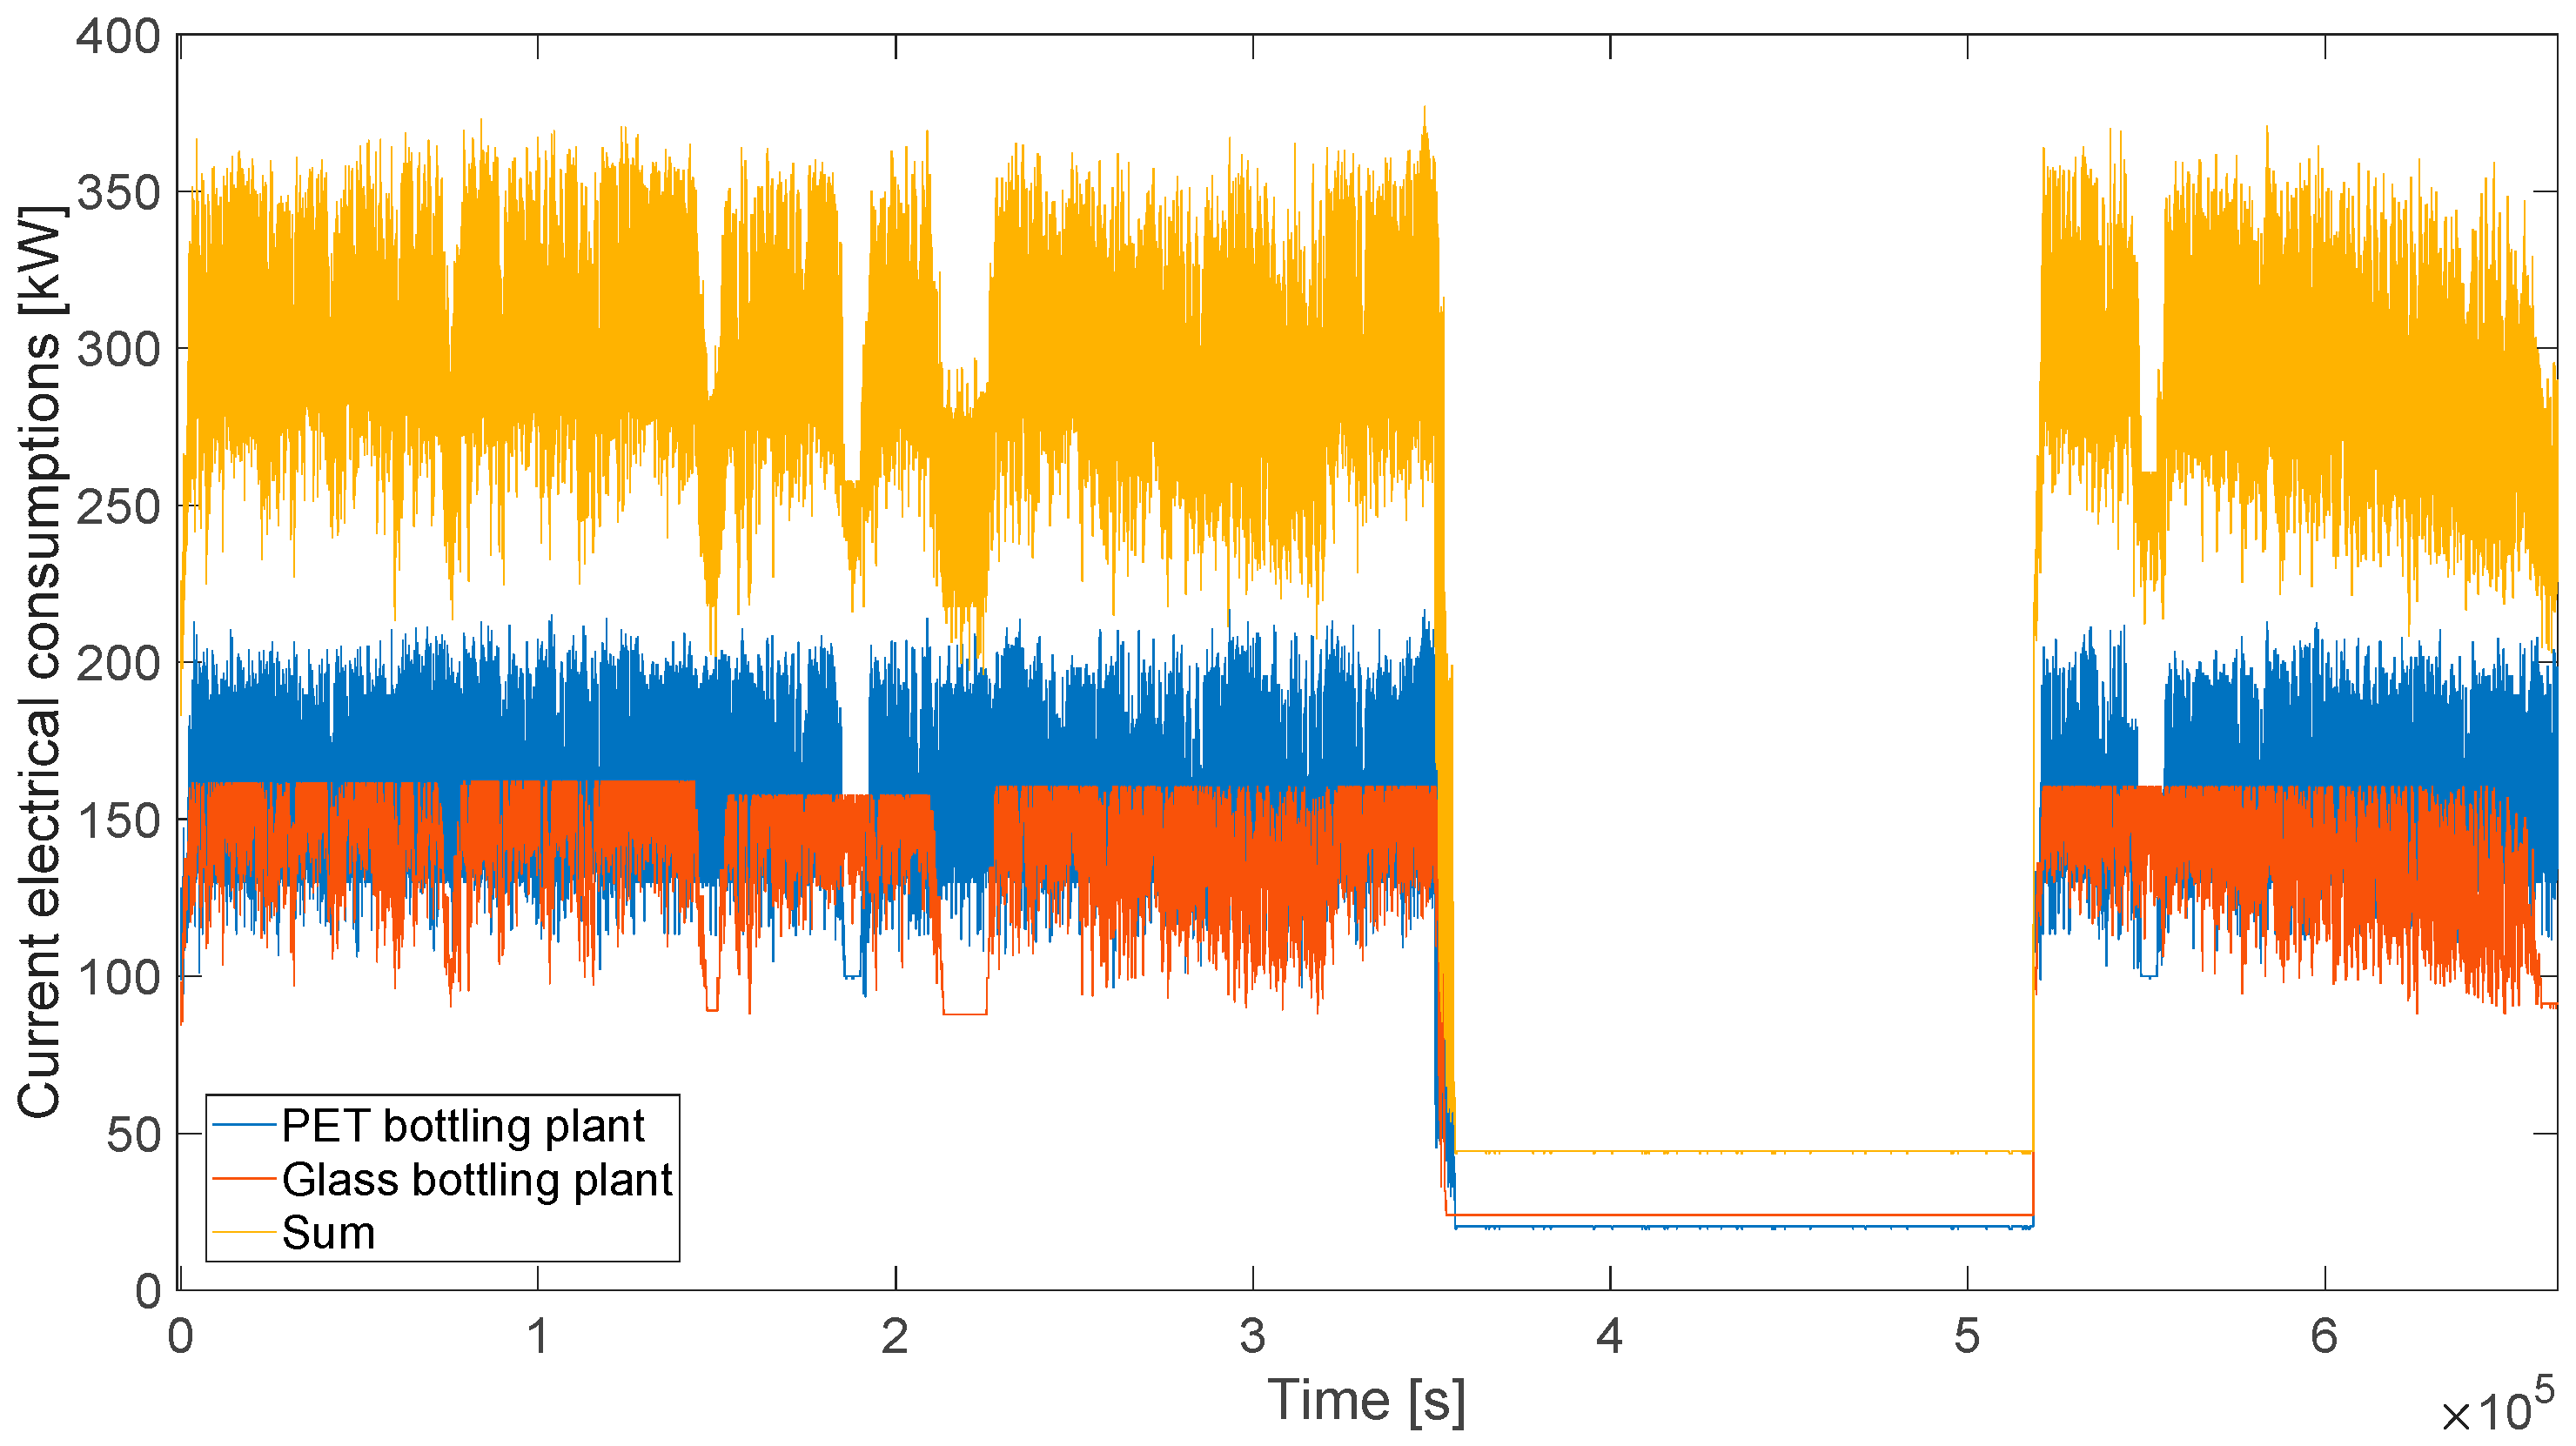
In a further simulation study, the suitability of the method is shown with regard to the simulation of multiple beverage bottling plants. For this purpose, the returnable glass and the PET bottling plant were modeled with specific articles and production plans over a period of 8 days. The load profile for, e.g., electrical energy can be determined by the simultaneous simulation of both plants. This information can be of considerable interest in the design of supply facilities, such as the electricity supply, for example, in order to be able to make an efficient and cost-effective investment.
Figure 8 shows the operation of the two beverage filling plants and their total electric energy consumption in validation period 1 (including a weekend as an off-period).
9. Discussion
The simulation-relevant parameters were determined using the presented evaluation method. Due to the extensive database, the article- and container-type-specific parameters could be defined. Overall, they show very small confidence intervals (see
Table A1).
The use of the described data structure could be an opportunity for SMEs and machine manufactures. If data are available in this format, the evaluation tool enabling a fast, easy, and flexible determination of simulation parameters as well as the evaluation of simulation experiments can be used. This can sustainably overcome the barriers for modeling and encourage SMEs to expand their data collection. The modeling editor proved to be a good support by modeling the plant as well as all articles and the production plan in a structured and standardized way via modeling columns. Thus, errors in simulation model generation can be avoided.
For the first time, a simulation environment incorporates a detailed production plan including non-production times and an associated off-consumption level. In addition, articles can be simulated with specific parameter sets, and the times required for changeovers can be specified. The automated simulation model generation based on the configuration file could be demonstrated and successfully verified in the example of a simulation environment. Since it contains all simulation-relevant parameters and information and is clearly structured, this could also be implemented in other simulation environments. The combination of the modeling editor and the simulation environment opens up a great flexibility with regard to the mapping of production systems and has already been demonstrated [
48]. Compared to a time-consuming manual parameter determination and simulation model creation, which can take several days, depending on its complexity, the present models could be created within a few hours using the modeling editor, and an executable simulation model including all aspects could be generated. However, this requires the availability of data according to the presented data structure. A fast model generation represents a decisive advantage for companies of any size.
Based on two production periods of a beverage bottling plant, the extensive validation is intended to underpin the suitability of the entire method with regard to several factors. A comparison of the measured and simulated values was conducted. The focus in the first validation period is primarily on the production schedule with different articles and non-production times as well as the electrical energy consumption. The production quantities determined in the simulation match those of reality.
An explicit validation of the off-periods (e.g., the weekend in validation period 1) does not take place. The graphical comparison (see
Figure 4) illustrates a similar consumption in this period, but could be improved. The deviations in the electrical energy demand of the entire plant in the first validation period are very low and are achieved by the good fit of the main consumers. Machines such as the de-/palletizer and the mixer show the largest deviations. This reflects the findings of Osterroth et al. [
36], as the operating state-related consumption behavior does not fit perfectly for these units. No adjustment was made due to suitability for the remaining units.
The accelerated production in the simulation has two causes. On the one hand, the start-up times of the plant in the event of a changeover cannot be represented well enough in the simulation. In particular, the individual changeover work on individual units must be mentioned here, as the changeover time is related only to the filling machine. During flying changeovers, various articles are usually active on the plant. This explains the greater deviations of the article-specific consumptions. A more precise assessment is possible only if each machine provides information on the subject of articles as well as on the current program. In addition, it is not possible to model or simulate any lower outputs of the units in the start-up and shutdown phases. On the other hand, due to the neg. exponential failure behavior, long failure times occur only rarely in the simulation and are difficult to reproduce. Together with all the delays that occurred during real changeovers, this situation corresponds approximately to the time difference between the measured and the simulated total time. The long downtimes that occurred in real production must be documented to make deviations comprehensible.
The deviations in CO2 demand are within acceptable limits, and a consumption behavior related to the operating condition can be confirmed. Water demand deviates strongly for article 2, which in turn strongly influences the overall deviation. This can be explained due to the cyclical filling of the baths of the bottle cleaning machine. However, the deviation of article 4, which has the largest database, is in an acceptable range of about −6%.
Validation period 2 includes the simulation of all energy and media types, but for a shorter period. Here, too, the deviations in production times can be traced through fault logs. The deviations in the required electrical energy quantities mirror the findings of period 1. Due to the extensive database, an overall very low deviation is achieved, especially for compressed air. Here, the consumption parameters were determined in relation to the container type. For the depalletizer, palletizer, and decorker, very high deviations were found and the operating-condition-related consumption behavior can be doubted, due to the low confidence intervals of the parameters. The deviations in the thermal energy demand of the bottle washer are relatively high and can be attributed to the short period as well as to the cyclical heating of the caustic and should continue to be investigated more deeply.
One use case investigates a theoretical reduction in energy and media demand. Modernizing the bottle cleaning machine achieves savings significantly higher than the deviations in the total values within validation period 2. A second use case shows the simulation results of two different beverage bottling plants to illustrate the breadth of application of the method. The simulation studies underpin the suitability of the overall method. Nevertheless, human intelligence is needed to evaluate the simulation results and decide on the next steps that will ultimately affect system efficiency [
58].
In comparison with Osterroth et al. [
36], the operating-state-related consideration of consumption without the application of time-dependent intermediate levels provides a similar or a sufficient accuracy of the validation results. Particularly when considering complex overall systems, the simplified application facilitates the creation of the model, and the consideration at unit level satisfies the requirements.
10. Conclusions
To perform quick and easy forecasts of the energy and media demand of holistic beverage bottling plants, especially for SMEs, an approach for modeling and automatic simulation model generation was presented. This can be a chance for SMEs to reach a more sustainable production. This is made possible by a modeling approach implemented in a user-friendly editor. In combination with a standardized data format and evaluation software, simulation-relevant parameters such as consumption and failure behavior data can be determined automatically. The prerequisite for this, however, is a sufficiently large database. The approach was applied to a beverage bottling plant and a model with various articles, and, for the first time, a detailed production plan was modeled. Based on an XML-based configuration file, the simulation model was automatically generated. This represents an enormous time saving compared to manual model creation.
The detailed validation of the entire method by comparing the simulated consumption values of two different time periods to the measured values shows that the approach is well suited to provide reliable forecasts. The respective main consumers of the energy and media types are decisive, which confirms the granularity chosen in the modeling environment. This is also underpinned by Hubert [
39]. Therefore, units such as the depalletizer, palletizer, mixer, and decorker, which sometimes show strong deviations compared to the measured values, can be mostly neglected depending on their share in the total consumption. For the first time, a detailed, machine-related compressed air consumption was determined and analyzed. The compressed air consumption, as well as the consumption of water and CO
2, follow the consumption behavior presented. Furthermore, the validation of the thermal energy demand does not show a good fit, which means that the consumption behavior approach should be expanded. Further deviations in the validation can be explained with the help of fault logs. A recording of the current program of the machines as well as the extension for mapping start-up/shut-down ramps and the improvement of changeovers in the simulation environment would further increase the accuracy. Simulation studies support the validation of the method, in which savings exceeding the deviations of the validation results could be achieved. One challenge is the epistemic uncertainty, i.e., the lack of knowledge on how to interpret the results and how to design further steps, e.g., simulation experiments, and also the imprecise and coarsedata and information for the modeling and parameterization of simulation models. Decision models can help here [
59].
The method proved to be suitable for creating models of complex bottling plants and automatically generating simulation models. In the future, it is intended that SMEs will only use the presented modeling editor [
48] to apply the method. Starting from this, the model of the production system to be simulated is automatically passed on to a cloud-based simulation environment, where the simulation is performed, and the results of the simulation are reported back. The only points of contact are the modeling editor and the output data, which can be processed, e.g., with the help of the evaluation tool, and a deeper knowledge of XML and the simulation method will not be required. If, in addition, the production data is available in the presented data structure, the barrier of the data basis is overcome, and the simulation parameters can be determined automatically. The overall solution is intended to reduce the personnel and cost effort, and thus enable SMEs to test optimization strategies and make possible sound investment decisions. The approach provides an opportunity to improve energy efficiency and, as a result, product efficiency. To extend the approach and to include, in this case, the material efficiency, the next logical step is the mapping and simulation of a holistic production plant, such as a brewery. A challenge here is the mapping of the batch-oriented operation of the process area and the associated different energy consumption behaviors. A combination of both areas would, for example, allow for the investigation of recuperative energy use as well as overall consumption profiles. This represents an opportunity to save energy and media and to reduce raw materials and waste accordingly, and is a step toward sustainable production.


 ,
, 