
Analysis of Crash Frequency and Crash Severity in Thailand: Hierarchical Structure Models Approach

 ,
,  ,
, 


Abstract
:1. Introduction
1.1. Background
1.2. Crash Modeling with Spatial Approach
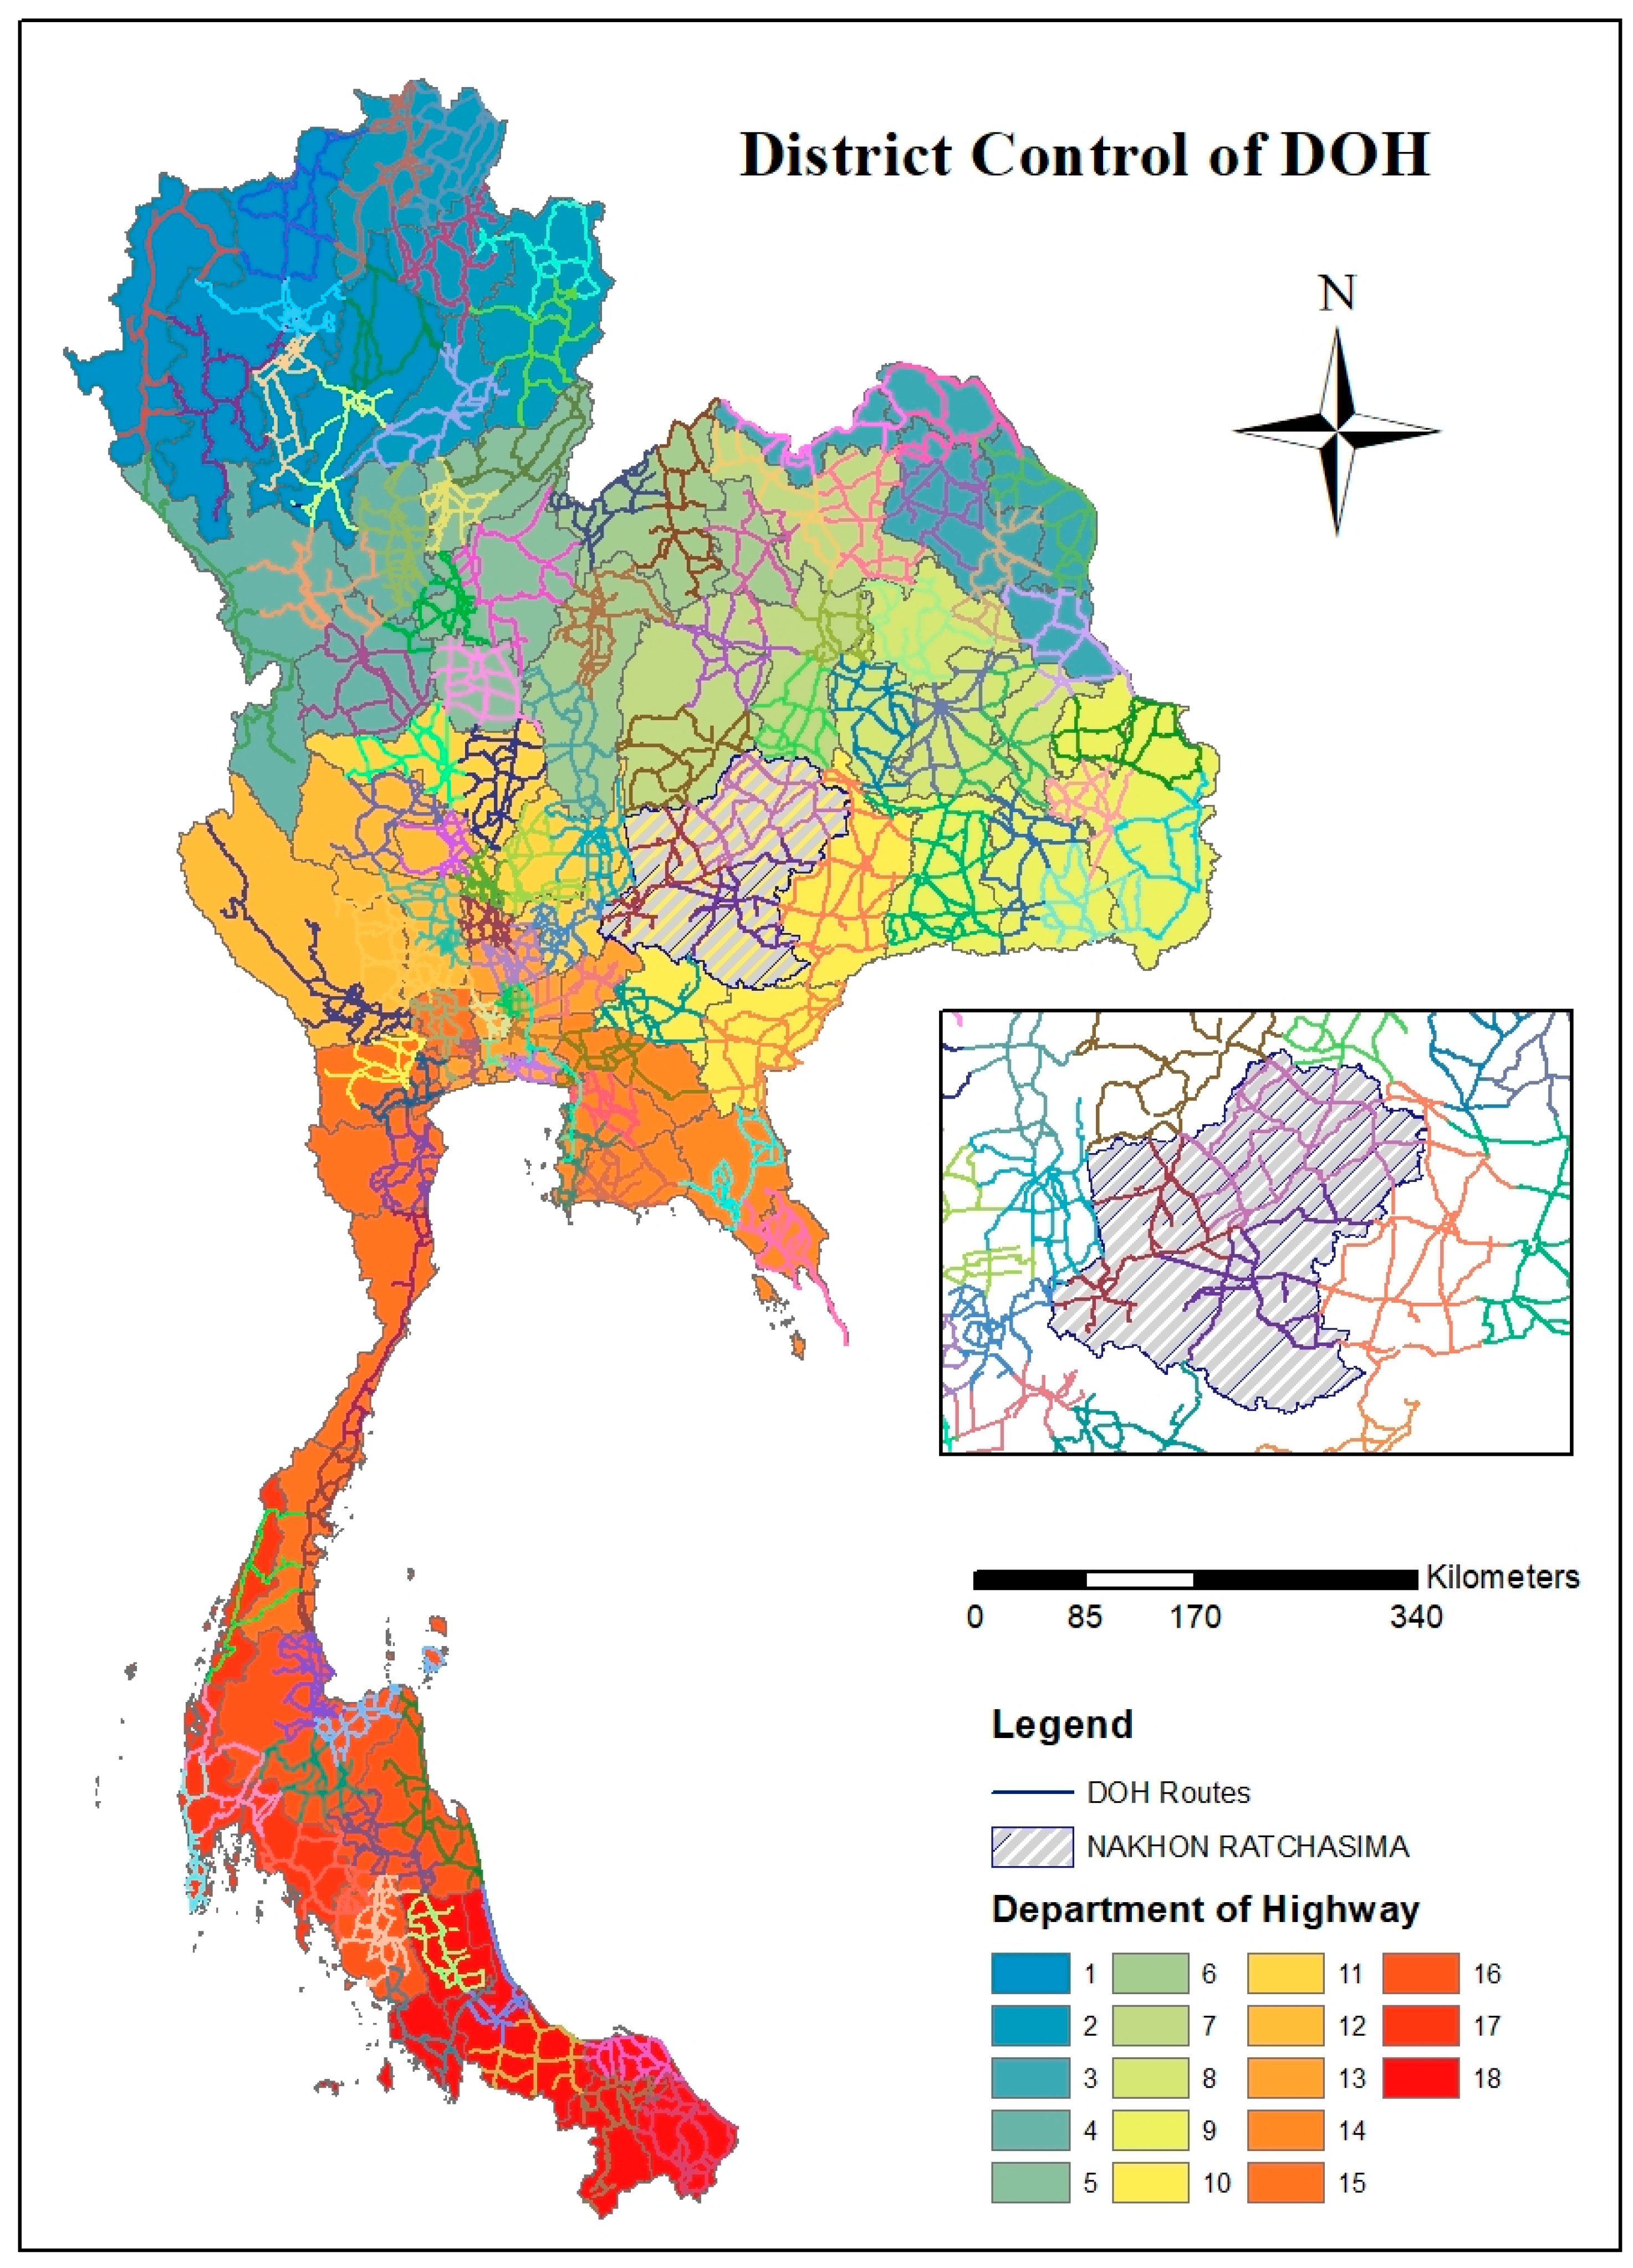
1.3. Highway Organization of Thailand
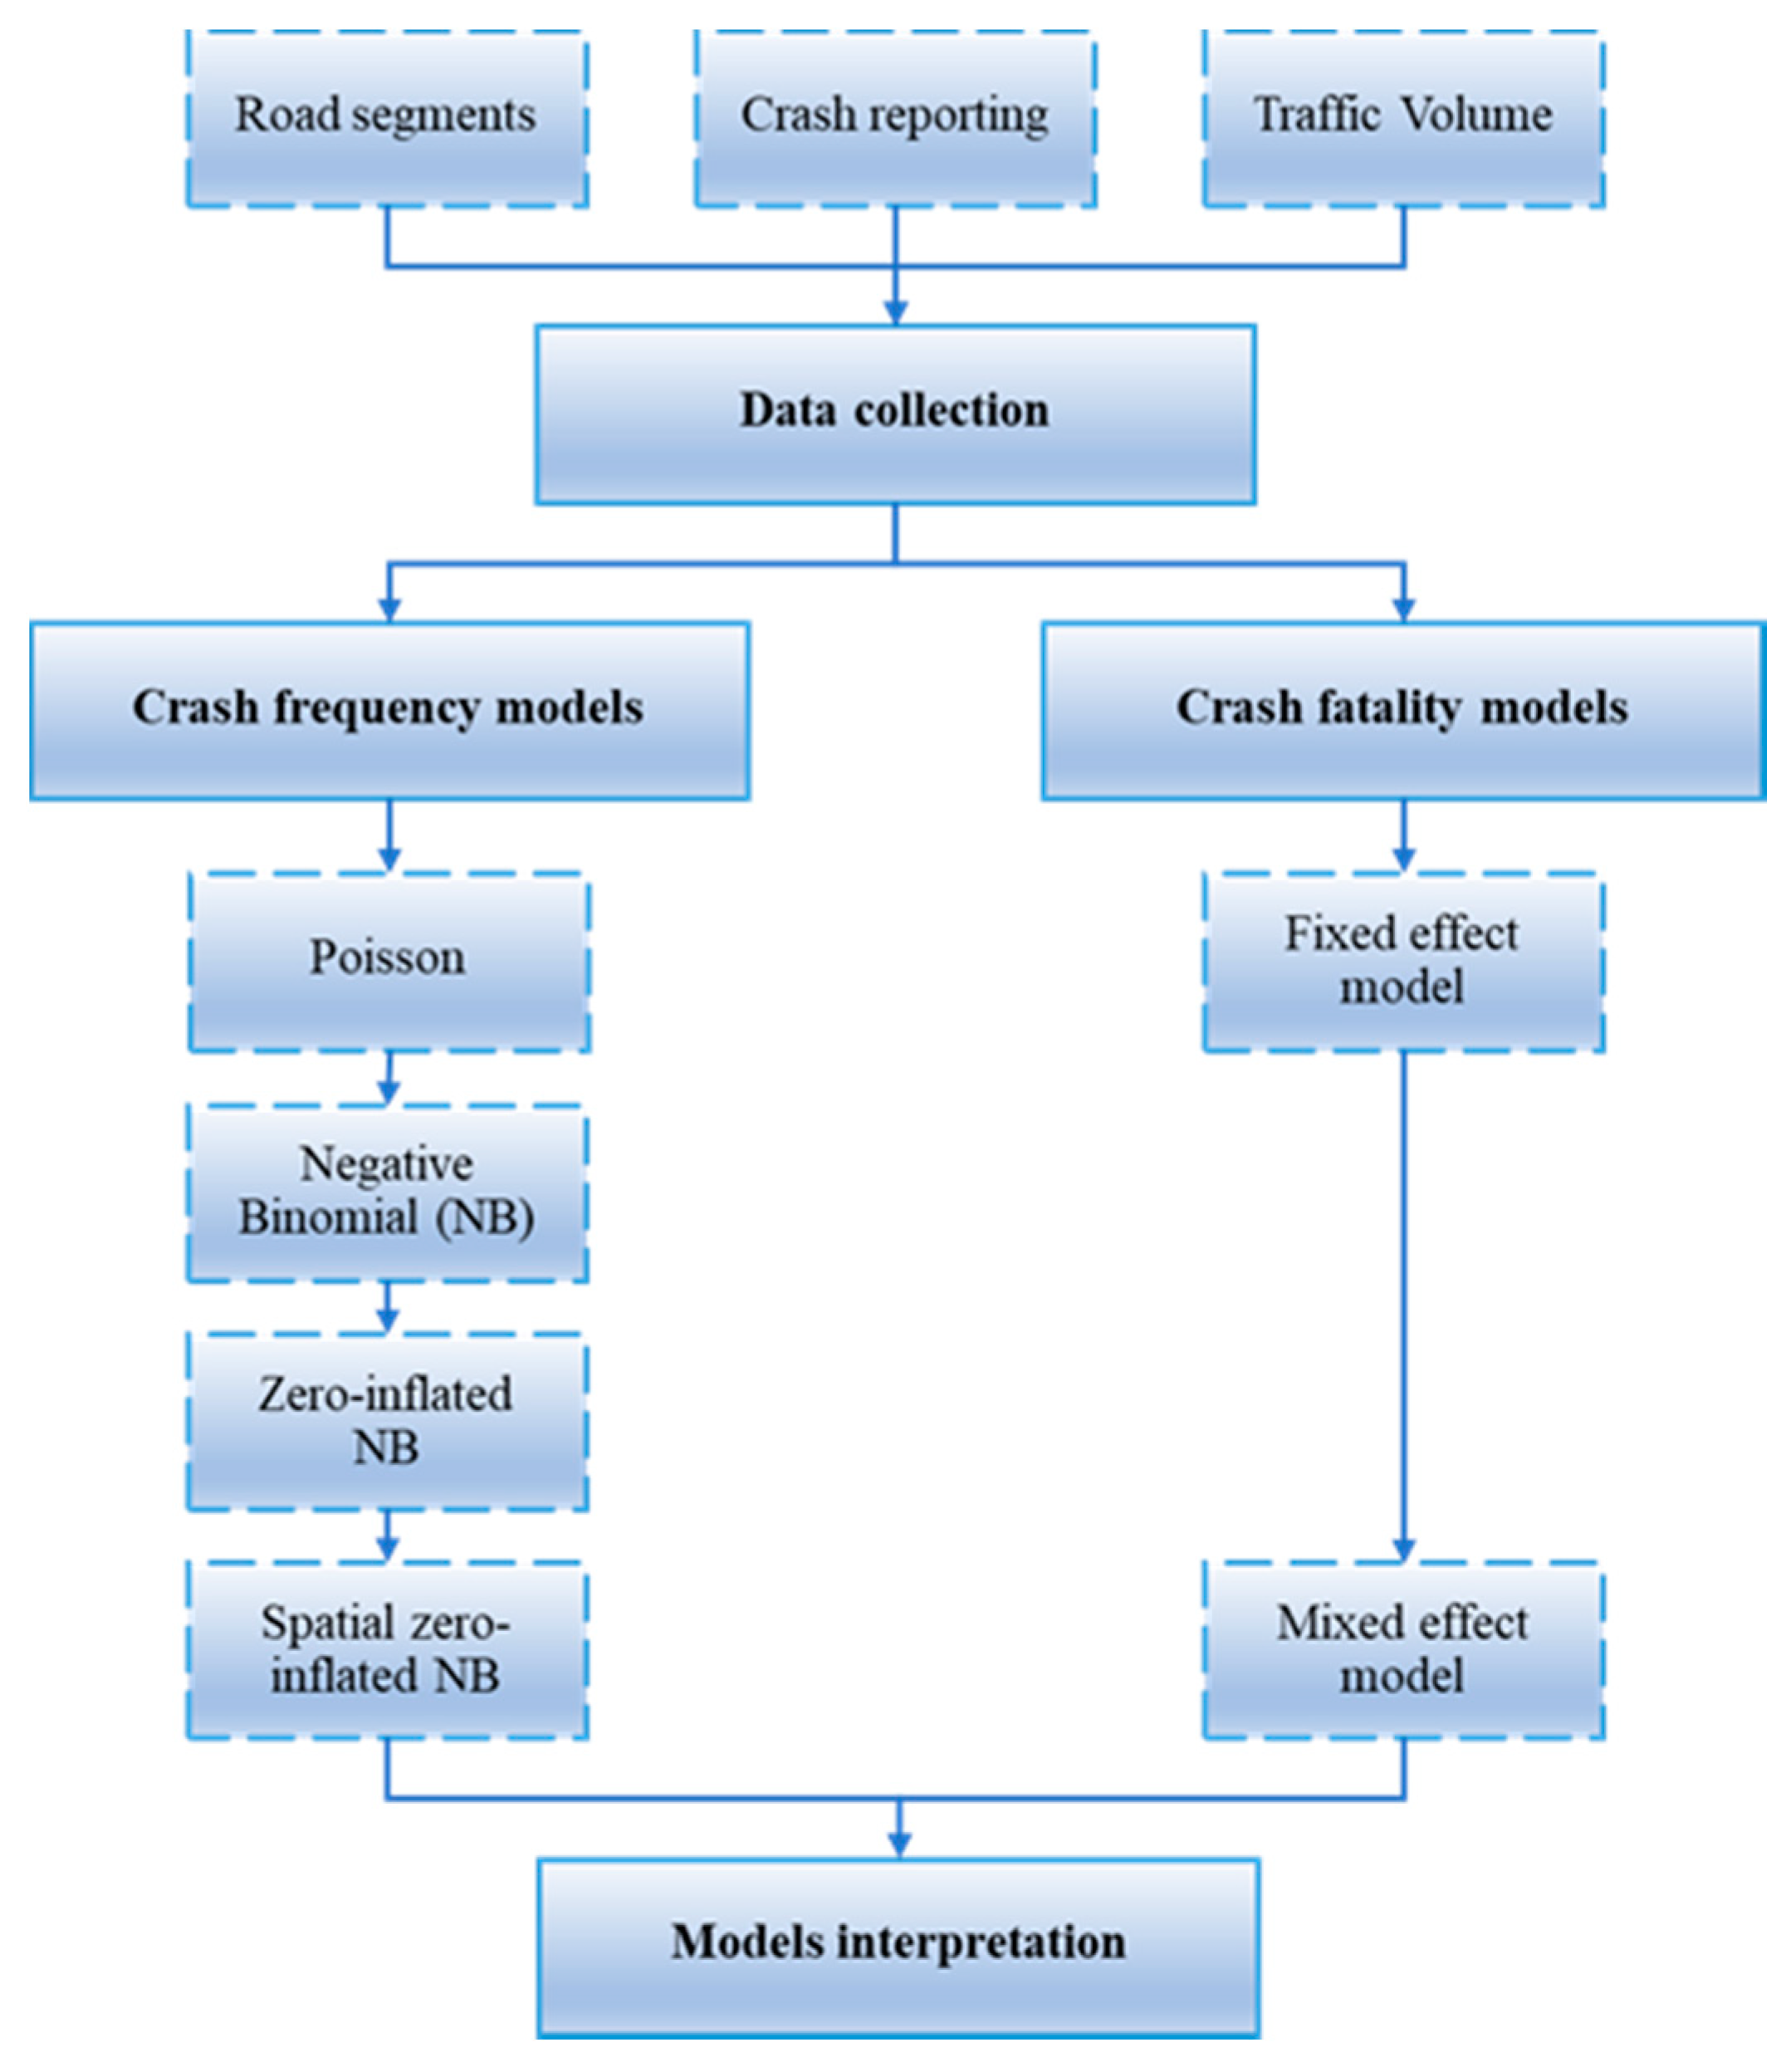
2. Methods
2.1. Crash Frequency Models
2.2. Crash Severity Modeling
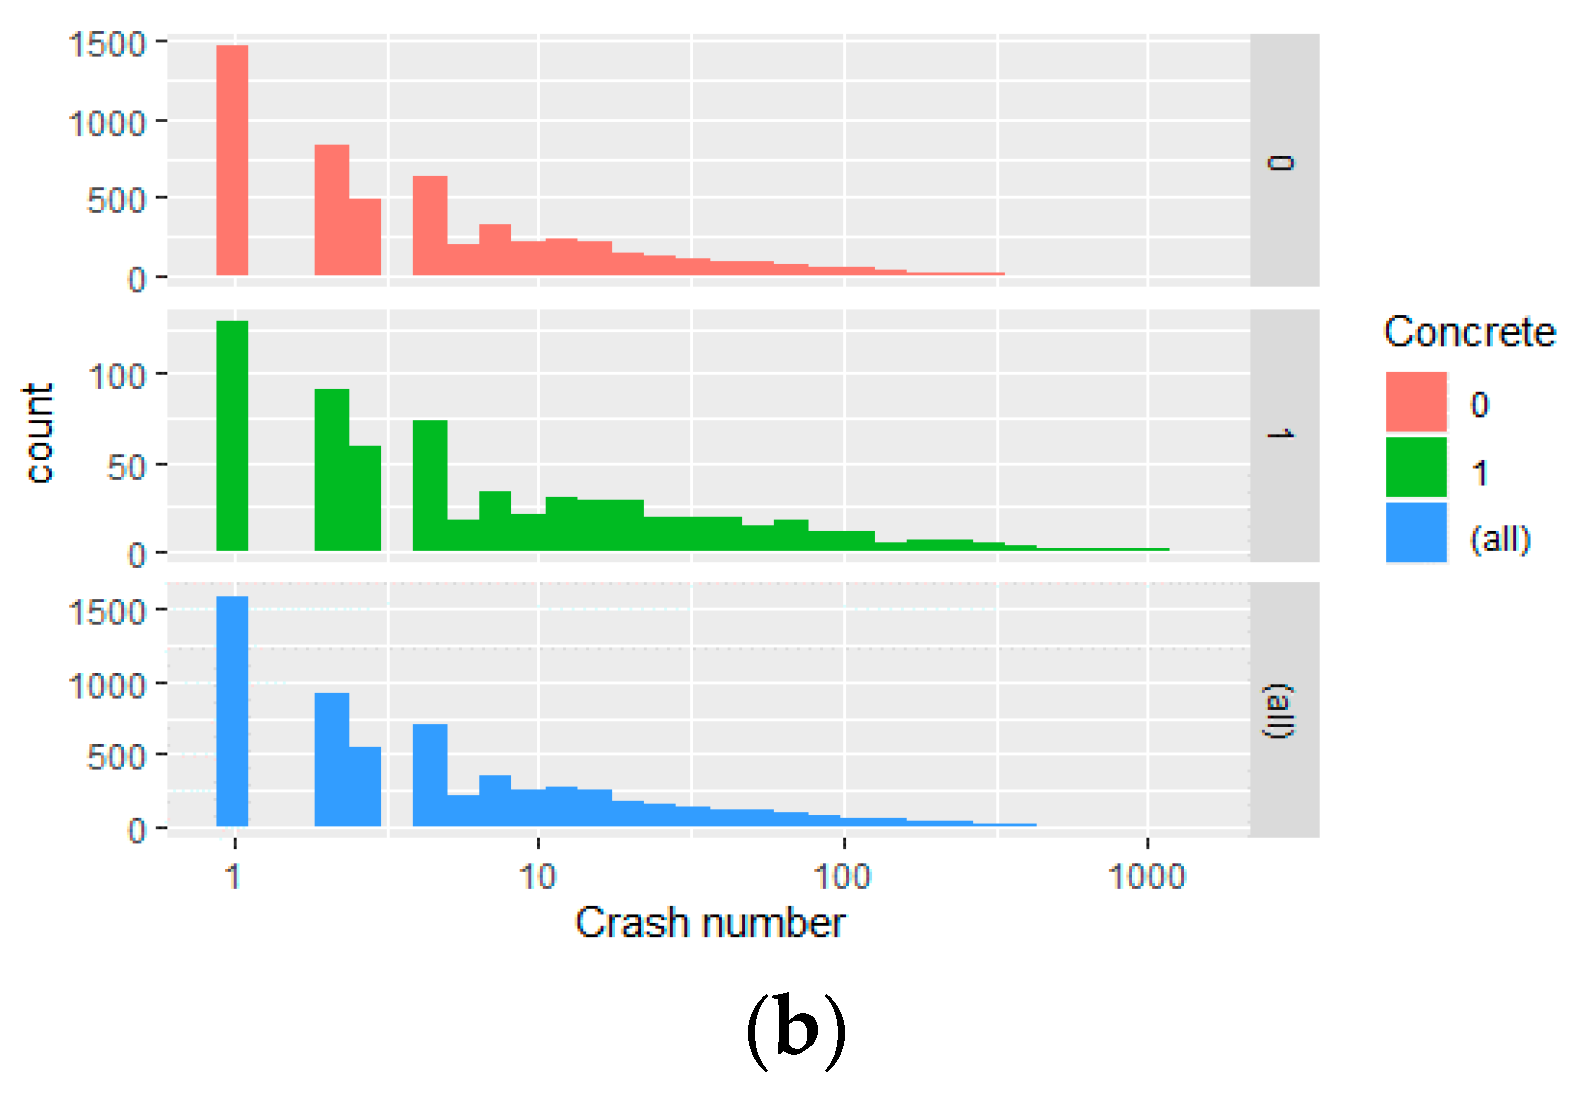
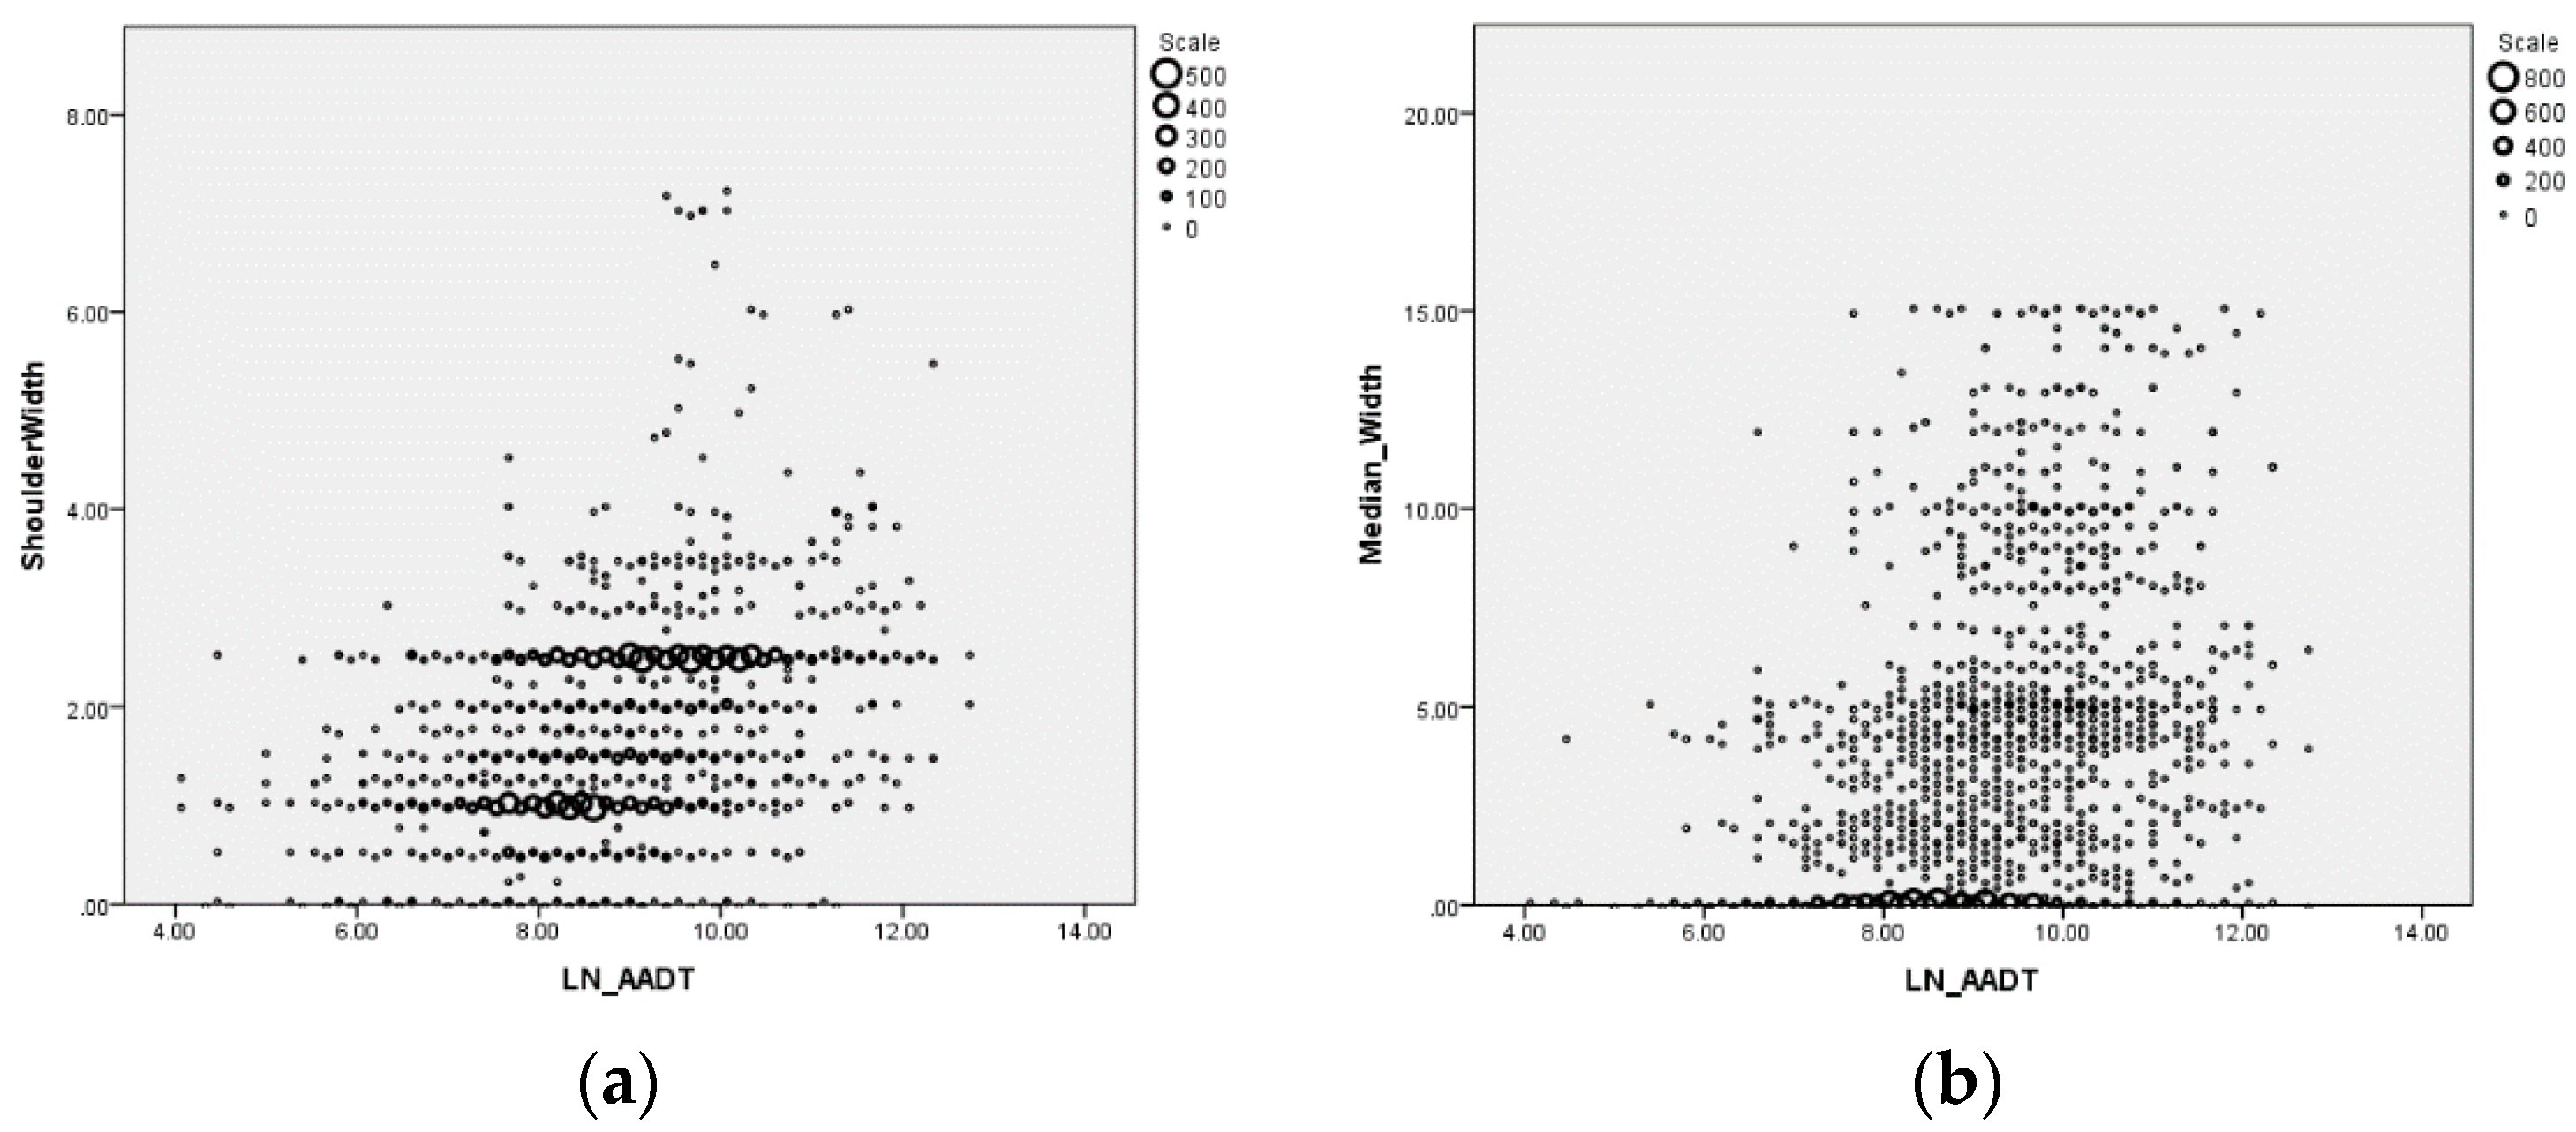
2.3. Data Collection
3. Results and Discussion
3.1. Crash Frequency Model
- The random effect conditional model refers to the prediction of the relationship between the independent and dependent variables. These variables were grouped according to the sub-areas of the Department of Highway (DOH).
- The normal state denotes the factors influencing collision number as non-zero state.
- Lastly, zero state pertains to the factors that do not lead to crashes. The zero sate is modeled to find the significant variables that could be specifically led to be the zero-crash segment. These significant variables can be developed to be effective road safety policy.
3.2. Crash Severity Model
4. Conclusions and Implementation
- A survey for poorly lighted crash-prone areas should be first conducted. There is previous research that suggested this point such as Champahom et al. [42], Se et al. [68], Se et al. [69]. These works mentioned that the DOH should survey the dark road segments and consider installing lighting poles. According to the road safety policy in Thailand, there are regularly surveys of lighting conditions on the road segments. However, some processes are slow and limited in terms of budget. To conserve the budget for installing lighting-poles, this study recommends surveying a light condition of more than 3% at the slope segment first, since the factors significantly positively affect likelihood of fatality.
- Followed by the posting of additional signs for anti-drunk driving campaigns, to reduce fatal crashes. Law enforcement and a campaign against drunk drivers is a regular proceeding, mentioned in previous works, namely, Jomnonkwao et al. [70], Se et al. [71]. To establish the guidelines for determining campaigns developed by Phillips et al. [72], healthy organizations such as the Thai Health Promotion Foundation should use personal communication or roadside media as part of their campaign delivery strategy. Lastly, checkpoints inspecting for alcohol use and seat belt use should likewise be reinforced. Recommendation of using safety equipment has been mentioned in terms of drivers’ attitudes [73,74,75] and in terms of law enforcement by using CCTV for detection [76,77].
- The Department of Land Transport can help promote such campaigns and topic training because head-to-head collisions and rear-end crashes are the most frequently occurring crash types that lead to high rates of fatality. Otherwise, short-term campaigns can be used as guidelines [72]. Therefore, it is necessary to consider areas prone to crashes, especially where driving on the wrong side of the road is a likely tendency. In Thailand, the campaign or the training topic of awareness of collision types are a low priority. The previous research recommended that the DOH should highlight some crash types such as rear-end crashes, single crashes and head-on crashes [42,67,68]. These studies suggest some policies, for example, the driver should be aware of the appropriate headway with the front vehicle. Regarding the results of this study, rear-end crashes and head-on collisions were found to have significant variance among the road segments. Thus, a new policy from this study recommended that the road safety government does not necessarily attempt implementation of safety guidelines throughout the country. However, they should focus on some areas, for example, roads with mixed vehicle types, such as industrial areas and communities without limited accessibility of trucks.
- In addition, officials of the DOH should investigate the blind spots and risk spots, especially undivided roads and roads divided by flush medians. Currently, the safety policy of Thailand is trying to reduce the length of flush medians and to increase the length of barriers. It is relevant to the road safety studies in Thailand, which suggest reducing flush medians because it is more likely to sustain fatal injuries in a crash [42,69]. This study confirms significant spatial variance of median-openings and intersections. Therefore, the recommendation of this study is to begin considering installation of barriers to divide intersections and median opening points.
5. Limitations and Further Research
Author Contributions
Funding
Institutional Review Board Statement
Informed Consent Statement
Data Availability Statement
Acknowledgments
Conflicts of Interest
References
- Thailand Road Safety Center. Thailand Road Safety Master Plan 2018–2021. Available online: http://122.155.1.143/upload/download/file_attach/5d70d17634aa9.pdf (accessed on 20 February 2020).
- World Health Organization. Global Status Report on Road Safety 2018. Available online: https://www.who.int/violence_injury_prevention/road_safety_status/2018/en/ (accessed on 13 February 2020).
- Thailand Department of Highways. Thailand Traffic Accident on National Highways in 2018. Available online: https://bhs.doh.go.th/download/accident (accessed on 20 February 2020).
- Jones, A.P.; Jørgensen, S.H. The use of multilevel models for the prediction ofroad accident outcomes. Acc. Anal. Prev. 2003, 35, 59–69. [Google Scholar] [CrossRef]
- Abdel-Aty, M. Analysis of driver injury severity levels at multiple locations using ordered probit models. J. Saf. Res. 2003, 34, 597–603. [Google Scholar] [CrossRef] [PubMed]
- Abdel-Aty, M.; Pande, A. Crash data analysis: Collective vs. individual crash level approach. Natl. Acad. Sci. Eng. Med. 2007, 38, 581–587. [Google Scholar] [CrossRef] [PubMed] [Green Version]
- Kockelman, K.M.; Kweon, Y.-J. Driver injury severity: An application of ordered probit models. Acc. Anal. Prev. 2002, 34, 313–321. [Google Scholar] [CrossRef] [Green Version]
- Joon-Ki, K.; Yinhai, W.; Gudmundur, F.U. Modeling the Probability of Freeway Rear-End Crash Occurrence. J. Transp. Eng. 2007, 133, 1. [Google Scholar]
- Wang, Y.; Ieda, H.; Mannering, F. Estimating Rear-End Accident Probabilities at Signalized Intersections: An Occurrence-Mechanism Approach. J. Transp. Eng. 2002, 129, 1–8. [Google Scholar] [CrossRef] [Green Version]
- Dupont, E.; Papadimitriou, E.; Martensen, H.; Yannis, G. Multilevel analysis in road safety research. Acc. Anal. Prev. 2013, 60, 402–411. [Google Scholar] [CrossRef]
- Huang, H.; Abdel-Aty, M. Multilevel data and bayesian analysis in traffic safety. Acc. Anal. Prev. 2010, 42, 1556–1565. [Google Scholar] [CrossRef]
- Coruh, E.; Bilgic, A.; Tortum, A. Accident analysis with aggregated data: The random parameters negative binomial panel count data model. Anal. Meth. Acc. Res. 2015, 7, 37–49. [Google Scholar] [CrossRef]
- Flask, T.; Schneider, W.H.; Lord, D. A segment level analysis of multi-vehicle motorcycle crashes in Ohio using Bayesian multi-level mixed effects models. Saf. Sci. 2014, 66, 47–53. [Google Scholar] [CrossRef]
- Hosseinpour, M.; Sahebi, S.; Zamzuri, Z.H.; Yahaya, A.S.; Ismail, N. Predicting crash frequency for multi-vehicle collision types using multivariate Poisson-lognormal spatial model: A comparative analysis. Acc. Anal. Prev. 2018, 118, 277–288. [Google Scholar] [CrossRef] [PubMed]
- Ziakopoulos, A.; Yannis, G. A review of spatial approaches in road safety. Acc. Anal. Prev. 2020, 135, 105323. [Google Scholar] [CrossRef]
- Bao, J.; Liu, P.; Ukkusuri, S.V. A spatiotemporal deep learning approach for citywide short-term crash risk prediction with multi-source data. Acc. Anal. Prev. 2019, 122, 239–254. [Google Scholar] [CrossRef]
- Cai, Q.; Abdel-Aty, M.; Lee, J.; Huang, H. Integrating macro- and micro-level safety analyses: A Bayesian approach incorporating spatial interaction. Transp. A Trans. Sci. 2018, 15, 285–306. [Google Scholar] [CrossRef]
- Lenguerrand, E.; Martin, J.L.; Laumon, B. Modelling the hierarchical structure of road crash data--application to severity analysis. Acc. Anal. Prev. 2006, 38, 43–53. [Google Scholar] [CrossRef]
- Kim, D.G.; Lee, Y.; Washington, S.; Choi, K. Modeling crash outcome probabilities at rural intersections: Application of hierarchical binomial logistic models. Acc. Anal. Prev. 2007, 39, 125–134. [Google Scholar] [CrossRef]
- Huang, H.; Chin, H.C.; Haque, M.M. Severity of driver injury and vehicle damage in traffic crashes at intersections: A Bayesian hierarchical analysis. Acc. Anal. Prev. 2008, 40, 45–54. [Google Scholar] [CrossRef] [PubMed]
- Chen, C.; Zhang, G.; Huang, H.; Wang, J.; Tarefder, R.A. Examining driver injury severity outcomes in rural non-interstate roadway crashes using a hierarchical ordered logit model. Acc. Anal. Prev. 2016, 96, 79–87. [Google Scholar] [CrossRef]
- Chen, C. Driver injury severity outcome analysis in rural interstate highway crashes: A two-level Bayesian logistic regression interpretation. Acc. Anal. Prev. 2016, 97, 69–78. [Google Scholar] [CrossRef] [PubMed]
- Yannis, G.; Papadimitriou, E.; Antoniou, C. Multilevel modelling for the regional effect of enforcement on road accidents. Acc. Anal. Prev. 2007, 39, 818–825. [Google Scholar] [CrossRef]
- Park, H.C.; Kim, D.K.; Kho, S.Y.; Park, P.Y. Cross-classified multilevel models for severity of commercial motor vehicle crashes considering heterogeneity among companies and regions. Acc. Anal. Prev. 2017, 106, 305–314. [Google Scholar] [CrossRef]
- Lee, J.; Abdel-Aty, M.; Cai, Q. Intersection crash prediction modeling with macro-level data from various geographic units. Acc. Anal. Prev. 2017, 102, 213–226. [Google Scholar] [CrossRef]
- Ahmed, M.; Huang, H.; Abdel-Aty, M.; Guevara, B. Exploring a Bayesian hierarchical approach for developing safety performance functions for a mountainous freeway. Acc. Anal. Prev. 2011, 43, 1581–1589. [Google Scholar] [CrossRef]
- Islam, M.T.; El-Basyouny, K. Multilevel models to analyze before and after speed data. Anal. Meth. Acc. Res. 2015, 8, 33–44. [Google Scholar]
- Aguero-Valverde, J. Multivariate spatial models of excess crash frequency at area level: Case of Costa Rica. Acc. Anal. Prev. 2013, 59, 365–373. [Google Scholar] [CrossRef]
- Ziakopoulos, A.; Yannis, G. Meta-regressions of exposure parameters used in spatial road safety analyses. Adv. Trans. Stud. Int. J. 2020, 51, 5–18. [Google Scholar]
- Washington, S.P.; Karlaftis, M.G.; Mannering, F. Statistical and Econometric Methods for Transportation Data Analysis, 2nd ed.; Chapman and Hall/CRC: Boca Raton, FL, USA, 2011. [Google Scholar]
- Mahmud SM, S.; Ferreira, L.; Hoque, M.S.; Tavassoli, A. Micro-level safety risk assessment model for a two-lane heterogeneous traffic environment in a developing country: A comparative crash probability modeling approach. J. Saf. Res. 2019, 69, 125–134. [Google Scholar] [CrossRef] [PubMed]
- Shankar, V.; Milton, J.; Mannering, F. Modeling accident frequencies as zero-altered probability processes: An empirical inquiry. Acc. Anal. Prev. 1997, 29, 829–837. [Google Scholar] [CrossRef]
- Osama, A.; Sayed, T. Investigating the effect of spatial and mode correlations on active transportation safety modeling. Anal. Meth. Acc. Res. 2017, 16, 60–74. [Google Scholar] [CrossRef]
- Huang, H.; Zhou, H.; Wang, J.; Chang, F.; Ma, M. A multivariate spatial model of crash frequency by transportation modes for urban intersections. Anal. Meth. Acc. Res. 2017, 14, 10–21. [Google Scholar] [CrossRef]
- Akter, T.; Mitra, S.K.; Hernandez, S.; Corro-Diaz, K. A spatial panel regression model to measure the effect of weather events on freight truck traffic. Transp. A Trans. Sci. 2020, 16, 910–929. [Google Scholar] [CrossRef]
- Champahom, T.; Jomnonkwao, S.; Karoonsoontawong, A.; Ratanavaraha, V. Spatial zero-inflated negative binomial regression models: Application for estimating frequencies of rear-end crashes on Thai highways. J. Transp. Saf. Secur. 2020. [Google Scholar] [CrossRef]
- Wickham, H.; François, R.; Henry, L.; Müller, K. dplyr: A Grammar of Data Manipulation. Available online: https://CRAN.R-project.org/package=dplyr (accessed on 18 June 2020).
- Zeileis, A.; Kleiber, C.; Jackman, S. Regression Models for Count Data in R. J. Stat. Soft. 2020, 27, 8. [Google Scholar]
- Brooks, M.E. glmmTMB Balances Speed and Flexibility Among Packages for Zero-inflated Generalized Linear Mixed Modeling. R. J. 2017, 9, 378–400. [Google Scholar] [CrossRef] [Green Version]
- Xiao, D.; Xu, X.; Duan, L. Spatial-Temporal Analysis of Injury Severity with Geographically Weighted Panel Logistic Regression Model. J. Adv. Transp. 2019, 2019, 1–15. [Google Scholar] [CrossRef]
- Se, C.; Champahom, T.; Jomnonkwao, S.; Banyong, C.; Sukontasukkul, P.; Ratanavaraha, V. Hierarchical binary logit model to compare driver injury severity in single-vehicle crash based on age-groups. Int. J. Inj. Control Saf. Promot. 2020, 28, 113–126. [Google Scholar] [CrossRef]
- Champahom, T.; Jomnonkwao, S.; Watthanaklang, D.; Karoonsoontawong, A.; Chatpattananan, V.; Ratanavaraha, V. Applying hierarchical logistic models to compare urban and rural roadway modeling of severity of rear-end vehicular crashes. Acc. Anal. Prev. 2020, 141, 105537. [Google Scholar] [CrossRef] [PubMed]
- Bryk, A.S.; Raudenbush, S.W. Hierarchical Linear Models: Applications and Data Analysis Methods; Sage Publications: Newbury Park, CA, USA, 1992. [Google Scholar]
- Bates, D.; Mächler, M.; Bolker, B.; Walker, S. Fitting Linear Mixed-Effects Models Using lme4. J. Stat. Softw. 2015, 67, 48. [Google Scholar] [CrossRef]
- Dormann, C.F. Collinearity: A review of methods to deal with it and a simulation study evaluating their performance. Ecography 2013, 36, 27–46. [Google Scholar] [CrossRef]
- Thailand Department of Highways. Highway Traffic Volume. Available online: http://bhs.doh.go.th/en/download/traffic (accessed on 20 January 2021).
- Yu, R.; Wang, Y.; Quddus, M.; Li, J. A marginalized random effects hurdle negative binomial model for analyzing refined-scale crash frequency data. Anal. Methods Accid. Res. 2019, 22, 100092. [Google Scholar] [CrossRef]
- Vaida, F.; Blanchard, S. Conditional Akaike information for mixed-effects models. Biometrika 2005, 92, 351–370. [Google Scholar] [CrossRef]
- Hodges, J.S.; Sargent, D.J. Counting degrees of freedom in hierarchical and other richly-parameterised models. Biometrika 2001, 88, 367–379. [Google Scholar] [CrossRef] [Green Version]
- Donohue, M.C.; Overholser, R.; Xu, R.; Vaida, F. Conditional Akaike information under generalized linear and proportional hazards mixed models. Biometrika 2011, 98, 685–700. [Google Scholar] [CrossRef] [Green Version]
- Ma, Z.; Zhang, H.; Chien, S.I.; Wang, J.; Dong, C. Predicting expressway crash frequency using a random effect negative binomial model: A case study in China. Acc. Anal. Prev. 2017, 98, 214–222. [Google Scholar] [CrossRef] [PubMed]
- Mohammadi, M.; Shafabakhsh, G.; Naderan, A. Effects of modal shares on crash frequencies at aggregate level. Acc. Anal. Prev. 2018, 120, 295–303. [Google Scholar] [CrossRef]
- Abdul Manan, M.M.; Várhelyi, A.; Çelik, A.K.; Hashim, H.H. Road characteristics and environment factors associated with motorcycle fatal crashes in Malaysia. IATSS Res. 2018, 42, 207–220. [Google Scholar] [CrossRef]
- Dong, C.; Clarke, D.B.; Yan, X.; Khattak, A.; Huang, B. Multivariate random-parameters zero-inflated negative binomial regression model: An application to estimate crash frequencies at intersections. Acc. Anal. Prev. 2014, 70, 320–329. [Google Scholar] [CrossRef] [PubMed]
- Han, C.; Huang, H.; Lee, J.; Wang, J. Investigating varying effect of road-level factors on crash frequency across regions: A Bayesian hierarchical random parameter modeling approach. Anal. Meth. Acc. Res. 2018, 20, 81–91. [Google Scholar] [CrossRef]
- Aguero-Valverde, J. Full Bayes Poisson gamma, Poisson lognormal, and zero inflated random effects models: Comparing the precision of crash frequency estimates. Acc. Anal. Prev. 2013, 50, 289–297. [Google Scholar] [CrossRef] [PubMed]
- Liu, C.; Zhao, M.; Li, W.; Sharma, A. Multivariate random parameters zero-inflated negative binomial regression for analyzing urban midblock crashes. Anal. Meth. Acc. Res. 2018, 17, 32–46. [Google Scholar] [CrossRef] [Green Version]
- Bureau of Location and Design. Design Guideline of Road Median and Road Widering. Available online: http://www.ldhighway.com/general/publication.html (accessed on 20 June 2021).
- Naji, H.; Xue, Q.; Lyu, N.; Wu, C.; Zheng, K. Evaluating the Driving Risk of Near-Crash Events Using a Mixed-Ordered Logit Model. Sustainability 2018, 10, 2868. [Google Scholar] [CrossRef] [Green Version]
- Wali, B.; Khattak, A.J.; Khattak, A.J. A heterogeneity based case-control analysis of motorcyclist’s injury crashes: Evidence from motorcycle crash causation study. Acc. Anal. Prev. 2018, 119, 202–214. [Google Scholar] [CrossRef] [Green Version]
- Jomnonkwao, S.; Uttra, S.; Ratanavaraha, V. Forecasting Road Traffic Deaths in Thailand: Applications of Time-Series, Curve Estimation, Multiple Linear Regression, and Path Analysis Models. Sustainability 2020, 12, 395. [Google Scholar] [CrossRef] [Green Version]
- Delen, D.; Tomak, L.; Topuz, K.; Eryarsoy, E. Investigating injury severity risk factors in automobile crashes with predictive analytics and sensitivity analysis methods. J. Transp. Health 2017, 4, 118–131. [Google Scholar] [CrossRef]
- Zeng, Q.; Wen, H.; Huang, H. The interactive effect on injury severity of driver-vehicle units in two-vehicle crashes. J. Saf. Res. 2016, 59, 105–111. [Google Scholar] [CrossRef]
- Behnood, A.; Mannering, F.L. The temporal stability of factors affecting driver-injury severities in single-vehicle crashes: Some empirical evidence. Anal. Meth. Acc. Res. 2015, 8, 7–32. [Google Scholar] [CrossRef]
- Wang, Z.; Yue, Y.; Li, Q.; Nie, K.; Tu, W.; Liang, S. Analyzing Risk Factors for Fatality in Urban Traffic Crashes: A Case Study of Wuhan, China. Sustainability 2017, 9, 897. [Google Scholar] [CrossRef] [Green Version]
- Khorashadi, A.; Niemeier, D.; Shankar, V.; Mannering, F. Differences in rural and urban driver-injury severities in accidents involving large-trucks: An exploratory analysis. Acc. Anal. Prev. 2005, 37, 910–921. [Google Scholar] [CrossRef]
- Champahom, T.; Jomnonkwao, S.; Chatpattananan, V.; Karoonsoontawong, A.; Ratanavaraha, V. Analysis of Rear-End Crash on Thai Highway: Decision Tree Approach. J. Advan. Transp. 2019, 2019, 1–13. [Google Scholar] [CrossRef] [Green Version]
- Se, C.; Champahom, T.; Jomnonkwao, S.; Karoonsoontawong, A.; Ratanavaraha, V. Temporal stability of factors influencing driver-injury severities in single-vehicle crashes: A correlated random parameters with heterogeneity in means and variances approach. Anal. Meth. Acci. Res. 2021, 32, 100179. [Google Scholar]
- Se, C.; Champahom, T.; Jomnonkwao, S.; Chaimuang, P.; Ratanavaraha, V. Empirical comparison of the effects of urban and rural crashes on motorcyclist injury severities: A correlated random parameters ordered probit approach with heterogeneity in means. Accid. Anal. Prev. 2021, 161, 106352. [Google Scholar] [CrossRef]
- Jomnonkwao, S.; Uttra, S.; Ratanavaraha, V. Analysis of a driving behavior measurement model using a modified driver behavior questionnaire encompassing texting, social media use, and drug and alcohol consumption. Transp. Res. Interdiscip. Perspect. 2021, 9, 100302. [Google Scholar]
- Se, C.; Champahom, T.; Jomnonkwao, S.; Ratanavaraha, V. Risk Factors Affecting Driver Severity of Single- Vehicle Run Off Road Crash for Thailand Highway. Eng. J. 2020, 24, 207–216. [Google Scholar] [CrossRef]
- Phillips, R.O.; Ulleberg, P.; Vaa, T. Meta-analysis of the effect of road safety campaigns on accidents. Acc. Anal. Prev. 2011, 43, 1204–1218. [Google Scholar] [CrossRef] [PubMed]
- Ratanavaraha, V.; Jomnonkwao, S. Community participation and behavioral changes of helmet use in Thailand. Transp. Policy 2013, 25, 111–118. [Google Scholar] [CrossRef]
- Nambulee, W.; Jomnonkwao, S.; Siridhara, S.; Ratanavaraha, V. Modelling of seat belt use intention for intercity buses based on health belief model. Transp. A Transp. Sci. 2019, 15, 944–962. [Google Scholar] [CrossRef]
- Nambulee, W.; Jomnonkwao, S.; Siridhara, S.; Ratanavaraha, V.; Karoonsoontawong, A.; Beeharry, R. The intercity bus passenger’ s locus of control with regard to seat belt use intention. Suranaree J. Sci. Technol. 2018, 25, 235–246. [Google Scholar]
- Satiennam, T.; Kumphong, J.; Satiennam, W.; Klungboonkrong, P.; Jaensirisak, S.; Ratanavaraha, V. Change in helmet use behavior enforced by CCTV cameras with automatic helmet use detection system on an urban arterial road. Traffic Inj. Prev. 2020, 21, 494–499. [Google Scholar] [CrossRef] [PubMed]
- Kumphong, J.; Satiennam, T.; Satiennam, W. The determinants of motorcyclists helmet use: Urban arterial road in Khon Kaen City, Thailand. J. Saf. Res. 2018, 67, 93–97. [Google Scholar] [CrossRef] [PubMed]
- Mannering, F.L.; Shankar, V.; Bhat, C.R. Unobserved heterogeneity and the statistical analysis of highway accident data. Anal. Meth. Acc. Res. 2016, 11, 1–16. [Google Scholar] [CrossRef]


| Description | N | M | SD | MIN | MAX | |
|---|---|---|---|---|---|---|
| Crash number | Crash number | 16,933 | 6.39 | 33.89 | 0 | 1329 |
| Length | Length of segment | 16,933 | 3.08 | 5.02 | 0 | 63.16 |
| No. of Lane | Number of lanes | 16,933 | 3.19 | 1.78 | 1 | 14 |
| Concrete * | Pavement type (1 = Concrete, 0 = Otherwise) | 16,933 | 0.10 | 0.3 | 1 | 2 |
| Lane width | Lane width (m) | 16,933 | 3.47 | 0.21 | 2.5 | 6 |
| Footpath * | Shoulder type (1 = Footpath, 0 = otherwise) | 16,933 | 0.05 | 0.21 | 1 | 2 |
| Shoulder width | Shoulder width (m) | 16,933 | 1.74 | 0.88 | 0 | 7.2 |
| Median * | Divided road (1 = Yes, 0 = Otherwise) | 16,933 | 0.33 | 0.47 | 1 | 2 |
| Median width | Median width (m) | 16,933 | 0.84 | 3.27 | 0 | 15 |
| AADT | Average annual traffic volume (vehicle) | 16,933 | 14,465.51 | 24,286.45 | 58 | 339,248 |
| Percent of truck | Percentage of truck volume | 16,933 | 16.33 | 11.77 | 0 | 72.51 |
| LN_AADT | AADT in term of natural logarithm | 16,933 | 8.88 | 1.18 | 4.06 | 12.73 |
| Model | Log-Likelihood | AIC | cAIC | Pseudo-R2 |
|---|---|---|---|---|
| 1. Poisson regression (Po) | −196,868.2 | 393,758.0 | 393,760.418 | 0.278 |
| 2. Negative binomial (NB) | −30,074.3 | 60,173.0 | 60,172.704 | 0.043 |
| 3. Zero-inflated negative binomial (ZINB) | −29,420.0 | 58,888.5 | 58,886.034 | 0.060 |
| 4. Spatial zero-inflated negative binomial (SZINB) | −29,123.4 | 58,316.9 | 58,304.843 | 0.061 |
| Variable | Normal-State | Zero-State | ||||||
|---|---|---|---|---|---|---|---|---|
| Est. | Std. | p-Value | Sig. | Est. | Std. | p-Value | Sig. | |
| Fixed effect | ||||||||
| (Intercept) | −5.097 | 0.521 | <0.000 | *** | 2.460 | 0.898 | 0.006 | ** |
| length | 0.100 | 0.006 | <0.000 | *** | −1.755 | 0.171 | <0.000 | *** |
| No. of Lane | 0.110 | 0.019 | <0.000 | *** | −0.032 | 0.024 | 0.191 | |
| Concrete (=1) | −0.171 | 0.099 | 0.083 | . | −0.252 | 0.123 | 0.040 | * |
| Lane width | 0.115 | 0.127 | 0.362 | −0.056 | 0.235 | 0.813 | ||
| Footbath (=1) | 0.217 | 0.121 | 0.074 | . | −0.358 | 0.178 | 0.044 | * |
| Shoulder width | 0.226 | 0.035 | <0.000 | *** | 0.002 | 0.053 | 0.968 | |
| Median (=1) | 0.524 | 0.093 | <0.000 | *** | −0.446 | 0.125 | <0.000 | *** |
| Median width | 0.028 | 0.013 | 0.028 | * | 0.026 | 0.017 | 0.116 | |
| LN_AADT | 0.544 | 0.036 | <0.000 | *** | −0.125 | 0.045 | 0.006 | ** |
| Percent of truck | −0.002 | 0.003 | 0.423 | 0.000 | 0.004 | 0.981 | ||
| Random effect: Group = DOH_CODE | ||||||||
| (Intercept) | 2.238 | 1.496 | ||||||
| Distance | 0.001 | 0.027 | ||||||
| LN AADT | 0.033 | 0.182 | ||||||
| Percent of truck | 0.000 | 0.013 | ||||||
| Factor | Descriptions | N | M | SD | MIN | MAX |
|---|---|---|---|---|---|---|
| Fatal injury | 1 = Fatal crash, 0 = Otherwise | 37,685 | 0.14 | 0.35 | 0 | 1 |
| Vehicle size | 1 = Small, 2 = Middle, and 3 = Large | 37,685 | 1.97 | 0.6 | 1 | 3 |
| Driver age | Age of driver | 37,685 | 2.55 | 1.17 | 1 | 7 |
| Gender | 1 = Male, 0 = Female | 37,685 | 0.15 | 0.36 | 0 | 1 |
| Safety equip | 1 = Use, 0 = Otherwise | 37,685 | 0.36 | 0.48 | 0 | 1 |
| Drunk driver | 1 = Yes, 0 = Otherwise | 37,685 | 0.02 | 0.15 | 0 | 1 |
| Main road | 1 = Inner lane, 0 = Otherwise | 37,685 | 0.13 | 0.34 | 0 | 1 |
| Normal | 1 = Normal status *, 0 = Otherwise | 37,685 | 0.97 | 0.17 | 0 | 1 |
| Divided road | 1 = Divided road, 0 = Otherwise | 37,685 | 0.33 | 0.47 | 0 | 1 |
| Flush | 1 = Flush median, 0 = Otherwise | 37,685 | 0.05 | 0.21 | 0 | 1 |
| Raised | 1 = Raised median, 0 = Otherwise | 37,685 | 0.26 | 0.44 | 0 | 1 |
| Depressed | 1 = Depressed median, 0 = Otherwise | 37,685 | 0.23 | 0.42 | 0 | 1 |
| Barrier | 1 = Yes, 0 = Otherwise | 37,685 | 0.12 | 0.33 | 0 | 1 |
| Concrete | 1 = Yes, 0 = Otherwise | 37,685 | 0.11 | 0.32 | 0 | 1 |
| Straight | 1 = Yes, 0 = Otherwise | 37,685 | 0.84 | 0.37 | 0 | 1 |
| Slope | 1 = Yes, 0 = Otherwise | 37,685 | 0.06 | 0.24 | 0 | 1 |
| Intersection | 1 = Yes, 0 = Otherwise | 37,685 | 0.14 | 0.35 | 0 | 1 |
| Median opening | 1 = Yes, 0 = Otherwise | 37,685 | 0.10 | 0.3 | 0 | 1 |
| Road surfaces | 1 = Dry, 0 = Otherwise | 37,685 | 0.12 | 0.33 | 0 | 1 |
| Weather | 1 = Clean, 0 = Otherwise | 37,685 | 0.13 | 0.33 | 0 | 1 |
| Day | 1 = Yes, 0 = Otherwise | 37,685 | 0.60 | 0.49 | 0 | 1 |
| Darkness | 1 = Nighttime and non-lighting, 0 = Otherwise | 37,685 | 0.10 | 0.29 | 0 | 1 |
| Pedestrians | 1 = Pedestrian crash, 0 = Otherwise | 37,685 | 0.07 | 0.26 | 0 | 1 |
| Rear-end | 1 = Rear-end crash, 0 = Otherwise | 37,685 | 0.25 | 0.43 | 0 | 1 |
| Sideswipe | 1 = Sideswipe crash, 0 = Otherwise | 37,685 | 0.13 | 0.34 | 0 | 1 |
| Single vehicle | 1 = Single-vehicle crash, 0 = Otherwise | 37,685 | 0.41 | 0.49 | 0 | 1 |
| Head-on | 1 = Head-on crash, 0 = Otherwise | 37,685 | 0.03 | 0.16 | 0 | 1 |
| Other | 1 = Other crash type, 0 = Otherwise | 37,685 | 0.08 | 0.27 | 0 | 1 |
| Value/Model | Traditional Model | Random Parameter Model |
|---|---|---|
| Log-likelihood | −13,642.11 | −11,652.1 |
| AIC | 27,341.97 | 23,436.01 |
| McFadden R2 | 0.101 | 0.149 |
| Variables | Traditional Model | Random Effect Model | ||||
|---|---|---|---|---|---|---|
| Estimate | Std. Error | p-Value | Estimate | Std. Error | p-Value | |
| Fixed effect | ||||||
| (Intercept) | 0.550 | 0.177 | 0.002 | 0.292 | 0.304 | 0.337 |
| Vehicle size (=2) | −0.655 | 0.039 | <0.000 | −1.115 | 0.058 | <0.000 |
| Vehicle size (=3) | −0.550 | 0.052 | <0.000 | −1.169 | 0.075 | <0.000 |
| Gender (=1) | −0.359 | 0.048 | <0.000 | −0.422 | 0.067 | <0.000 |
| Safety equip (=1) | −0.538 | 0.036 | <0.000 | −0.512 | 0.061 | <0.000 |
| Drunk driver (=1) | 0.316 | 0.088 | <0.000 | 0.306 | 0.123 | 0.036 |
| Driver age | 0.087 | 0.013 | <0.000 | 0.090 | 0.018 | <0.000 |
| Day (=1) | −0.223 | 0.037 | <0.000 | −0.317 | 0.053 | <0.000 |
| Darkness (=1) | 0.653 | 0.051 | <0.000 | 0.552 | 0.074 | <0.000 |
| Road surfaces (=1) | 0.000 | 0.107 | 0.997 | −0.029 | 0.147 | 0.842 |
| Weather (=1) | −0.076 | 0.104 | 0.462 | −0.170 | 0.143 | 0.234 |
| Normal (=1) | −0.116 | 0.091 | 0.202 | −0.088 | 0.149 | 0.553 |
| Main Road (=1) | −0.184 | 0.065 | 0.005 | −0.288 | 0.104 | 0.006 |
| Divided road (=1) | −0.586 | 0.135 | <0.000 | −0.343 | 0.240 | 0.153 |
| No. of lane | −0.099 | 0.011 | <0.000 | −0.055 | 0.020 | 0.007 |
| Flush (=1) | −0.338 | 0.147 | 0.021 | −0.488 | 0.303 | 0.108 |
| Raised (=1) | −0.729 | 0.137 | <0.000 | −0.612 | 0.254 | 0.016 |
| Depressed (=1) | −0.469 | 0.137 | 0.001 | −0.167 | 0.247 | 0.499 |
| Barrier (=1) | −1.028 | 0.153 | <0.000 | −0.637 | 0.270 | 0.018 |
| Intersection (=1) | −0.307 | 0.047 | <0.000 | −2.050 | 0.308 | <0.000 |
| Median opening (=1) | 0.217 | 0.054 | <0.000 | −0.152 | 0.095 | 0.110 |
| Straight (=1) | −0.150 | 0.050 | 0.003 | −0.102 | 0.069 | 0.144 |
| Concrete (=1) | −0.182 | 0.058 | 0.002 | −0.073 | 0.108 | 0.497 |
| Slope (=1) | 0.183 | 0.068 | 0.007 | 0.171 | 0.098 | 0.082 |
| Pedestrians (=1) | −0.634 | 0.076 | <0.000 | −0.158 | 0.235 | 0.874 |
| Rear-end (=1) | −0.353 | 0.048 | <0.000 | −0.481 | 0.126 | 0.001 |
| Sideswipe (=1) | −0.667 | 0.058 | <0.000 | −2.528 | 0.483 | <0.000 |
| Single vehicle (=1) | −1.050 | 0.049 | <0.000 | −1.182 | 0.098 | <0.000 |
| Head-on (=1) | 0.509 | 0.079 | <0.000 | 0.397 | 0.444 | 0.536 |
| Variance | Std. Error | p-Value | ||||
| Random effect | ||||||
| Intercept | 0.018 | 0.135 | 0.791 | |||
| Divided Median (=1) | 1.434 | 1.197 | 0.389 | |||
| Flush (=1) | 1.437 | 1.199 | 0.389 | |||
| Median opening (=1) | 5.109 | 2.260 | 0.062 | |||
| Intersection (=1) | 10.680 | 3.268 | 0.004 | |||
| Raised (=1) | 2.525 | 1.589 | 0.226 | |||
| Depressed (=1) | 0.407 | 0.638 | 0.651 | |||
| Pedestrians (=1) | 2.182 | 1.477 | 0.268 | |||
| Rear-end (=1) | 4.280 | 2.069 | 0.094 | |||
| Sideswipe (=1) | 18.320 | 4.281 | <0.000 | |||
| Single vehicle (=1) | 2.631 | 1.622 | 0.214 | |||
| Head-on (=1) | 21.540 | 4.642 | <0.000 | |||
Publisher’s Note: MDPI stays neutral with regard to jurisdictional claims in published maps and institutional affiliations. |
© 2021 by the authors. Licensee MDPI, Basel, Switzerland. This article is an open access article distributed under the terms and conditions of the Creative Commons Attribution (CC BY) license (https://creativecommons.org/licenses/by/4.0/).
Share and Cite
Champahom, T.; Jomnonkwao, S.; Banyong, C.; Nambulee, W.; Karoonsoontawong, A.; Ratanavaraha, V. Analysis of Crash Frequency and Crash Severity in Thailand: Hierarchical Structure Models Approach. Sustainability 2021, 13, 10086. https://doi.org/10.3390/su131810086
Champahom T, Jomnonkwao S, Banyong C, Nambulee W, Karoonsoontawong A, Ratanavaraha V. Analysis of Crash Frequency and Crash Severity in Thailand: Hierarchical Structure Models Approach. Sustainability. 2021; 13(18):10086. https://doi.org/10.3390/su131810086
Chicago/Turabian StyleChampahom, Thanapong, Sajjakaj Jomnonkwao, Chinnakrit Banyong, Watanya Nambulee, Ampol Karoonsoontawong, and Vatanavongs Ratanavaraha. 2021. "Analysis of Crash Frequency and Crash Severity in Thailand: Hierarchical Structure Models Approach" Sustainability 13, no. 18: 10086. https://doi.org/10.3390/su131810086
APA StyleChampahom, T., Jomnonkwao, S., Banyong, C., Nambulee, W., Karoonsoontawong, A., & Ratanavaraha, V. (2021). Analysis of Crash Frequency and Crash Severity in Thailand: Hierarchical Structure Models Approach. Sustainability, 13(18), 10086. https://doi.org/10.3390/su131810086