Article

The Spatial Correlation and Driving Mechanism of Wood-Based Products Trade Network in RCEP Countries

1
School of Economics and Management, Beijing Forestry University, Beijing 100083, China
2
College of Economics and Management, Zhejiang A & F University, Hangzhou 311300, China
*
Author to whom correspondence should be addressed.
Sustainability 2021, 13(18), 10063; https://doi.org/10.3390/su131810063
Submission received: 2 July 2021 / Revised: 24 August 2021 / Accepted: 6 September 2021 / Published: 8 September 2021

Abstract

:
Clarifying the spatial correlation and driving mechanism of wood-based products trade network is conducive to promoting the Regional Comprehensive Economic Partnership (RCEP) to a higher level. Firstly, we explored the characteristics of spatial correlation and evolution tendency of raw material-type wood-based products trade network (TN-WFPM) and product-type wood-based products trade network (TN-WFPP) from the overall characteristics, centrality, and node coreness of the networks according to social network analysis method. Then we analyzed the driving mechanism of the spatial correlation according to the quadratic assignment procedure (QAP). The results show that, compared with TN-WFPM, the density, reciprocity, and agglomeration of the TN-WFPP are relatively stronger. The centrality and evolution characteristics of RCEP countries are different in the networks. The coreness of China and Thailand in the TN-WFPP has always been in the top two, while the coreness of China, Japan, and Korea has increased significantly and China has been the top since 2010 in the TN-WFPM. Factors like cultural distance, forest resource endowment, forest certification area, economic scale, economic distance, and free trade agreements (FTA) have significant impacts on the spatial correlation of wood-based products trade among RCEP countries. Furthermore, the impacts of different factors on the two kinds of networks are heterogeneous.

1. Introduction

Under the background of anti-globalization, international trade is increasingly restricted by non-tariff trade barriers. How to build a more open regional trade framework has become a project that countries are working hard on. The Regional Comprehensive Economic Partnership (RCEP) is an emerging regional trade agreement dominated by ASEAN with a relatively high degree of openness. It was proposed at the East Asia Summit in November 2011 for the first time, and on 15 November 2020, the ten ASEAN countries signed agreements with China, Japan, New Zealand, South Korea, and Australia in advance. The nine-year preparation and negotiation has allowed RCEP to develop the most free and open trade agreement. As a free trade agreement covering around 3.5 billion people and 1/3 of the global total GDP, RCEP aims to establish a unified market in 15 countries (Indonesia, Malaysia, Philippines, Singapore, Thailand, Brunei, Vietnam, Laos, Myanmar, Cambodia, China, Japan, New Zealand, South Korea, and Australia) by reducing tariffs and non-tariff barriers [1]. As anti-globalization accelerates, the signing of RCEP will not only help alleviate the risks that external uncertainties bring to members, but also reduce the adverse impacts of the COVID-19 on the economies. Moreover, it provides the platform for the reconstruction and integration of the value chain of countries in the region, which offers RCEP countries new opportunities in the trade of wood-based products.
Research on the spatial correlation and driving mechanism of wood-based products trade network in RCEP countries has a certain relationship with sustainable development. On the one hand, as an important renewable resource with both ecological and economic value [2], forests are of great significance to the sustainable development of a country’s environment. Wood-based products are directly derived from forests, while the forest resource endowments of RCEP countries are significantly different. For example, New Zealand’s per capita forest stock ranks among the top ten in the world, while China, South Korea, and Vietnam’s are much lower than the world average value. In order to meet domestic timber demand, some countries, especially the less developed countries with few forest resources, tend to ignore ecological and environmental issues and over-exploit forest resources. International trade based on comparative advantages can encourage countries to complement each other’s advantages based on their own comparative advantages in forest products trade, reducing the phenomenon of deforestation caused by a country’s insufficient domestic supply and facilitating the sustainable development of the ecological environment. On the other hand, by building a close international trade network of forest products, countries with comparative advantages in wood-based products can relieve domestic production capacity and earn foreign exchanges by export [
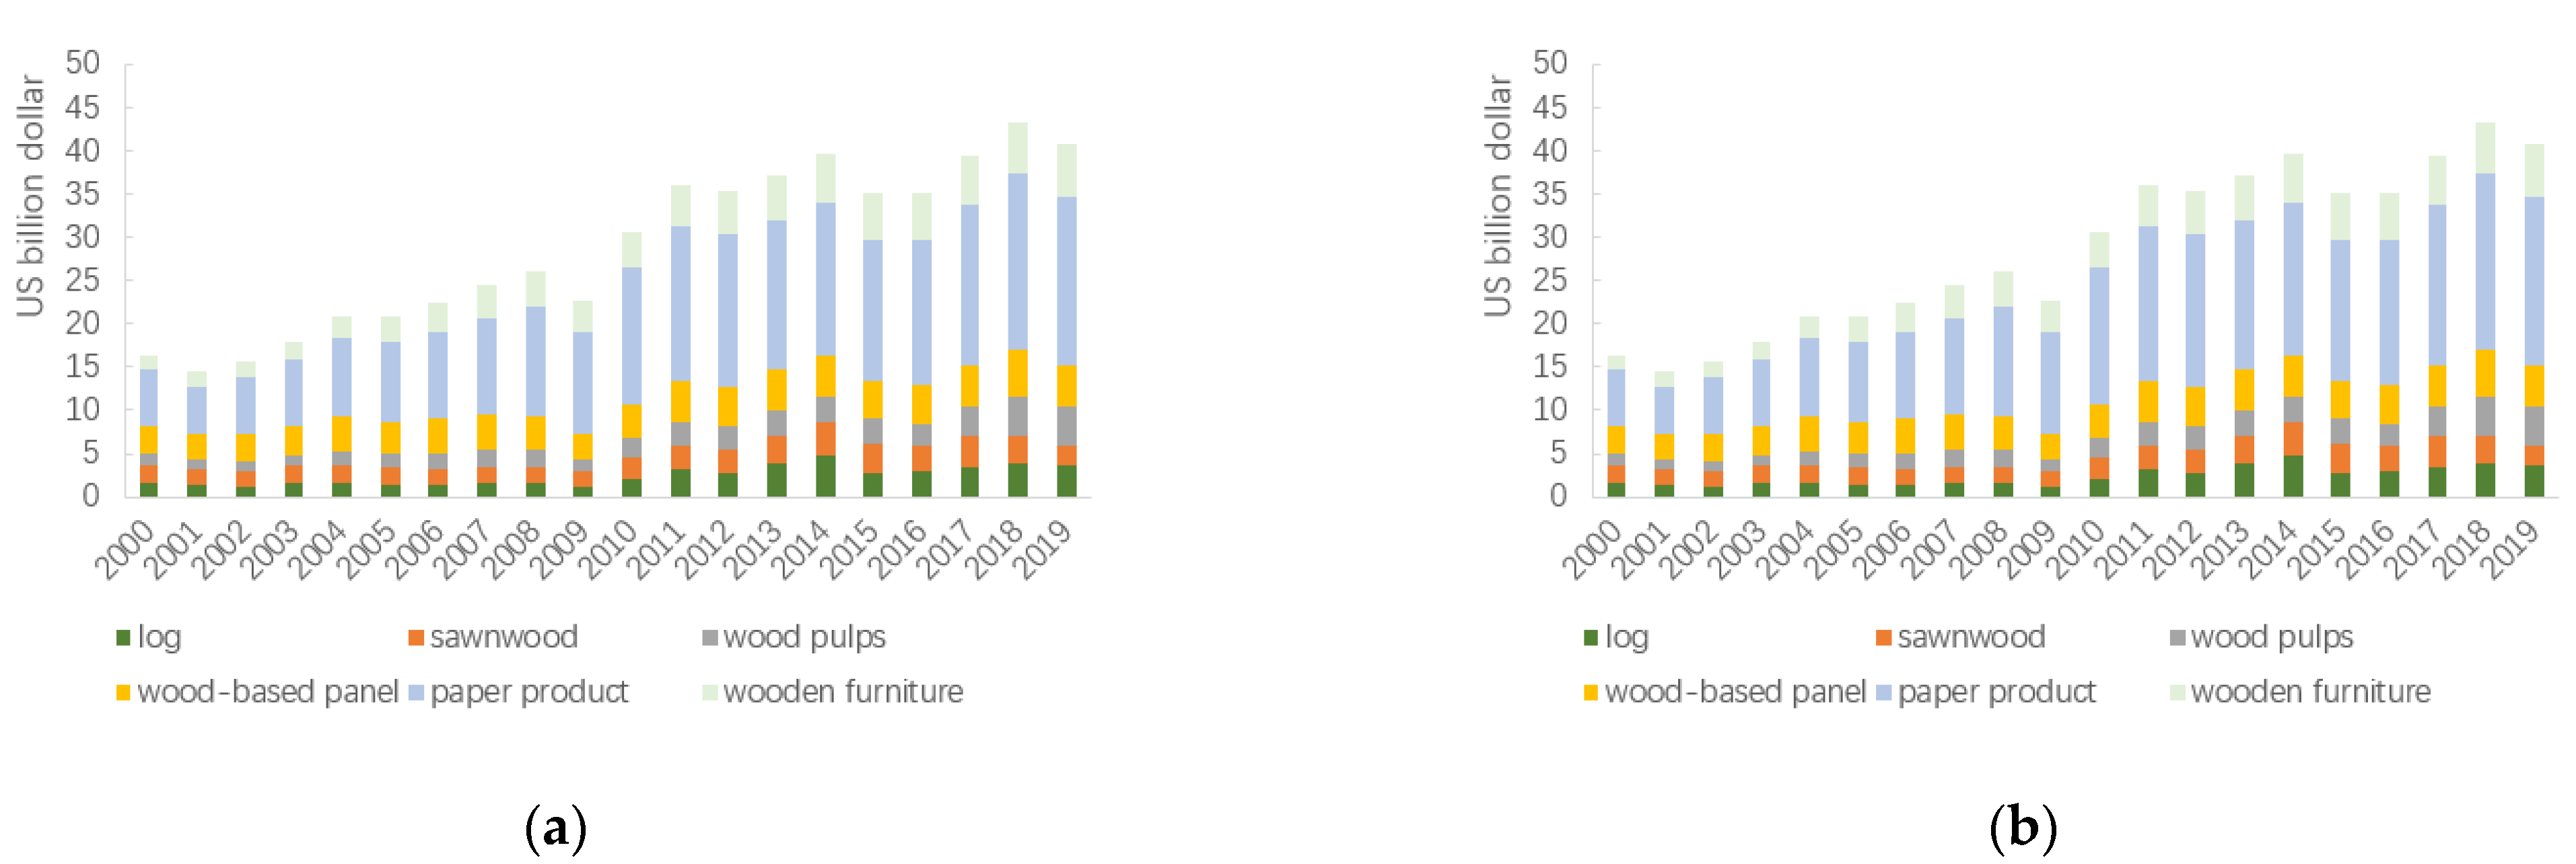
3], and it can also drive the cooperation of RCEP countries in other fields to a certain extent, which is conducive to the sustainable development of the economy and trade of all countries. According to the statistics of the UN Comtrade Database, as shown in Figure 1, the trade scale of six kinds of products among RCEP countries has shown a clear upward trend and the growth rate of furniture was the highest from 2000 to 2019, except for the setbacks caused by the financial crisis. In terms of the trade structure, the trade scale of paper product, wood-based panel, and wooden furniture make up most of the total, and the proportion of paper products in the total is still nearly half, although there is fluctuation. The expansion of the trade scale of wood-based products in RCEP countries is not only a manifestation of the closer trade ties between countries, but also promotes the RCEP process to some extent [4]. Thus, the official signing of RCEP further deepens forest products trade relations of each country and provides new impetus for expanding the scope of forest products trade.
From the proposal to the final signing by 15 countries except India, the concept of RCEP has undergone nearly ten years of negotiations. During this period, the impacts of RCEP on the members and even the world economy has attracted the attention of many scholars [1]. At this stage, the existing research on RCEP mainly focuses on the following aspects. Firstly, some scholars research the development prospects of the RECP before signing [5] and the impact of the signing on the elimination of non-tariff trade costs, and trade gravity model is the most commonly used method for such research. Secondly, there are also a great deal of comparative studies on RCEP and other FTAs. For instance, Bui et al. [6] estimated the impacts on members of TPP (Trans-Pacific Partnership Agreement), TPP-11, and RCEP in ten cases, respectively by eliminating tariffs and reducing non-tariff barriers (NTBs). Ko [7] compared the impacts of RCEP and TPP on the Korean economy and the results show that RCEP will be more beneficial, in terms of real GDP, welfare, and trade balance. Therefore, Korea has an economic incentive to play a leading role in promoting RCEP. In addition, some scholars have studied the heterogeneous effects of different trade facilitation measures on RCEP members. For instance, Zainuddin et al. [8] proved that the impacts of non-tariff measures (NTM) on bilateral exports among RCEP countries are heterogeneous in different industries. Erokhin et al. [9] found that there is a major imbalance between the potential value of trade among countries and the actual advantages of RCEP economies. As for the forest products trade, the existing research only pays attention to China’s export efficiency of forest products to RCEP countries [10] and lacks a systematic study from the perspective of the overall trade network.
In fact, the trade network can present the characteristics of the interconnected and dependent relations between countries in better way. Hence, it has already become a research hotspot and frontier field [11]. At this stage, the research on the evolution of trade networks has expanded from the initial overall perspective to a partial perspective, such as the East Asia Regional Network [12], the G20 [13], the “Belt and Road” [14], etc. The research content is also extrapolated from the general trade pattern research to the influencing factors of the trade network evolution [15] and the influence of network characteristics on the division of labor status in global value chains [16], etc. In recent years, some scholars have combined social network analysis with input-output methods and applied them to the study of global trade networks [17], as well as trade embodied carbon flow [18], virtual water flow [19], energy Flow [20] and other researches. The study of combining trade network visualization and statistical modeling to explore the micro-driving mechanism behind the network’s macro-topological structure characteristics has also received more and more attention [21]. As an FTA that aims to promote the coordinated development of members, clarifying the spatial correlation characteristics and driving mechanism of wooden forest product trade from the perspective of the overall network is meaningful for promoting RCEP to a higher level.
In summary, there are few studies on the trade of wood-based products in RECP countries from the perspective of networks, especially research on the comparative analysis and explanation of the network evolution mechanism from the dimensions of raw material-type and product-type. Based on this background, this paper divides wood-based products into product-type (including wood-based panel, paper products wooden furniture) and raw material-type (including log, sawnwood, wood pulps) according to the literature of Wan and Cheng [22]. Firstly, we analyze the spatial correlation of wood-based products trade from the perspective of network evolution, and then study the influence mechanism according to the quadratic assignment procedure (QAP). The research conclusions can provide reference for the policy making in wood-based products trade of RCEP countries.

2. Materials and Methods

2.1. Wood-Based Products Trade Network

The wood-based products trade network can be regarded as a relation network composed of a series of trade ties: G = (V, E), where V = {vi: i = 1, 2…. n} denotes different countries in the network, E = {vi, vj: i, j = 1, 2……, n} denotes the trade flow between country i and country j, and the direction of the edge represents the flow of trade [23]. In an unweighted trade network, the edge value 1 means that there is a trade tie, while 0 represents no tie. In a weighted trade network, the weight of the edge represents the trade value between countries.
This paper merges the trade data of wood-based panel, wood furniture, and paper product to build the TN-WFPP and combines the trade data of log, sawnwood, and wood pulps to build the TN-WFPM according to existing research [24].

2.2. Characterization of Network Structure

Network density is an index to measure the closeness of network ties, which can be divided into unweighted network density and weighted network density [25]. The unweighted directed density reflects the density of the ties in the network. Therefore, the network density can be defined as the ratio of the number of ties actually possessed to the maximum available number, and the value range of the unweighted density is [0–1]. The density of the weighted directed network represents the average strength of the edges in the network, namely the average trade volume between nodes.
Unweighted   directed   network   density   D n = L t N * ( N 1 )
Weighted   directed   network   density   W D n = j = 1 n i = 1 n V i j L t
where L t represents the number of ties and N represents the number of nodes in the network, and V i j represents the trade volume between country i and country j .

2.3. Network Centrality

Network centrality indicates the “importance” of the node in the network, namely how much “contribution” it makes to the network structure [26]. In social network analysis, the indicators commonly used to measure network centrality are degree centrality, betweenness centrality, closeness centrality, and eigenvector centrality, and the degree centrality is the most widely used in the field of international trade which is mainly used to characterize the breadth of a country’s trade. The degree centrality is given by:
d i = j x i j
where d i denotes the centrality of node i , x i j denotes the edge formed by node i and node j . The value is 1 when there is a tie between the two nodes and 0 when there is no tie.
Particularly, in a directed network, the degree centrality can be divided into indegree centrality and outdegree centrality, which represent the number of ties a node receives from other nodes and sent to another in the network respectively. When the tie direction represents the flow of goods, the outdegree and indegree centrality represent the number of export partners and import partners of a country respectively, which is given by:
  d i i n = j e i j
d i i n is the indegree centrality of node i , and e i j represents the edge formed by node i and node j . The value is 1 when there is a tie from j to i , otherwise the value is 0.
d i o u t = j e i j
d i o u t is the outdegree centrality of node i , and e i j represents the edge formed by node i and node j . The value is 1 when there is a tie from i to j , otherwise the value is 0.

2.4. Research Methodology

2.4.1. Research Method

In conventional statistical analysis such as multiple regression analysis, one of the prerequisites is that independent variables are required to be independent of each other, otherwise there will be “collinearity”. Since the network data themselves are about “connection”, it directly violates the principle of avoiding “collinearity”. This means that many conventional statistical techniques (such as OLS) cannot be simply applied to the statistical analysis of relational data [27], especially in the study of relations between “relationships”. At this time, a specific method is required, and QAP (quadratic assignment procedure) is one of its methods.
QAP is a method for comparing the values of the corresponding elements in two (or more) square matrices [28]. It compares the corresponding grid values of each square matrix to give the correlation between the two matrices coefficients, while non-parametric tests are performed on the coefficients, which are based on the replacement of matrix data [29]. QAP can not only measure the regression between two kinds of relational data, but also measure correlation, measuring the relationship between “attribute data” and “relational data” with the advantage of not requiring the variables to be independent of each other, which can effectively avoid the multicollinearity problem in traditional correlation tests and make the test results more robust [29]. In view of the unique characteristics of this method in measuring the correlation of relational data, this article adopts the QAP method to explore the driving mechanism of network evolution.

2.4.2. Factors Selection and Model Construction

In 1962, the economist Tinbergen verified in the Gravity Model that the geographic distance between two countries has a negative impact on the trade volume, while the GDP of the countries has a positive impact [30]. Since then, this conclusion has been verified by many scholars in multiple dimensions [31]. With the advancement of technology and the turbulence of the global political and economic structure, the factors affecting the formation and maintenance of trade relations have become more complicated and diversified. Scholars have expanded the gravity model in many ways. Nowadays, in addition to the economic and geographic distance, the factors affecting international trade in the existing literatures include cultural factors, resource endowments, trade barriers, FTAs, etc. Among them, culture, as a direct manifestation of national spirit, affects trade mainly through two ways: reducing trade costs and increasing affinity parameters [32]. Different cultural backgrounds increase the difficulty of economic communication and are not conducive to cross-border market activities [33]. In recent years, the view that cultural similarity significantly affects trade flows has become a broad consensus [34]. Therefore, the paper adopts language distance as a proxy variable for cultural differences. Resource endowment is the basis for international trade, especially for forest products, which are highly resource dependent. Countries with rich resource endowments have a certain comparative advantage in the international trade. According to the theory of comparative advantage, it can be inferred that the endowment of forest resources has a certain impact on the trade of wood-based products in RCEP countries, so we adopt the forest stock to represent the forest resource endowment of each country. In recent years, with the deepening of the concept of resource and environment protection and sustainable development, green trade barriers have gradually developed into an important factor affecting forest product trade. For wood-based products, the green trade barrier effect of forest certification has a certain impact on the trade [35]. Therefore, we adopt the forest certification area to test its impacts on the wood-based products trade. The FTA is a legally binding contract between two or more countries with the goal to eliminate trade barriers in order to allow products and services to flow freely among countries. The most direct manifestation of FTA’s economic impacts on members is in promoting the establishment of trade relations and the expansion of trade scale [36]. Therefore, the paper measures the degree of openness among countries through the number of FTA. For the basic variables of economic distance and geographic distance, this paper examines the impacts of economic distance on the evolution of the trade network from the two dimensions of economic scale and economic proximity according to the research of Duan et al. [37] and Liu et al. [21]. Economic scale is represented by GDP, and economic proximity is represented by GDP per capita. The geographical distance between countries is expressed by the distance between the capitals of the two countries, referencing the research of Niu et al. [38].
Based on the above research, we analyze the spatial correlation driving mechanism of the wooden forest product trade according to the QAP model. The model is set as follows:
D = f ( F T A ,   L a n g u a g e ,   D i s t a n c e ,   F o r e s t _ p e r ,   C e r t i f i c a t i o n ,   G D P _ p e r , G D P )
where the dependent variable D is the wood-based products trade network in 2019 of RCEP countries, FTA represents the relation matrix of trade agreements among countries, and F T A i j represents the number of FTA where countries i and j are both in. Language represents the matrix of cultural differences, and the value of 1 and 0 means that country i and country j use the same or different language respectively. Forest_per and Certification represent the difference matrixes of resource endowment and forest certification area, respectively. GDP_per and GDP represent the difference matrix of per capita GDP and GDP of each country respectively.

2.5. Data Sources

The wood-based products in the paper mainly include six kinds of products: Wood furniture (Seats: with wooden frames, upholstered, (excluding medical, surgical, dental, veterinary or barber furniture); Seats: with wooden frames, not upholstered, (excluding medical, surgical, dental, veterinary or barber furniture); Furniture: wooden, for office use; Furniture: wooden, for kitchen use; Furniture: wooden, for bedroom use; Furniture: wooden, other than for office, kitchen or bedroom use). Paper product (Waste and scrap of paper and paperboard; Paper and paperboard; articles of paper pulp, of paper or paperboard; Printed books, newspapers, pictures, and other products of the printing industry; manuscripts, typescripts, and plans). Wood-based panel (Particle board, oriented strand board (OSB) and similar board (e.g., waferboard) of wood or other ligneous materials, whether or not agglomerated with resins or other organic binding; Fiberboard of wood or other ligneous materials, whether or not bonded with resins or other organic substances; Plywood, veneered panels and similar laminated wood), wood furniture, and paper product are product-type wood-based products). Log (Wood in the rough, whether or not stripped of bark or sapwood, or roughly squared). Sawnwood (Railway or tramway sleepers (cross-ties) of wood; wood sawn or chipped lengthwise, sliced or peeled, whether or not planed, sanded or end-jointed, of a thickness exceeding 6 mm). Wood pulps (Pulp of wood or other fibrous cellulosic material).
The trade data of wood-based products in this paper come from the UN Comtrade Database. The forest stock of each country comes from the 2020 Global Forest Resources Assessment. The forest certification area comes from the Forest Stewardship Council (FSC) website. FTA, the distance and the language data come from the CEPII database, and the GDP and per capita GDP come from the World Bank database. In order to ensure the reliability of the conclusion, the paper preprocessed the collected trade data. Firstly, due to the fact that missing reports and inconsistent statistical calibers exist when reported to the United Nations, this paper uses the method of cross-validating the export data and import data to check the gaps and make up for the omissions. For the same trade relation, when the statistical data are inconsistent, the larger one shall prevail [39]. Secondly, since the trade values under some ties are small and may have an impact on the result, therefore, the data less than USD 10,000 will be deleted according to the existing research [40]. In addition, China only includes the mainland, excluding Hong Kong China, Macao China, and Taiwan China in the paper.

3. Results

3.1. The Evolution of Spatial Correlation Characteristics

3.1.1. The Evolution of Overall Characteristics

Network density is the most direct indicator to measure network structure characteristics from the overall perspective. Based on the calculation Formulas (1) and (2), the densities of TN-WFPM and TN-WFPP are obtained, as shown in Figure 2a below.
As shown in Figure 2a, the unweighted densities of the two networks are relatively stable from 2000 to 2019. The density of the TN-WFPP was significantly greater than that of the TN-WFPM, which indicates that compared with TN-WFPM, RCEP countries have closer trade relations in TN-WFPP. As for the weighted network density, it is increasing significantly, which can be seen that the average trade value of RCEP members in the two networks is generally on the rise. Compared with raw material-type products, the product-type products account for a larger proportion in RCEP countries and this proportion is increasing year by year. It shows that the trade scale of RCEP countries in wood-based products has increased, which can explain why the countries are committed to promoting the RCEP to some extent.
In a directed network, reciprocity reflects the level of two-way connections between nodes, which is beneficial to speed up the spread of material and information flow and helps to achieve the energy balance of the overall network. Therefore, the higher the two-way connection level, the higher the reciprocity and the more stable the network structure is [22]. As we can see from Figure 2b, the reciprocity of the two networks is above 0.5, indicating that networks have strong connectivity, diffusion, and are relatively stable. However, compared with the TN-WFPP, the reciprocity of TN-WFPM is relatively weak and there is still a lot of space for optimizing the trade of RECP countries. The clustering coefficient is mainly used to measure the degree of aggregation of nodes, which is measured by the proportion of closed triples to all triples in the network. According to Figure 2b, the clustering coefficients of the two networks are relatively stable and the ratio maintains above 0.7. Compared with the TN-WFPM, the clustering coefficient in the TN-WFPP is higher and the evolution is more stable. Thus, we can conclude that two types of forest product trade in RCEP countries have shown a relatively high degree of agglomeration, and it is higher in the trade of product-type wood-based products.

3.1.2. The Evolution of Network Centrality

According to Formulas (4) and (5), the degree of centrality of the two networks can be obtained and visualized as shown in Figure 3 and Figure 4. The thickness of the connection is directly proportional to the trade value, and the size of the node and node’s label is proportional to the outdegree centrality and indegree centrality, respectively. The country is a net exporting country when the color of the node is green and a net importing country when the color is red.
It can be seen from Figure 3 that for TN-WFPP, China, Thailand, Japan, and Korea have maintained a high level of centrality and a close trade relation with all countries of RCEP from 2000 to 2019, and Indonesia, Malaysia, Singapore, and Philippines are following on. While Cambodia, Myanmar, Laos, and Brunei have always had fewer export trade relations with RCEP members. As for the import, Thailand and Singapore have the closest import relations with RCEP countries, and China’s indegree centrality has increased significantly since 2010, indicating that the trade relations between China and RCEP members are getting closer. New Zealand, Korea, Malaysia, and other countries have relatively stable indegree centrality, while the trade relation between Laos and RCEP members is the sparsest. As for the tie strength, most of the trade value occurred in China, Korea, Malaysia, Japan, and Indonesia in 2000. While the tie strength has gradually increased and the trade scale of Singapore and Australia has increased significantly after 2015. China’s main trading partners for wood-based products in RCEP were South Korea, Japan, and Indonesia in 2000, while Australia, Malaysia, Singapore, and Vietnam have gradually become China’s important trading partners after 2005.
As shown in Figure 4, Brunei, Cambodia, and Laos all have low outdegree and indegree centrality in TN-WFPM while the remaining countries maintain relatively high centrality. The indegree centrality of China, Japan, South Korea, and Vietnam is significantly greater than the outdegree centrality; therefore, they are the net importing countries of raw material-type wood-based products, especially China, which is the major importer in the world. It has always been the top one in the indegree centrality and maintains import relations with all RCEP countries except Brunei, and the net import scale has shown a significant upward trend. Myanmar and New Zealand, with rich forest resources, have significantly greater outdegree centrality than indegree in the TN-WFPM, and they are typical net export countries with many exports partners. As the largest exporter of raw material-type wood-based products, New Zealand has a high capacity for sustainable forest management and a large area of forest certificated. The high level of legality and sustainability of forest management has provided advantages for New Zealand to overcome many green trade barriers set by other countries [35], the net export scale of New Zealand is rising significantly, and the trade relations with other members are getting stronger and stronger. New Zealand has gradually developed into the main raw material-type wood-based products exporter of RCEP countries. In terms of the tie strength, the main ties in TN-WFPM were China–Indonesia, China–Malaysia, and Japan–Malaysia in 2000, while New Zealand had become China’s largest trading partner, and the network status of Malaysia and Japan has declined while Thailand’s trade position has risen significantly in 2010. China and New Zealand have become the most important markets in 2019, still, their trade relations with other countries have become closer. In conclusion, The above analysis have revealed the motives of members to jointly build RCEP from the perspective of forest products trade. Correspondingly, the signing of RCEP also provides members with greater impetus for wooden products trade.

3.1.3. The Evolution of Network Coreness

The overall relation of the RCEP countries in the network is relatively close, while different countries have different coreness. This paper calculates the coreness of the two networks according to the literature of Borgatti and Everett [41] and visualizes the results as shown in Figure 4 and Figure 5 below.
For the evolution of the coreness in TN-WFPM, it can be seen from Figure 5 that China, Japan, Korea, Australia, and countries like Indonesia, Malaysia, Thailand, and the Philippines, which are from the ASEAN countries, have relatively high coreness in general, while the coreness of Myanmar, Vietnam, Laos, Brunei, and Cambodia is relatively weak. The coreness of China and Thailand have always been in the top two. As the world’s major producer and consumer of wood furniture, paper products, and wood-based panel, China and Thailand both show massive scale in the trade of forest products and have established stable trade relations with RCEP members, granting them a higher coreness in the network. The coreness rankings of Indonesia and Vietnam show an overall upward trend, especially after the RCEP negotiations started, and the coreness of the two has risen significantly and the trade relation with the members have become closer, which reflects the motivation of the two countries to establish a regional comprehensive economic partnership agreement to a certain extent. The coreness of Japan and Korea went through a wave-shaped dynamic change, while the coreness of Malaysia and New Zealand are relatively stable at a medium level. Singapore and Philippines’ coreness both increased firstly and then decreased. The coreness of Australia changed in the opposite direction especially after 2010, and with the advancement of RCEP negotiations, the coreness of Australia has increased more obviously. Myanmar, Cambodia, Laos, and Brunei are relatively stable in the bottom four of the coreness, which is related to the fact that their international demands and supplies of wood-based products are relatively small.
In contrast to TN-WFPP, China, Australia, New Zealand, and countries like Indonesia, Malaysia, Thailand, Myanmar, and Singapore from ASEAN have relatively high coreness in TN-WFPM (see Figure 6), while the coreness of South Korea, Japan, Laos, Brunei, Cambodia, the Philippines, and Vietnam is relatively low. The coreness of China, Japan, and Korea have risen significantly, and China has ranked first since 2010, and the driving force for the increasement in coreness comes from the expansion of imports of log sawnwood, wood pulps, and other products. The forest stocks of China, Japan, and Korea are lower than the world average level, while the demand for domestic consumption of raw material-type wood-based products and the export of products urgently needs to be met especially with the deepening concept of ecological protection, which has caused its coreness to rise significantly. The coreness of Australia began to decline after it reached the peak in 2010, while Singapore’s coreness dropped all the way from the top one in 2000 to exit the top 10 in 2019, which may be related to the status rise of New Zealand to a certain extent.

3.2. The Driving Mechanism of Trade Spatial Correlation

3.2.1. QAP Correlation Analysis

QAP correlation analysis is a method to study whether two “relation” matrices are related or not, which is based on matrix replacement. The correlation coefficient is given by comparing the similarity of the values in the two square matrices and performing a non-parametric test on the correlation coefficient [29]. The paper uses Ucinet software and selects 5000 random permutations to obtain the correlation coefficient matrix of each variable, as shown in Table 1.
It can be seen from Table 1 that FTA, language, forest resource endowment, forest certification area, and GDP significantly affect the formation of wood-based products trade network. Among them, the correlation coefficient between the trade network matrix D and FTA is 0.235, indicating that FTA contributes to the formation of wood-based products trade network, so there is an activeness effect in promoting the formation of trade relations among FTA members. The correlation coefficient between D and language is 0.206, indicating that the higher the degree of cultural similarity between countries, the easier it is to form trade relations of wood-based products, which reflects the important role of culture in promoting economic cooperation among countries. The correlation coefficient between D and Forest per is 0.169, indicating that countries with greater differences in forest resource endowments are more likely to form trade relations, which is consistent with the basic theory of international trade and fully reflects that the complementarity of resources lays a foundation for promoting regional cooperation [42]. The correlation coefficient between D and certification is 0.202, indicating that countries with greater differences in the legality of forest management are more likely to form trade in wood-based products, that is, countries with poorer forest management legality tend to form trade ties with countries with stronger forest management legality to meet their own demands for legally sourced products. The correlation coefficient between D and GDP is 0.288, indicating that the greater the economic distance, the easier it is to establish trade relations. It is worth noting that geographical distance does not have a significant impact on the trade network, which reflects the influence of FTA in promoting closer trade relations to a certain extent. In other words, it makes geographical distance no longer a factor that restricts trade between countries.

3.2.2. QAP Regression Analysis

According to the model, 5000 random replacements were selected to perform QAP regression analysis on the network D and its corresponding cultural distance, geographic distance, economic distance, forest certification area, forest resource endowment, economic development level, and FTA in 2019. The results are shown in Table 2 below. The R square is 0.242, indicating that the above independent variables can explain 24.2% of the changes in the dependent variable. The significance levels we adopted are * p < 0.1, ** p < 0.05 and *** p < 0.01, according to Yao et al. [36].
The regression result of Model 1 in Table 2 shows that the effect of language distance on the trade network is significant and positive (β = 0.1621, p = 0.0650 < 0.1), indicating that when other influencing factors are controlled, the impacts of culture on trade relations are still significant. The regression coefficient of forest certification is 0.2049, which is significant at 5% level, indicating that forest certification has trade promotion effects to some extent. The regression coefficient of forest resource endowment is 0.1652, which is significant at 10% level, suggesting that countries with large differences in resource endowments are more likely to form trade relations of wood-based products, that is, forest products flow from countries with relatively abundant forest resources to countries with scarce forest resources, which is a direct manifestation of trade theory. The standardized regression coefficient of GDP in the economic distance index is 0.2620, which is significant at 5% level, indicating that countries with larger differences in economic scale are more likely to form trade ties. The possible reason is that wood-based products are resource-intensive and labor-intensive. Countries with different economic scales have different comparative advantages in the wood-based products trade, and international trade can be used to achieve complementary advantages among countries. The effect of GDP_per on the trade network is significant and positive (β = −0.091, p = 0.0950 < 0.1), indicating that countries with higher economic proximity are easier to establish trade ties for wood-based products. Differing from this, FTA has a significant effect on the formation of network (β = 0.1962, p = 0.0480 < 0.05), indicating that FTA has a significant role in promoting wood-based products trading in RCEP countries. The regression coefficient of geographic distance is not significant, which means that geographic distance between countries does not have a significant impact on trade of wood-based products.
In order to further explore whether there is heterogeneity in the driving mechanism of the evolution of different networks, we conducted QAP regression analysis with the TN-MWFP and TN-MWFW in 2019 as the dependent variables respectively. The results are shown in Table 2. It can be seen from Model 2 and Model 3 that the influence of various factors on the trade networks is heterogeneous, and the R2 are 0.084 and 0.118 respectively, indicating that the above independent variables can explain 8.4% and 11.8% of the changes in the dependent variable in Model 2 and Model 3 respectively. The effect of cultural distance on TN-PWFP is not significant, while it is significant at 10% level on the TN-MWFP. The effect of resource endowment on the TN-PWFP trade network is significant (β = −0.21, p = 0.0860 < 0.1), while the impact on TN-MWFP is not significant. In addition, the economic scale has a significant effect on TN-MWFP at 5% level, while the effect on TN-PWFP is not significant. The impacts of economic proximity on the two networks are significant at 10% and 1% level, respectively, indicating that the closer the economic distance, the easier it is to establish trade relations for wood-based products. Geographical distance and FTA have no significant impacts on the two networks. It can be seen that geographic distance is no longer a factor restricting the trade of wood-based products in RCEP countries. For RCEP countries, it is necessary to make full use of the trade convenience provided by RCEP, take full advantage of the comparative advantages of countries, and establish a more stable and close trading network of wood-based products.

4. Discussion

A strong perception concerning the current wave of globalization is that the characteristics of international trade have changed over time, with an acceleration of modifications occurring in the last decades [40]. The wood-based products trade network of RCEP countries is part of a complex economic system, and corresponding changes have taken place in its network characteristics. The ties between countries have become closer, and China’s network status has become more and more important. The factors, such as economy, culture, distance, FTA, forest stock, and forest certification, affect its dynamic evolution to a certain extent.
It is worth noting that the impacts of forest certification on the three networks are significant at 5% level, which further proves the role of forest certification in promoting the trade of wood-based products. As a market-based means to deal with illegal logging and protect global forest resources, forest certification has gradually become a green trade barrier in forest product trade. Certified wood-based products are easier to flow in the trade [35]. In the international context of increasing awareness of ecological protection, forest certification has a significant positive role in promoting trade in wood-based products in RCEP countries. At this stage, the degree of forest certification of RCEP members varies greatly. Countries that are not certified should promote forest certification as soon as possible to avoid losing the initiative in the trade. The geographic distance between countries does not have a significant impact on trade of wood-based products which is different from the traditional gravity model [43]. It can be explained that with the advancement of technology, the gradual improvement of infrastructure in various countries, the increasing efficiency of the global logistics system, and the decreasing cost of international transportation make the effect of geographical distance on trade become less and less [34], which further validates the research results of Ghazalian [44].
In addition, it should be noted that the above factors have a heterogeneous impact on the formation of different types of forest products trading networks, such as the language, forest stock, and FTA. The existing research on the impact of cultural distance on trade relations believes that similar cultural backgrounds can reduce transaction costs in international trade [33,34], which is conducive to the formation of trade relations, so the closer the cultural distance, the easier it is to form trade ties. This conclusion was verified in Model 1 and Model 2, while the effect of language distance on the formation of the TN-MWFW is not significant. The reasons for this heterogeneity may be due to the fact that the raw material wood-based products generally enter the product manufacturing process as intermediate products and will not be directly contacted by users; therefore, cultural differences between countries may not have a significant impact on the formation of the TN-MWFW, or there may be other factors that we need to further explore in future research.
It is true that this paper deeply analyzes the evolution and driving mechanism of the characteristics of the two types of wood-based products trade network, and expands the existing research on the wood-based forest products trade, while the QAP method does not take into account the dynamic impact of various factors on the formation of the trade network, and the research conclusions have certain limitations and the discussion on the influence mechanism is still not deep enough. In future research, we will pay more attention to the influence mechanism and dynamic influence of various factors on the formation and evolution of trade networks in the time dimension.

5. Conclusions

This paper analyzes the spatial correlation characteristics and evolution trends of wood-based products trade network in RCEP countries from 2000 to 2019, and explores the driving mechanism of it according to the QAP method. The main conclusions are as follows.
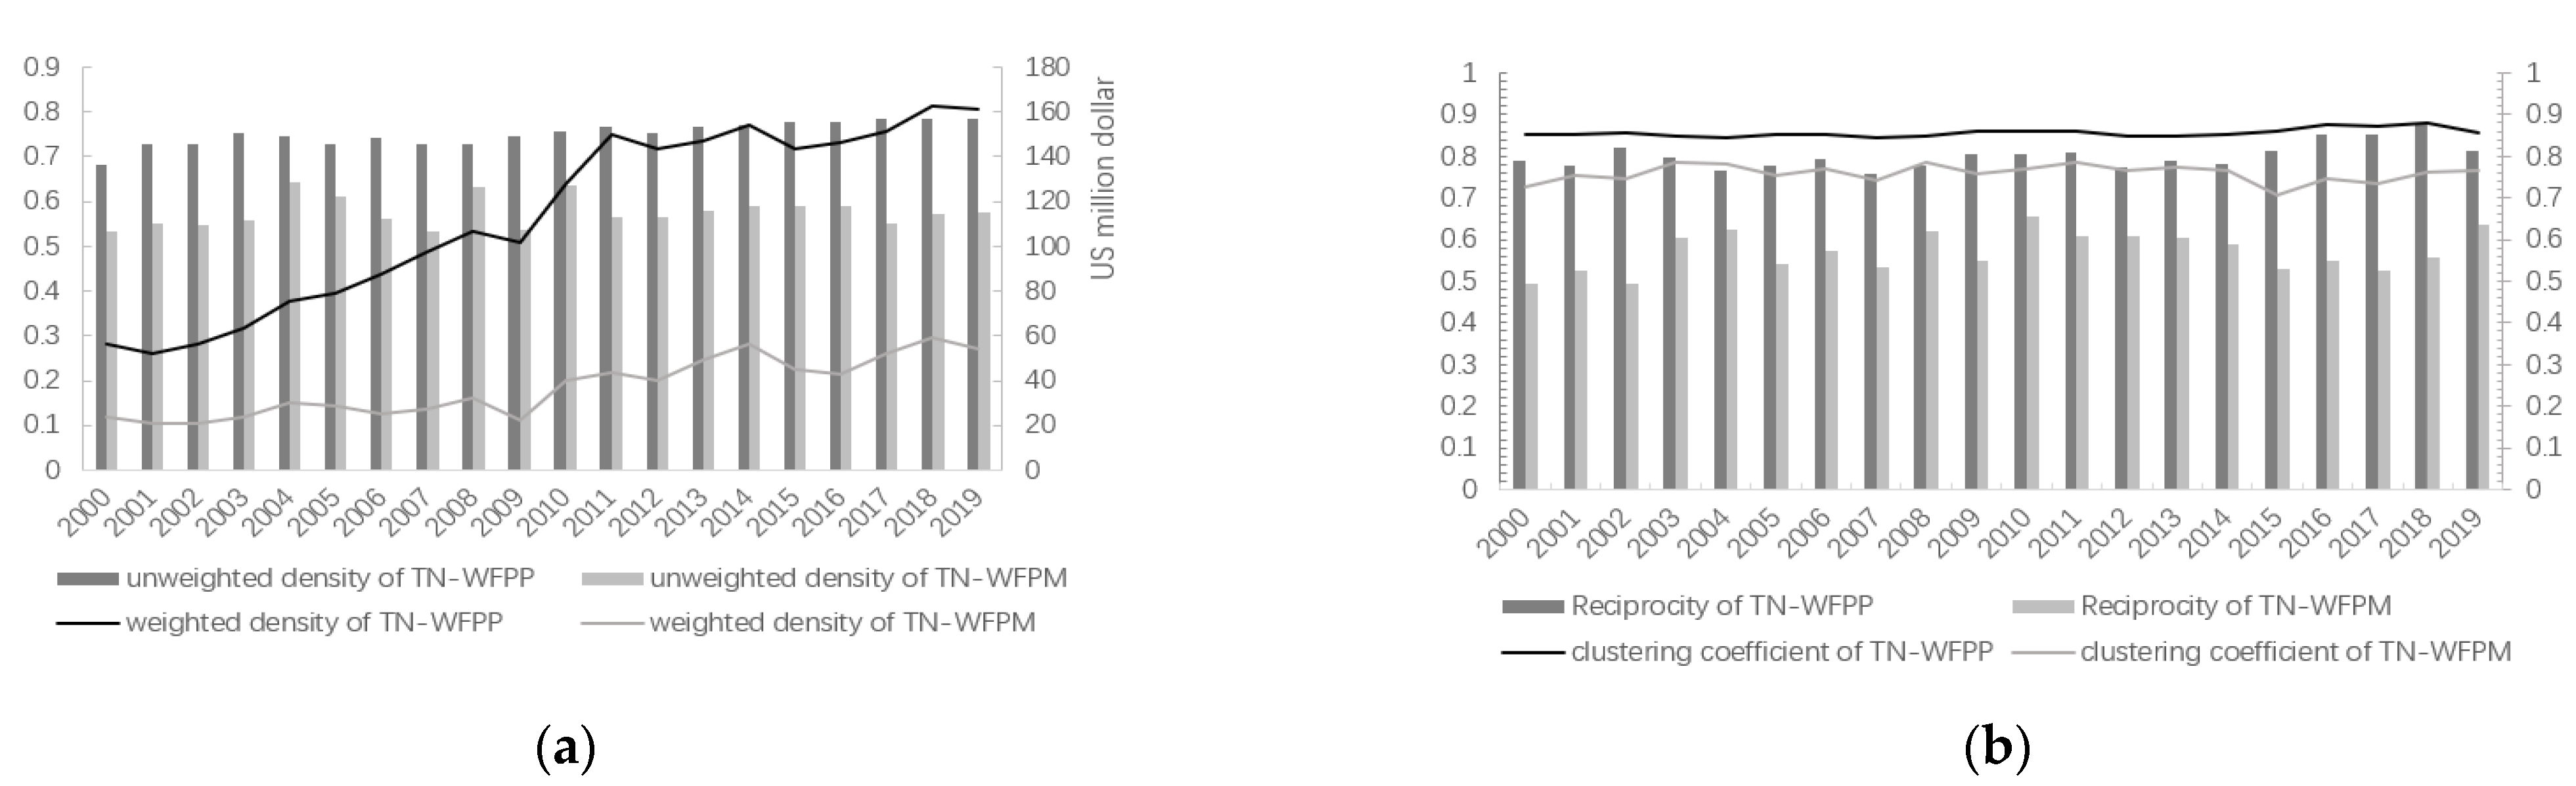
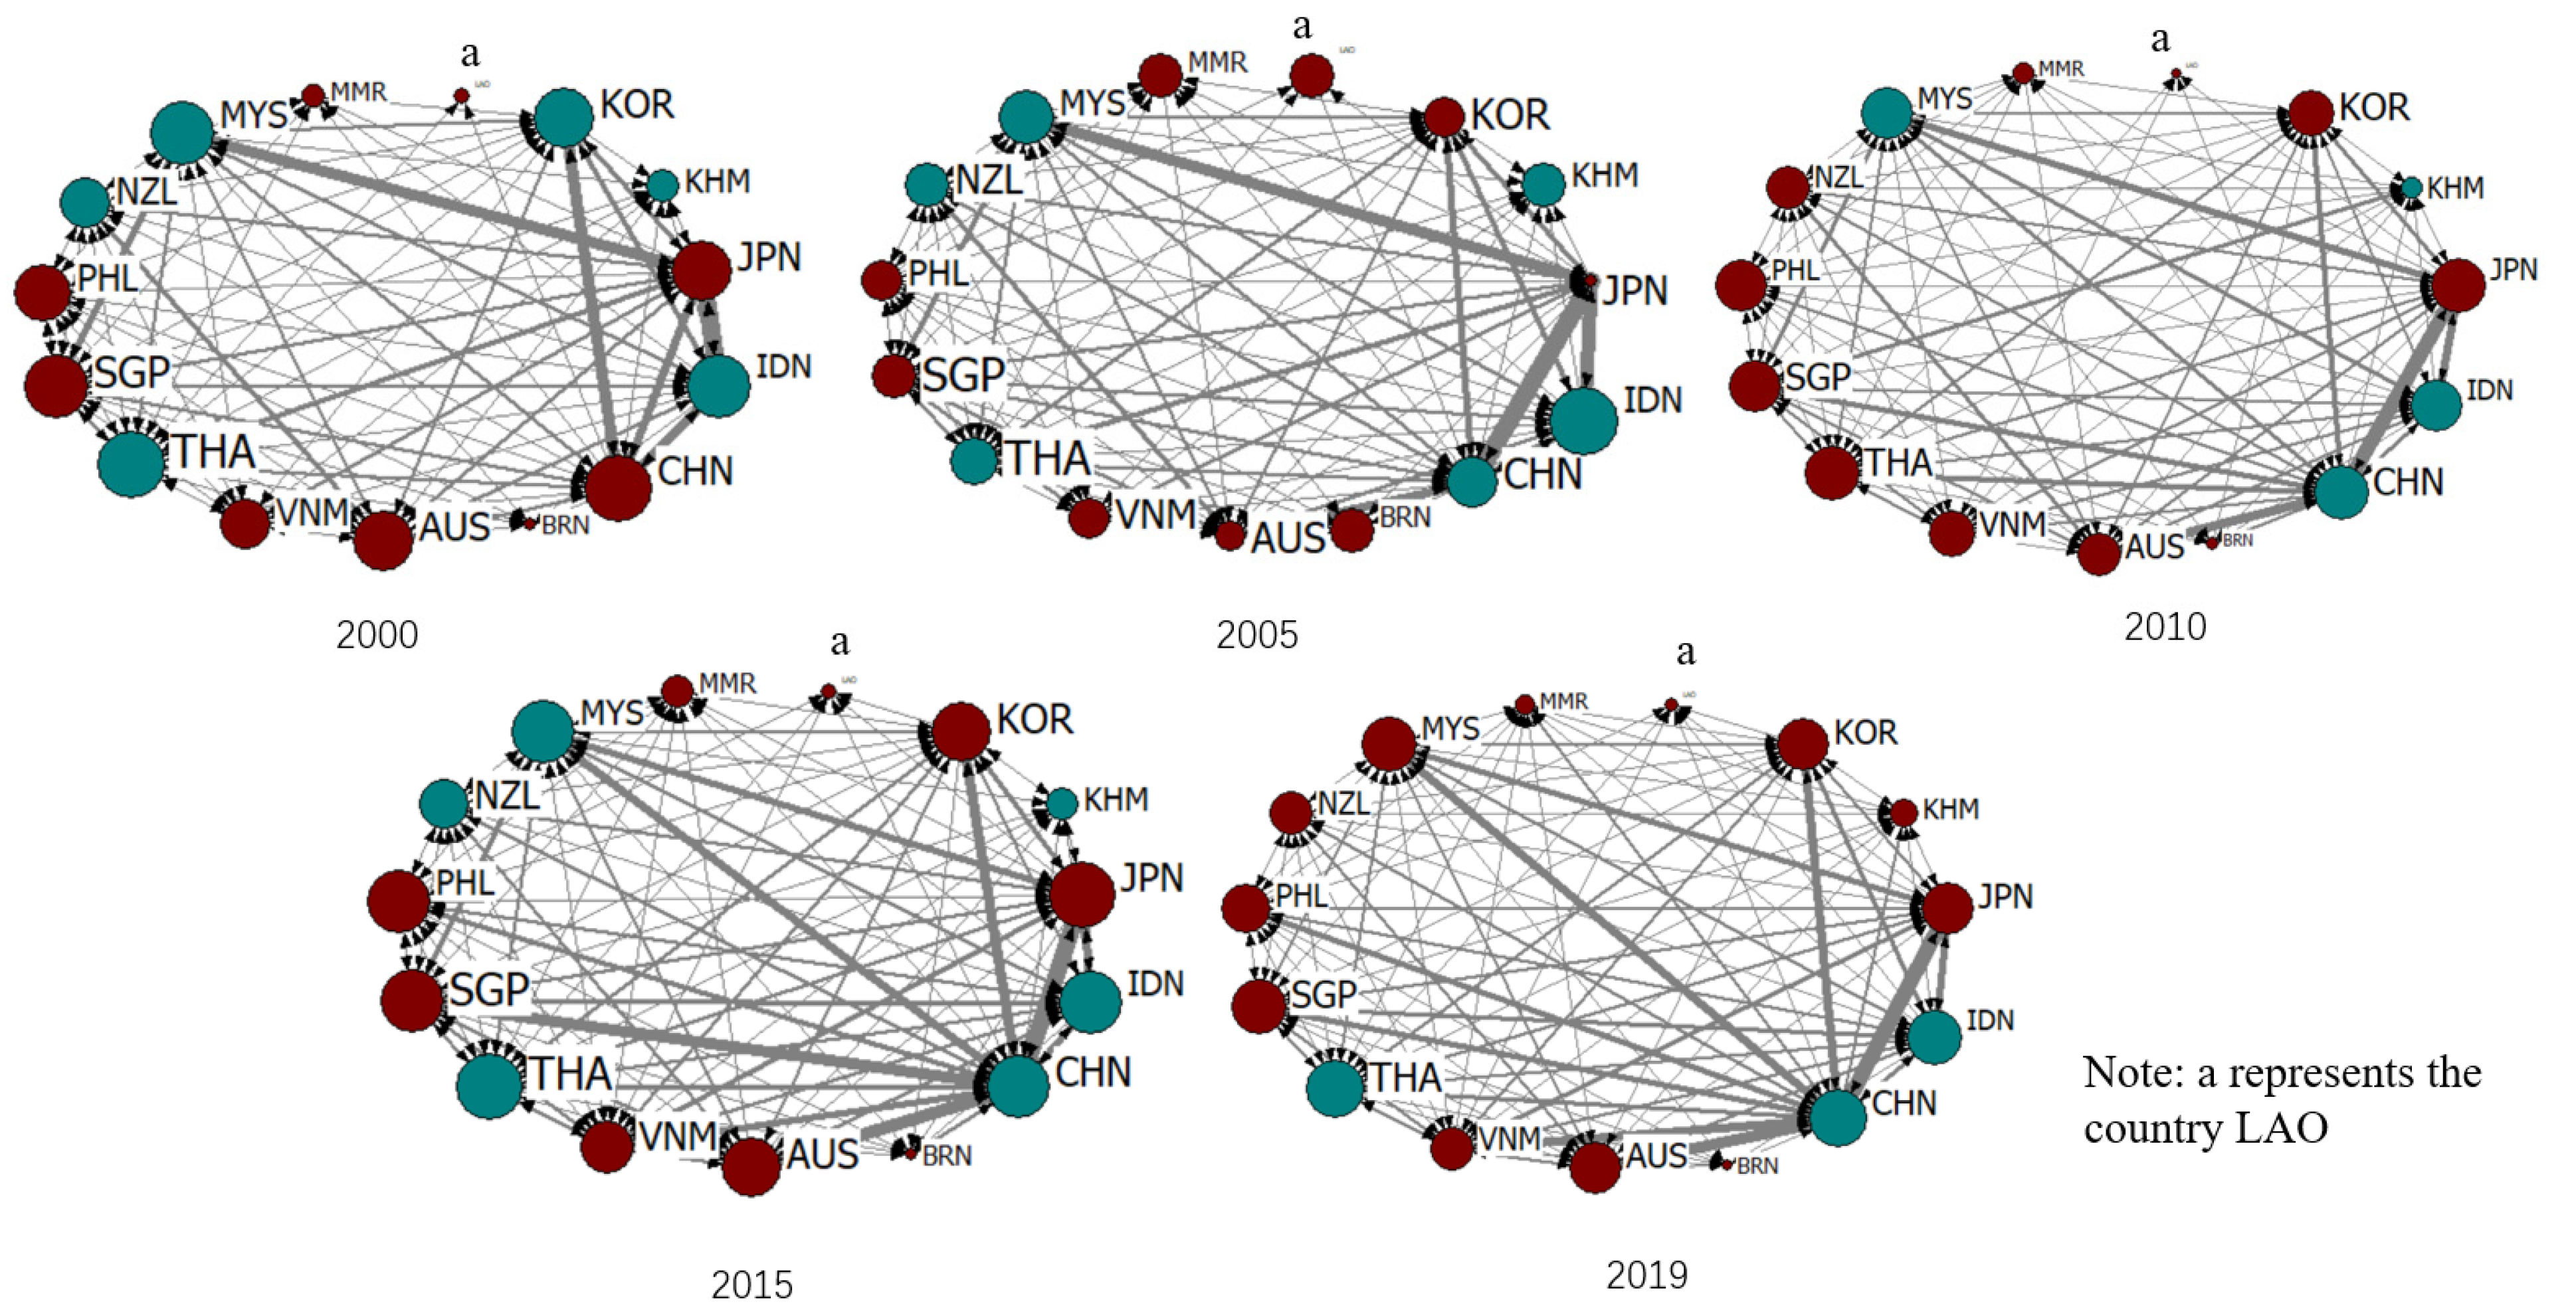
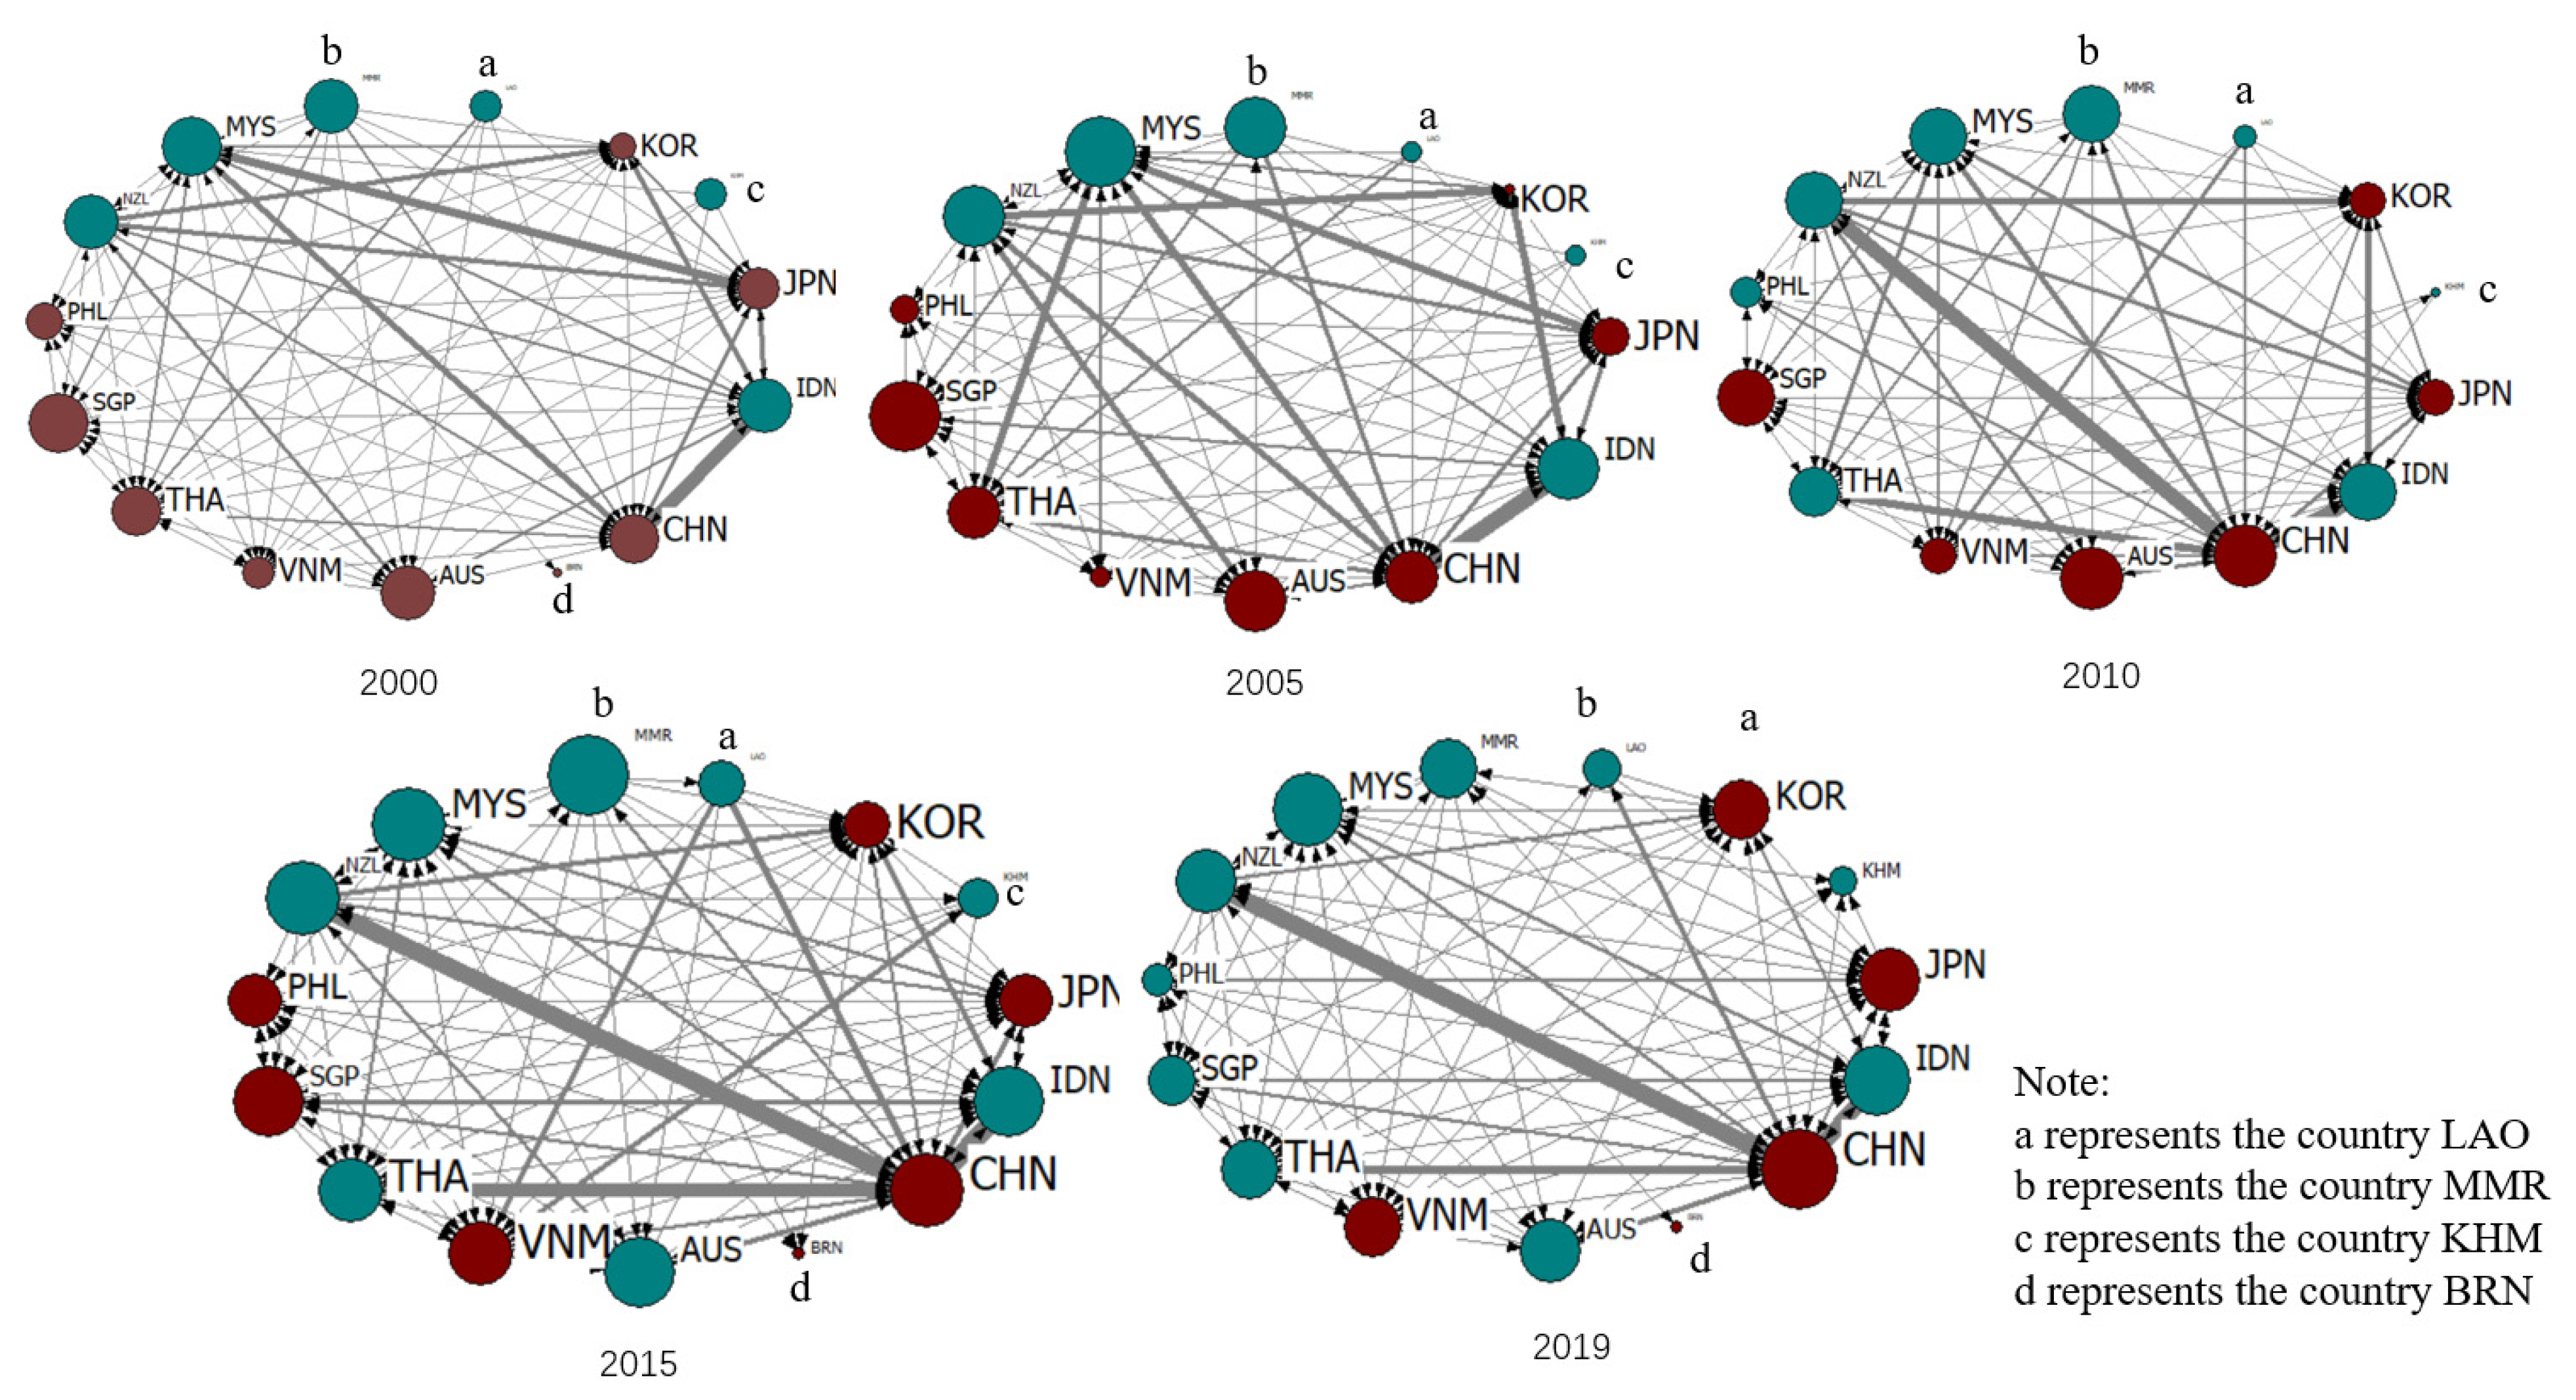
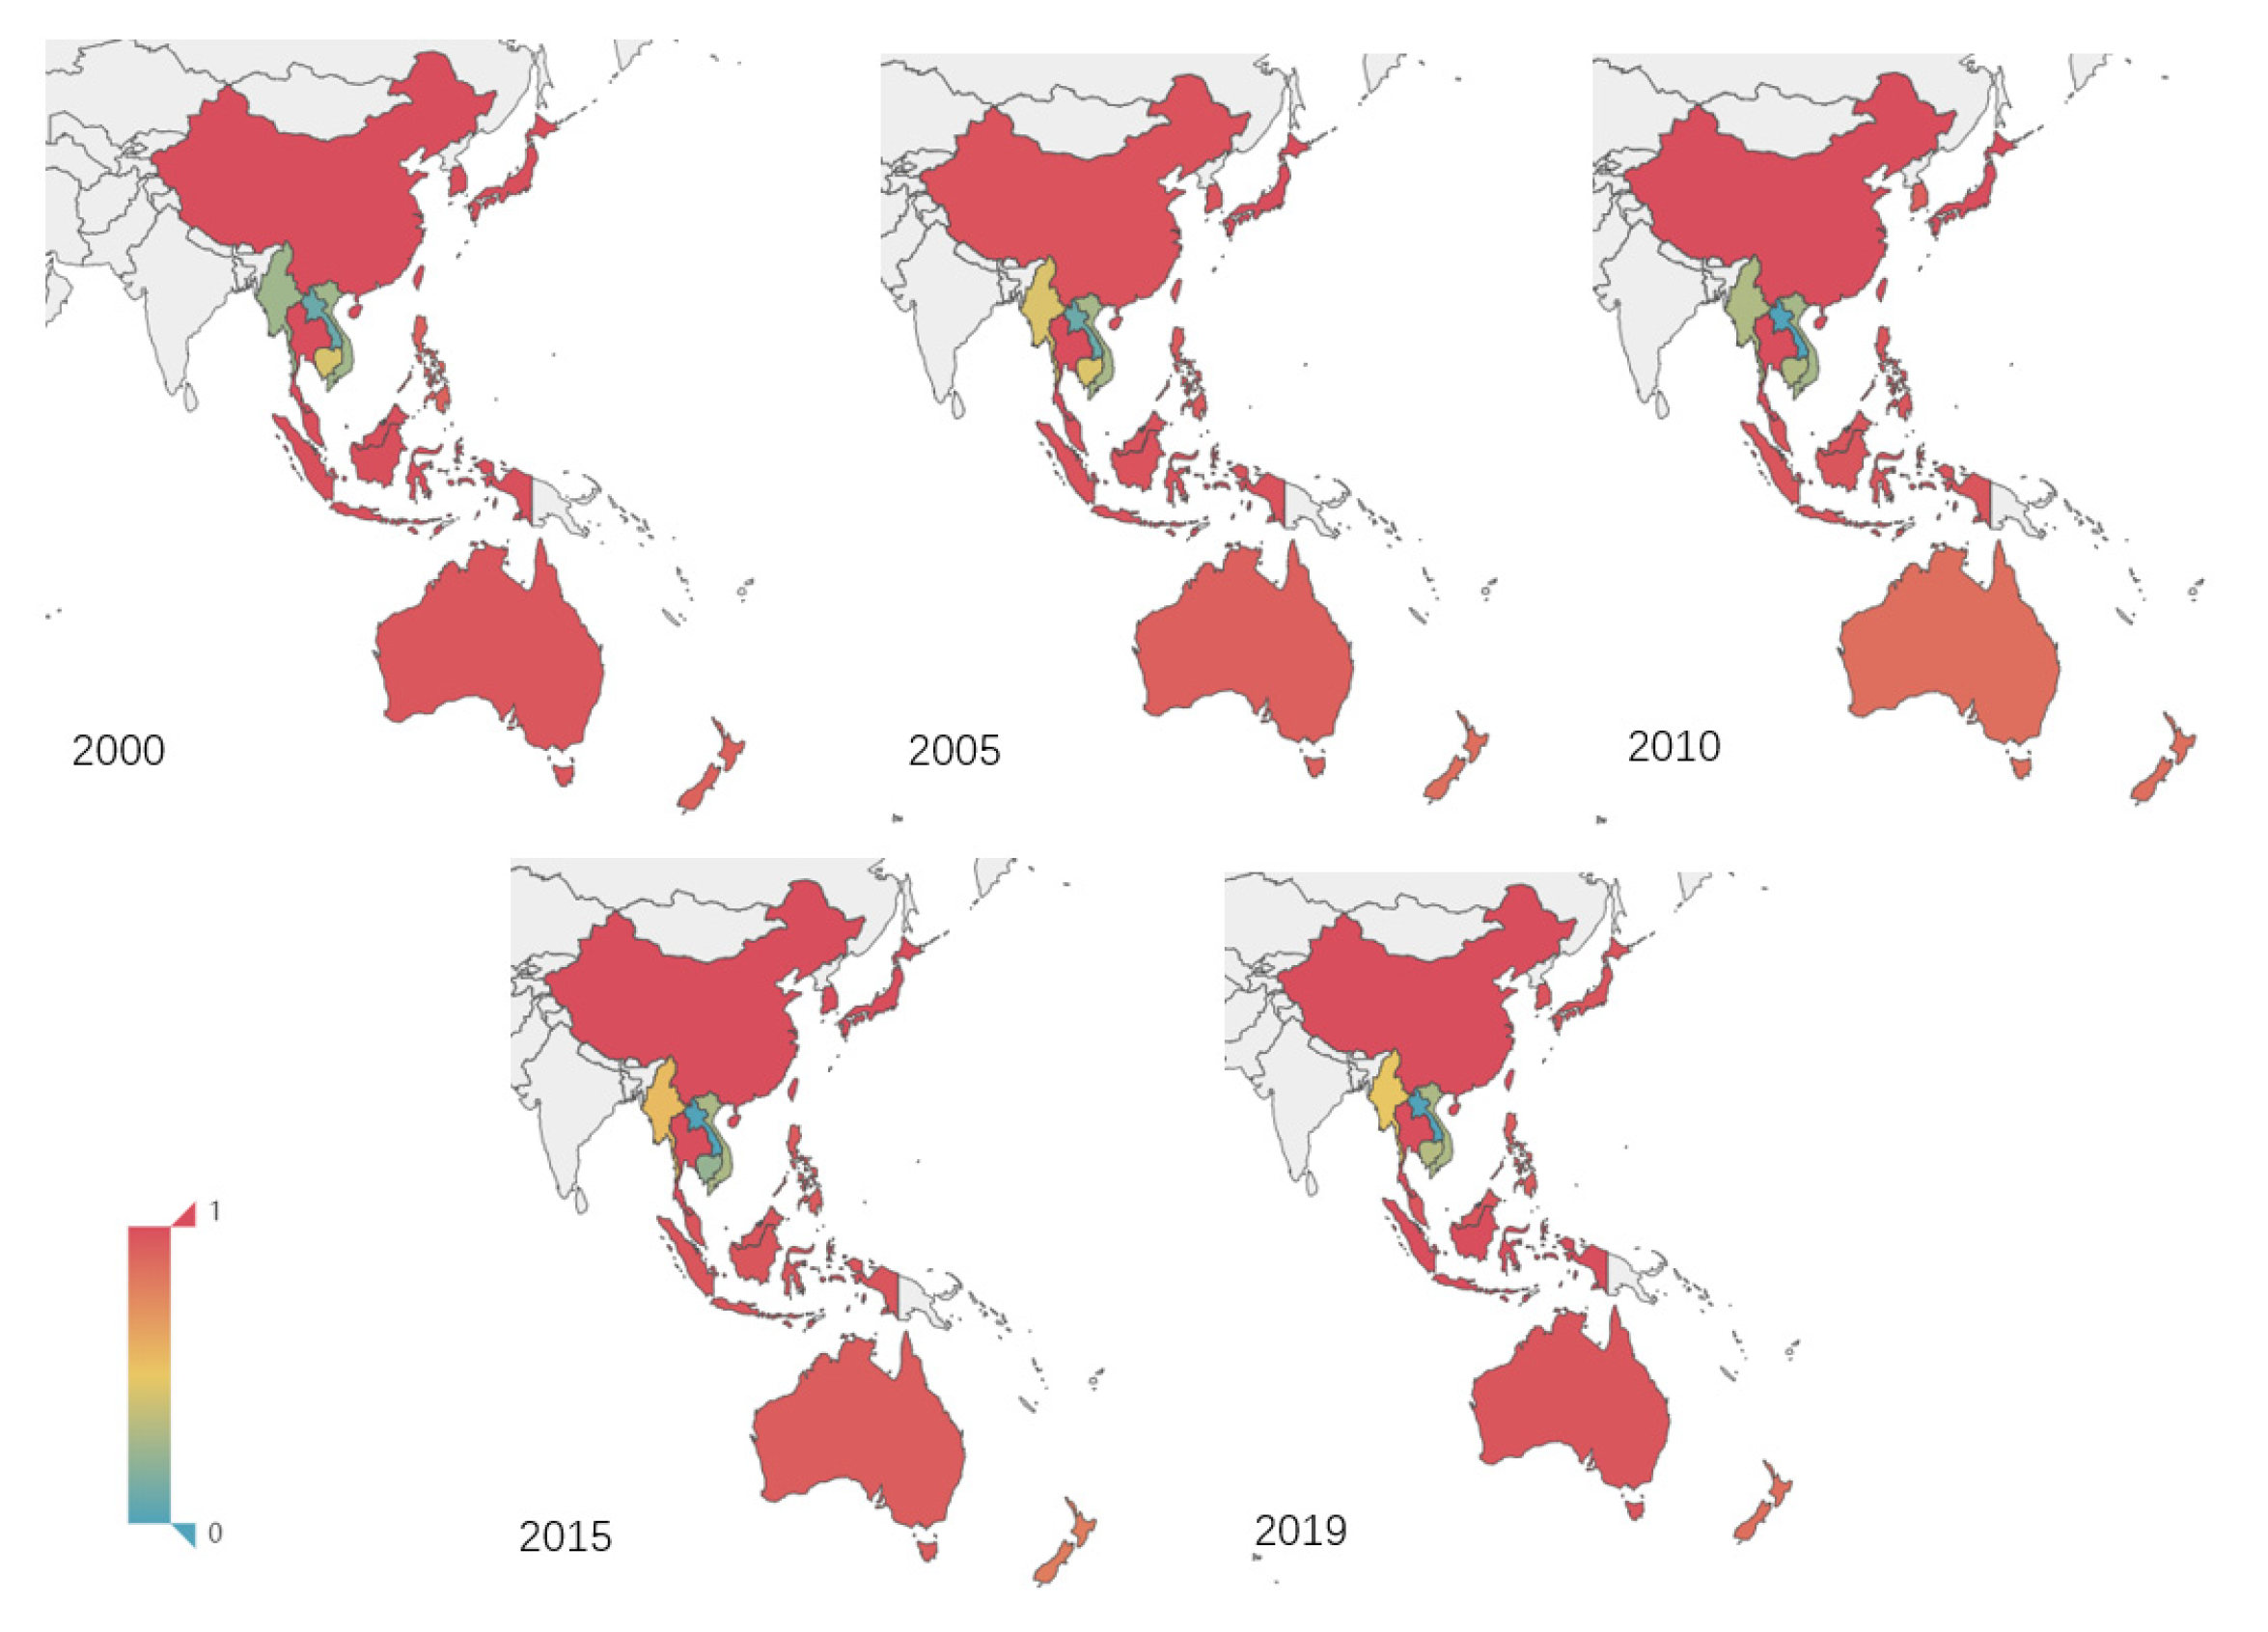
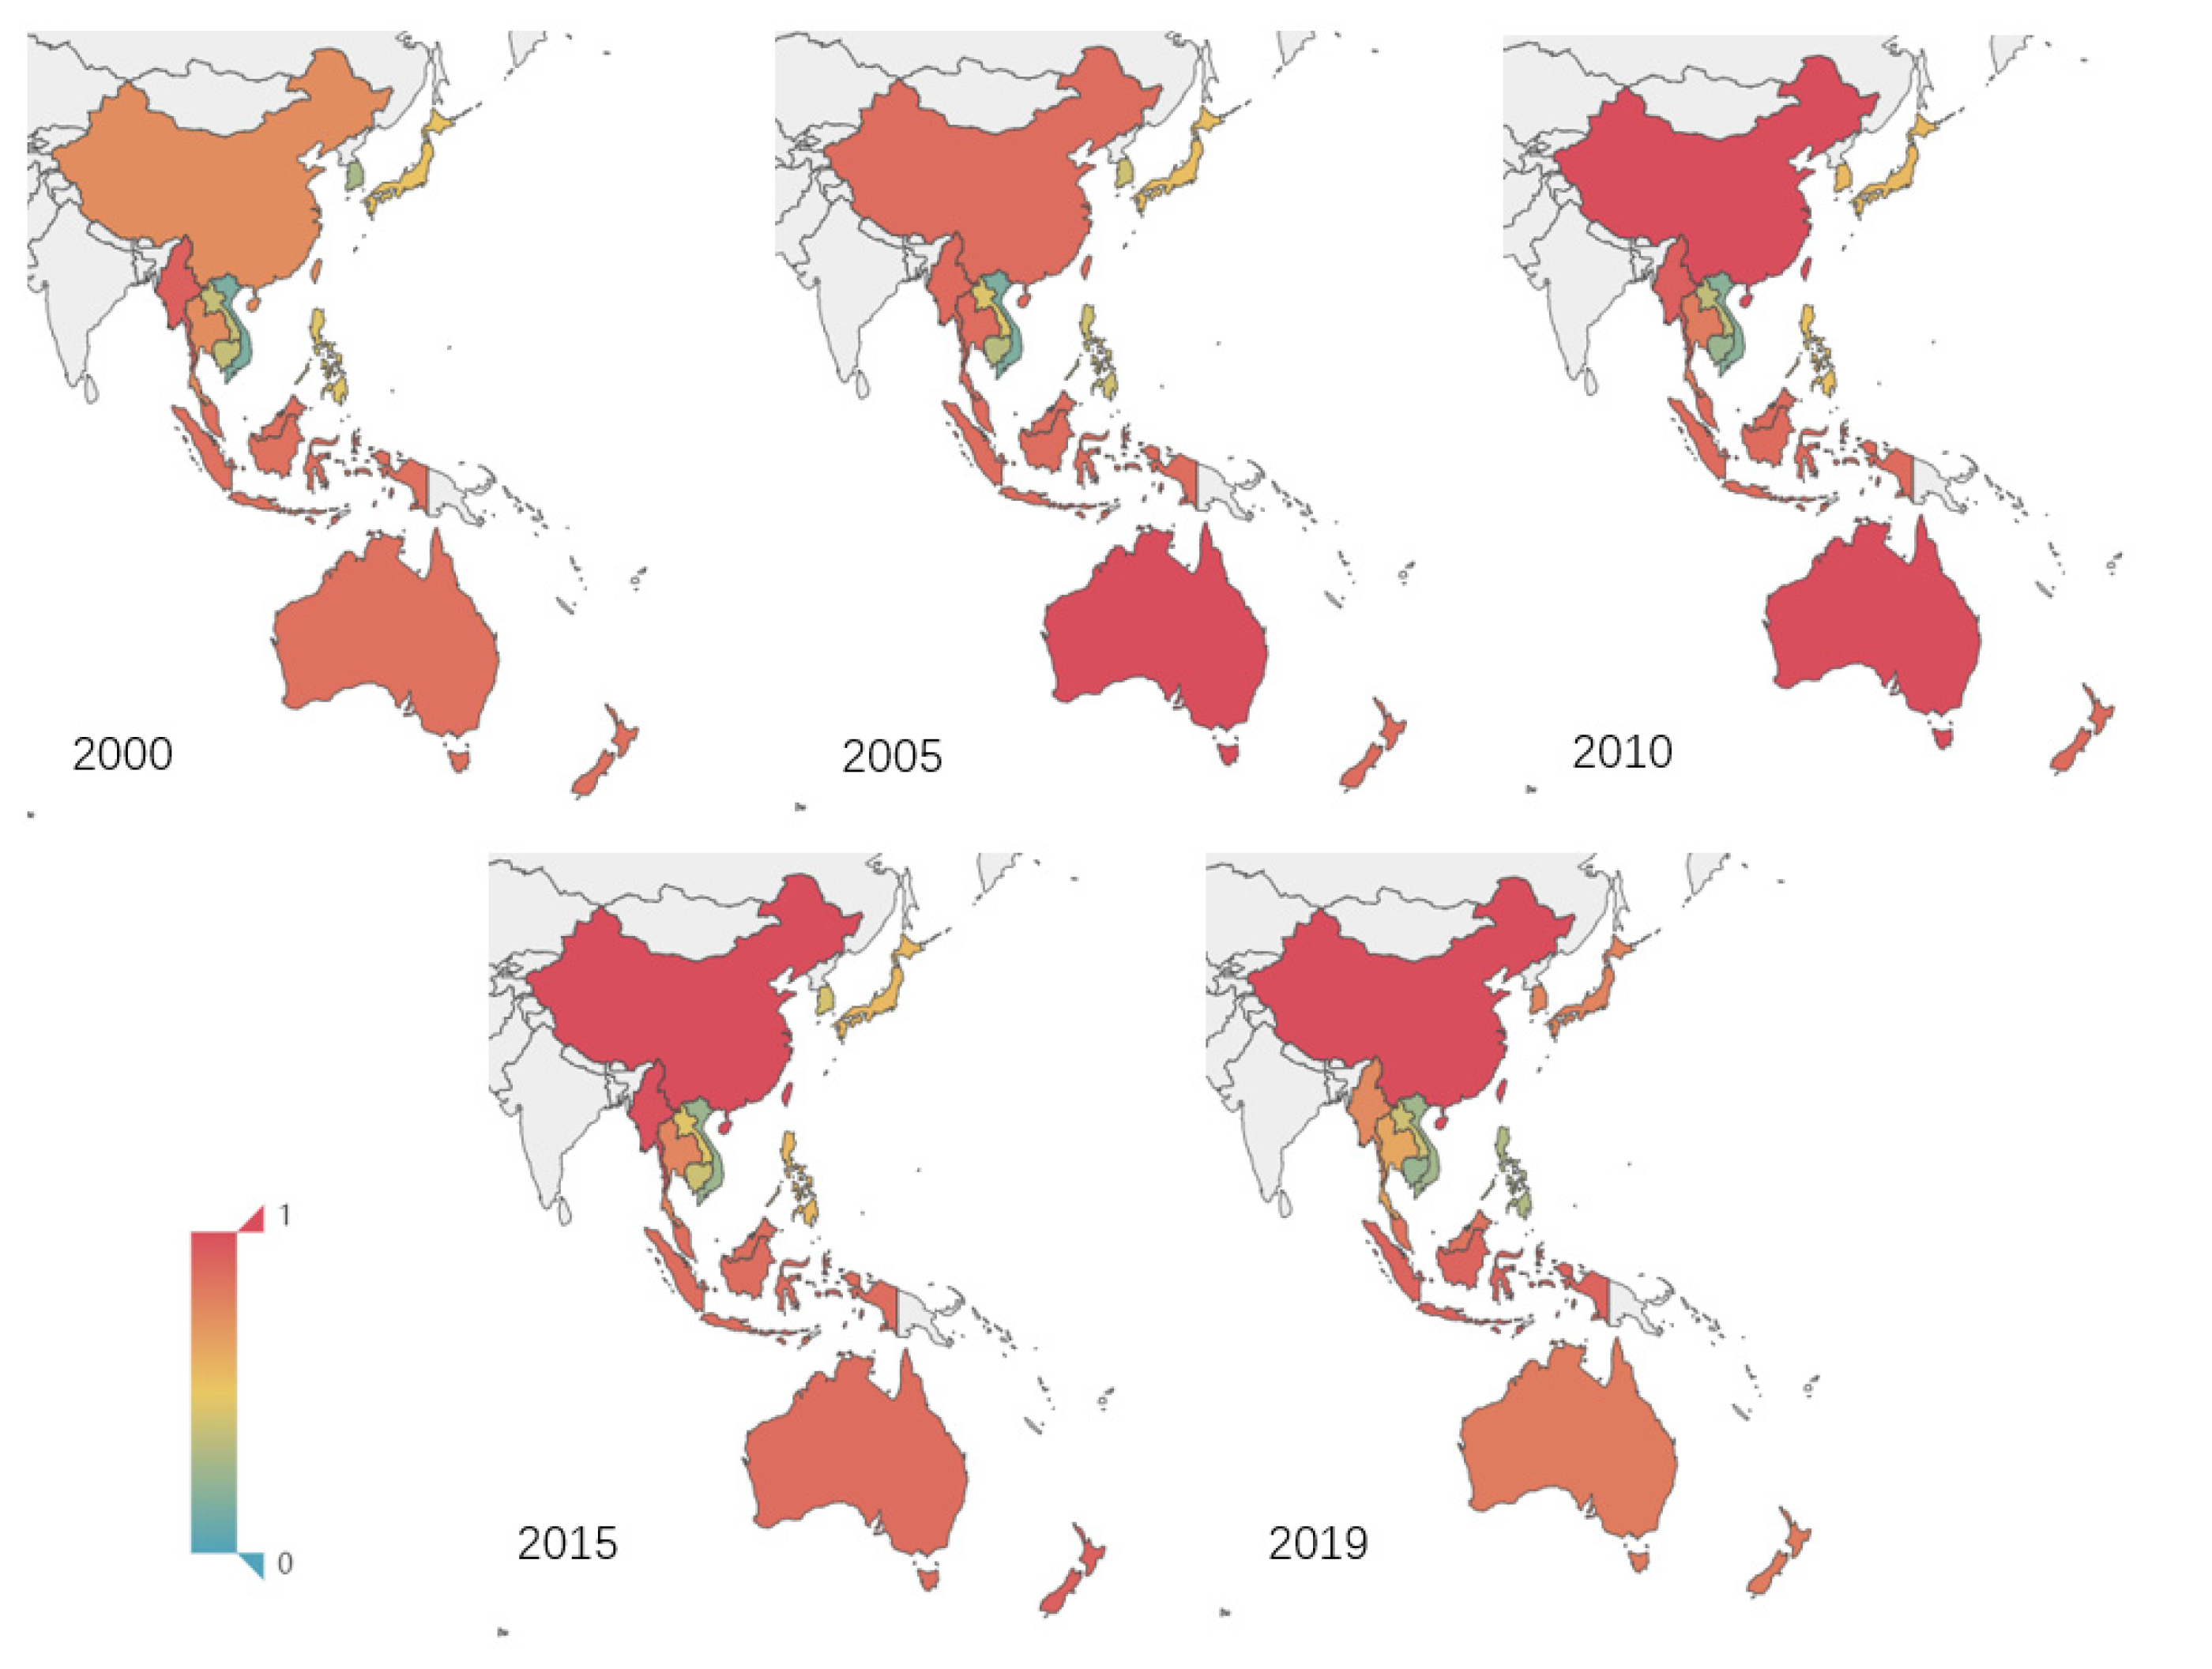
In terms of the dynamic evolution of the network structure, RCEP countries have different structural characteristics and evolution trends in the two networks. The density of both networks is relatively stable, while the average trade value is on the increase in general. The connectivity and diffusion of the networks are strong, and the networks are relatively stable and show a certain agglomeration effect. However, compared with raw material-type products, the product-type products have a larger proportion of the total trade value, and the TN-WFPP has a closer trade relation, stronger reciprocity, and higher clustering coefficient. As for the network centrality, China, Thailand, Japan, and South Korea have maintained a relatively high outdegree centrality and have more export markets in TN-WFPP. The indegree centrality of China, Japan, South Korea, and Vietnam is significantly greater than the outdegree centrality in the TN-WFPM, and they are the net importers of raw material-type forest products, while Myanmar and New Zealand are the net export countries, especially New Zealand, which become the main supplier with the net export scale increasing significantly after 2010. Regarding the coreness of the TN-WFPP, China and Thailand have always been the top two, and the coreness rankings of Indonesia and Vietnam have shown an upward trend, especially after the RCEP negotiation started after 2010. As for the TN-WFPM, the network coreness of China, Japan, and South Korea has increased significantly and China has ranked first since 2010.
In terms of the impact mechanism of the spatial correlations, as we can see in Model 1, cultural, forest_per, forest certification, GDP, GDP_per, and FTA all significantly impact the spatial correlations of the wooden forest product trade network in RCEP countries. However, the above factors have heterogeneous effects on the TN-WFPP and TN-WFPM due to the differences in technology, resource endowment, labor demand, etc. For TN-WFPP, forest certification area, forest resource endowment, and economic proximity significantly affect the formation of trade relations to varying extents. Furthremore, the cultural distance, forest certification area, economic scale, and economic proximity are significantly affecting the formation of trade relations in TN-WFPM. Geographical distance is no longer a factor that hinders the trade of wood-based products in RCEP countries.
Based on the research conclusions above, the paper concludes that cooperation among RCEP countries in the field of wood-based products should be deepened and optimized in the following aspects. Firstly, based on the comparative advantages of various countries in the trade of wood-based products, a closer trading relation should be established with the help of RCEP’s trade facilitation measures. Secondly, cultural similarity has a significant role in promoting the formation of trade ties, therefore RCEP countries should deepen the cooperation on culture, such as to reduce the transaction costs of trade to a certain extent. Thirdly, forest certification plays an obvious role in promoting the trade of wood-based products in RCEP countries, so the countries rich in forest resources should speed up the pace of certification to meet the needs for the legality of timber and improve their own sustainable forest management capabilities at the same time.

Author Contributions

Conceptualization, Y.Z. and B.C.; methodology, Y.Z.; software, Y.Z.; validation, Y.Z.; formal analysis, Y.Z. and B.C.; investigation, Y.Z.; resources, Y.Z. and Y.H.; data curation, Y.H.; writing—original draft preparation, Y.Z.; writing—review and editing, L.X. and B.C.; visualization, Y.Z.; supervision, B.C.; project administration, Y.H.; funding acquisition, B.C. and L.X. All authors have read and agreed to the published version of the manuscript.

Funding

This research was funded by Major Project of National Forestry and Grassland Administration of China (2130237) and National Natural Science Foundation of China (72073012; 71873016; 72003179).

Institutional Review Board Statement

Not applicable.

Informed Consent Statement

Not applicable.

Data Availability Statement

The data were selected from” UN Comtrade Database” at https://comtrade.un.org.cn, (accessed on 1 December 2020) “World Bank Database” at https://data.worldbank.org.cn, (accessed on 1 December 2020) “Food and Agriculture Organization” at http://www.fao.org.cn (accessed on 1 December 2020) and “CEPII Database” at http://www.cepii.fr (accessed on 1 December 2020).

Conflicts of Interest

The authors declare no conflict of interest.

References

  1. Ratna, B.; Jing, H. Regional Comprehensive Economic Partnership (RCEP) FTA: Reducing trade cost through removal of non-tariff measures. Korea World Econ. 2016, 17, 213–242. [Google Scholar]
  2. Mcsweeney, K. Forest product sale as natural insurance: The effects of household characteristics and the nature of shock in eastern Honduras. Soc. Nat. Resour. 2004, 17, 39–56. [Google Scholar] [CrossRef]
  3. Morsello, C.; Ruiz-Mallén, I.; Diaz, M.D.M.; Reyes-García, V. The effects of processing non-timber forest products and trade partnerships on people’s well-being and forest conservation in Amazonian societies. PLoS ONE 2012, 7, 1–15. [Google Scholar] [CrossRef] [PubMed] [Green Version]
  4. Cai, Y.Q.; Liu, C.Y. Research on the export efficiency and potential of China’s forest products to RCEP member countries-From the perspective of Asia-Pacific economic integration. Prices Mon. 2020, 41, 39–46. [Google Scholar]
  5. Selvarajan, S.K.; Ab-Rahim, R. Economic liberalization and its link to convergence: Empirical evidence from RCEP and TPPA countries. Int. J. Bus. Soc. 2017, 18, 439–460. [Google Scholar] [CrossRef]
  6. Bui, C.; Ko, J.; Amekawa, Y.; Isoda, H.; Ito, S. A computable general equilibrium analysis of the potential impacts of TPP/TPP-11 and RCEP on agriculture in Vietnam. J. Fac. Agric. Kyushu Univ. 2018, 63, 169–175. [Google Scholar] [CrossRef]
  7. Ko, J. RCEP vs. TPP: Which one would be more beneficial to Korea economically? Int. J. Trade Commer. 2015, 11, 51–70. [Google Scholar]
  8. Zainuddin, M.; Sarmidi, T.; Khalid, N. Sustainable production, non-tariff measures, and trade performance in RCEP countries. Sustainability 2020, 12, 9969. [Google Scholar] [CrossRef]
  9. Erokhin, V.; Gao, T.; Ivolga, A. Cross-country potentials and advantages in trade in fish and seafood products in the RCEP member states. Sustainability 2021, 13, 3668. [Google Scholar] [CrossRef]
  10. Yang, J.; Yang, Y.N.; Cheng, B.D. Analysis on three margins and trade potential of chinese wooden Products to RCEP memberships. Iss. For. Econ. 2018, 38, 85–92. [Google Scholar]
  11. Zhou, M.; Wu, G.; Xu, H.L. Structure and formation of top networks in international trade, 2001–2010. Soc. Netw. 2016, 44, 9–21. [Google Scholar] [CrossRef]
  12. Holl, A. Production networks and industrial clusters: Integrating economies in southeast Asia edited by Ikuo Kuroiwa and Toh Mun Heng. J. Reg. Sci. 2010, 50, 896–898. [Google Scholar] [CrossRef]
  13. Yao, Y.L.; Li, T. The international trade network and structural evolution of G20. J. Int. Econ. 2014, 30, 42–50. [Google Scholar]
  14. Li, J.; Chen, N.; Wan, G.H.; Chen, S. Competitive complementarity and dynamic changes of goods trade in countries along the “Belt and Road”- based on network analysis method. Manag. World 2017, 4, 10–19. [Google Scholar]
  15. Xu, H.L.; Sun, T.Y.; Cheng, L.H. Trade patterns and influence factors of high-end manufacturing on “One Belt and One Road”- a study based on the Exponential Random Graph Models. Financ. Trade Econ. 2015, 12, 74–88. [Google Scholar]
  16. Ma, S.Z.; Ren, W.W.; Wu, G.J. The characteristics of agricultural trade network and its effects on the global value chain division: A study based on social network analysis. Manag. World 2016, 3, 60–72. [Google Scholar]
  17. Sergaki, P. The role of networks on the competitiveness of agricultural cooperatives and small–medium enterprises along the supply chain in Greece. Acta Agric. Scand. 2010, 7, 180–191. [Google Scholar] [CrossRef]
  18. Liang, S.; Feng, Y.; Xu, M. Structure of the global virtual carbon network: Revealing important sectors and communities for emission reduction. J. Ind. Ecol. 2015, 19, 307–320. [Google Scholar] [CrossRef]
  19. Natthapong, S.; Suriyapraphadilik, U.; Siemanond, K.; Quaglia, A.; Gani, R. Industrial wastewater treatment network based on recycling and rerouting strategies for retrofit design schemes. J. Clean. Prod. 2016, 111, 231–252. [Google Scholar]
  20. Chen, Z.; An, H.; An, F.; Guan, Q.; Hao, X. Structural risk evaluation of global gas trade by a network-based dynamics simulation model. Energy 2018, 159, 457–471. [Google Scholar] [CrossRef]
  21. Liu, L.Q.; Yan, X.F.; Yang, S.L.; Song, M. Research on the evolution and endogenous mechanism of international trade dependence network. China Ind. Econ. 2021, 39, 98–116. [Google Scholar]
  22. Wan, L.; Cheng, B.D. The Asia-Pacific regional pattern and development trend of China’s forest products trade. Intertrade 2017, 36, 29–36. [Google Scholar]
  23. Brass, D.J.; Galaskiewicz, J.; Greve, H.R.; Tsai, W.P. Taking stock of networks and organizations: A multilevel perspective. Acad. Manag. J. 2004, 47, 795–817. [Google Scholar]
  24. Cheng, B.D.; Li, F.F.; Wan, L. Promoting High-Quality Development of Forest Products Trade between China and the Belt and Road Cooperation Countries, 1st ed.; Social Sciences Academic Press(CHINA): Beijing, China, 2021; pp. 67–102. [Google Scholar]
  25. Knoke, D.; Wasserman, S.; Faust, K. Social Network Analysis: Methods and Applications. Cont. Sociol 1996, 25, 275–276. [Google Scholar] [CrossRef]
  26. Freeman, L.C. Centrality in social networks: Conceptual clarification. Soc. Netw. 1979, 1, 215–239. [Google Scholar] [CrossRef] [Green Version]
  27. Cantner, U.; Graf, H. The network of innovators in Jena: An application of social network analysis. Res. Policy 2006, 35, 463–480. [Google Scholar] [CrossRef]
  28. Benlic, U.; Hao, J.-K. Breakout local search for the quadratic assignment problem. Appl. Math. Comput. 2013, 219, 4800–4815. [Google Scholar] [CrossRef] [Green Version]
  29. Krackardt, D. QAP partialling as a test of spuriousness. Soc. Netw. 1987, 9, 171–186. [Google Scholar] [CrossRef]
  30. Hasson, J.A.; Tinbergen, J. Shaping the world economy: Suggestions for an international cconomic policy. Economica 1964, 31, 327. [Google Scholar] [CrossRef] [Green Version]
  31. Flowerdew, R.; Aitkin, M. A method of fitting the gravity model based on the poisson distribution. J. Reg. Sci. 2010, 22, 191–202. [Google Scholar] [CrossRef]
  32. Hofstede, G.J.; Jonker, C.M.; Meijer, S.; Verwaart, T. Modelling trade and trust across cultures. Int. Conf. Trust Manag. 2006, 3986, 120–134. [Google Scholar]
  33. Zhou, M. Intensification of geo-cultural homophily in global trade: Evidence from the gravity model. Soc. Sci. Res. 2011, 40, 193–209. [Google Scholar] [CrossRef]
  34. Tian, H.; Jiang, C.C. Effect of national cultural distance on China’s foreign trade: Data analysis of 31 countries and regions’ trade based on gravity model. J. Int. Trade 2012, 38, 45–52. [Google Scholar]
  35. Chen, J.; Wang, L.; Li, L.; Magalhes, J.; Sun, Y. Effect of forest certification on international trade in forest products. Forests 2020, 11, 1270. [Google Scholar] [CrossRef]
  36. Yao, X.; Rizwana, Y.; Li, Y.N.; Muhammad, H.; Ihtsham, U.H.P. Free trade agreements and environment for sustainable development: A gravity model analysis. Sustainability 2019, 11, 597. [Google Scholar] [CrossRef] [Green Version]
  37. Duan, D.Z.; Du, D.B. Structural evolution of global high-tech trade system: Products, networks and influencing factors. Acta Geogr. Sin. 2020, 87, 2759–2776. [Google Scholar]
  38. Niu, H.; Lan, S.; Ma, Y.X. The dynamic evolution and influence mechanism of services trade network structure along “The belt and road”. Int. Bus. Rev. 2020, 34, 78–93. [Google Scholar]
  39. Jesse, C.S. Market formation as transitive closure: The evolving pattern of trade in music. Netw. Sci. 2016, 4, 164–187. [Google Scholar]
  40. Wang, C.; Huang, X.; Lim, M.K.; Tseng, M.L.; Ghadimi, P. Mapping the structural evolution in the global scrap copper trade network. J. Clean Prod. 2020, 275, 122934. [Google Scholar] [CrossRef]
  41. Borgatti, S.P.; Everett, M.G. Models of core/periphery structures. Soc. Netw. 1999, 21, 375–395. [Google Scholar] [CrossRef]
  42. Han, D.; Li, G.S. Research on the evolution and the influence mechanism of grain trade pattern between China and countries along “The belt and road”: From the perspective of social network. Iss. Agric. Econ. 2020, 41, 24–40. [Google Scholar]
  43. Anderson, J.E. The Gravity Model. Annu. Rev. Econ. 2011, 3, 133–160. [Google Scholar] [CrossRef] [Green Version]
  44. Ghazalian, P.L. On the magnitude of the geographic distance effect on primary agricultural and processed food trade. Agribusiness 2015, 31, 148–170. [Google Scholar] [CrossRef]
Figure 1. (a) Wood-based products import scale of RCEP countries from 2000 to 2019 (units: US billion dollars); (b) wood-based products and export scale of RCEP countries from 2000 to 2019 (units: US billion dollars).
Sustainability 13 10063 g001
Figure 2. (a) Evolution of the overall network characteristics; (b) reciprocity and clustering of the networks.
Sustainability 13 10063 g002
Figure 3. The centrality evolution of TN-WFPP in RCEP countries from 2000 to 2019.
Sustainability 13 10063 g003
Figure 4. The centrality evolution of TN-WFPM in RCEP countries from 2000 to 2019.
Sustainability 13 10063 g004
Figure 5. The evolution of the coreness of TN-WFPP from 2000 to 2019.
Sustainability 13 10063 g005
Figure 6. The evolution of the coreness of TN-WFPM from 2000 to 2019.
Sustainability 13 10063 g006
Table 1. QAP correlation analysis results.
VariableActual Correlation Coefficientp-ValueStandard DeviationMinimum ValueMaximum Valuep ≥ 0p ≤ 0
FTA0.2350.0650.173−0.4200.4280.0650.935
language0.2060.0690.115−0.1480.4680.0690.931
distance0.1320.1700.168−0.3540.5070.1700.830
Forest_per0.1690.0800.194−0.2310.6240.0800.920
certification0.2020.0200.116−0.3410.2530.0200.980
GDP_per−0.0880.1440.083−0.2130.2550.8560.144
GDP0.2880.0320.139−0.3240.4340.0320.968
Table 2. QAP regression analysis results.
Model 1Model 2Model 3
VariablesUSCSCp-ValueUSCSCp-ValueUSCSCp-Value
Intercept−4.83620.0000 0.0831 0.0000 –0.3485 0.0000
language2.59610.1621 *0.06500.5090 0.04090.26001.0949 0.1223 *0.0690
Distance0.78210.05930.29201.1072 0.10780.2110–0.0914 −0.01240.4310
certification0.40510.2049 **0.0110−0.2968 −0.1930 **0.01800.1557 0.1408 **0.0260
forest per0.00300.1652 *0.0950−0.0030 −0.2100 *0.08600.0002 0.02320.3260
GDP1.76760.2620 **0.0110−0.3591 −0.06840.3140–0.6692 −0.1173 **0.0220
GDP per−0.9285−0.0910 *0.0950−0.7945 −0.1000 *0.09300.8841 0.2344 ***0.0080
FTA0.37640.1962 **0.0480−0.0460 −0.03080.40100.0611 0.05690.2860
Note: * p < 0.1, ** p < 0.05, *** p < 0.01 USC means the un-standardization coefficient and SC means the standardization coefficient.
Publisher’s Note: MDPI stays neutral with regard to jurisdictional claims in published maps and institutional affiliations.

