Article

Analysis of Reasons for the Structural Collapse of Historic Buildings

Faculty of Civil Engineering, Silesian University of Technology, Akademicka 5, 44-100 Gliwice, Poland
*
Author to whom correspondence should be addressed.
Sustainability 2021, 13(18), 10058; https://doi.org/10.3390/su131810058
Submission received: 12 July 2021 / Revised: 1 September 2021 / Accepted: 4 September 2021 / Published: 8 September 2021
(This article belongs to the Special Issue Renovation of Buildings and Modernization of Built Areas)

Abstract

:
Each historic building or cultural heritage site requires proper care at every stage of its life cycle. Appropriate interventions aim to prevent building disasters and preserve invaluable cultural objects from ageing or deterioration processes. This article is a case study of mistakes made in various phases of a building’s life—in the design, execution, and use. The work aims to point out various aspects of the errors made during the building’s restoration. The conducted material research, computational analyses, laboratory tests, and documentation studies comprehensively consider the presented examples. The structural analysis of the buildings consists of its load-bearing capacity and its stability.

1. Introduction

Cultural heritage is essential in the lives and activity of people. It is the material and spiritual legacy of earlier generations, and contains the history of interactions between people and their surroundings over the centuries. Historic buildings are justifiably regarded as cultural heritage. The improper maintenance and management of such buildings threaten cultural heritage and public safety [1,2,3]. Errors are made in both the design and restoration stages, as well as during the building’s operation. The non-performance of retrofit works is an essential factor in the degradation of buildings [3,4,5]. The non-performance of repair works can threaten the load-carrying capacity of the structure, which poses a risk to users of buildings. The proper maintenance of historic buildings requires experience, interdisciplinary knowledge, and skills in planning repair works [3,6,7].
Residential buildings, institutional facilities and production buildings in the 18th, 19th, and 20th centuries were usually erected in Central Europe as masonry buildings. They were made of clay brick or stone, built on stone or ceramic foundations, with floors structured as vaults or segmental vaults supported on steel beams over cellars and timber-framed floors at higher levels [8,9]. The most common were timber roof truss systems. Cracks in masonry structures, the corrosion of steel elements, and timber biodegradation pose a risk to such structures. Single cracks in masonry structures usually do not present hazards [10]; however, more cracks reduce spatial rigidity and cause severe damage [11,12,13]. Damage to vaults in loose masonry units and loss in joints are often observed, and require regular repairs [14,15,16]. It is difficult to eliminate the corrosion of steel beams in sectional arched ceilings, and this often leads to severe damage.
On the other hand, the floor often has to be replaced with a mass structure (e.g., reinforced concrete ribbed floor system) due to timber biodegradation. However, such a solution can change the load arrangement and stress state in walls (Figure 1), which can also cause severe damage [1]. The temporary removal of the ceiling (which is most often made of wooden beams supported by the wall) causes the curvature of the stress trajectory towards the wall’s outer edge (Figure 1a). The mounting void should be appropriately secured during the works. Building new ceilings is associated with high compressive stresses below the abutment point of the ceiling (Figure 1b). In this case, it is necessary to construct the ceiling support properly and spread the pressure over a larger area. However, if the reconstructed buildings are located in seismic areas, there is a risk of punching shear, where the partially supported ceiling knocks down the wall (Figure 1c).
Non-destructive or minor-destructive methods are beneficial when analyzing the technical conditions of historic buildings. Radar, ultrasonic, and penetrometer methods are often used to determine structure discontinuities and material strength [17,18,19,20,21,22]. However, minor destructive (e.g., flat jack) or destructive testing methods are the most suitable for determining masonry strength. Destructive methods involve masonry units and mortar samples being tested in the testing machine [23,24]. Masonry strength can be calculated by testing masonry units using the exponential equation specified in the standard EN-1996-1-1 [25]. For historic buildings, it is recommended to use additional factors that consider the conditions of the masonry wall [24,26]. This additional correction factor is usually approximately 0.4–0.8.
The reasons for the damage and structural collapse of historic buildings vary, and they have to be examined each time to prevent them and mitigate their consequences [3,27]. This paper analyzes three cases of structural collapse in historic buildings. These cases show how a slight violation of structural and maintenance requirements might lead to a partial collapse of the construction. The presented case studies describe an often-overlooked aspect of the renovation work stage (cases 1 and 2). The third case shows how the regular operation of the facility without proper maintenance may lead to a collapse of the ceiling. The selected cases are intended to highlight an essential aspect of the structural features of the construction. To determine the causes of damage, material and macroscopic tests were performed, along with structural calculation analyses.

2. The Structural Collapse Induced by Faulty Design

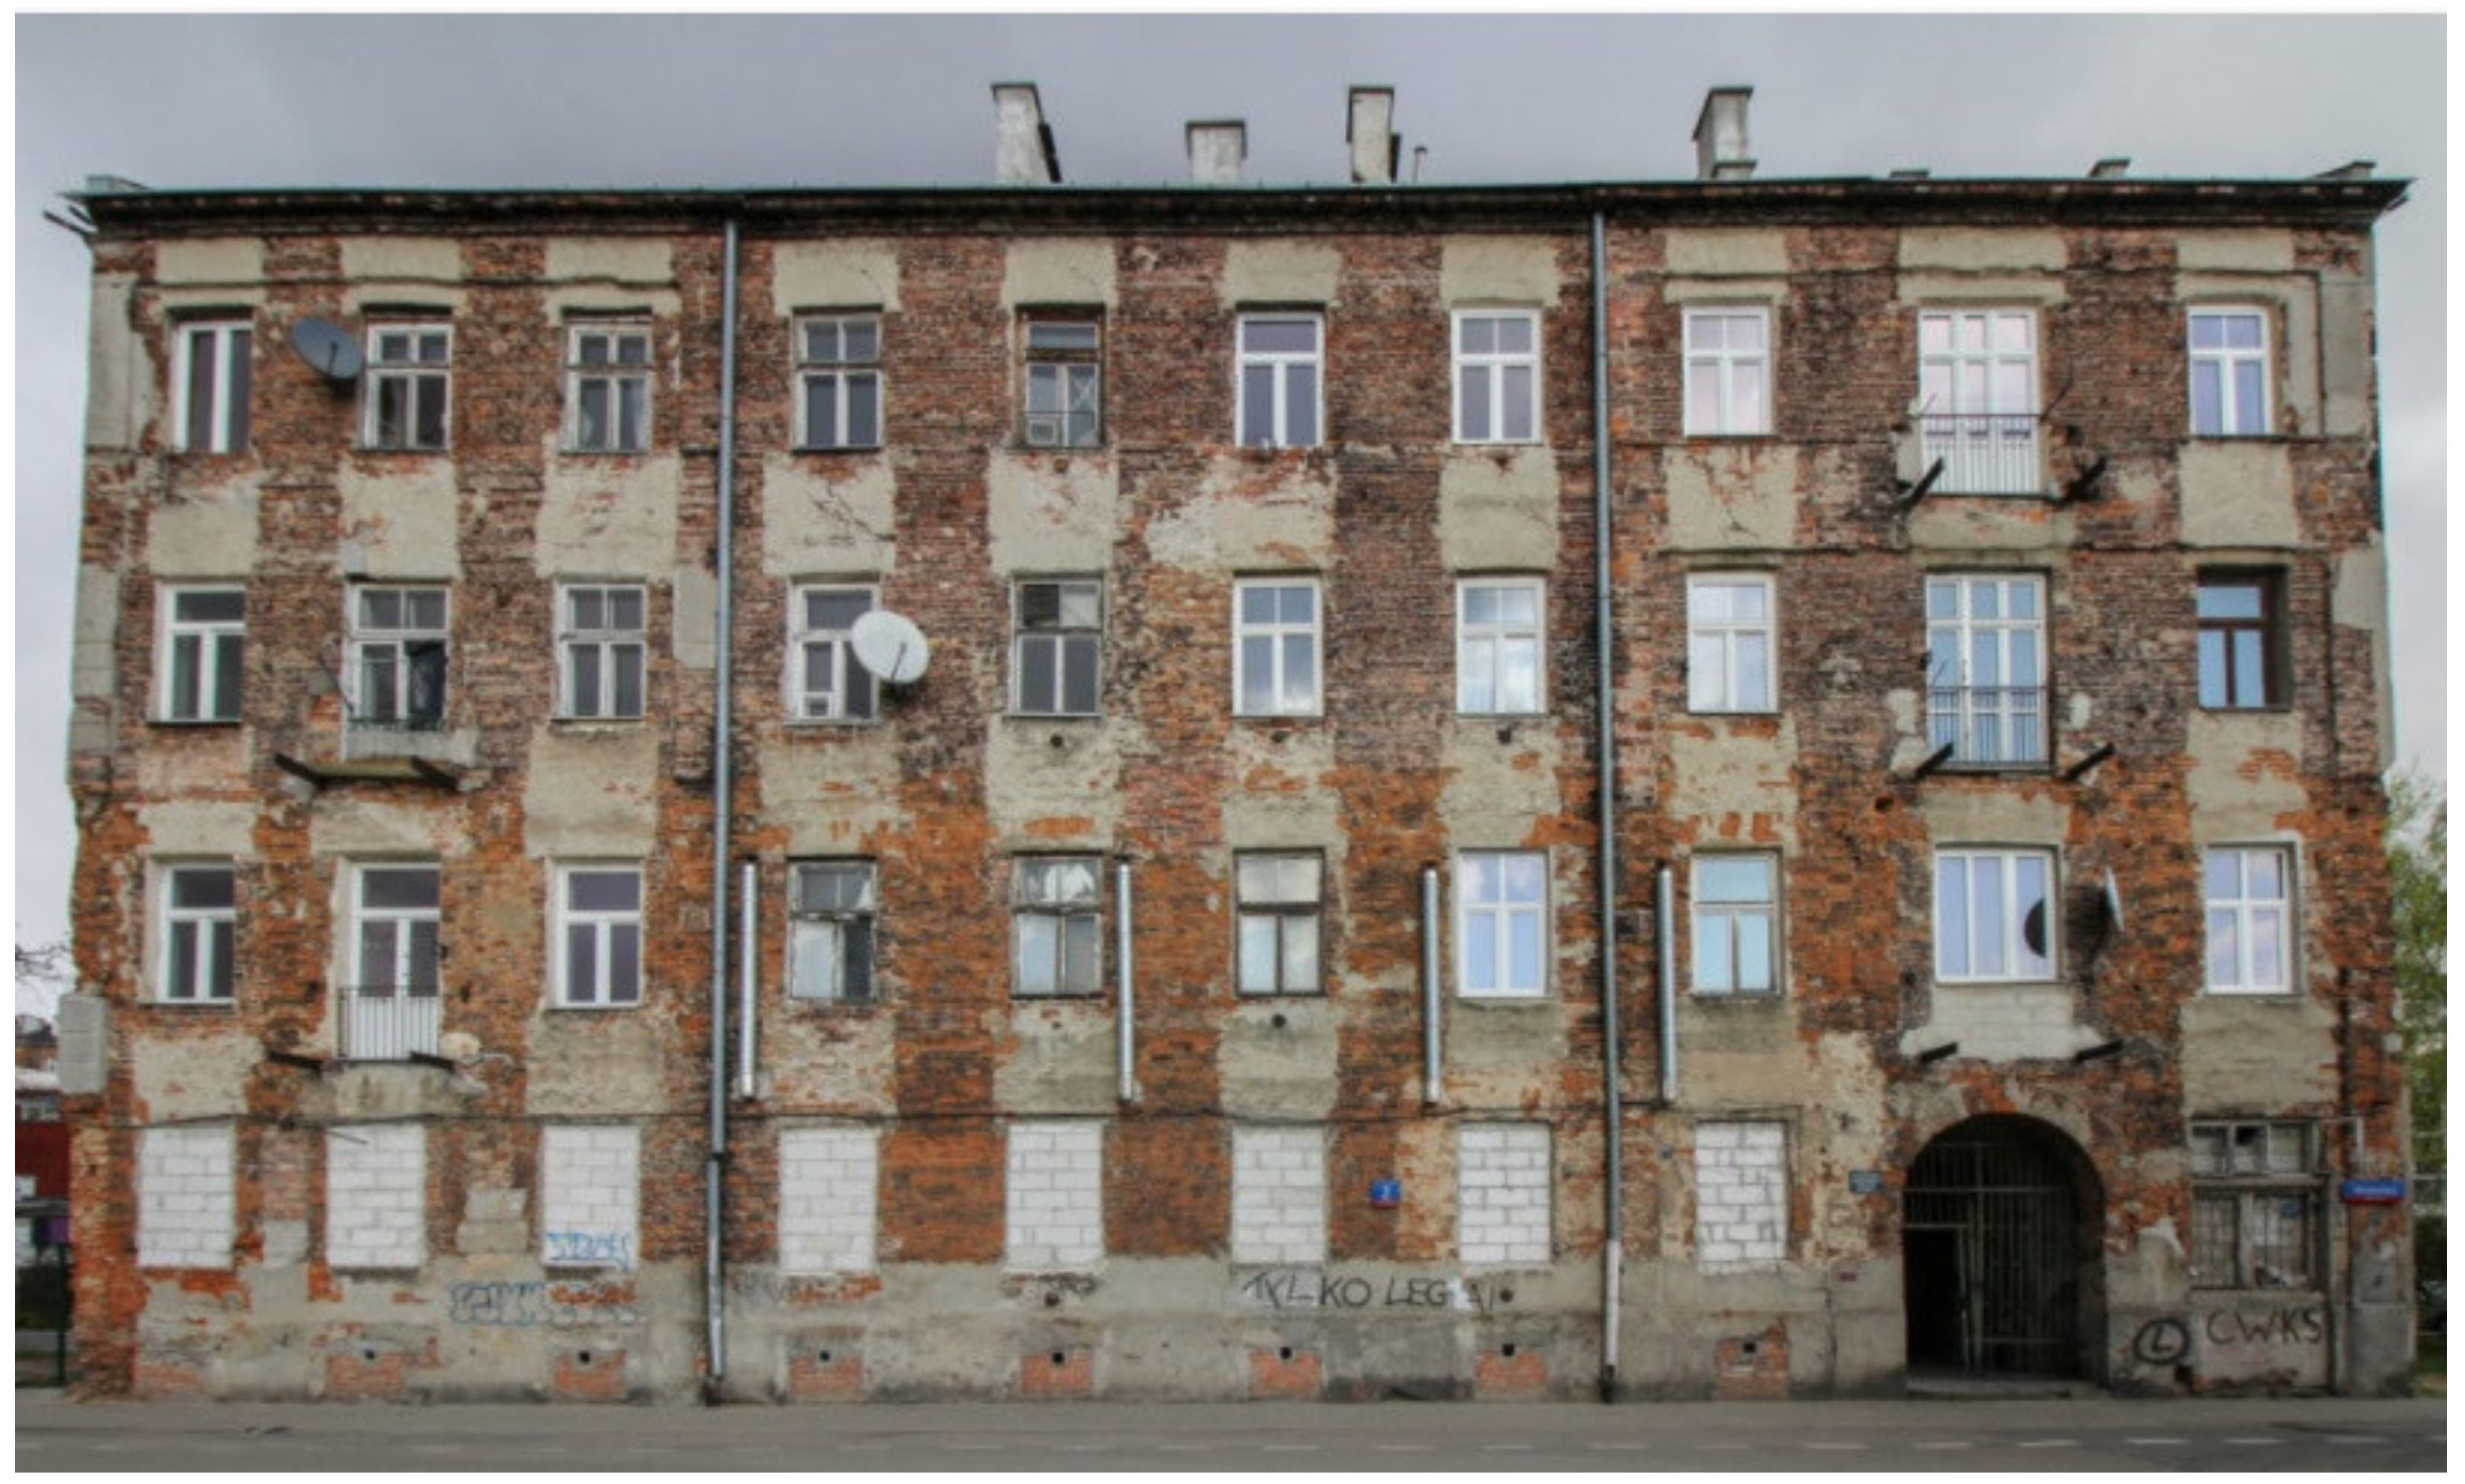
2.1. Description of the Building

This collapse occurred during the renovation of Dietrichstein Palace, located at Wilhelm Kubsz 2 Street in Wodzisław Śląski. This Palace replaced an earlier castle. The building, erected in 1744–1747, was set on an elongated rectangular plane of 52.8 × 17.4 m. It was built in the classical French Baroque style. Built by the Moravian architect Francis Anton Grimme (1710–1784), the Palace is thought to be the first example of a classical building in Poland. An archive photo of the building is shown in Figure 2. It is a two-story, plastered masonry building with a symmetrical 15-axial façade. A cornice separates the ground floor. The windows are framed with beams above them. The avant-corps ends with a triangular abutment with a heraldic cartouche. The portal is a closed semi-circle, flanked with duplex pilasters that support the broken entablature. The park-side façade is 11-axial, and the avant-corps is separated with grooved pilaster strips, topped with a triangular abutment with oculus. The gable and pyramidal roof is covered with tiles.

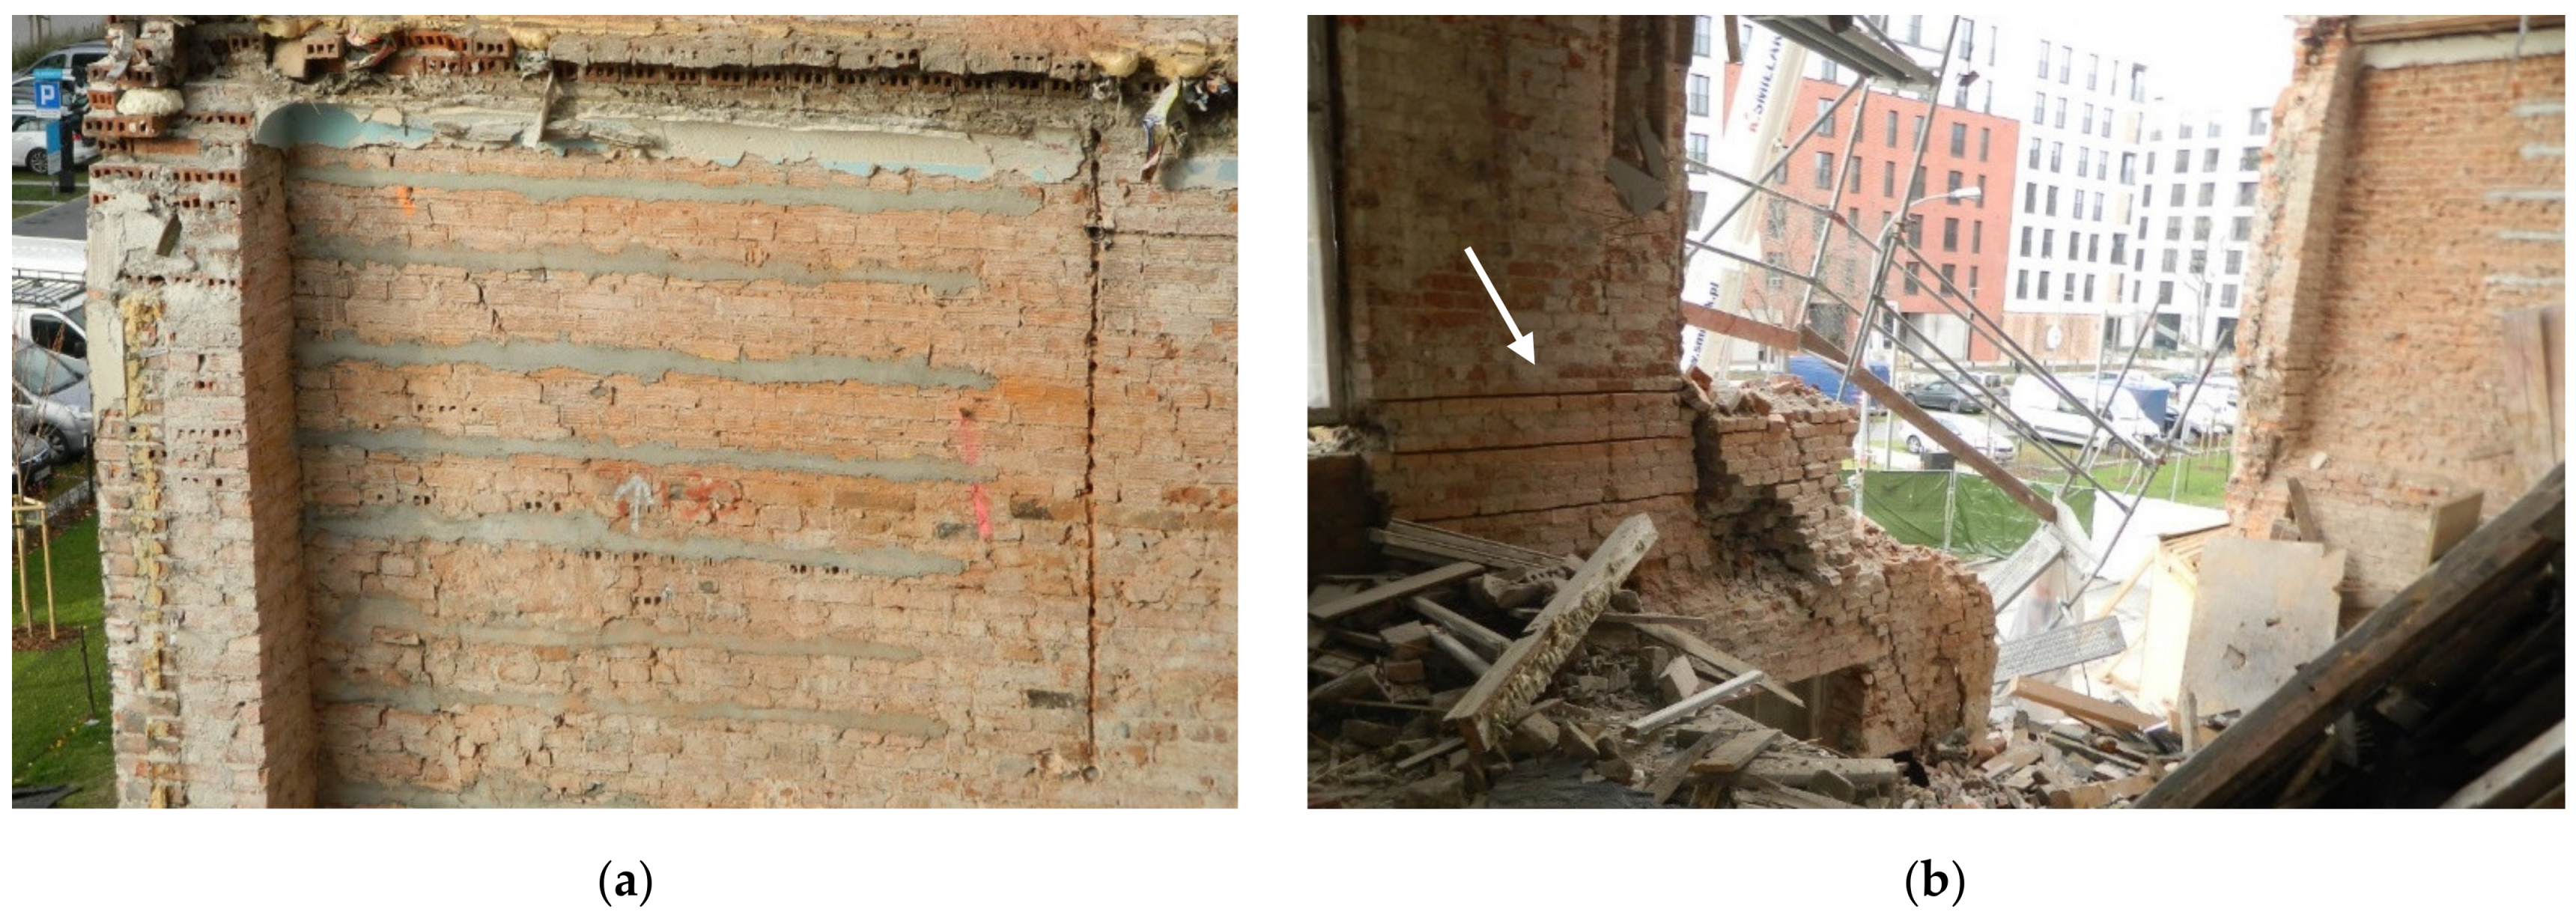
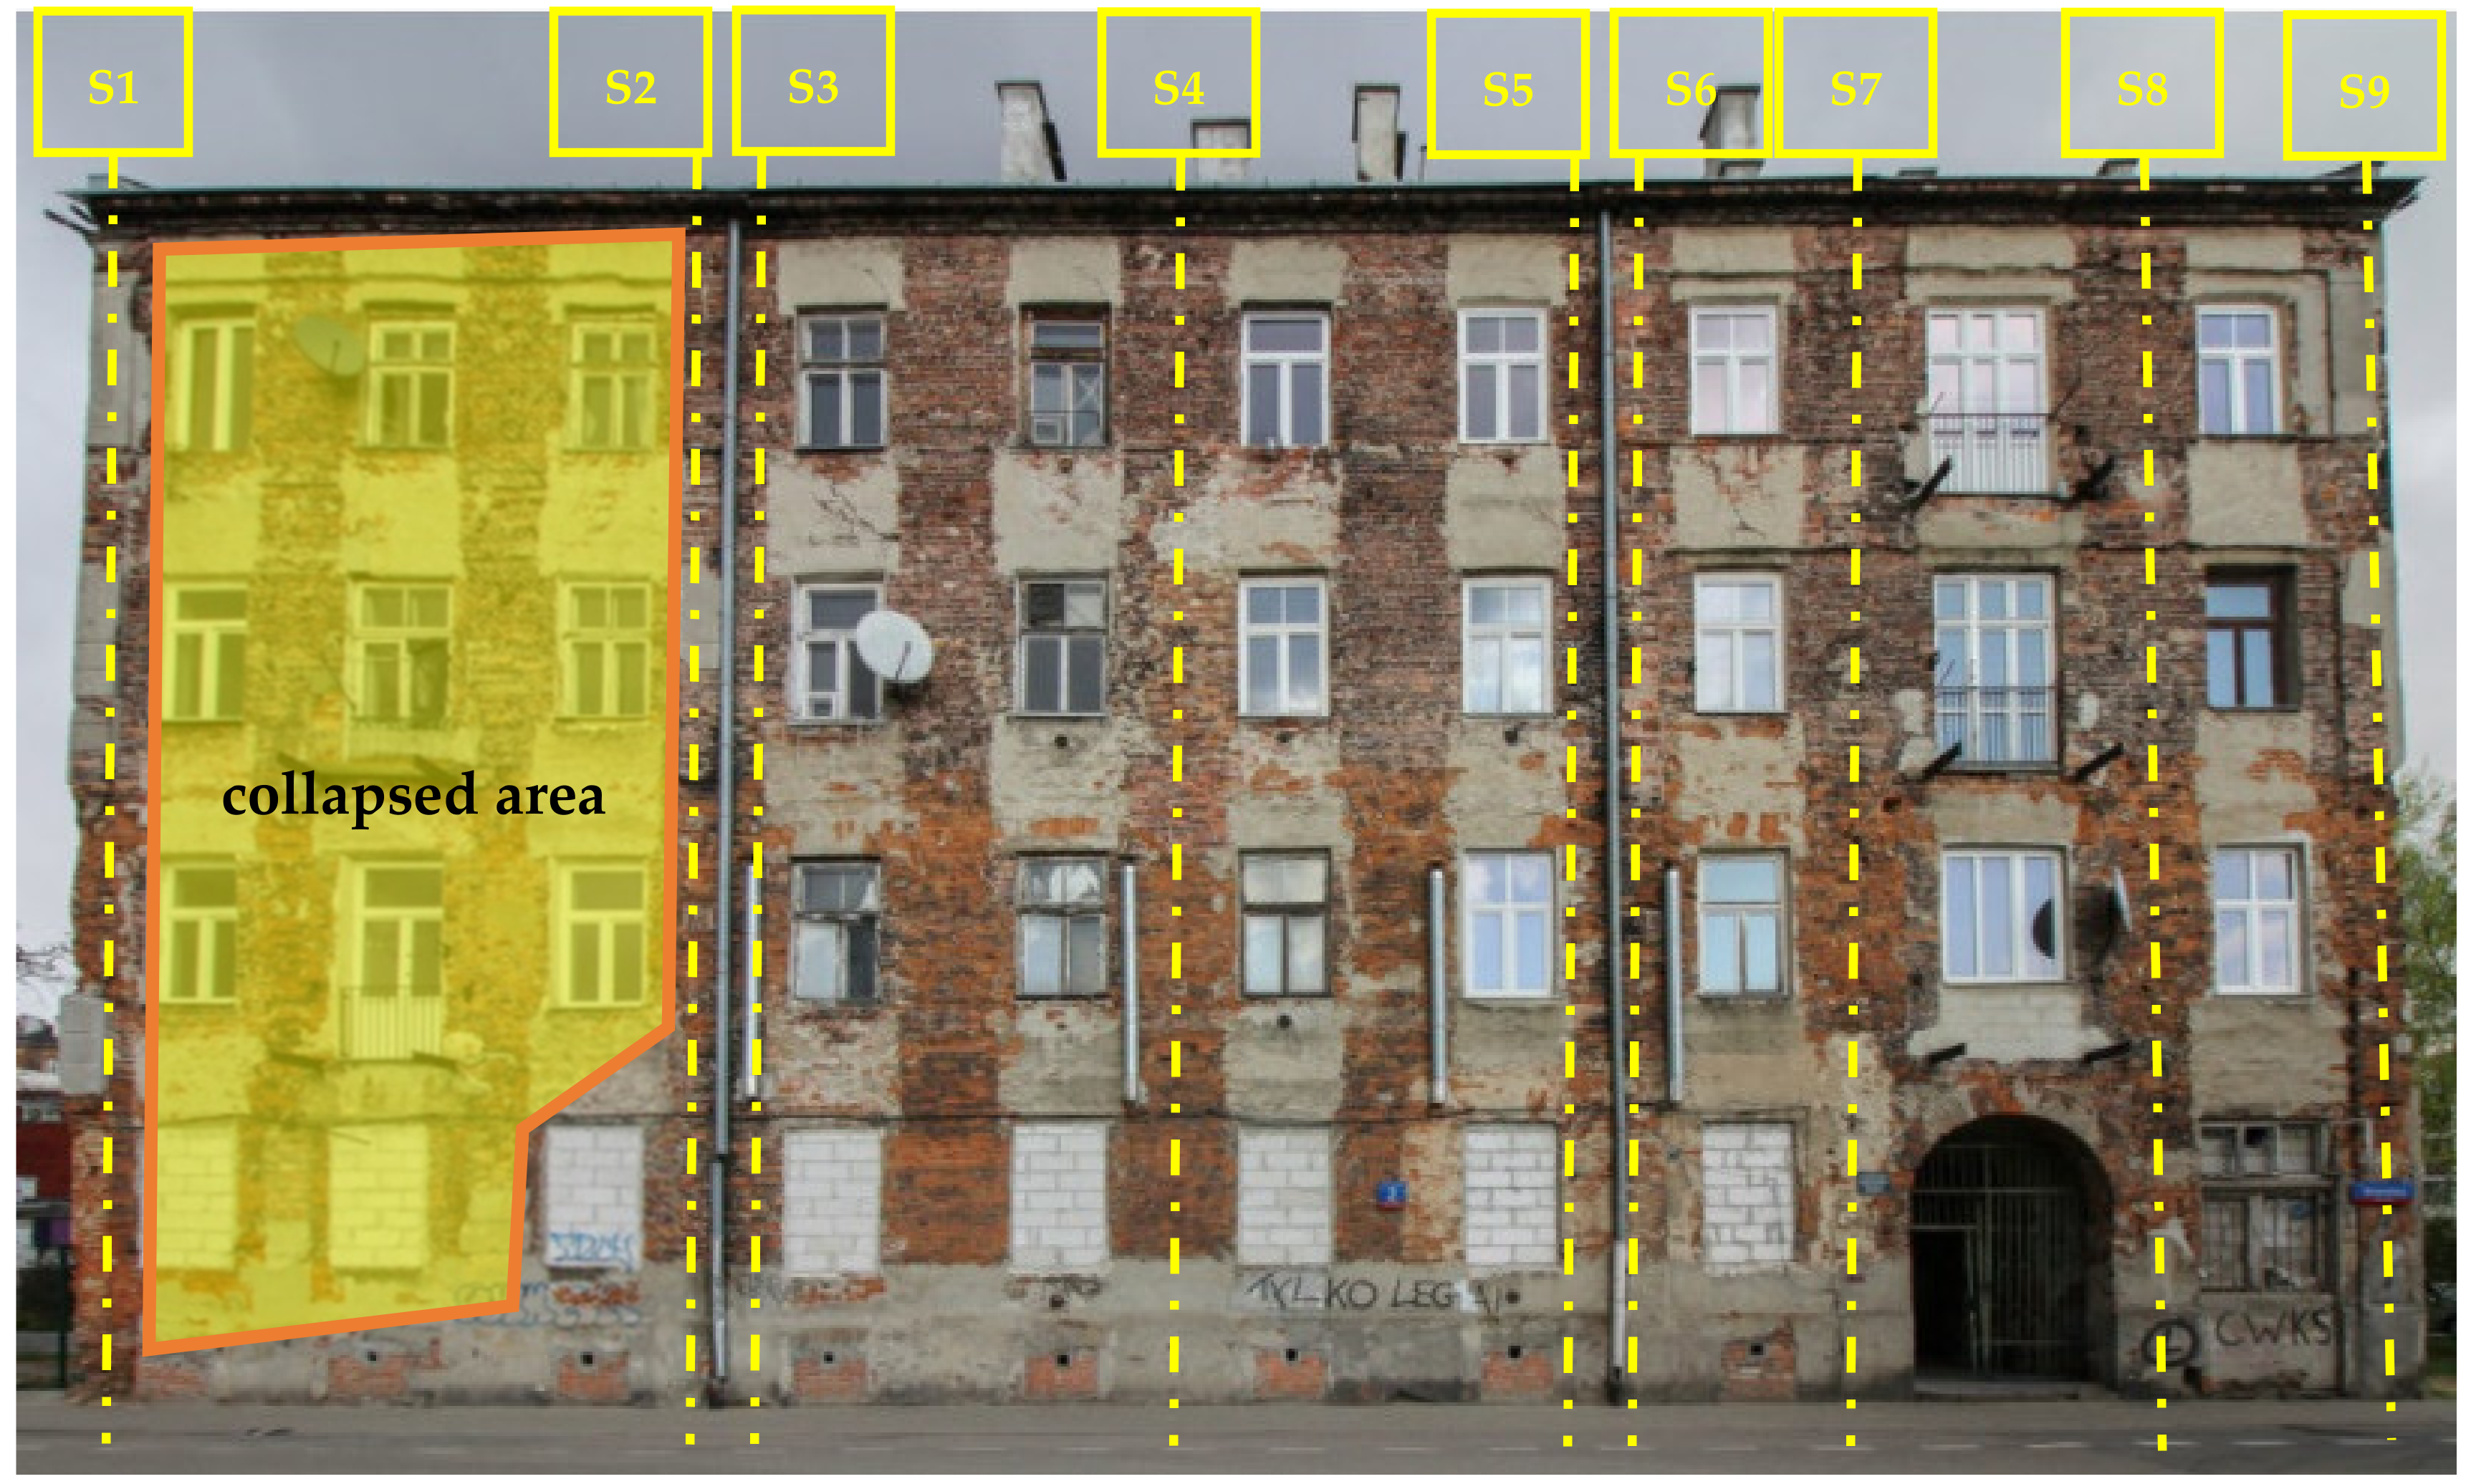
2.2. Structural Collapse

Renovation works in the Palace began in September 2018. On 19 August 2019, at ca. 2 p.m., the cornice broke at the north-east side of the front façade, and then a 50-m-high scaffold at the front façade collapsed under its own weight. Two workers from the construction company were injured. The collapsed scaffold blocked the road and the square in front of the Palace and damaged three parked cars. Photographs of the collapse are presented in Figure 3 and Figure 4.

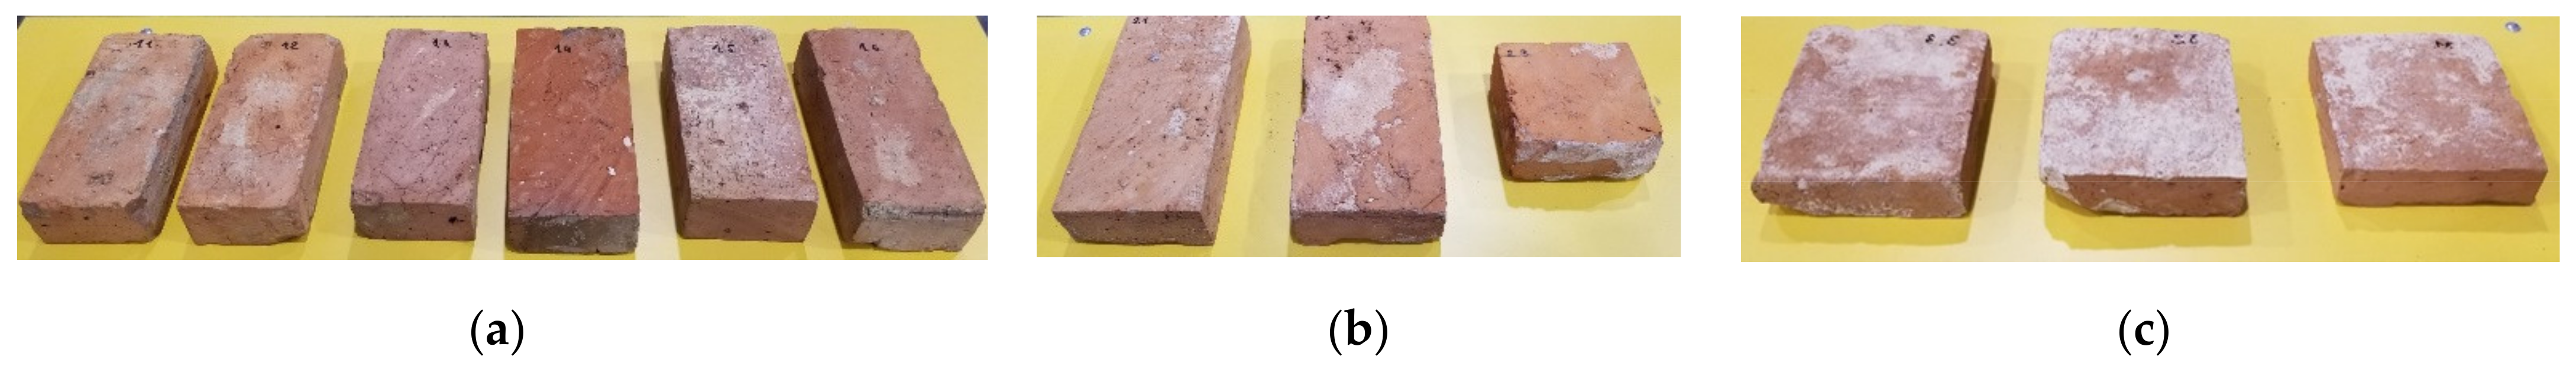
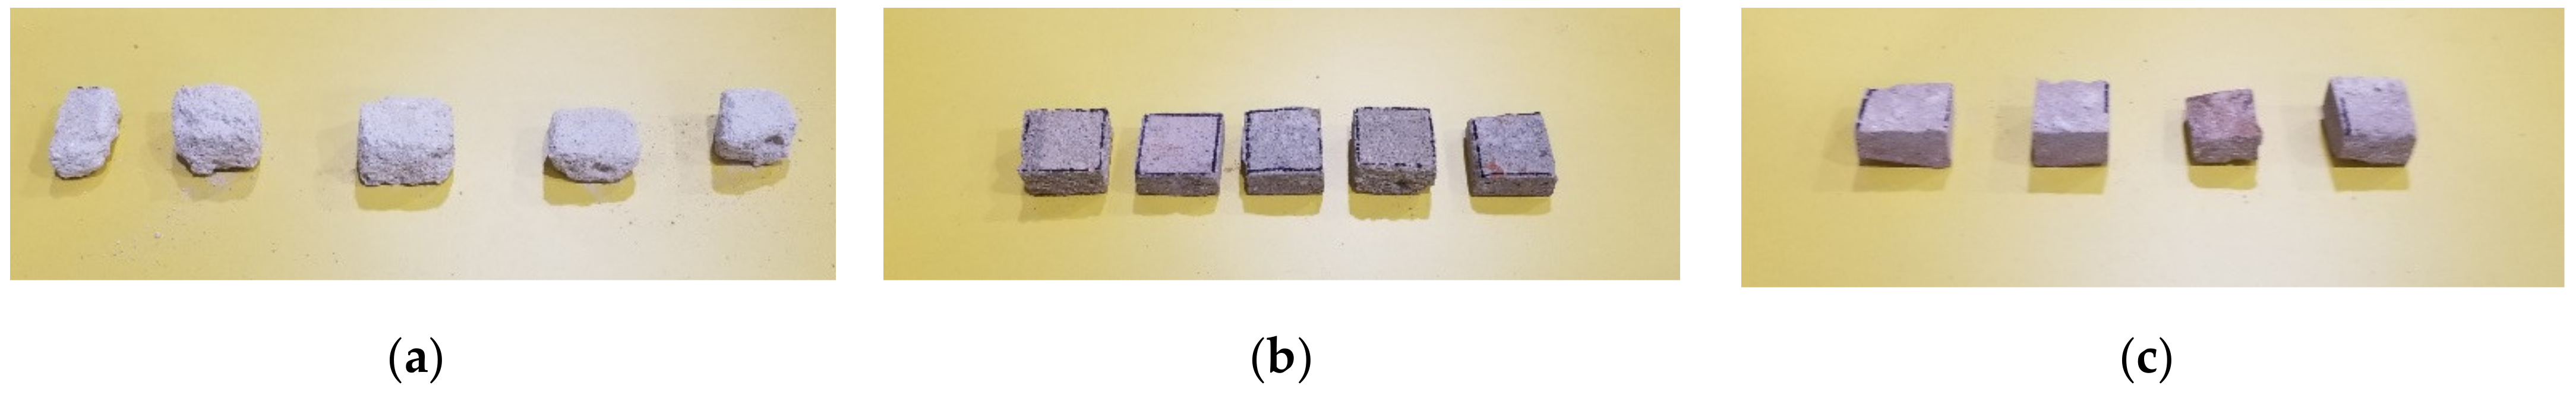
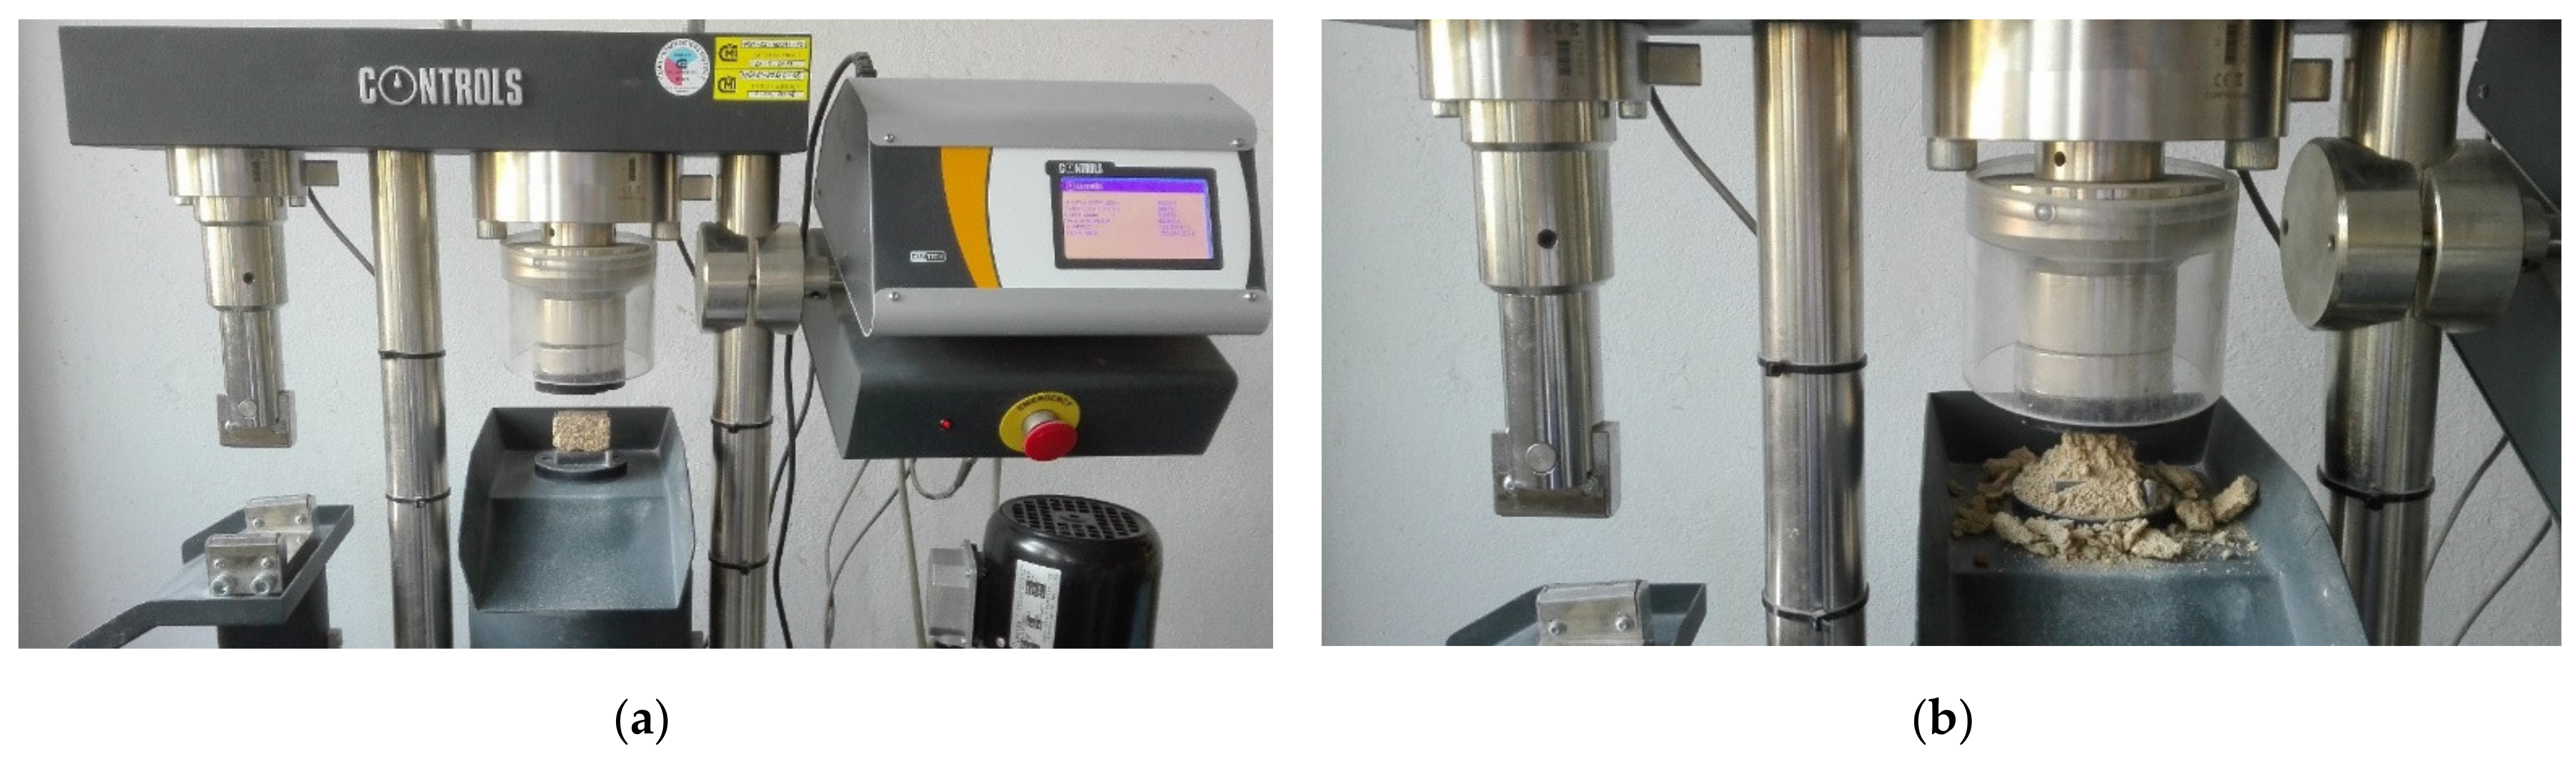
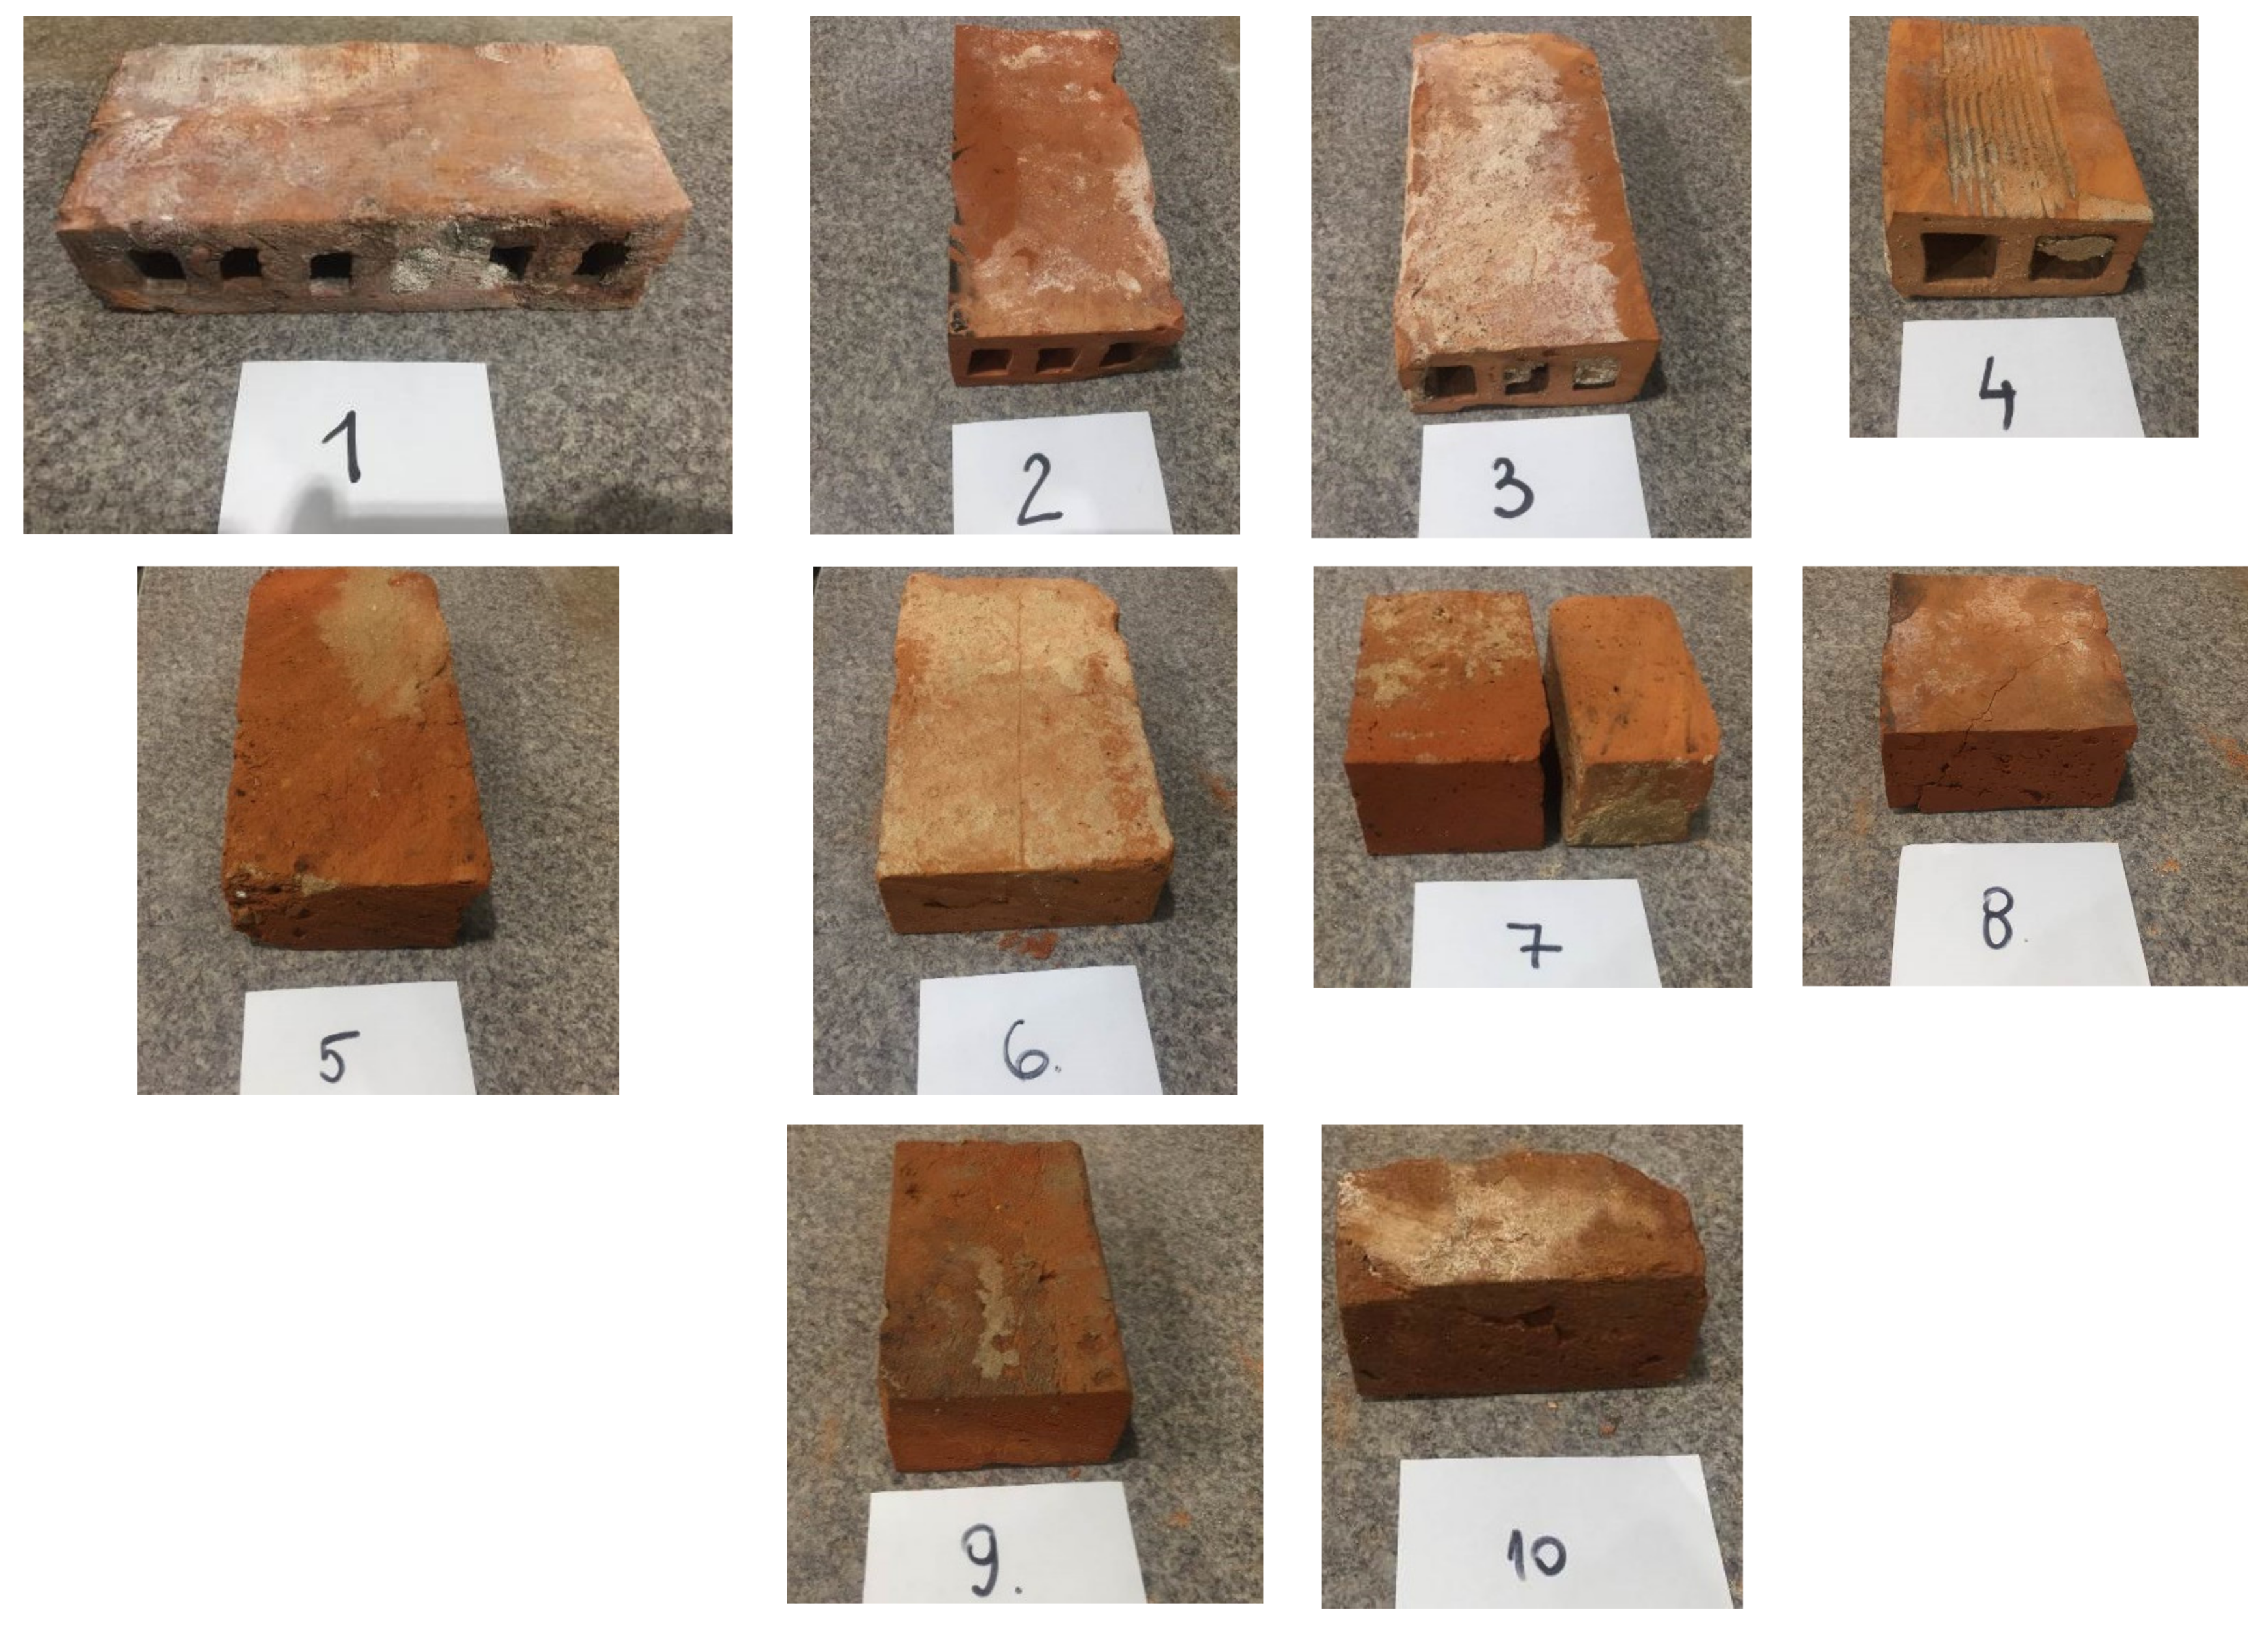
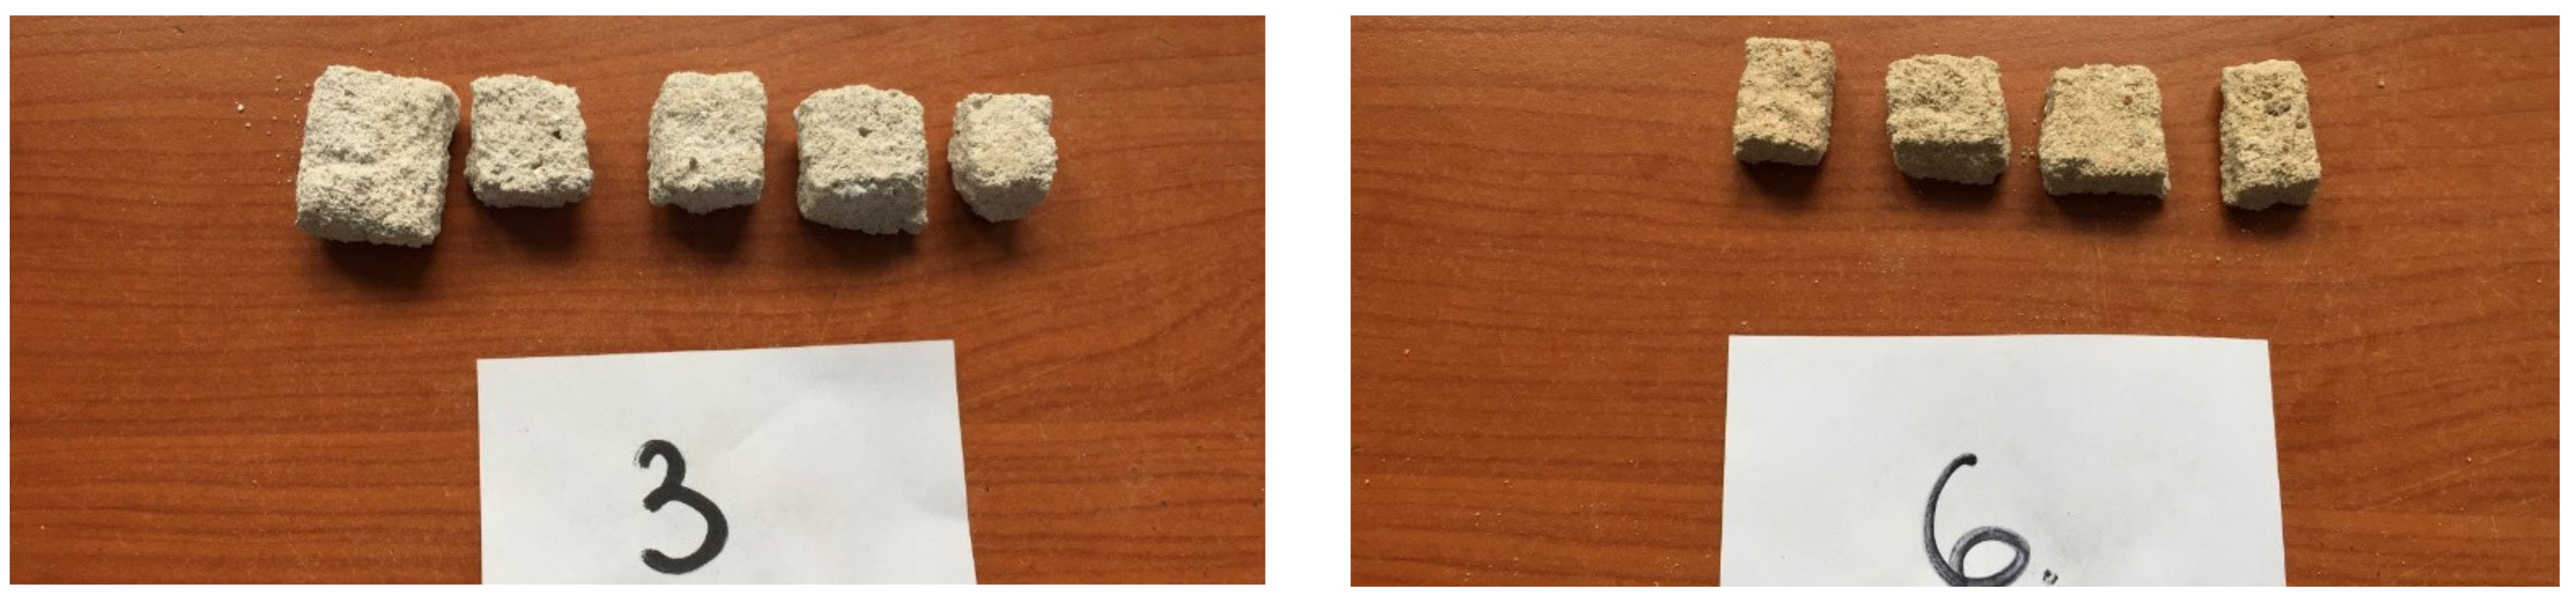
2.3. Tests Performed
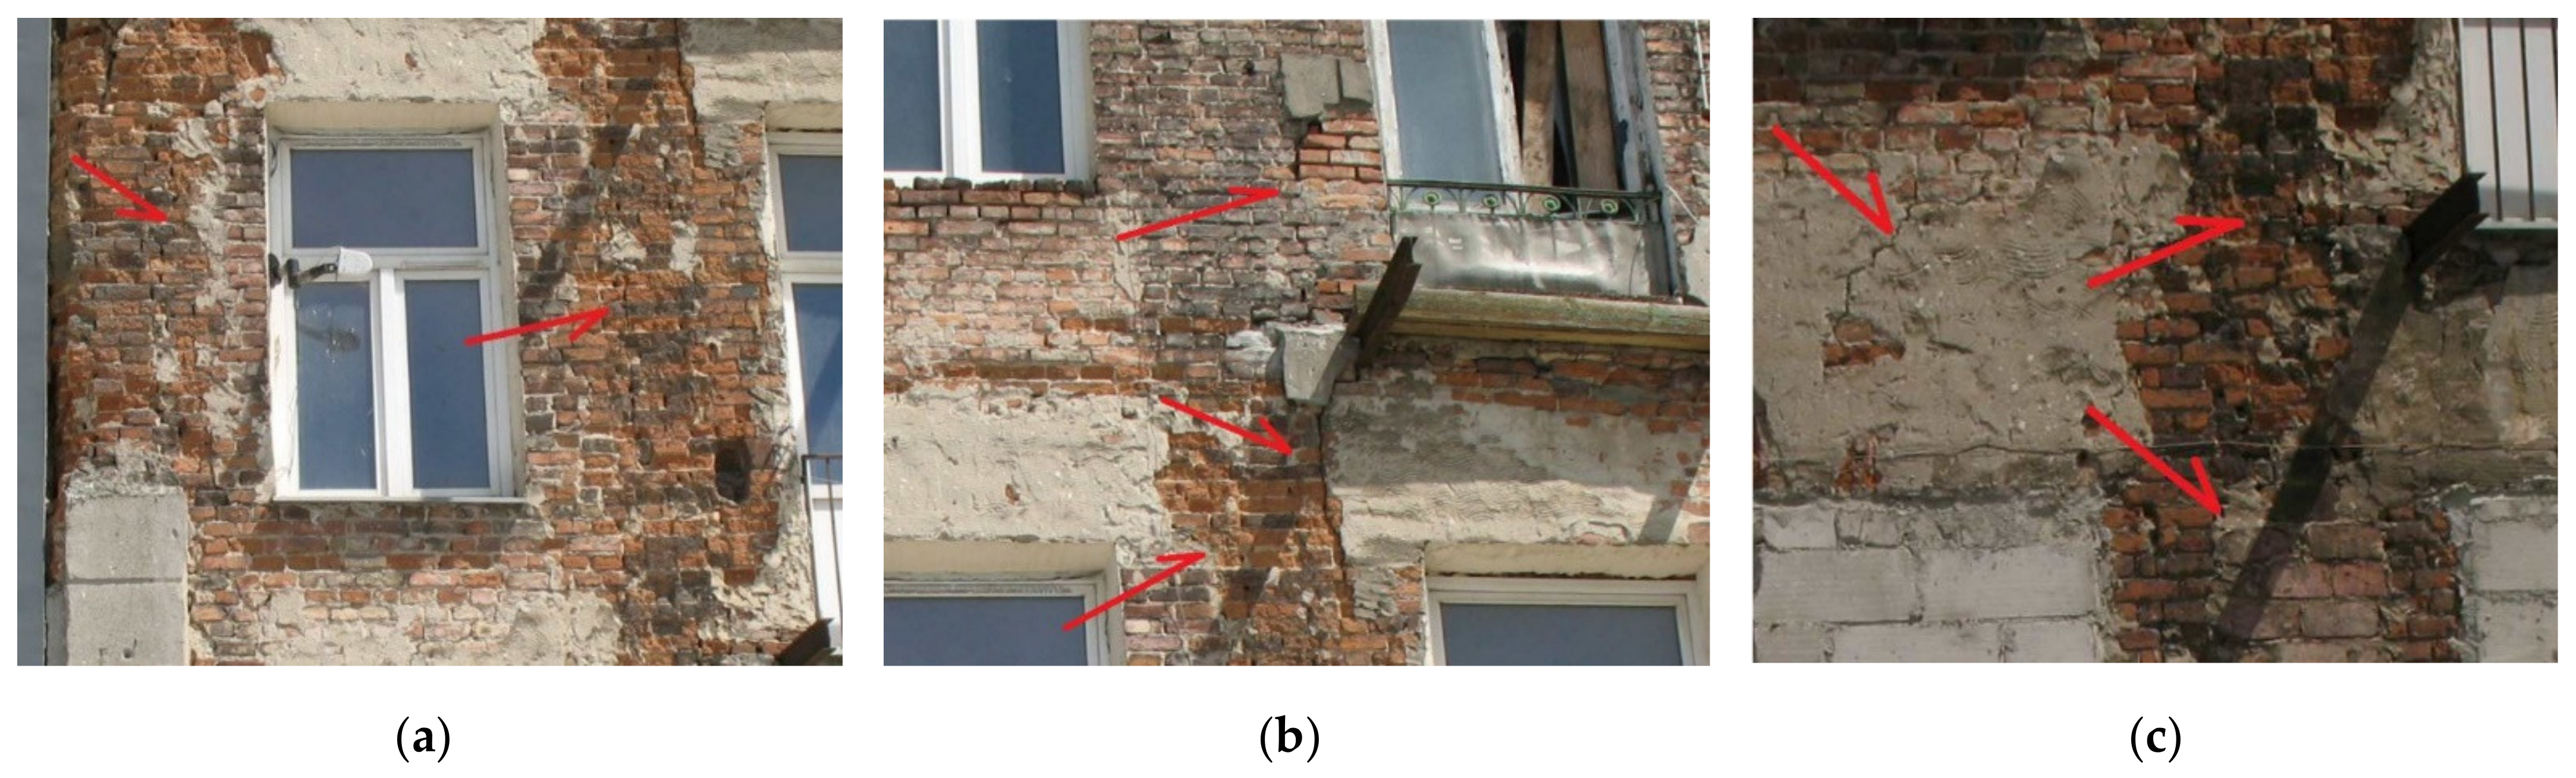
Tests on masonry units and specimens of mortar taken from the building were conducted to determine the masonry strength. Testing was performed according to EN 772-1 [29] and EN 1015-11 [30]. Three types of bricks were taken as specimens: type 1—contemporary brick 65 × 120 × 250 mm (brick from contemporary repair and renovation works), type 2—brick 65 × 155–160 × 310 mm (brick from the time of erection of the Palace—mid-18th century), type 3—brick 50 × 180 × 200–210 mm (the oldest reclaimed brick from the old castle, 14th century). Additionally, three types of mortar were taken: The oldest was lime mortar (from the time of erection of the Palace), and there were also two cement–lime mortars with or without coarse aggregate inclusion. The specimens of brick and mortar are shown in Figure 5. The brick and mortar specimens were cut to size following the standards. The mortar specimens were mechanically cut to size with no water, while the brick specimens were saw-cut with a water jet.
The brick specimens were placed in a drier (105 °C) and then conditioned until being air-dried at a temperature of ≥15 °C and a relative humidity ≤65%. The brick specimens were taken after reaching a constant weight, as verified by weighing several times. Figure 6 and Figure 7 show cut-to-size specimens.
The masonry units were arranged coaxially with a joint of a platen of the testing machine, with an operating range of 300 kN. The platen surface had been cleaned. The load was transmitted at such a rate that the specimen was destroyed within 1 min of loading, according to the standard EN 772-1 [29]. The maximum achieved load was recorded during the testing of each specimen. The representative specimen of each type before and after testing is presented in Figure 8.
The mortar specimens were arranged coaxially with a joint of a platen of the hydraulic machine, with an operating range of 100 kN. The platen surface had been cleaned. The specimen was loaded for one cycle until its destruction. The maximum achieved load was recorded during the testing of each specimen. Figure 9 shows the representative mortar specimen before and after testing.
Table 1 presents the test results for the masonry units. It specifies the type and number of the specimen, the dimensions of the cut-to-size specimen, ultimate force, compressive strength fB, and mean strength. Due to some irregularities in the specimens, their surface areas were determined as the mean of three measurements (of the edges and the center) taken for two planes loaded in all directions. The calculated strength values were converted into the normalized compressive strength of masonry units fb, following standard EN 772-1 Annex A [29]. Because of the conditioning method of the units tested, the equivalent compressive strength was equal to the determined strength (a conversion factor of 1.0). The shape factor δ was determined using Table A.1 EN 772-1 [29] via the interpolation of the height, and then the width of the masonry unit was used to calculate the compressive strength.
The normalized compressive strengths and the mean strength of the masonry units are shown in Table 2. The test results for mortar are presented in Table 3, which specifies the type and symbol of the specimen, the dimensions of the cut-to-size specimen, the ultimate force, and the compressive strength fm.
Based on the mean normalized compressive strength of the masonry units fb (Table 2) and the compressive strength of the mortar fm (Table 3), the characteristic compressive strength of the masonry was determined using the exponential equation specified in the standard EN 1996-1-1 [25]. The K = 0.45, and the reduction factor was 0.8, as recommended in the references. These incorporate specific properties of the historic masonry wall: its structure (e.g., the ratio between the width of bed joints and brick height; brick imperfections), the long-term effect of loading, and uncertainty in estimating the values of brick and mortar strength. Calculated values of the characteristic strength of the masonry are presented in Table 4.

2.4. Damage Causes

A design fault was the cause of the discussed damage. The secondary roof structure was set to be replaced with a restored version of the original shape, according to the design. The new structure was to be made partially from steel frames. The design of the tie beam supporting the steel elements was an important aspect. The tie beam was designed to be constructed in three stages, as illustrated in Figure 10. In stage 1, the internal part of the cornice masonry was to be dismantled; in stage 2, the reinforced concrete tie beam was to be erected; the wall restoration between built-in steel frames was designed at stage 3.
The collapse occurred after the part completion of stage 1. Figure 11 shows the cornice geometry before and after dismantling. The center of gravity after dismantling was at the outer edge of the wall. The structural calculations were performed via the standard EN 1996-1-1 [25]. The characteristic bending strength of the wall in the failure plane parallel to the bed joints was equal to 0.1 N/mm2. Calculations showed that the bearing capacity rate for the model without cornice dismantling was 17.4%. In contrast, the ratio of characteristic forces was 107% (close to actual values) for the different dismantling options. However, the calculations did not include the dynamic impact of the manual jackhammers used for the dismantling works.
It should be noted that the partial dismantling of the cornice wall caused the thinning of this wall to the thickness of one brick. The measurements indicate that the thickness of the thin wall was 33 cm, and the predominant brick was 31 cm thick. The designer did not allow for a transition period in the works, which resulted in the described collapse.

3. An Example of the Collapse Caused by Faulty Performance

3.1. Description of the Building

This collapse occurred during the renovation of an old tenement at Wrzesińska 2 Street in Warsaw. This is one of the oldest preserved masonry tenement houses in Praga, a district of Warsaw. The two-story tenement with the gable roof was erected in 1862—Figure 12. According to the design of architect Antoni Kaliszewski, this building was constructed for August Zieliński, a clerk of the municipal council of Warsaw. The design comprised a facade with a gate portal, an outbuilding, and a courtyard.
At the beginning of the 20th century, the front tenement and the lateral outbuilding were altered and extended, and upper stories were added. The works were executed in 1911–1912, and the peripheral walls of the older building were maintained. The works consisted of adding two stories on the side of Wrzesińska Street and three stories on the courtyard side. Three stories were also added to the outbuilding. A two-story annex was added to the end wall before 1935, but this was demolished after 1945. The building was slightly damaged during the Second World War. Figure 13 shows the tenement at the beginning of the 21st century. The catastrophic condition of the outbuilding (parallel to the front building) caused it to be demolished at the beginning of the 21st century (in ca. 2006)—only a fragment of the north side remained.
The building was decommissioned in 2016. The repair and upgrading works began in August 2020, and their completion was planned for May 2022. The works included alteration and conversion for residential purposes, and the constructing of a new adjoining residential building with a one-story underground parking and a 10-storey residential area. However, the erecting of the new building has not begun. Only the works to strengthen the existing building had been performed before the collapse.
The tenement was erected using the traditional technology, that is, masonry combined with a wall system. It comprises four stories, an attic space, and one underground story on the front side (a fragment of which collapsed). The front supporting wall is made of solid clay and hollow clay bricks. The building has a masonry strip foundation. The upper floor slabs are timber arranged in a beam and slab system with the sounding board’s soffit lining. The slabs over the basement are arranged as barrel vaults, with reinforced brick floors and arched floors with steel T-shaped beams. Over the front part of the building is the gable roof, with a timber boarding and asphalt covering. The roof is of a clasped purlin structure with angle braces.
The front wall is composed of older and newer parts, originating from the initial structure, the reconstruction, and the upward extension. The two lower stories were built from solid bricks with lime mortar, while the higher stories were built from a few (at least three) types of hollow clay brick and local solid brick combined with cement–lime mortar. The walls were in very poor technical condition, with many vertical and locally diagonal cracks, a loosened masonry structure, spalled masonry units and mortar loss, as well as plaster and traces of rebuilt masonry near openings. The condition of the collapsed wall is presented in Figure 14 (photos taken before work commencement).

3.2. Structural Collapse

On 8 November 2020, at ca. 10:15 a.m., about one-third of the front wall of the tenement with the timber-framed floor collapsed. This collapse occurred on a Sunday, which is not a working day, so there were no workers on site. The wall collapse damaged the steel scaffold. Half of the scaffold collapsed along with the front wall, and the other half fell inside the building (Figure 15 and Figure 16). The bottom part of the wall at ground-level did not collapse. Figure 17 shows fragments of the roof structure that were removed, with structural elements visible—rafters and purlins with timber boarding and asphalt covering. A fragment of the cornice in the upper part of the front wall did not collapse. Additionally, the timber-framed floor between stories collapsed along the length of the destroyed wall (Figure 18).
Before the collapse of the wall, cracks within it had been stitched (Figure 19a), and chases were cut for this purpose (three chases of ca. 40–50 mm deep for each overground story, embedded in the bed joints) (Figure 19b).
The examined front wall had a very non-homogeneous structure. Three types of masonry unit were used (solid brick, as well as at least three different types of hollow clay brick). Additionally, the types of mortar used were not the same (cement–lime mortar, light gray, and lime mortar, yellow). Locally, the masonry units did not adequately overlap. The mechanical properties of the structural components were determined via laboratory tests.

3.3. Tests Performed

The structural components of the collapsed front wall were tested, and the left part of the wall was subjected to geodetic measurements. The strength tests were conducted on ten specimens of masonry units, among which were four types of brick: 1—hollow clay with six holes on the stretcher face; type 2—hollow clay with holes in the header face; type 3—hollow clay with two holes in the header face; type 4—solid brick. Mortar for the tests was taken from specimens 3 (cement–lime mortar), 5 and 6 (lime mortar). Figure 20 presents the cut-to-size polished specimens, while the mortar specimens prepared for the tests are shown in Figure 21.
The specimens were tested as specified in Section 2.3. Table 5 presents the test results for the masonry units. It specifies the type and number of the specimen, the dimensions of the cut-to-size specimen, the ultimate force, the compressive strength fB and the mean strength (for specimen 7). Due to the irregularities in the specimens, surface area was determined as the mean of three measurements (for edges and the center) taken in all directions for two loaded planes.
The compressive strength of the masonry units was converted into the normalized compressive strength fb following standard PN-EN 772-1, Annex A [29]. The normalized compressive strength of the masonry units and the mean strength are shown in Table 6. The test results for the mortar are presented in Table 7. This specifies the type and symbol of the specimen, the dimensions of the cut-to-size specimen, the ultimate force, and the compressive strength fm.
Based on the mean normalized compressive strength of the masonry units fb (Table 6) and the compressive strength of the mortar fm (Table 7), the characteristic compressive strength of the masonry was determined from the exponential equation (see Section 2.3). The calculated values of the characteristic strength of the masonry are presented in Table 8. Following the relevant reference paper, the strength was additionally reduced by 20%.
Geodetic measurements were taken for the front wall’s drift after the collapse. Selected points in the building’s façade, in the mullions, were measured with an accuracy of ±1 mm (Figure 22).
The measurement results are illustrated in the diagram in Figure 23. The measurement was referred to the virtual axis of the wall. The greatest drift—nearly 20 cm—was recorded between the axes S6 and S7 and 8. High drift values (ca. 10 cm) were also observed at the axes S1, S3, and S7. The standard PN-EN 1996-2 allows a maximum drift of 50 mm for a building’s wall. This condition was only met in the measurements of two axes (S4 and S5). It should be emphasized that the façade had no cornice, which could interfere with the measurement result. Additionally, there was almost no plaster in the mullions. However, these results may be affected by the loss and surface distress of the masonry wall, and earlier rebricking works.

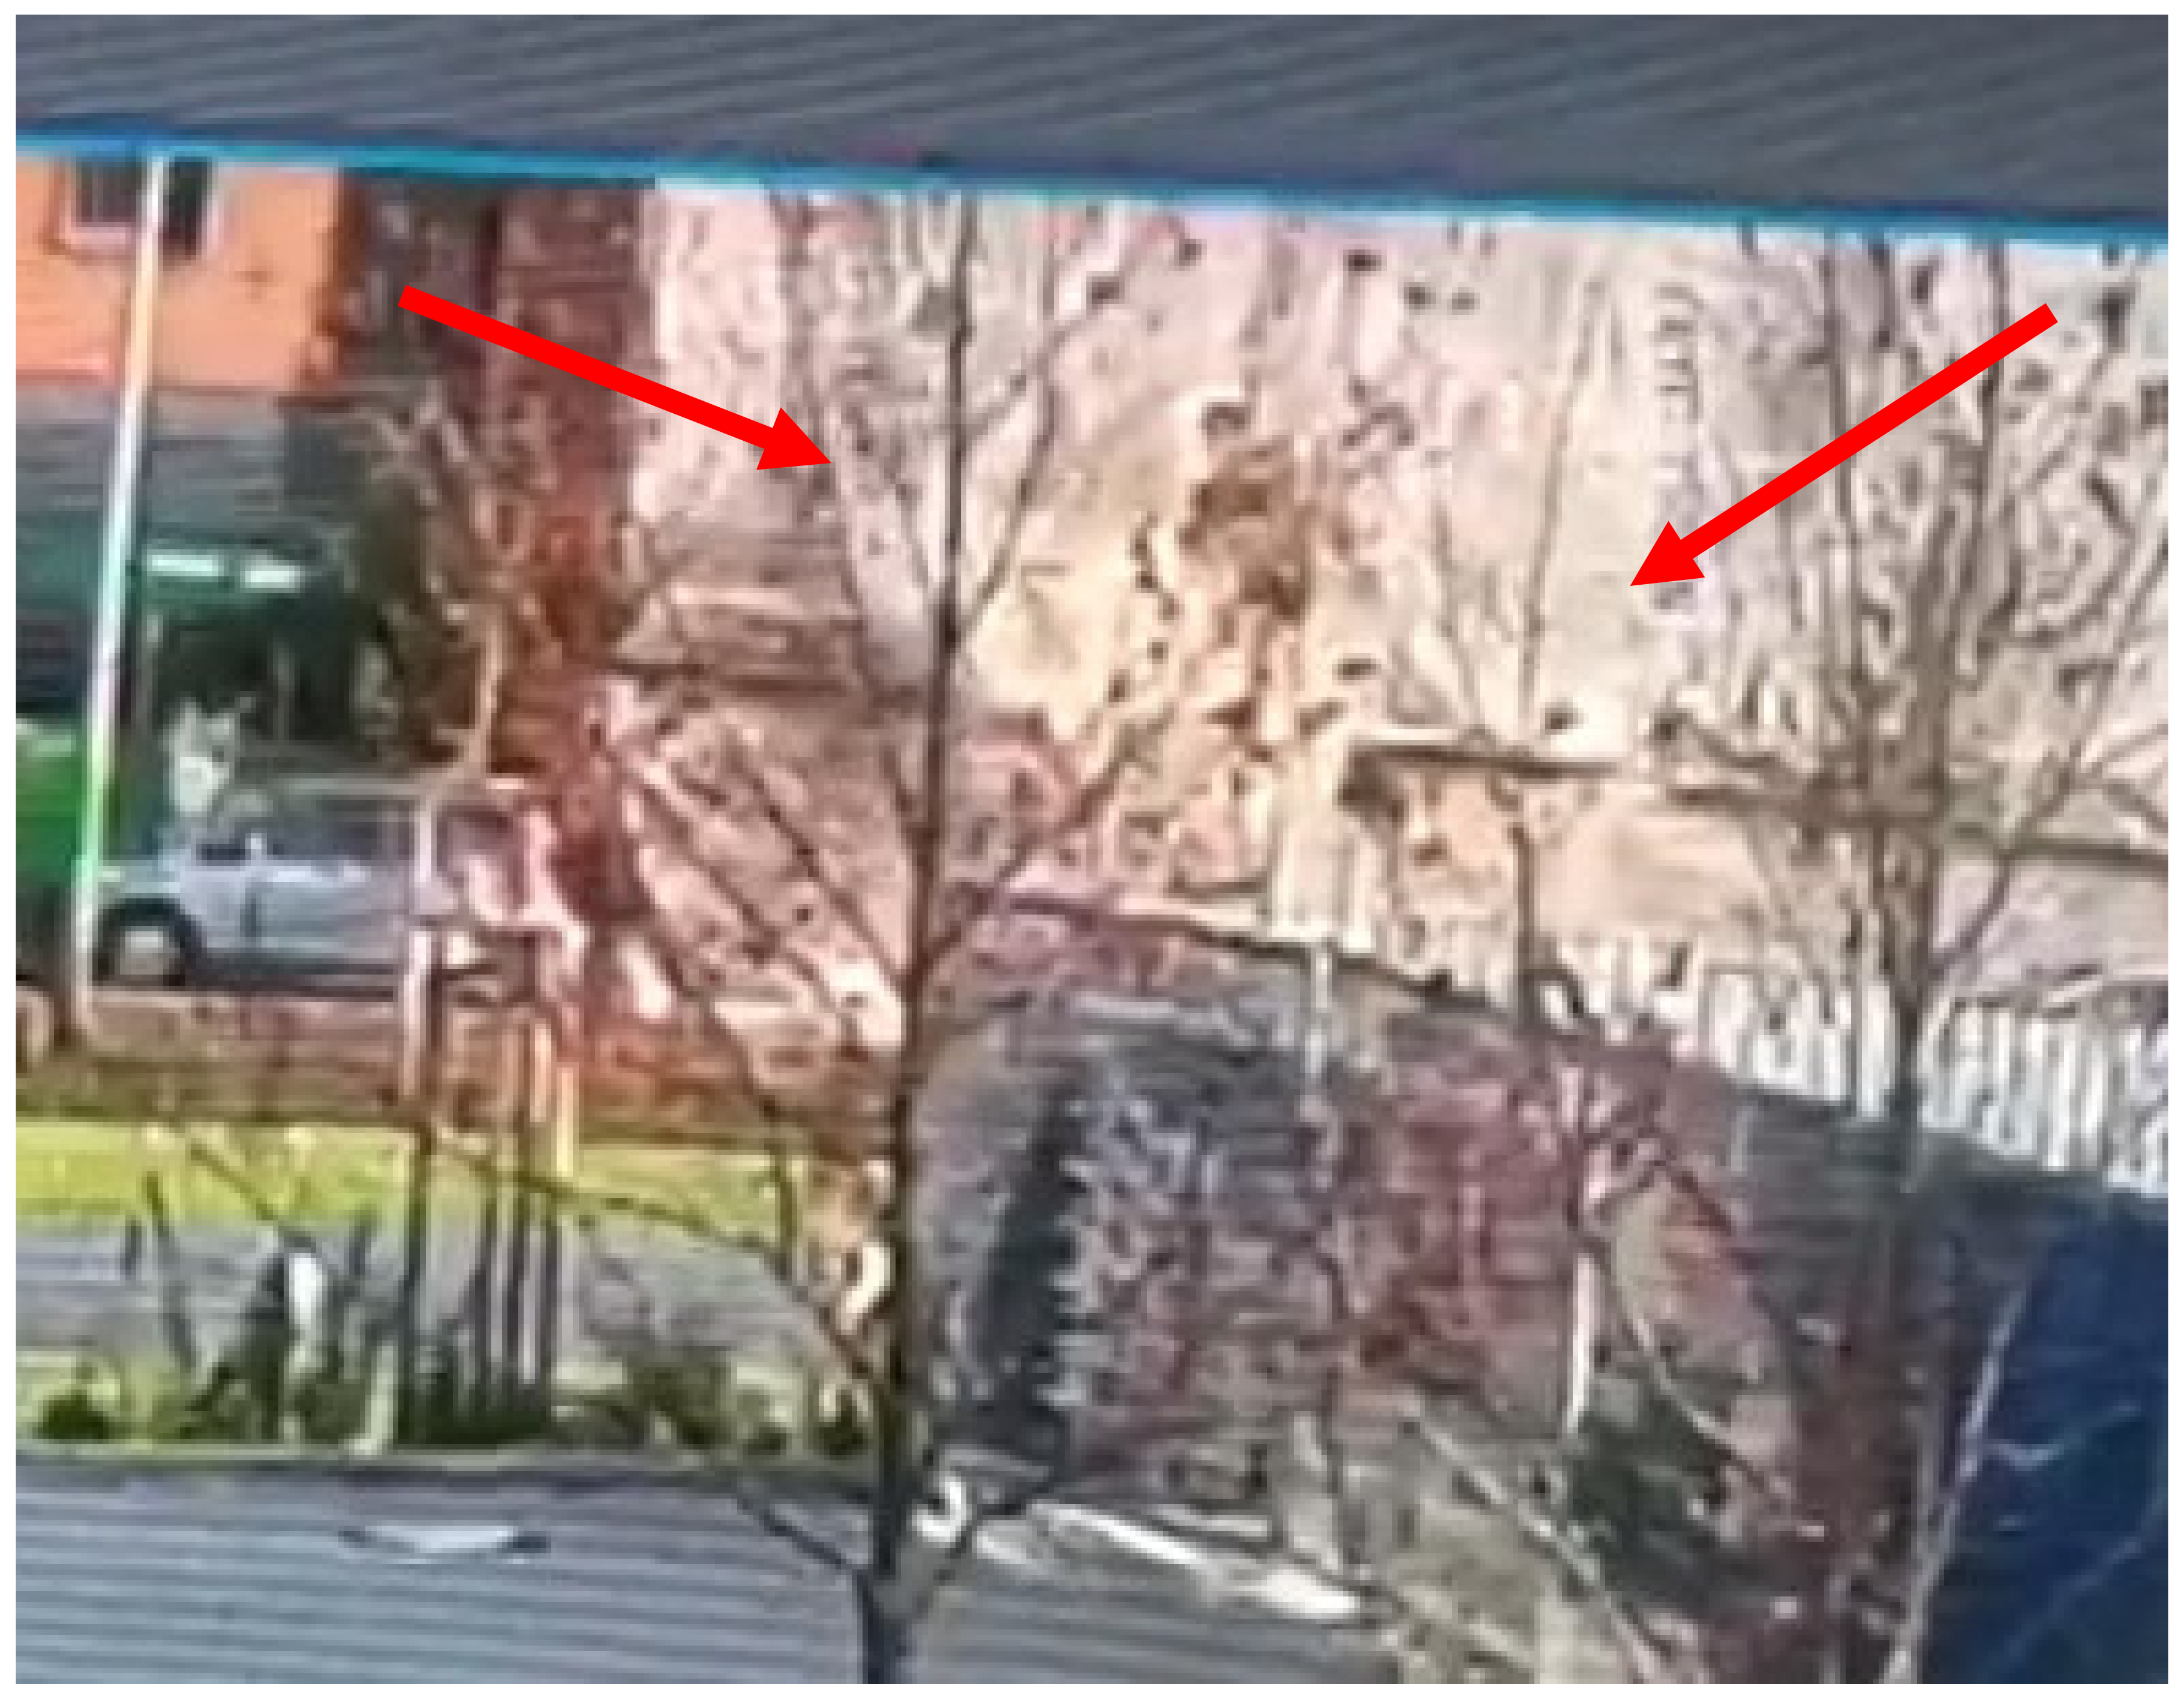
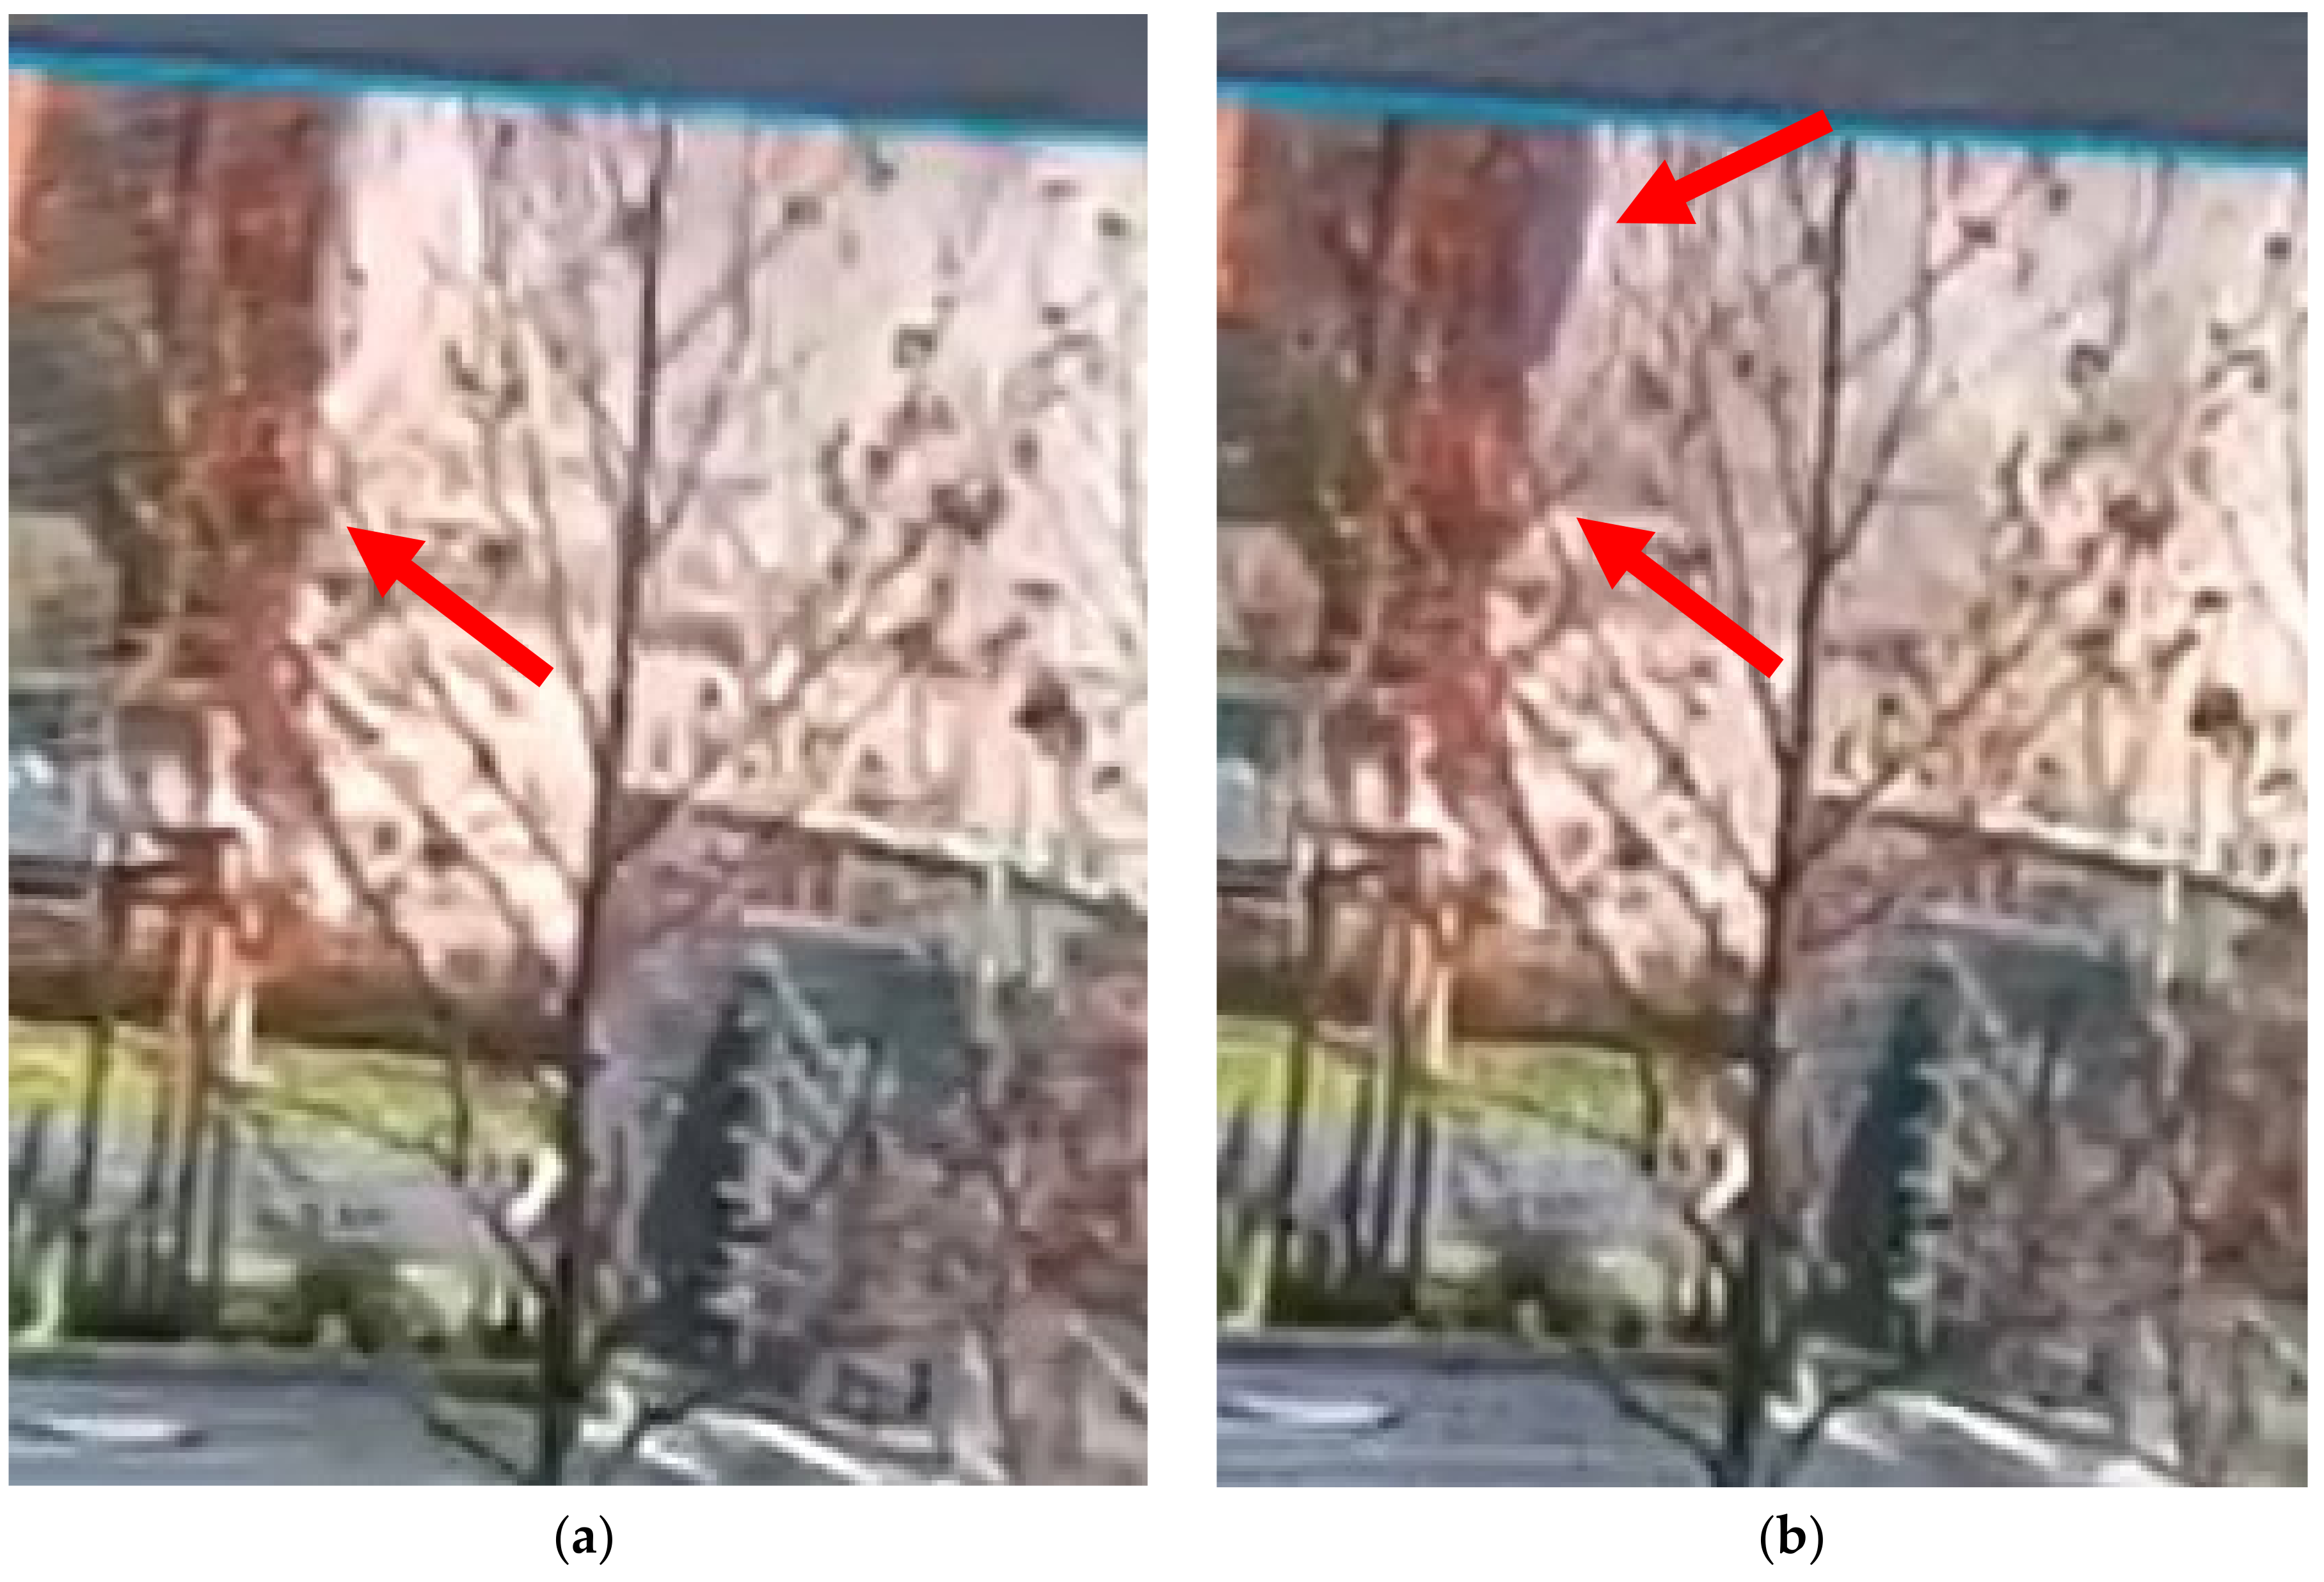
3.4. Analysis of Recordings from Surveillance Cameras

During the incident, which took place on 8 November 2020 at ca. 10:15 a.m., the collapse of the wall in question was recorded by the industrial cameras installed on the building opposite this wall. These recordings do not clearly show the reason for the collapse. Nevertheless, they indicate it took place in two stages. In the first stage, a fragment of the wall, or of the floor in the upper parts of the wall, was destroyed. This caused the clouds of smoke visible on the recording. Nevertheless, the wall itself was not destroyed. The recording shows two clouds of smoke in the initial phase, whose locations correspond to the second and third axes of the windows (Figure 24), and the first cloud of smoke appeared on the central axis. This might suggest the debonding of a fragment of the structure within the building, causing clouds of smoke to blow from these windows.
The second stage of the collapse occurred ca. 15 s later. The front wall collapsed along two window lines on the ground floor and three window lines on the floors above. The falling fragments of the wall presumably affected the stability of the rest of the wall, representing the primary cause of this collapse. The time-lapse analysis showed that the scaffold rotated at the level of the first catwalk during the collapse (Figure 25). This means that the damage was not caused by problems with the support or rebricking of the wall at the ground level, because these factors would not cause this rotation. Hence, the causes of the discussed damage should be sought in higher parts of the wall.

3.5. Collapse Causes

The cause of the wall collapse discussed was the exceedance of its bending strength in the buckling plane. Wind action should be excluded from consideration as a direct cause of the damage. On the collapse day, at ca. 10:15, the wind speed read at the weather station in south Warsaw was 2 m/s, reaching at most 3.5 m/s, which is less than 16% of the allowable value as specified in the standard EN 1991-1-4 [31]. Similar readings were taken at the measuring station at Okęcie airport. The recorded wind speed had been nearly three times higher (Figure 26) within the month before the collapse.
However, this does not mean the scaffold itself could not have contributed to causing the damage. The fastening of the scaffold to the wall probably placed additional horizontal tensile forces on the wall–floors system, thus slightly contributing to the collapse. In the authors’ opinion, the lateral drift of the wall was the most important factor, which created additional eccentricities in body forces (wall weight and floor reactions). The lateral drift of the wall in the collapse zone is itself unknown, but measurements taken after the collapse indicate that it was ca. 10 cm, and the greatest lateral drift (orientated symmetrically around the damage, on the other side of the façade) was as much as 20 cm. The chases (depth of 80 mm) applied for crack stitching could also have affected the damage.
It should also be noted that the wall’s condition before its collapse was inferior, and its strength significantly varied. The wall was significantly scratched. There were many vertical and diagonal cracks. Superficial cracks in the window edges marked slender vertical elements in the mullions.
The tests demonstrate that the wall’s strength varied considerably. The typical yield strength of the wall was within the range of 0.57~2.13 MPa. The lowest tested strength of the wall was nearly four times lower than the highest value. This difference in practice was even greater, as the tests did not account for the high heterogeneity of the masonry wall, given the lack of bondings, voids, damage, and losses in masonry units and mortar.
The surveillance recordings show that the whole wall did not collapse at once, but rather in two stages. In the first stage, local debonding and collapse occurred in a fragment of the wall and/or the floor, and after ca. 15 s, in the second stage, the wall collapsed. Four hypotheses have been raised to explain the failure mechanism of the wall, particularly addressing the first stage.
Hypothesis 1 (H1).
The collapse was caused by superficial cracking inside the masonry wall in the wall–floor node and the bursting failure of the wall edge above the floor. As a result of this, the ceiling beam could freely rotate, and the edge loading increased in the beam support on the wall. This loading resulted in the debonding of the wall below the ceiling beam, and the collapse of the floor fragment (first stage of the damage). The collapsed floor loaded onto the lower story, which triggered the collapse. Figure 27 presents the schematic course of the collapse proposed by Hypothesis 1.
Hypothesis 2 (H2).
The collapse was caused by superficial cracking inside the masonry wall in the wall–floor node, and the bursting failure of the wall fragment below the floor (due to edge stresses). Then, the wall below the ceiling beam debonded, and the floor fragment collapsed (first stage of the collapse). The collapsed floor loaded onto the lower story, which triggered the collapse. Figure 28 presents the schematic course of the collapse following Hypothesis 2.
Hypothesis 3 (H3).
The failure was caused by the outwards collapse of part of the cornice, on the scaffold (first stage of the collapse), which placed additional load on the wall and led to its instability (second stage of the collapse).
Hypothesis 4 (H4).
The failure was caused by the inwards collapse of the cornice (first stage of the collapse). Such a significant dynamic point load caused damage to the ceiling beams and the debonding of the wall below/above the ceiling beam; consequently, the floor collapsed (as in Hypotheses 1 and 2). The collapsed floor loaded the lower story, which triggered the collapse.
Hypotheses 3 and 4 seem to be the least probable, but the surveillance recordings contradict this (that said, they do not cover the upper part of the wall). Under Hypothesis 3, the scaffold on the collapsed wall should have fallen towards the road, and partly fallen inside the building. Nonetheless, the cornice’s condition was very poor (Figure 29).
The failure mechanism seems more supportive of Hypothesis 1 or 2. It is also possible that both failure mechanisms occurred in different ceiling beams. However, determining the floor at which the damage began and the first stage of collapse occurred is difficult. Based on the analysis of the record photos, there are two potential places of damage initiation. The first is the attic floor, under which the wall was narrower, and the joist pockets were installed at considerable depth, which weakened the section (Figure 30). Moreover, the scaffold was anchored in the area of narrow wall. The floor above the first story is the second possibility, as the wall thickness was greater above this floor (Figure 31).
The verifying structural calculations were performed to determine the place at which the collapse could have been initiated. Unfortunately, the anisotropic structure and behavior are unique to each masonry structure. This results from combining at least two materials with different mechanical parameters. The analyzed case is also characterized by heterogeneity in the wall, resulting from the different types of mortar and masonry units used and the method of construction (many inaccuracies, lack of bonding, varied thickness of the wall), which significantly complicated the selection of an adequate calculation procedure. The above issues mean that the calculations were qualitative and not quantitative. The results below are estimates, and attempt to present the essential factors that weakened the wall (e.g., the stress distribution over the wall thickness).
The verifying calculations include the procedure of masonry wall homogenization, based on the macro-model with the same mechanical parameters as those used for the tests. Such an approach enabled the analysis of the behavior of the whole wall and its stiffening with timber-framed floors.
Two types of calculations were performed: for spatial and deep beam models. The spatial model was used to verify the results obtained from the deep beam model, which was used to identify where the damage was initiated. The calculations were performed using the AxisVM X5 software. The material parameters obtained from the tests were used for the calculations—at the bottom, the worst results were derived for the wall made of solid brick, and at the top, the worst results were derived for the wall made of hollow clay brick.
The spatial model (Figure 32) was prepared for a fragment of the front wall subjected to failure. The window openings were modeled following their original location and dimensions. The later bricking up of the ground level was neglected. Openings had already been made in the loaded structure, and their connection with other elements did not allow load transmission. The thickness of the wall’s cross-section was adjusted in each section according to the design documents, the photo documents, and the results of the inspection of the building after failure. The model did not take into account geometrical imperfections and other deviations in the wall’s structure. However, the spatial shell model did not correctly represent all the wall section details as they were presented in the panel model.
The panel model was constructed for the wall section whose width corresponded to the width of the mullion. The weakening of the wall was considered to be caused by timber elements in the middle of the wall section. Narrowing and other changes in the wall width were also modeled (Figure 33).
The highest compressive vertical strength calculated for the spatial model was 0.47 MPa (Figure 34), which constituted 57% of the minimum ultimate strength of the masonry unit. The calculation confirmed that the global collapse of the wall could not occur as a result of exceeding its compressive strength.
Significant tensile stresses were noticed in the spandrel and header area of the model. They caused cracks to develop above and below the windows. These cracks led to the separation of the main mullions from the spandrel area, and consequently reduced their stiffness. The deformation image shows the lateral drift of the knee wall towards the inside of the building (Figure 35). The maximum drift values did not exceed 0.53 mm for the calculations made within the elastic range, neglecting the imperfections in masonry unit thickness. The vertical stresses at the bottom stories were used to verify the panel model described later in the text. The results agreed at the level of 87% with the higher stress values in the panel model, because the additional reduction in the thickness of the masonry units was taken into account.
Two plane models were prepared. Model No. 1 was without interior damage, and model No. 2 included local damage at the narrow section of the knee wall, below the bottom beam of the roof structure. As seen in Figure 33, a joist pocket for a timber or steel beam was modeled in both models. Model No. 2 also included the possible damage to or loosening of the outer wall layer (face), composed of a single layer of hollow clay bricks. The disturbance of this structure is illustrated in Figure 33.
Additionally, model No. 2 included the elastic recovery of the connection between the wall and the roof structure due to the strain relief of the construction, which increased the loose connections described in the investigation report from 2017. As such, model No. 2 did not include the lateral support of the wall at the location of the wall plate, and only included the support at the bottom (floor) beam level. The horizontal stiffness of the supports was calculated based on the spacing and a section of a beam of the upper floor slabs. The effect of friction and the intermediate support of the beams was taken into account by reducing the stiffness to one-tenth of the longitudinal stiffness of the elements.
The vertical stresses at the narrow section of the ground floor were ~0.54 MPa (compared to 0.47 MPa in the spatial model), and the equivalent stresses, which included their complex state, gave a stress ratio lower than 75% of the loading capacity of the element (Figure 36).
The nature of the deformations in both panel models was used to define the hypothetical sequence of failure as described in hypothesis 4. The values of deformations in the bottom parts of the model agree with the calculations made for the spatial model (Figure 37).
A thorough analysis of the knee wall and the narrowing below the floor beam indicate that this was the wall fragment with the highest stress ratio. There were vertical tensile stresses in the non-reduced section (model No. 1) equal to 0.09 MPa (Figure 38a) at the standard tensile strength at bending of 0.10 MPa. Significant tensile stresses were observed in the wall face, particularly at the section between the outer edge and the opening caused by the setting of the beam over the lintel. Assuming lateral support was provided by the roof structure, this model did not reach its strength limit.
The equivalent stresses, including the complex state of stresses, resulted in a stress ratio lower than 70% of the loading capacity of the element (Figure 39a). The change in narrowing geometry and the release of the lateral support at the level of the wall coping led to a definite change in the stress state. The maximum vertical tensile stresses reached the value of 0.10 MPa (Figure 38b) in one-third of the wall’s remaining (reduced) section, and exceeded the tensile strength limit at bending.
The analysis of equivalent stresses showed that the maximum stress ratio was caused by tension (from the face side) and compression (from the inside of the building), as the effect of bending was observed for two-thirds of the remaining section of the masonry unit (Figure 39b). It is assumed that loosening of or damage to the wall facing could cause the bending of the knee wall towards the inside of the building. The failure of the knee wall could result in the loss of support of the floor beams in the attic. The collapse of a substantial part of the knee wall onto the floor below and the scaffold, and the falling of the floor beams (except for the beams in the full girder), could lead to stability failure in walls at lower levels, which could result in further failures in the front wall or damage to the floors below the attic level, and finally in the loss of the lateral supports and vertical stability of the front wall.
In summary, the calculations indicate that the wall collapse (first stage of damage) was probably initiated in the support zone of the attic floor. As mentioned above, the calculations were only qualitative, and they should be regarded as a kind of approximation. Therefore, the second analyzed area, the section of the floor support, cannot be excluded as the initiation area of the collapse.
Hence, the collapse was caused by the debonding of the wall fragment and the collapse of the floor (according to Hypotheses 1 and 2, illustrated in Figure 27 and Figure 28, respectively). It was thus the contractor who was responsible for this collapse. According to the design, all the floors at each level should have been propped prior to the commencement of construction works, which was not done. The design also suggested protecting the external wall with angle braces, which also was not done. Propping and protecting the building could probably have prevented the collapse.

4. An Example of the Collapse Caused by Faulty Operation

4.1. Description of the Building

This collapse occurred in a tenement at 1 Maja 13 Street in Katowice. This tenement was erected at the end of the 19th century as a masonry building made of solid brick. The ceiling above the basement was constructed from arched brick floors with steel beam over cellars and timber floors at the aboveground levels. The building has a rafter and purlin roof structure.
It is a three-story building with an attic and a full basement. The building’s shape is near rectangular, and its dimensions are 11.0 × 19.95 m. It is a residential building with three commercial units at the ground level. Figure 40 illustrates the discussed building.

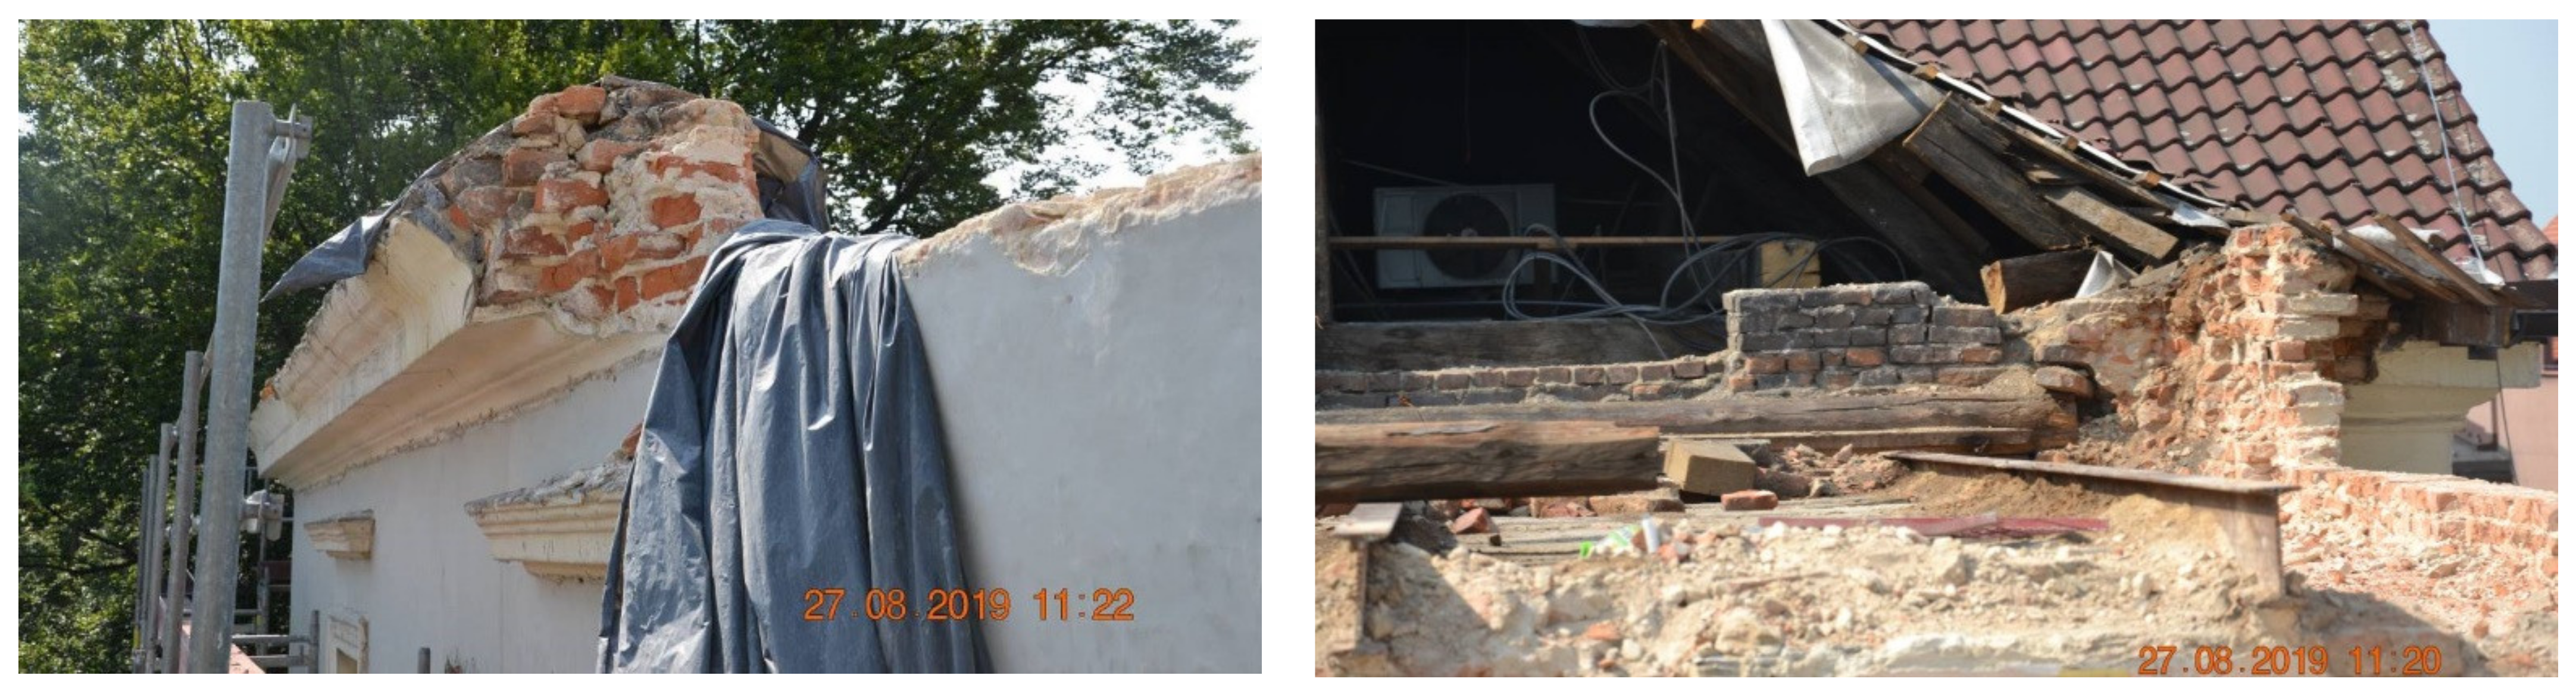
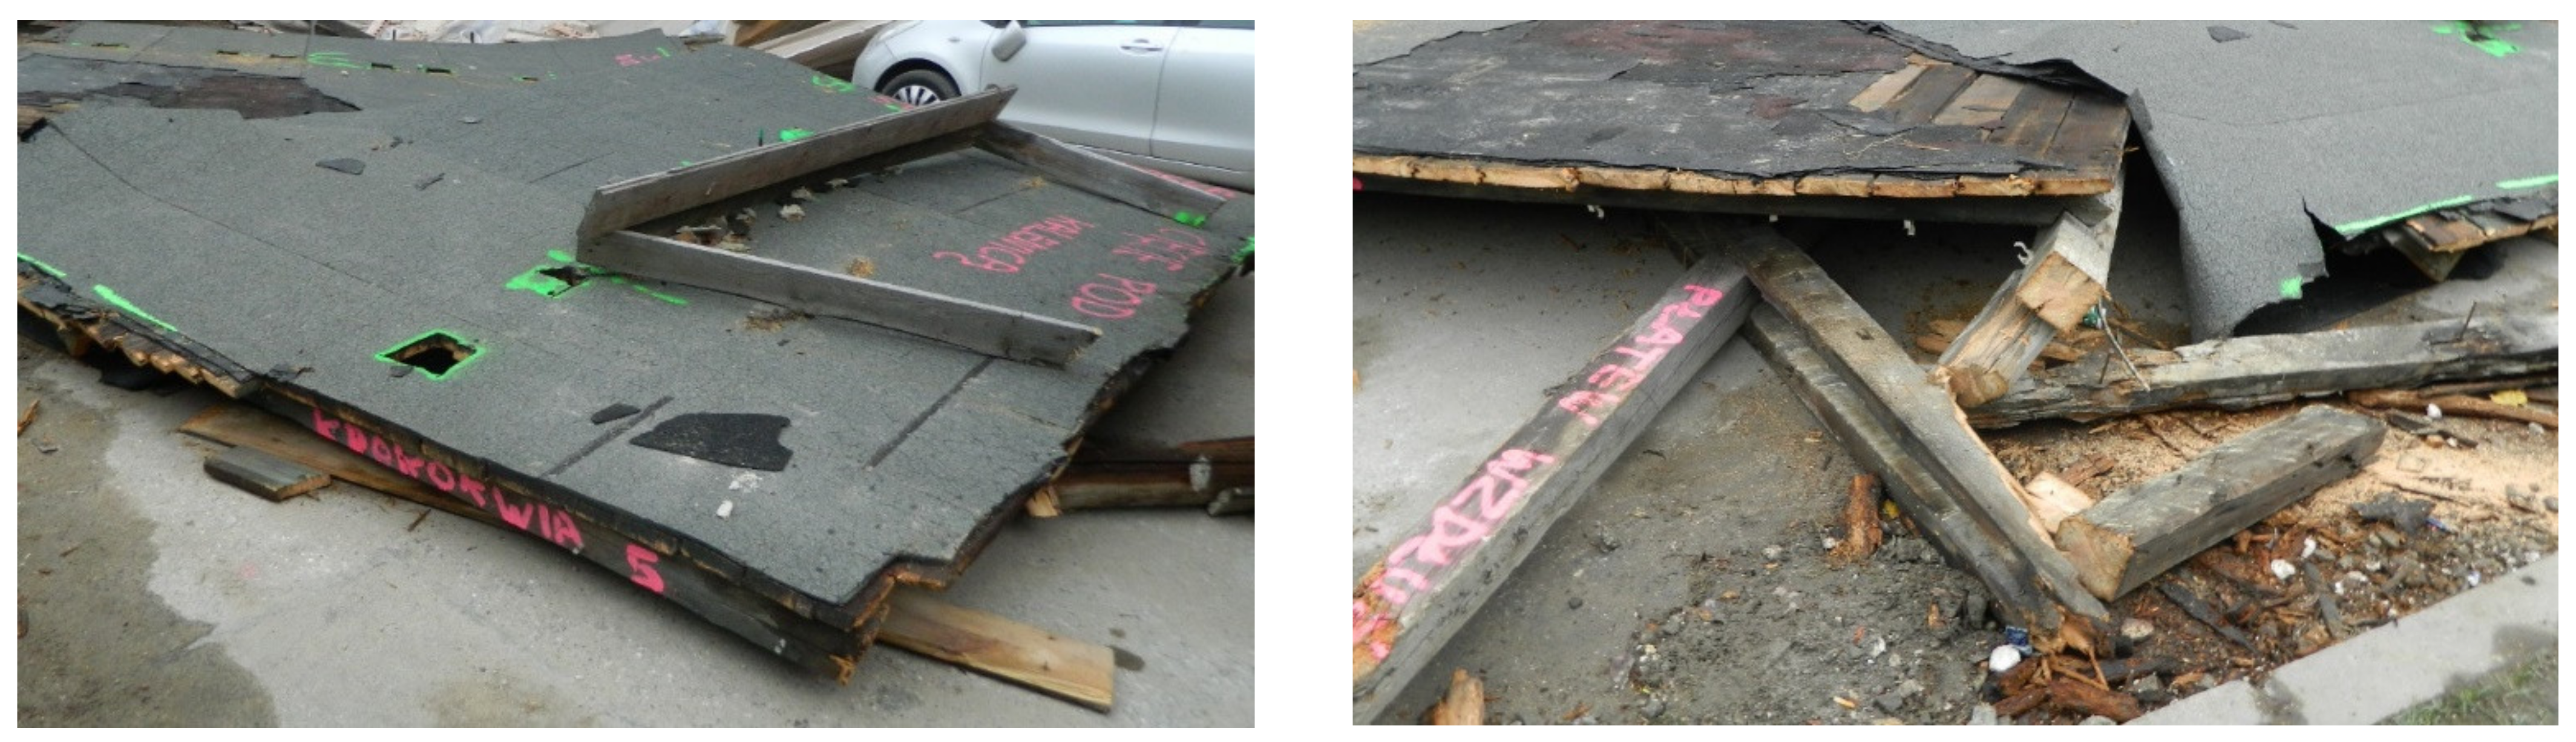
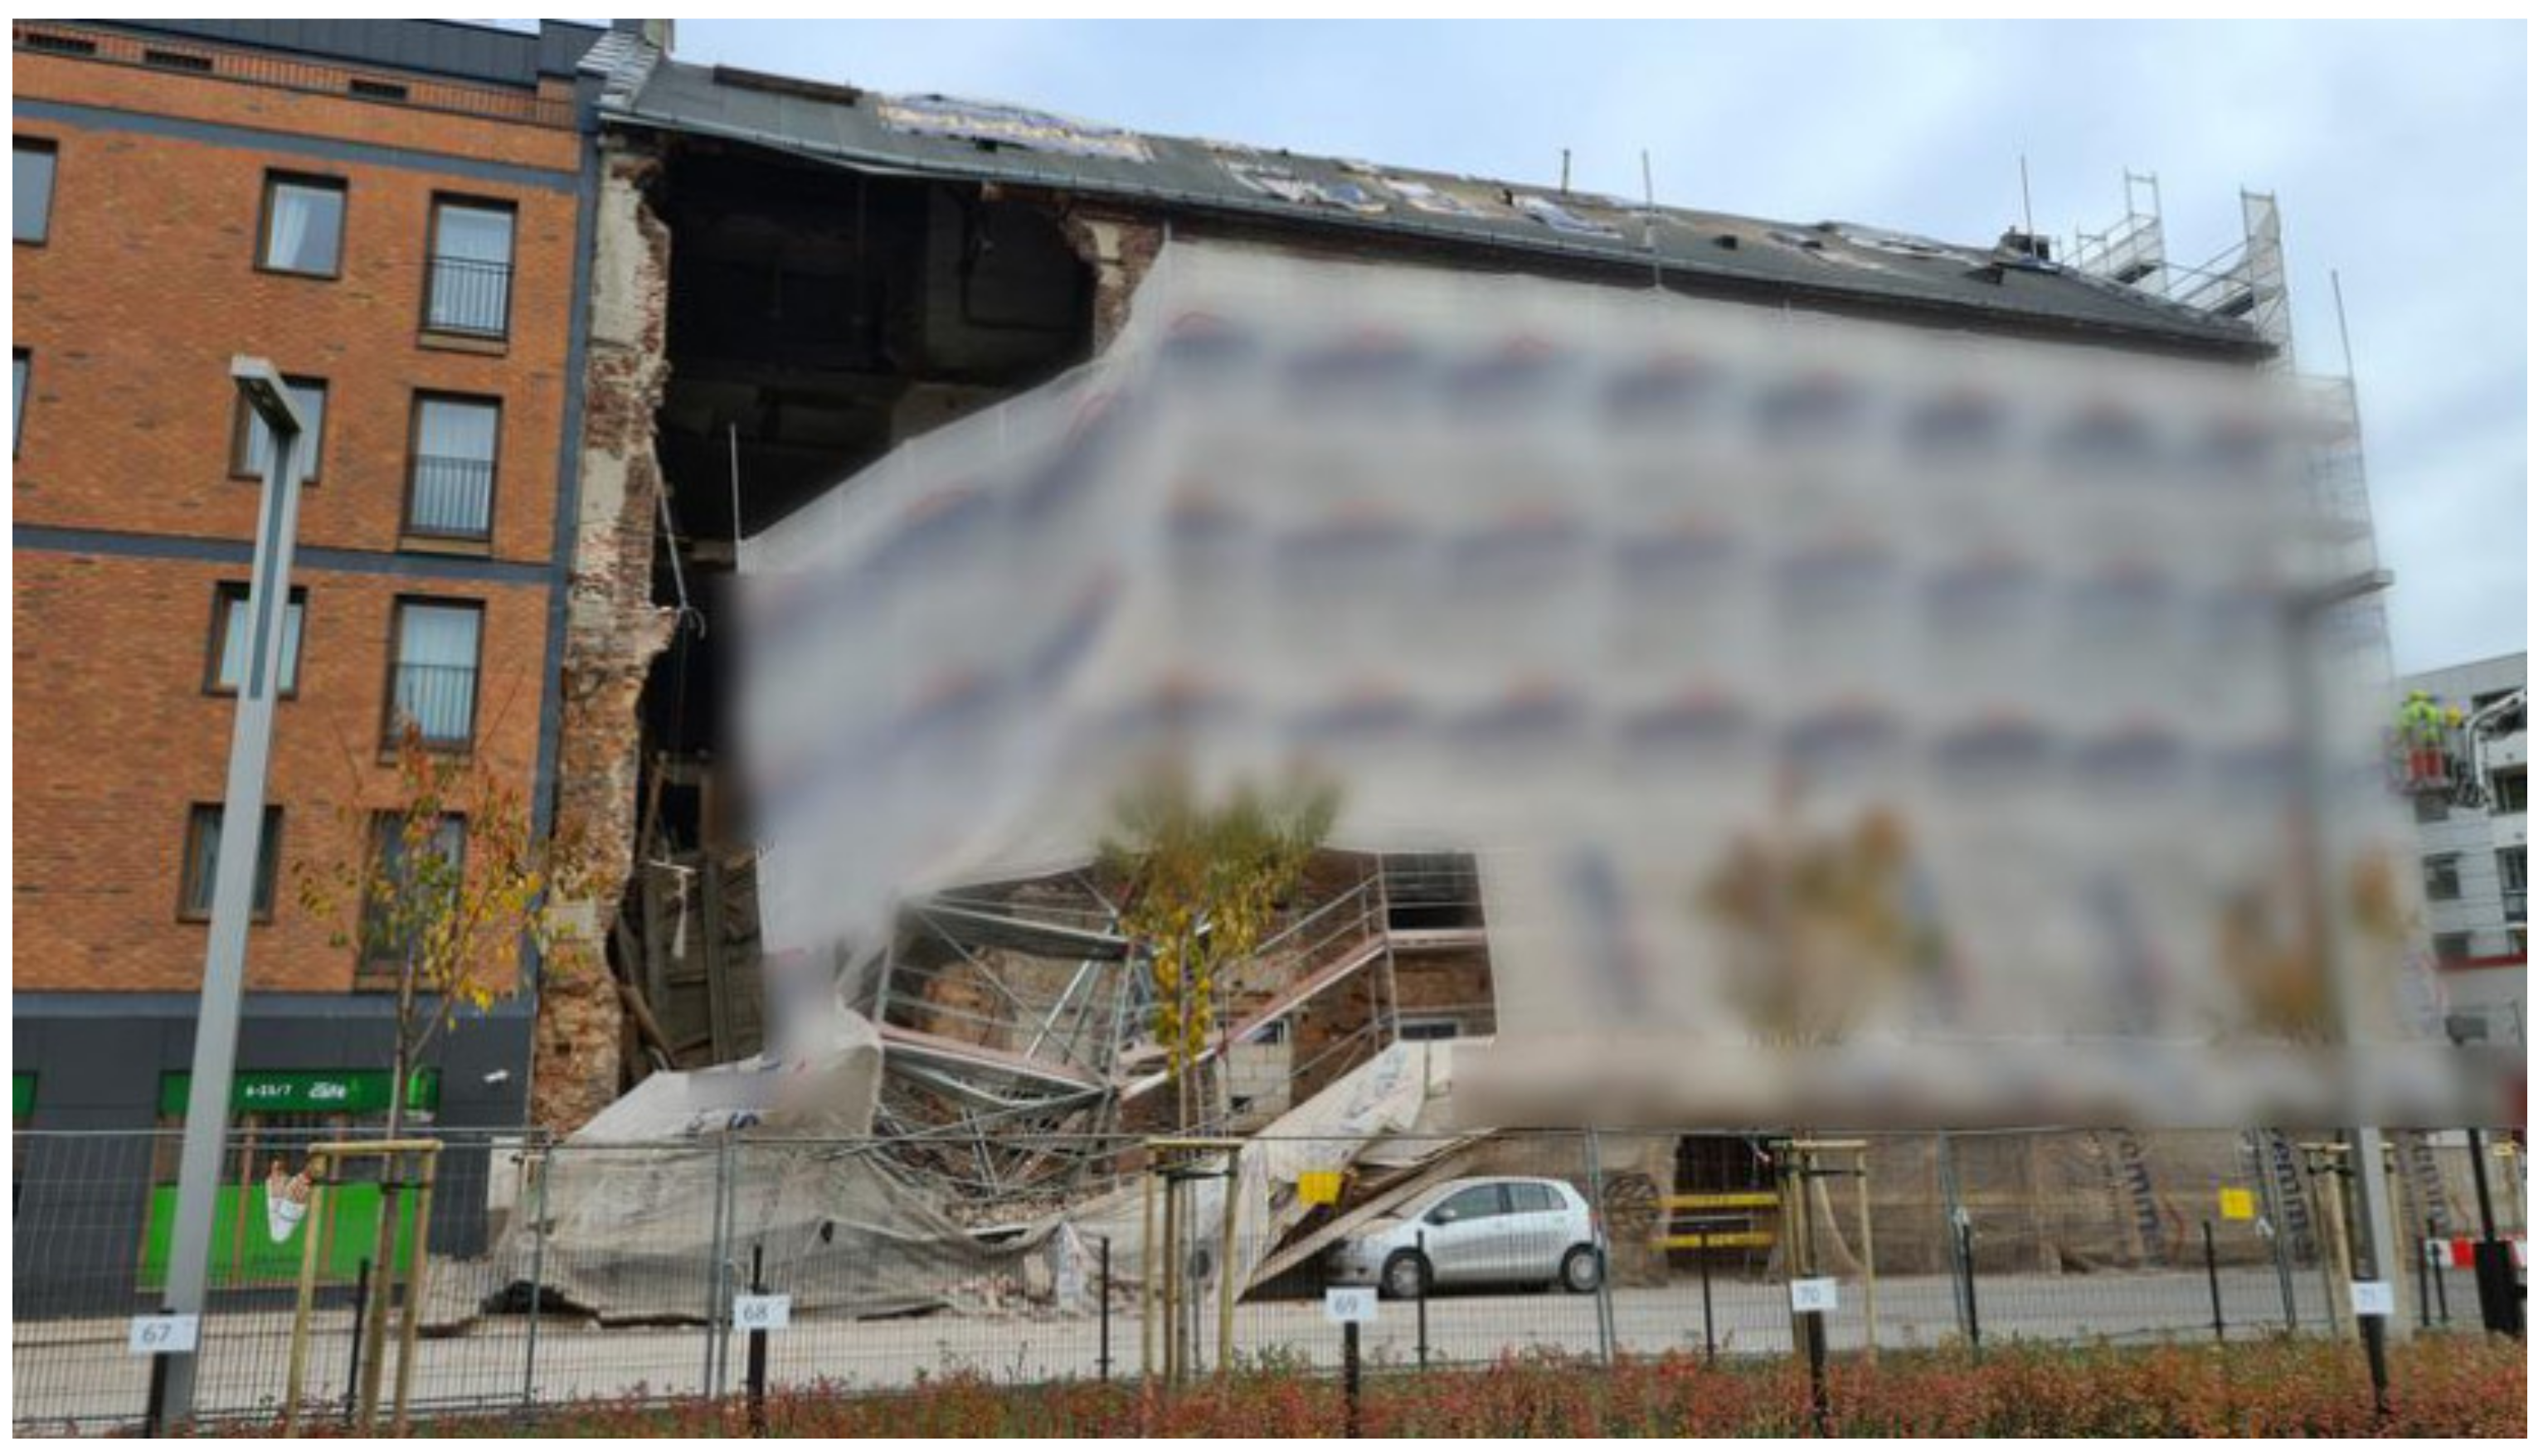
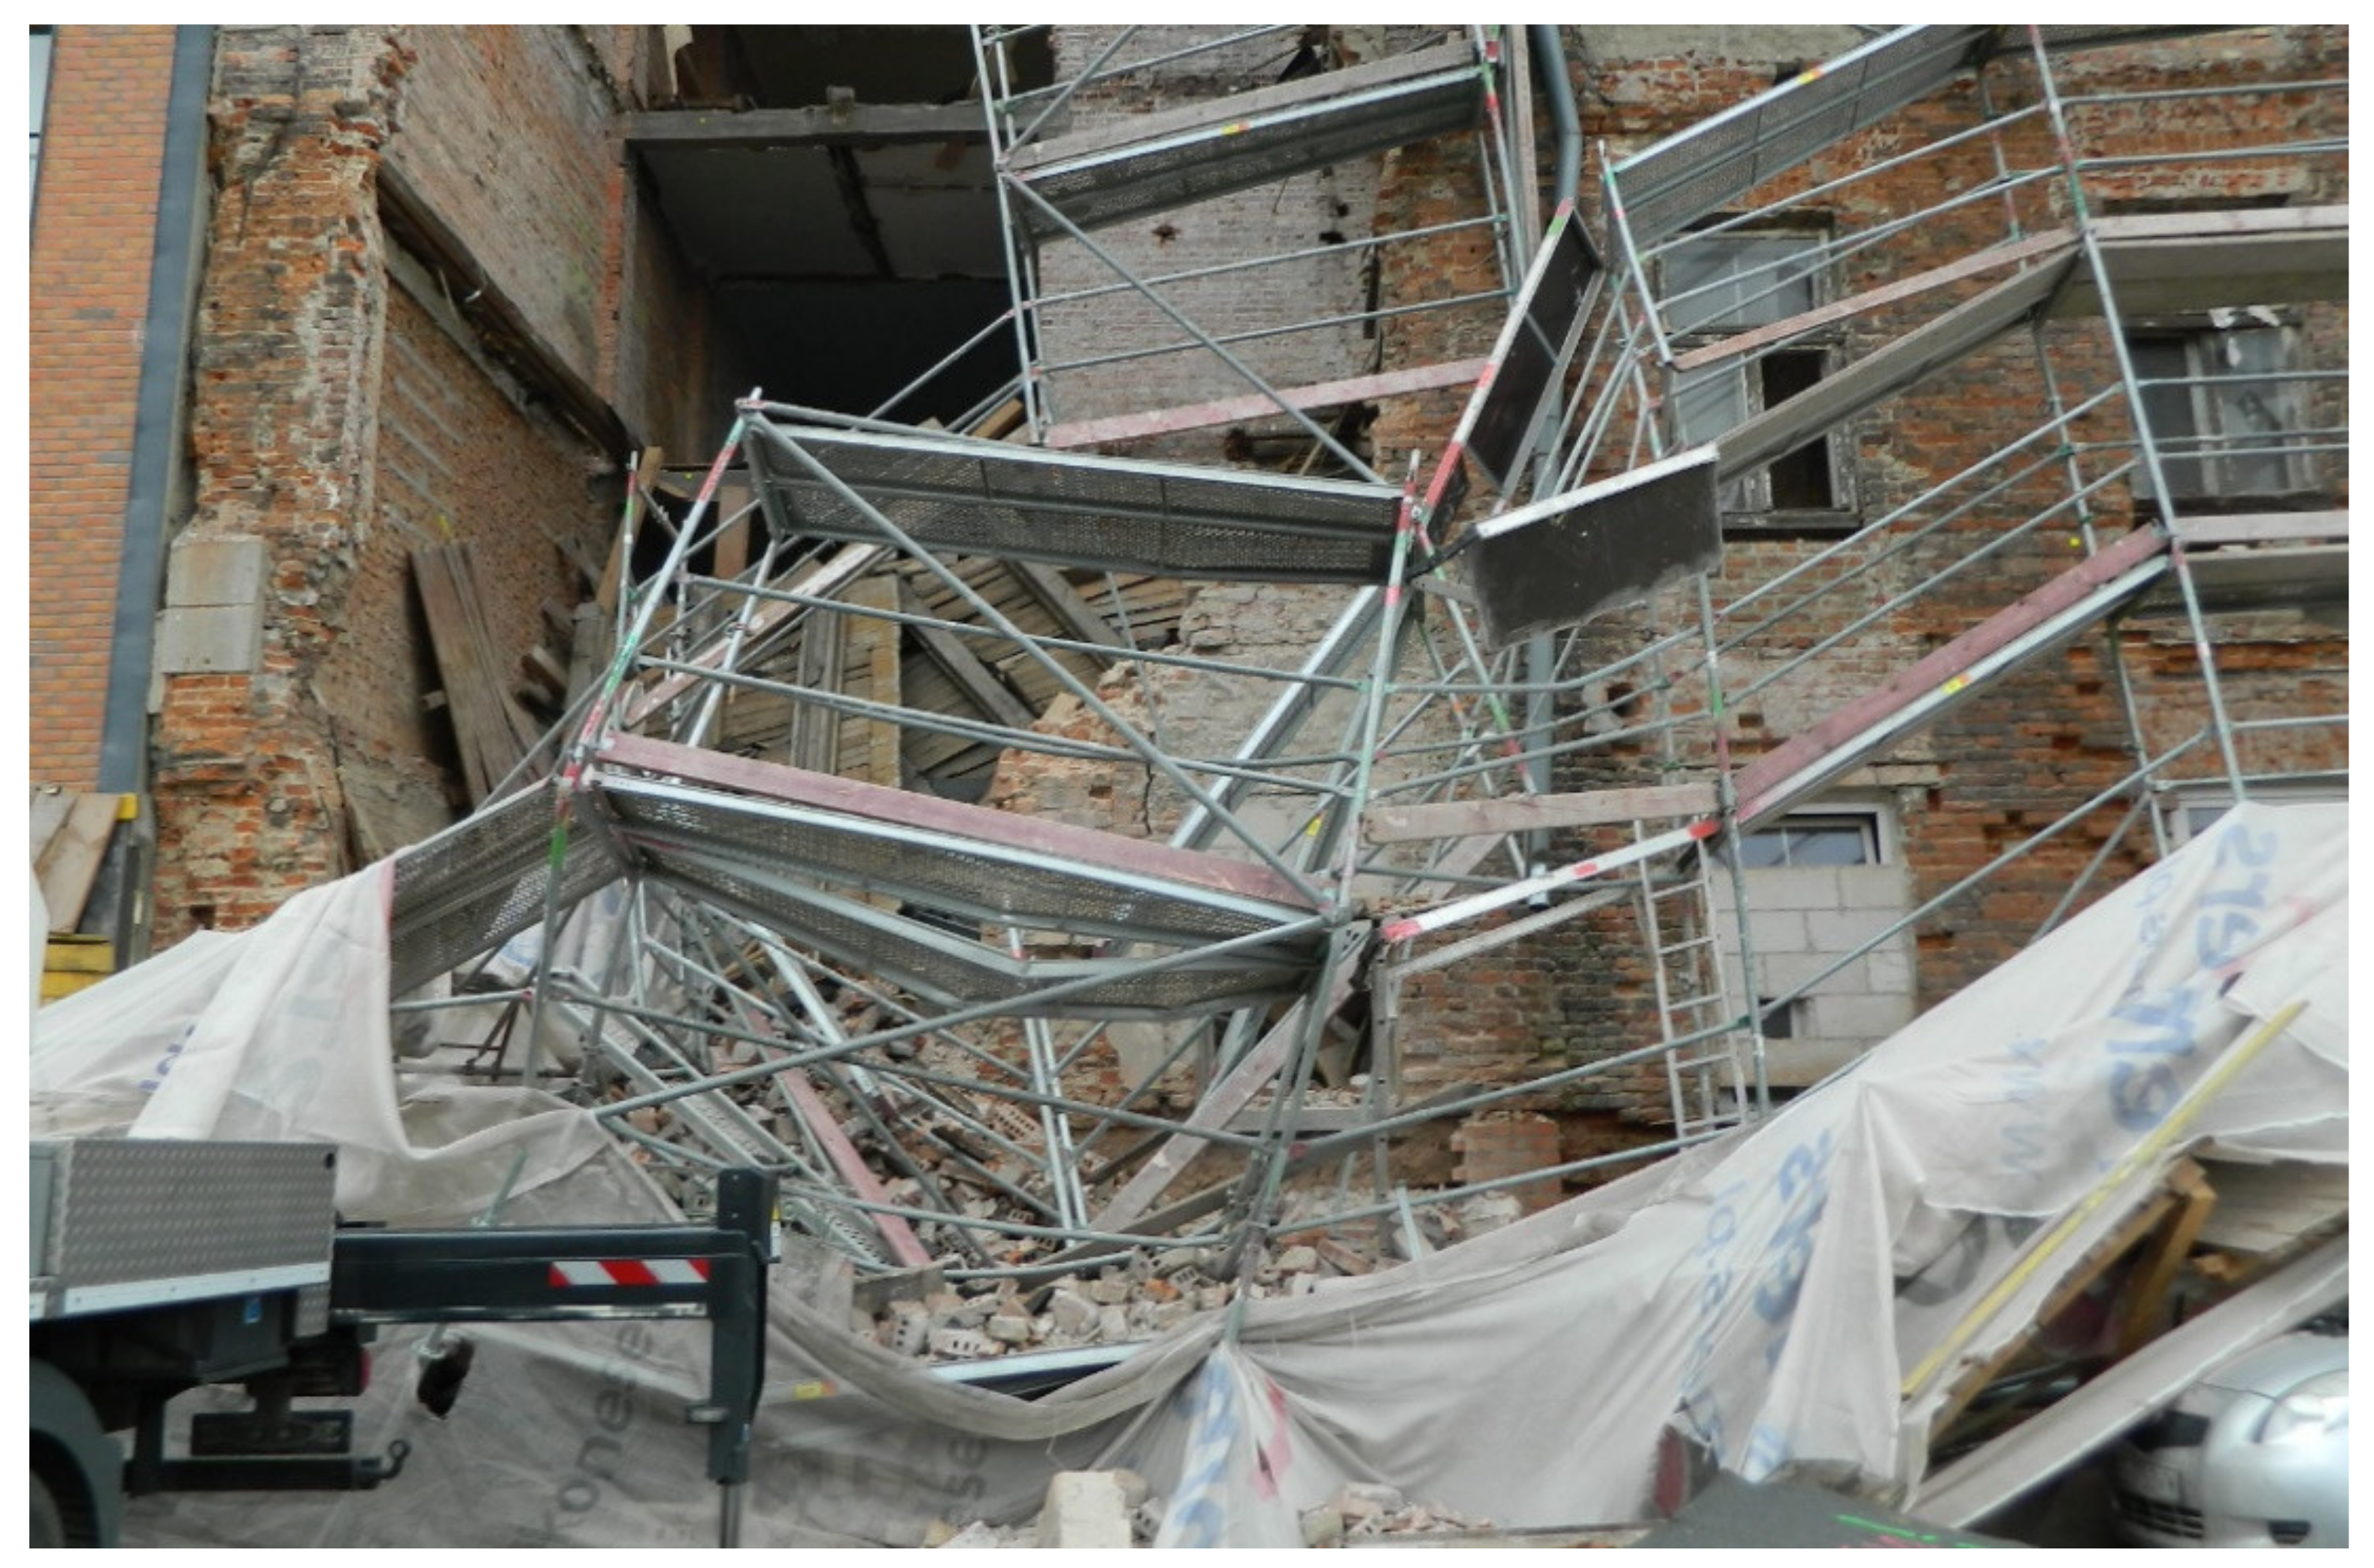
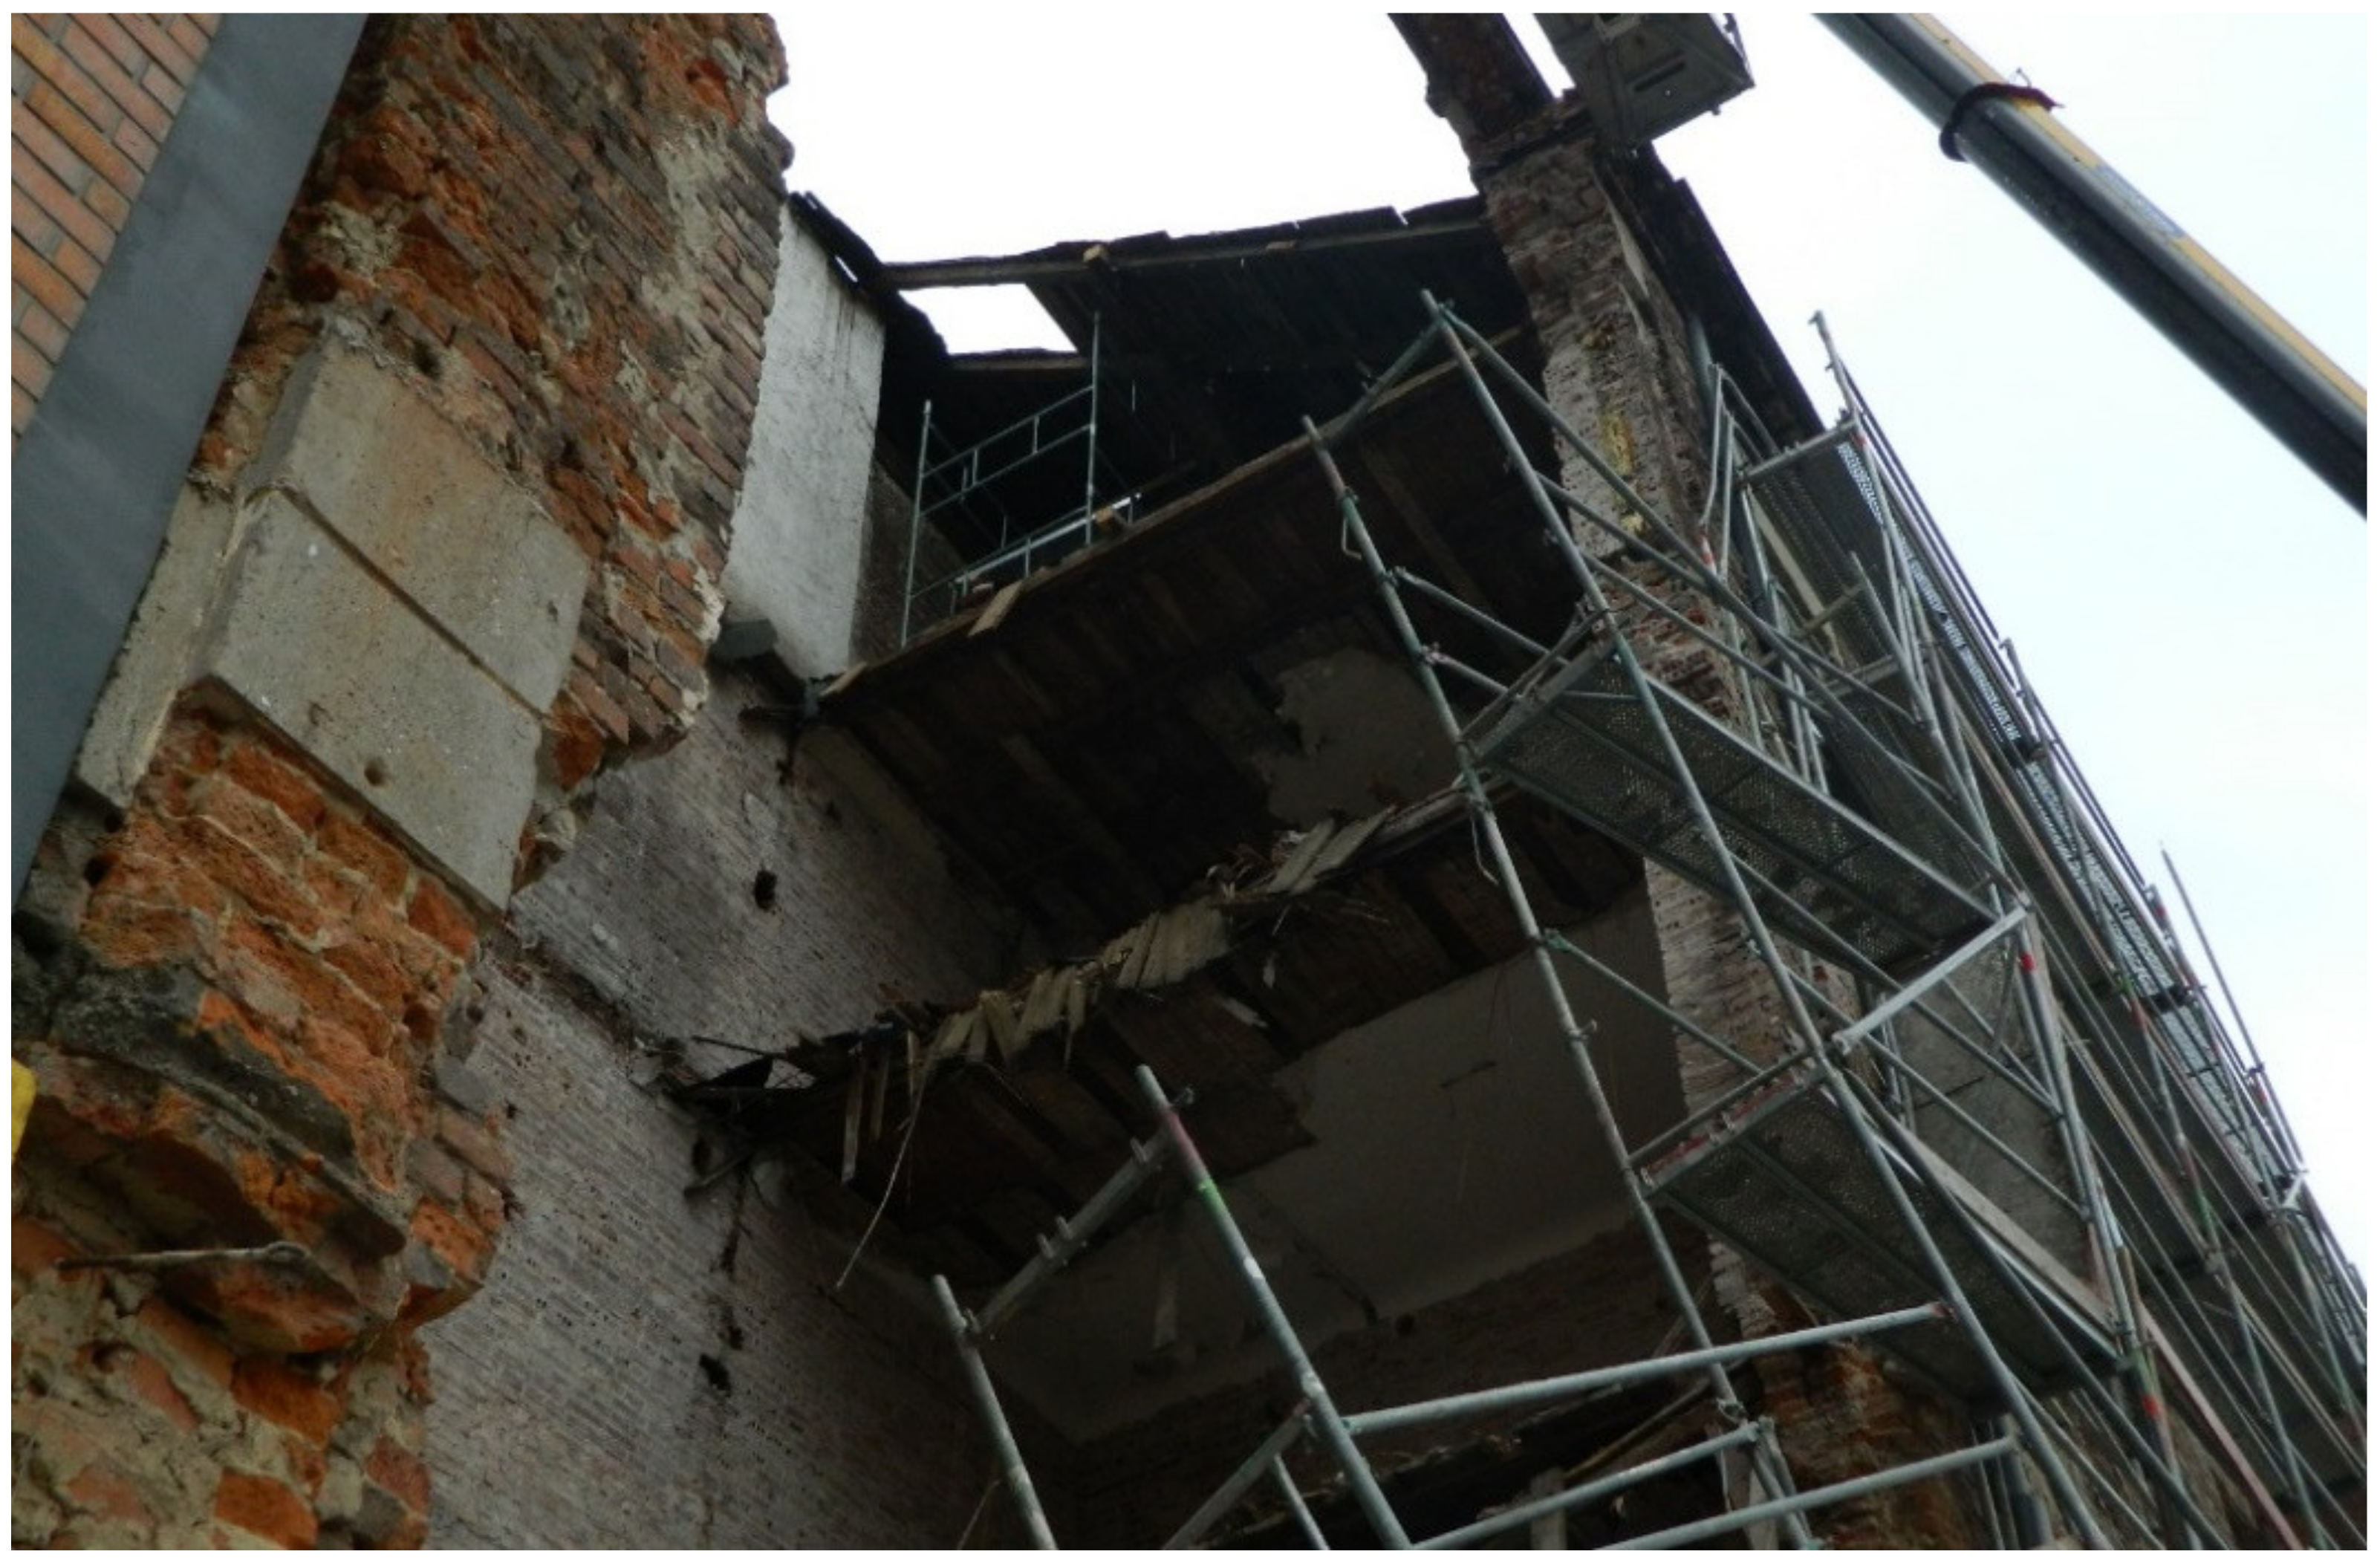
4.2. Structural Collapse

In the morning of 2 June 2017, the floor above the basement collapsed in one of the commercial units (a grocer’s shop). The collapse occurred during the reception of goods. Over 9 m2 of the floor collapsed. Four people fell with the floor into the basement. Fortunately, none were seriously injured. The floor failure is shown in Figure 41.
The collapsed arched floor spanned 3.5 m between the walls. The bearing beam was a steel I-beam I140, and the brick vault supported on that beam had a thickness of 12 cm. The steel beam I140 held loads from the floor, which was 2.15-m wide. The floor was composed of sand bedding with varied thickness ranging from 3 to 12 cm, a cementitious levelling screed 5-cm thick, and ceramic tiles.

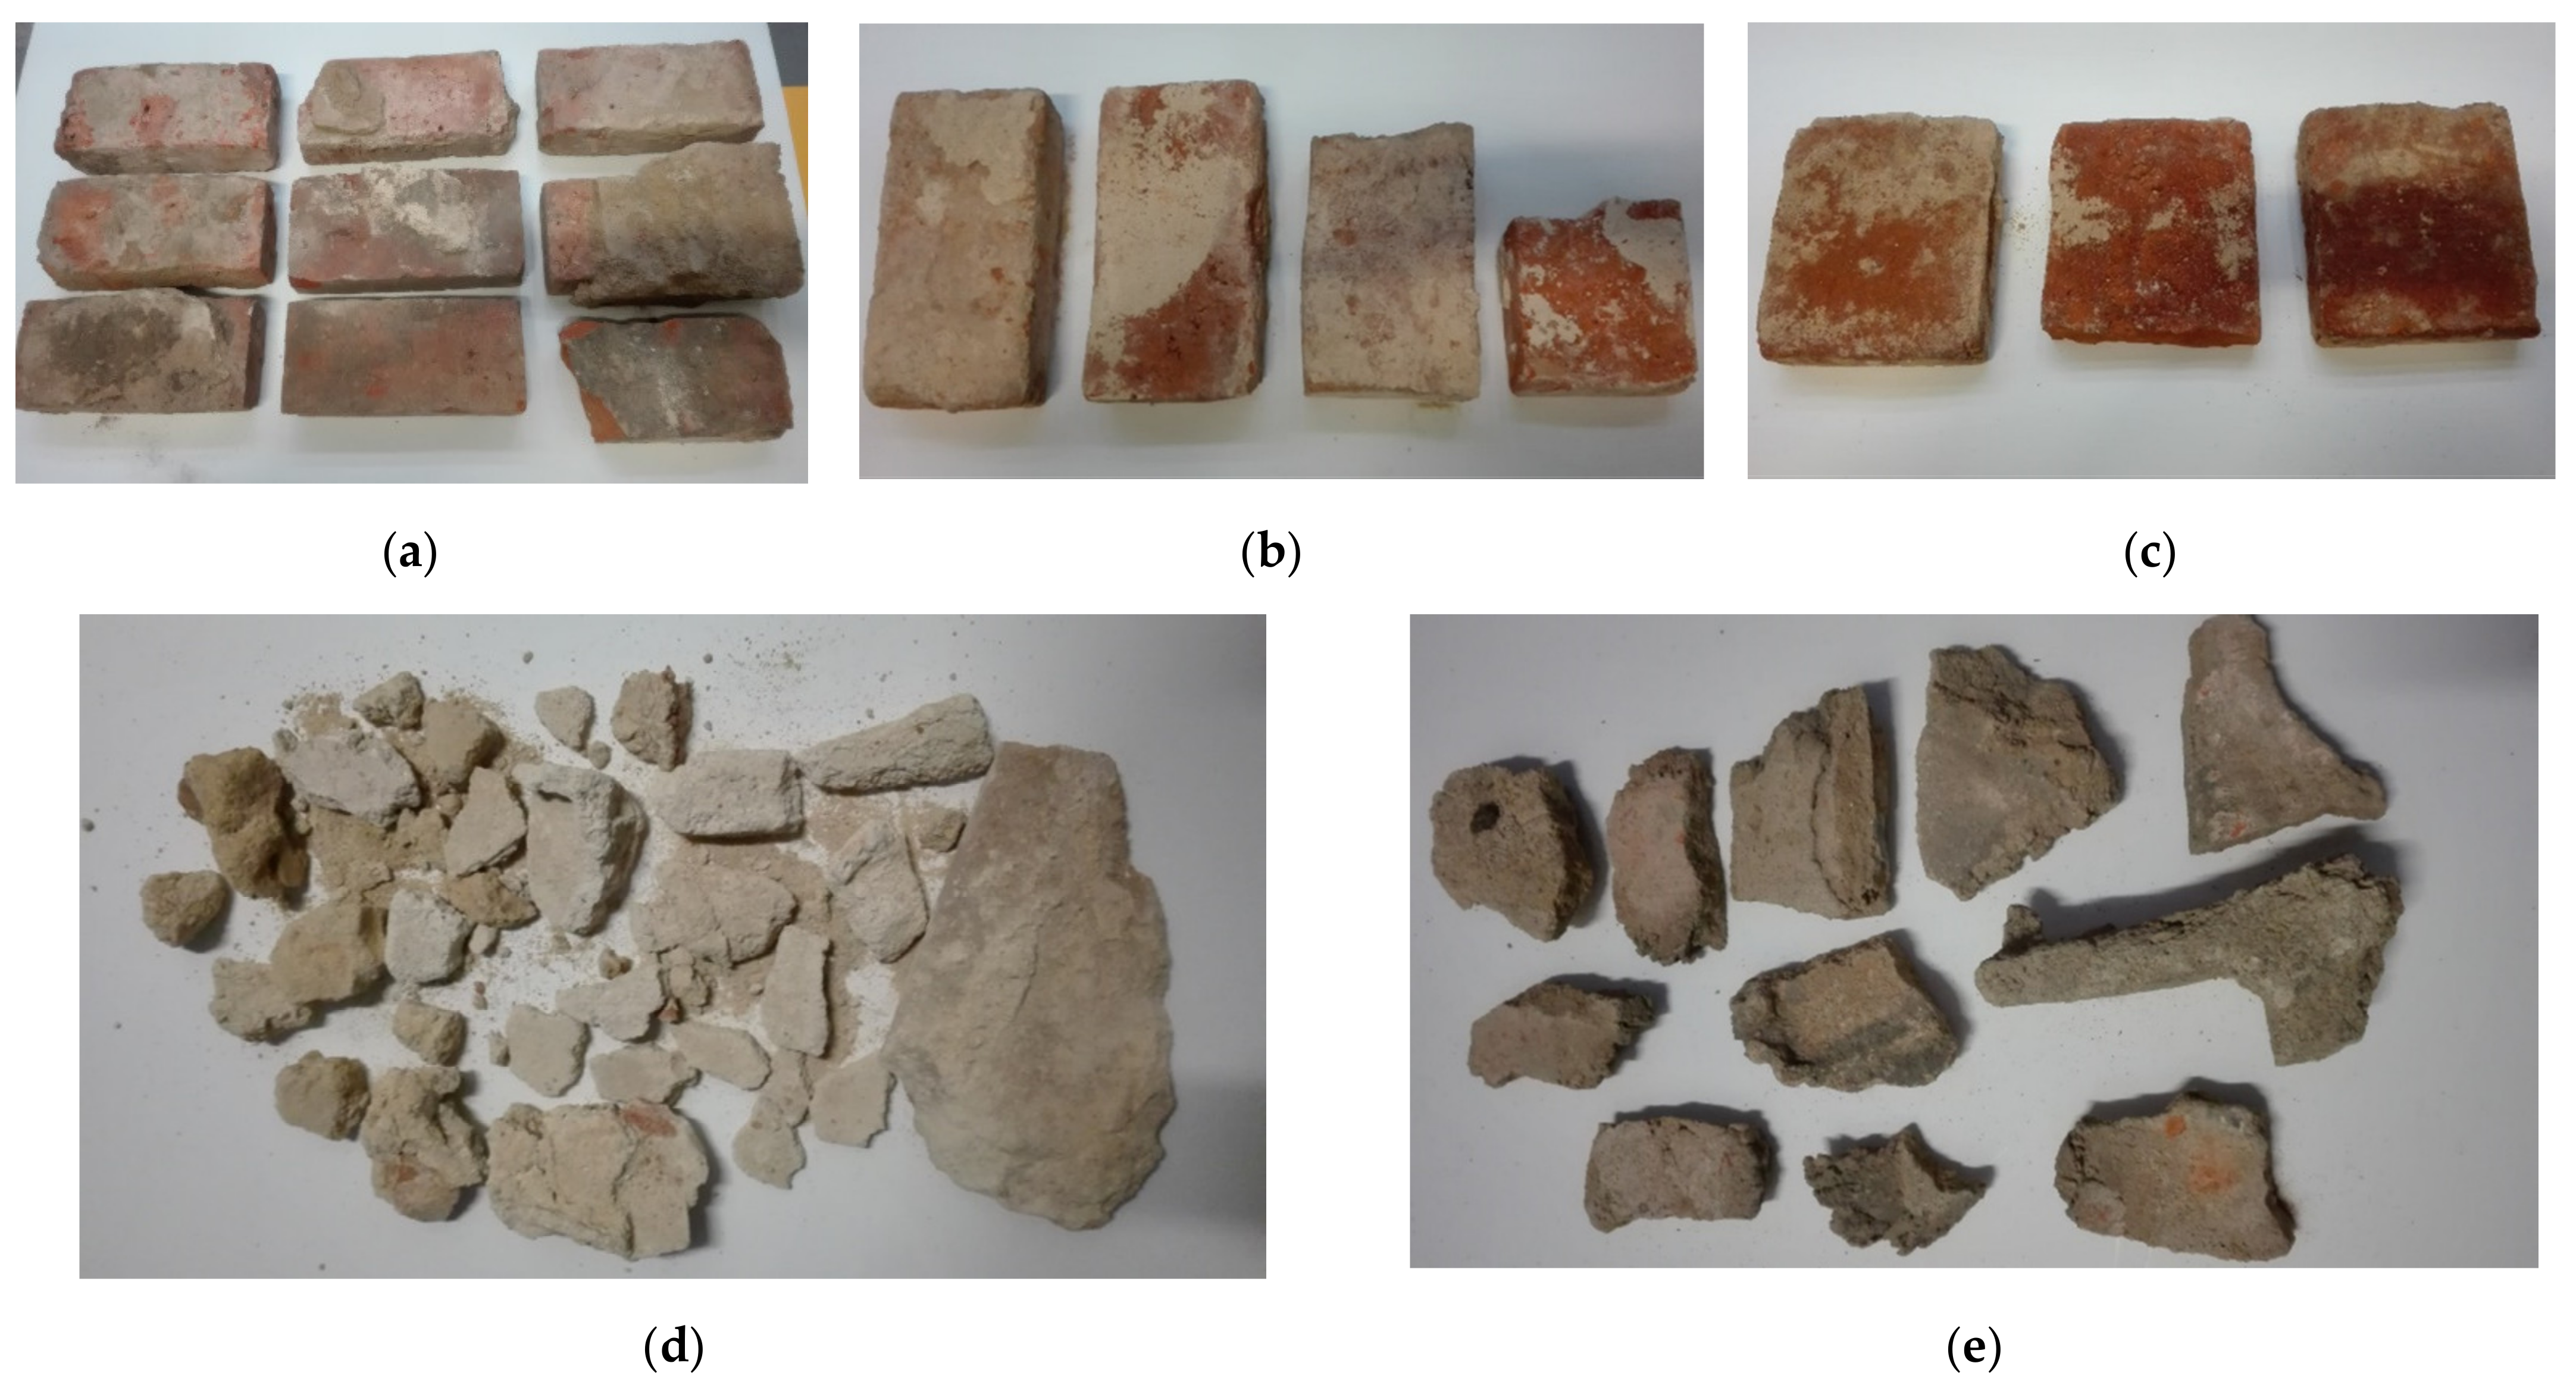
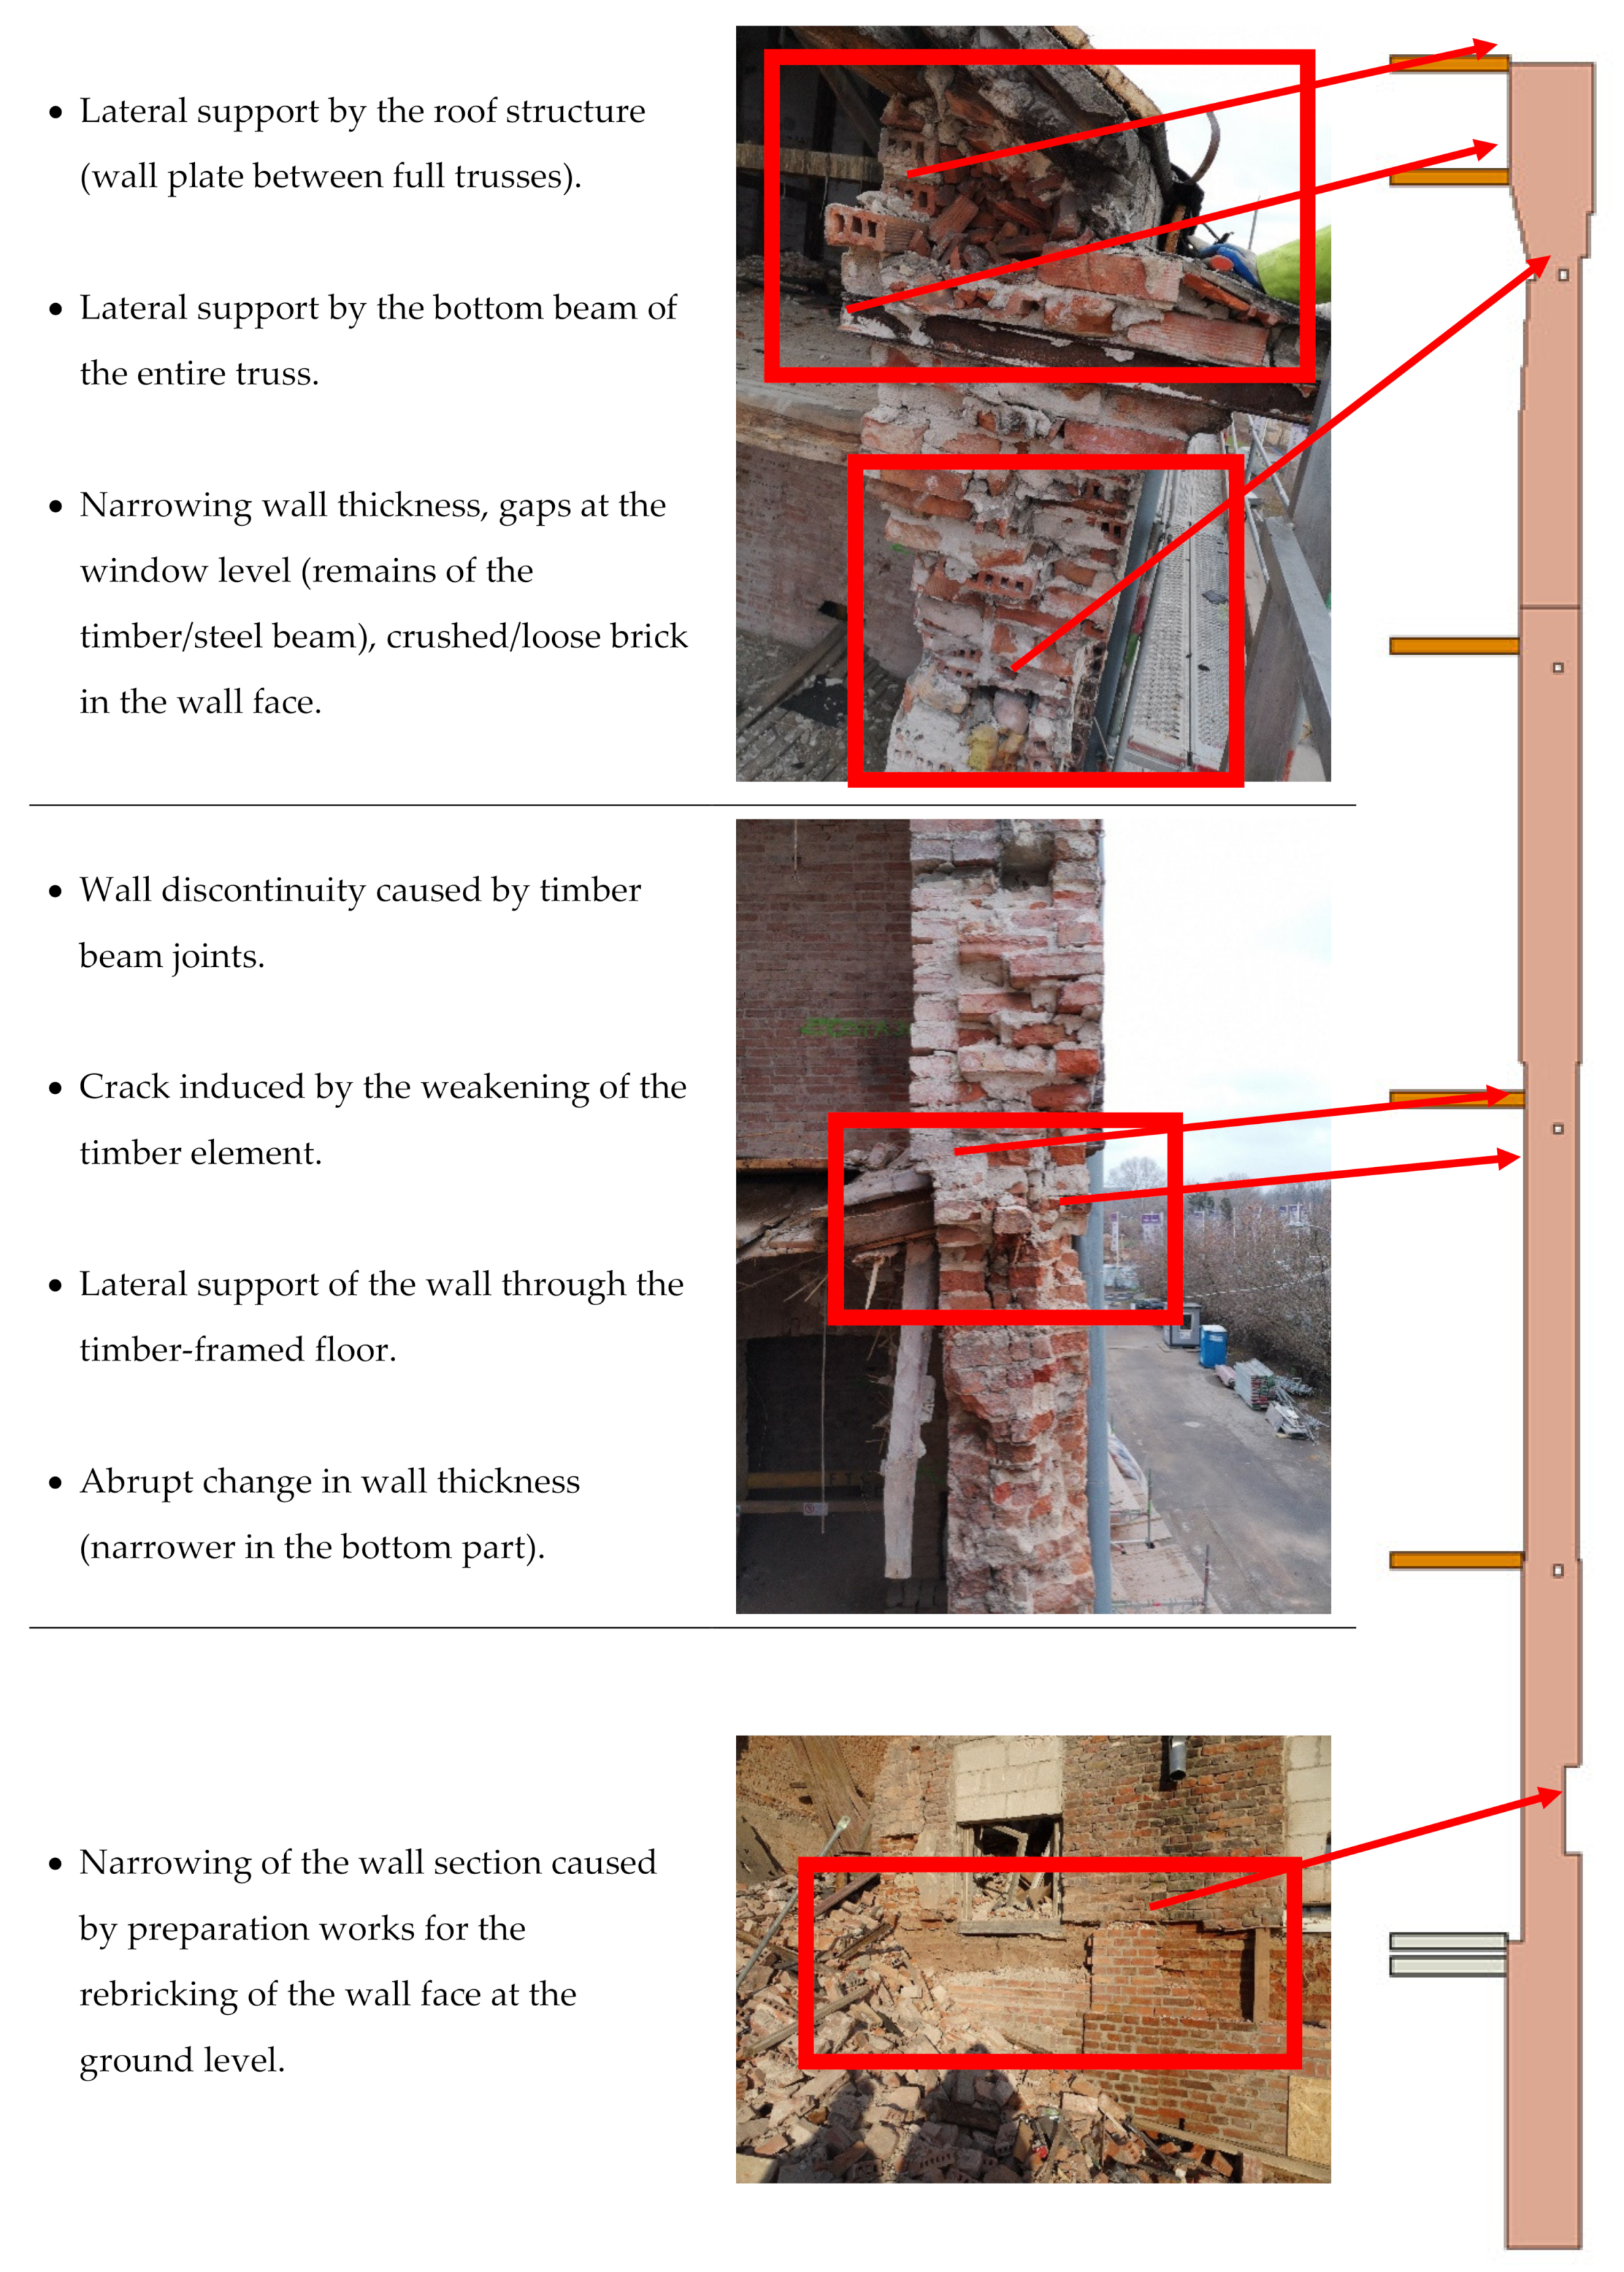
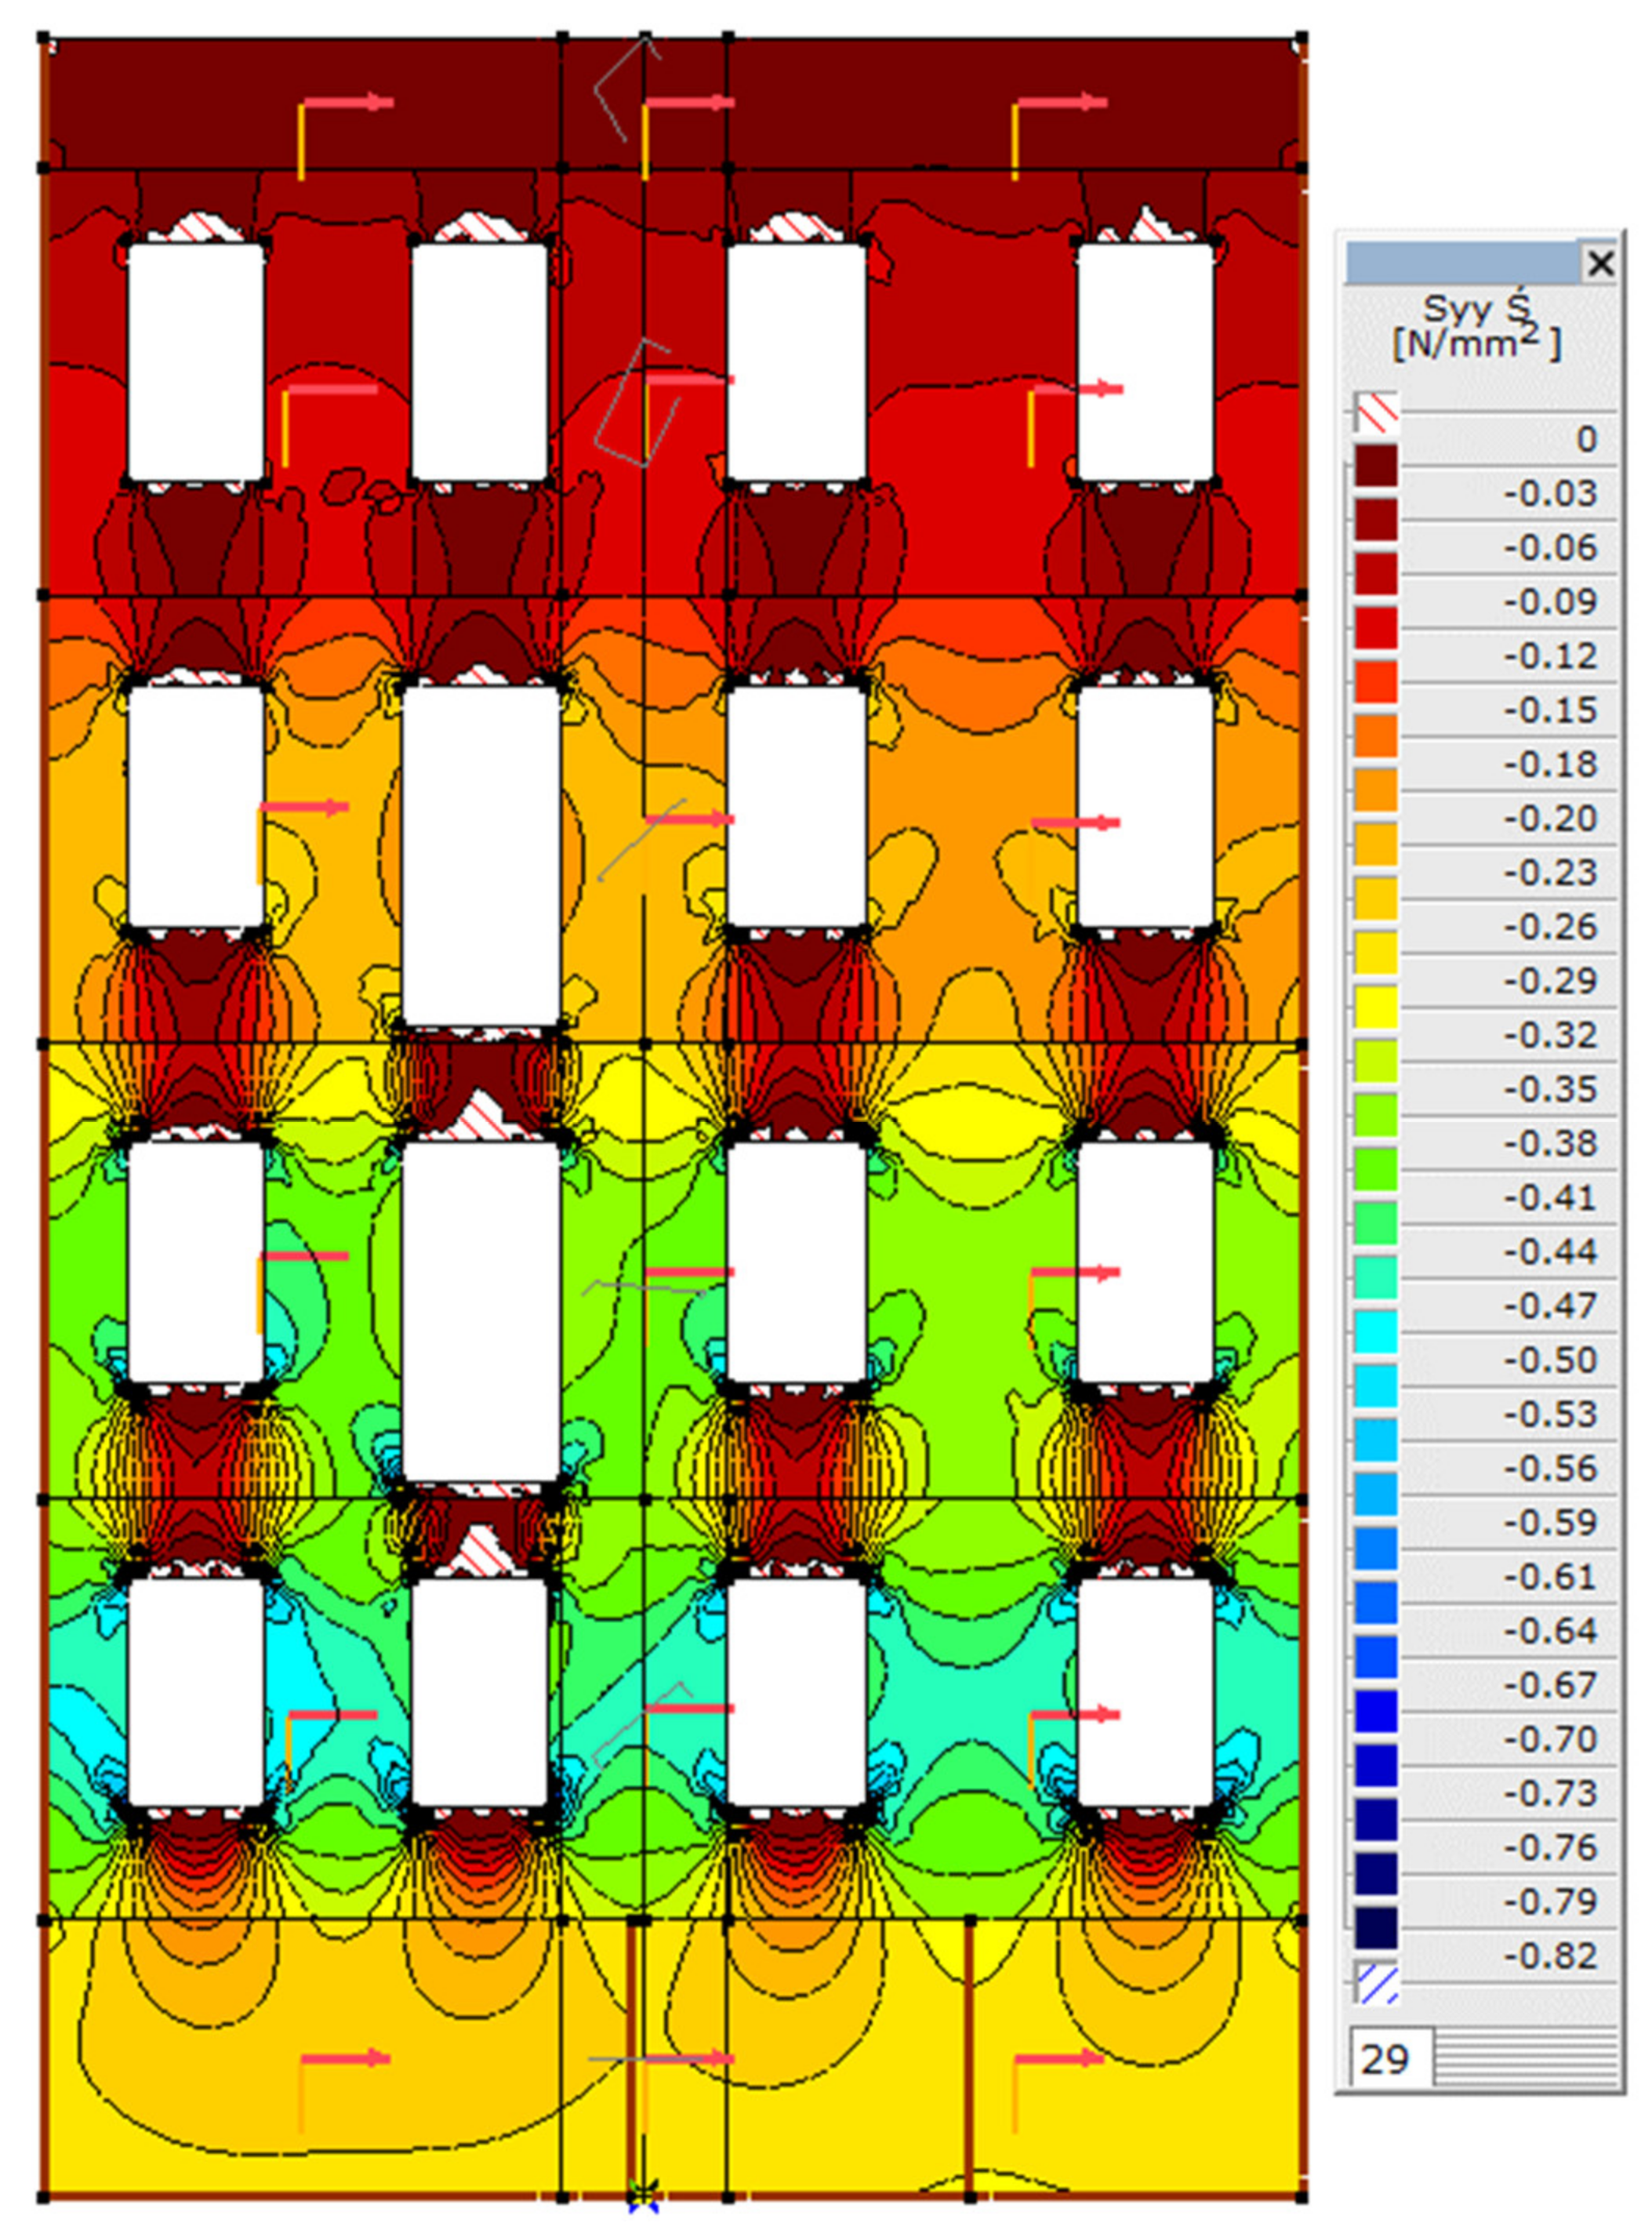
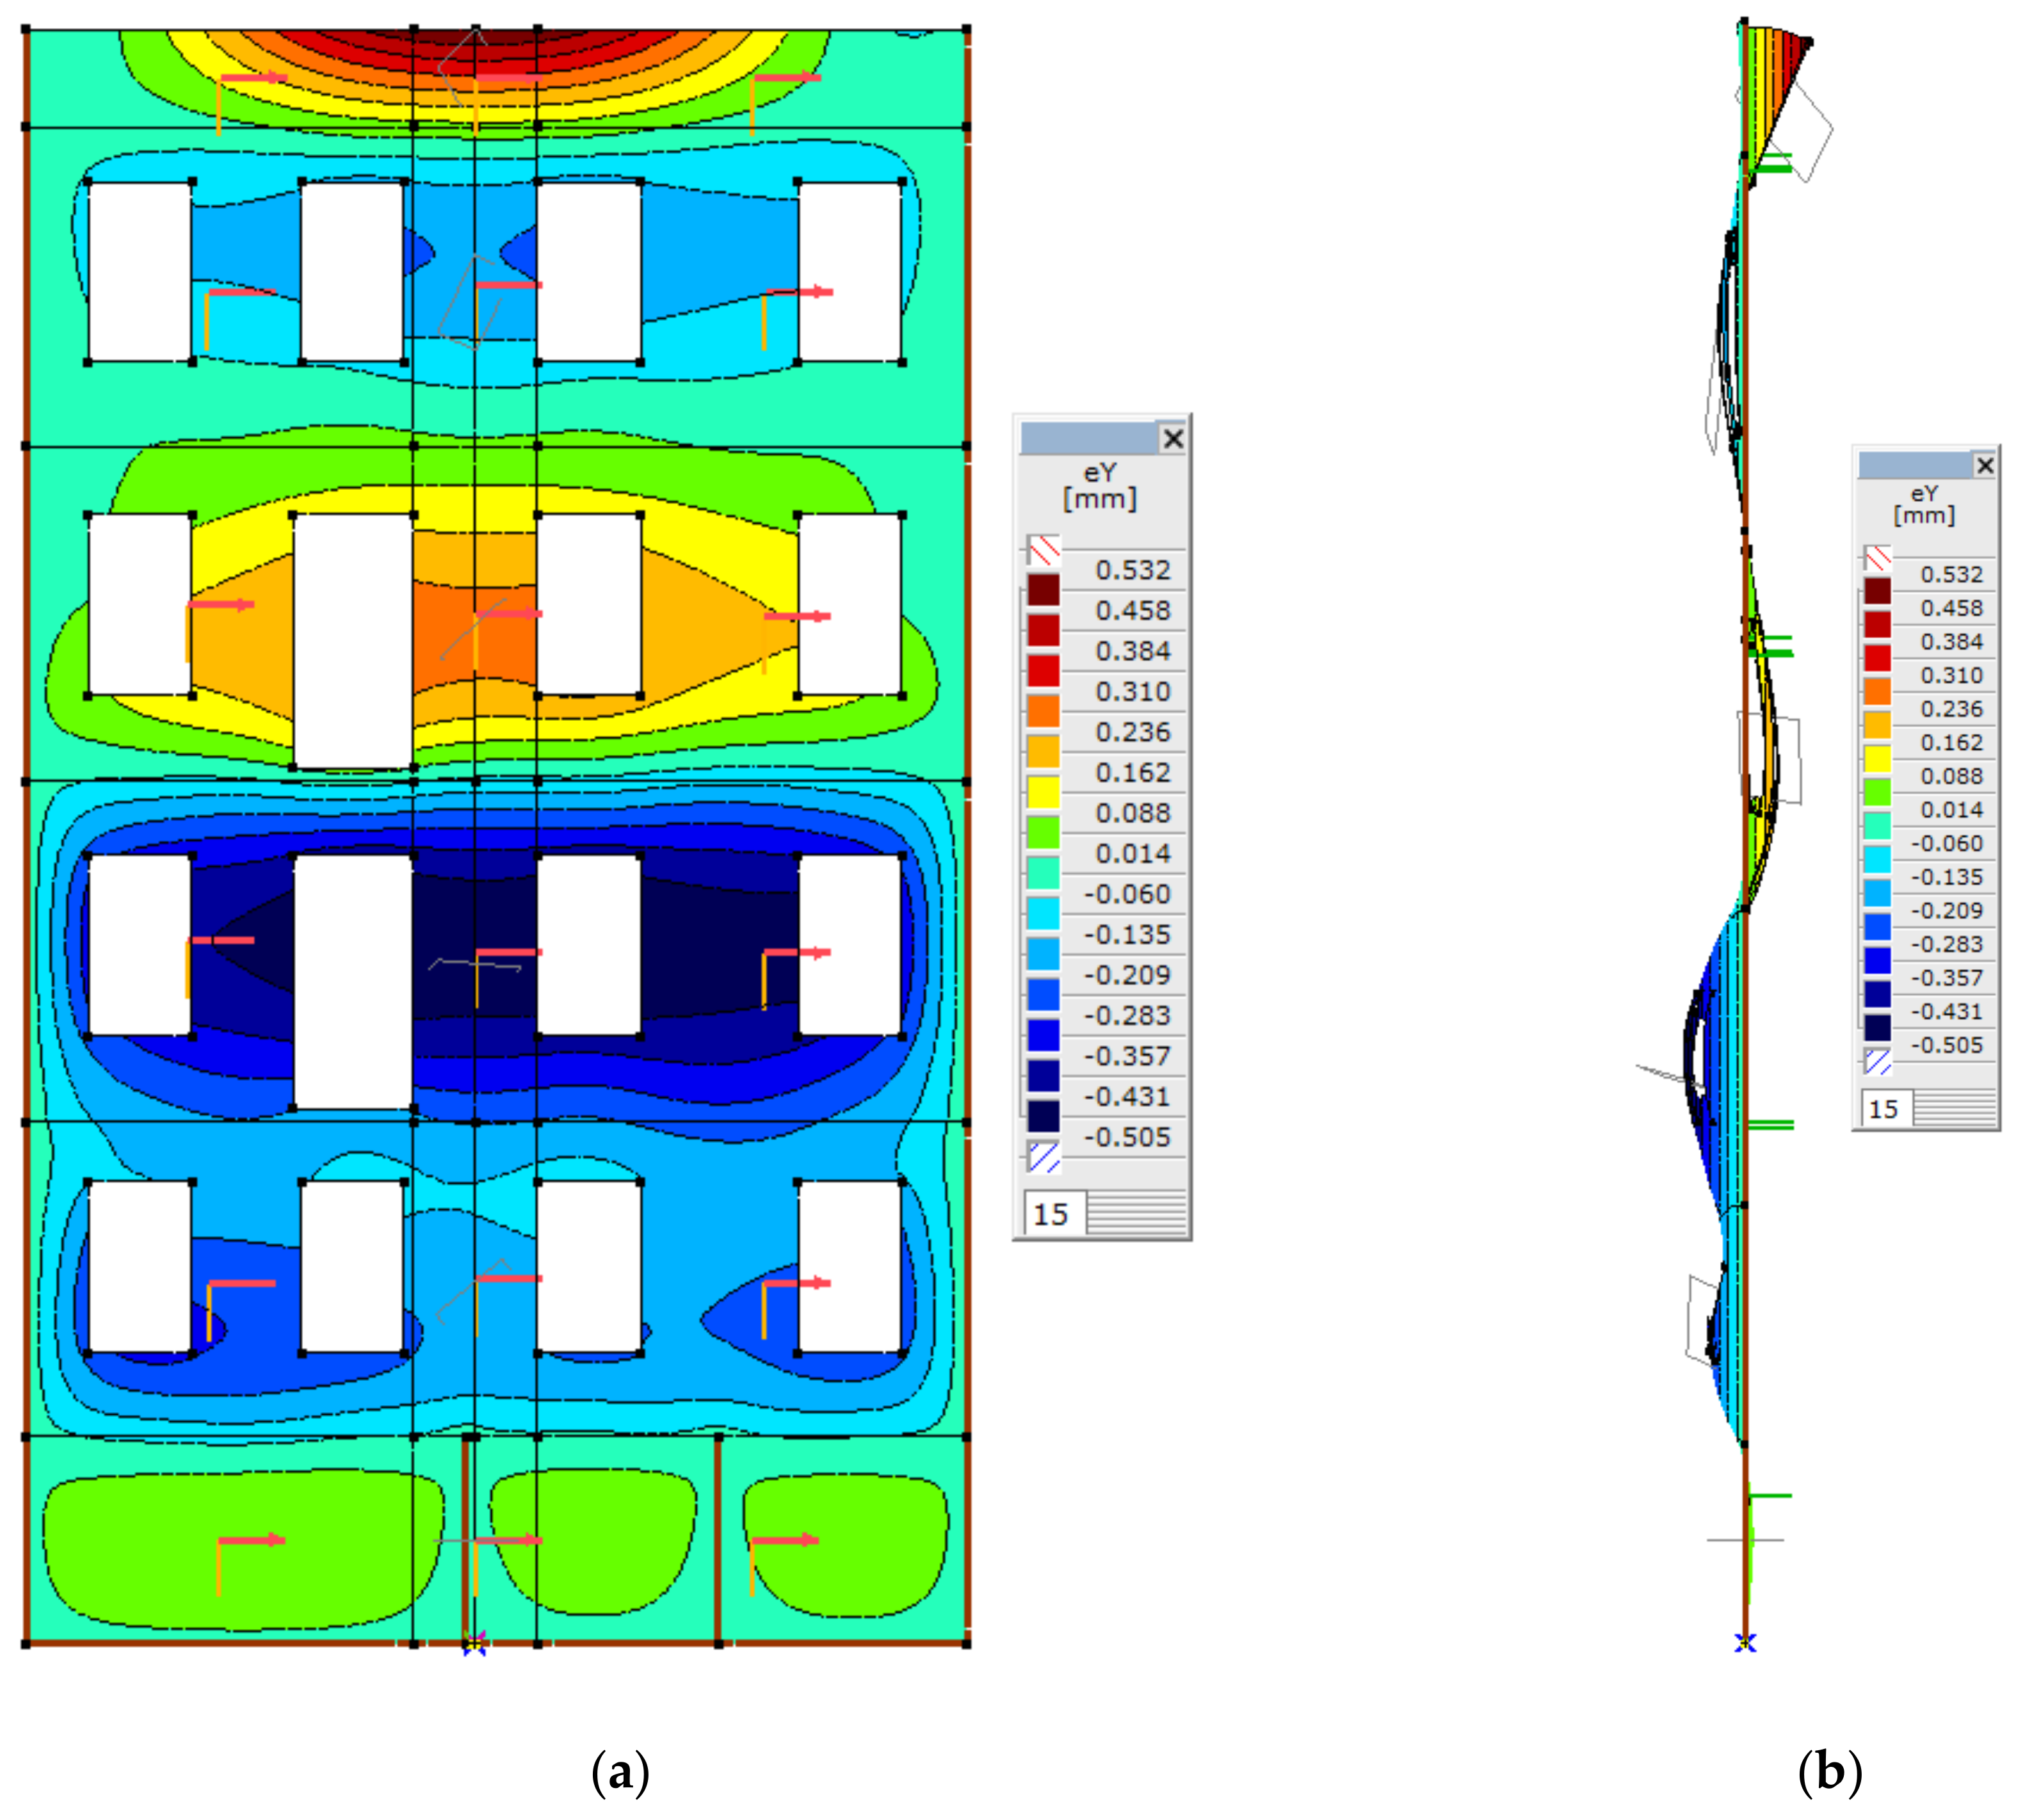
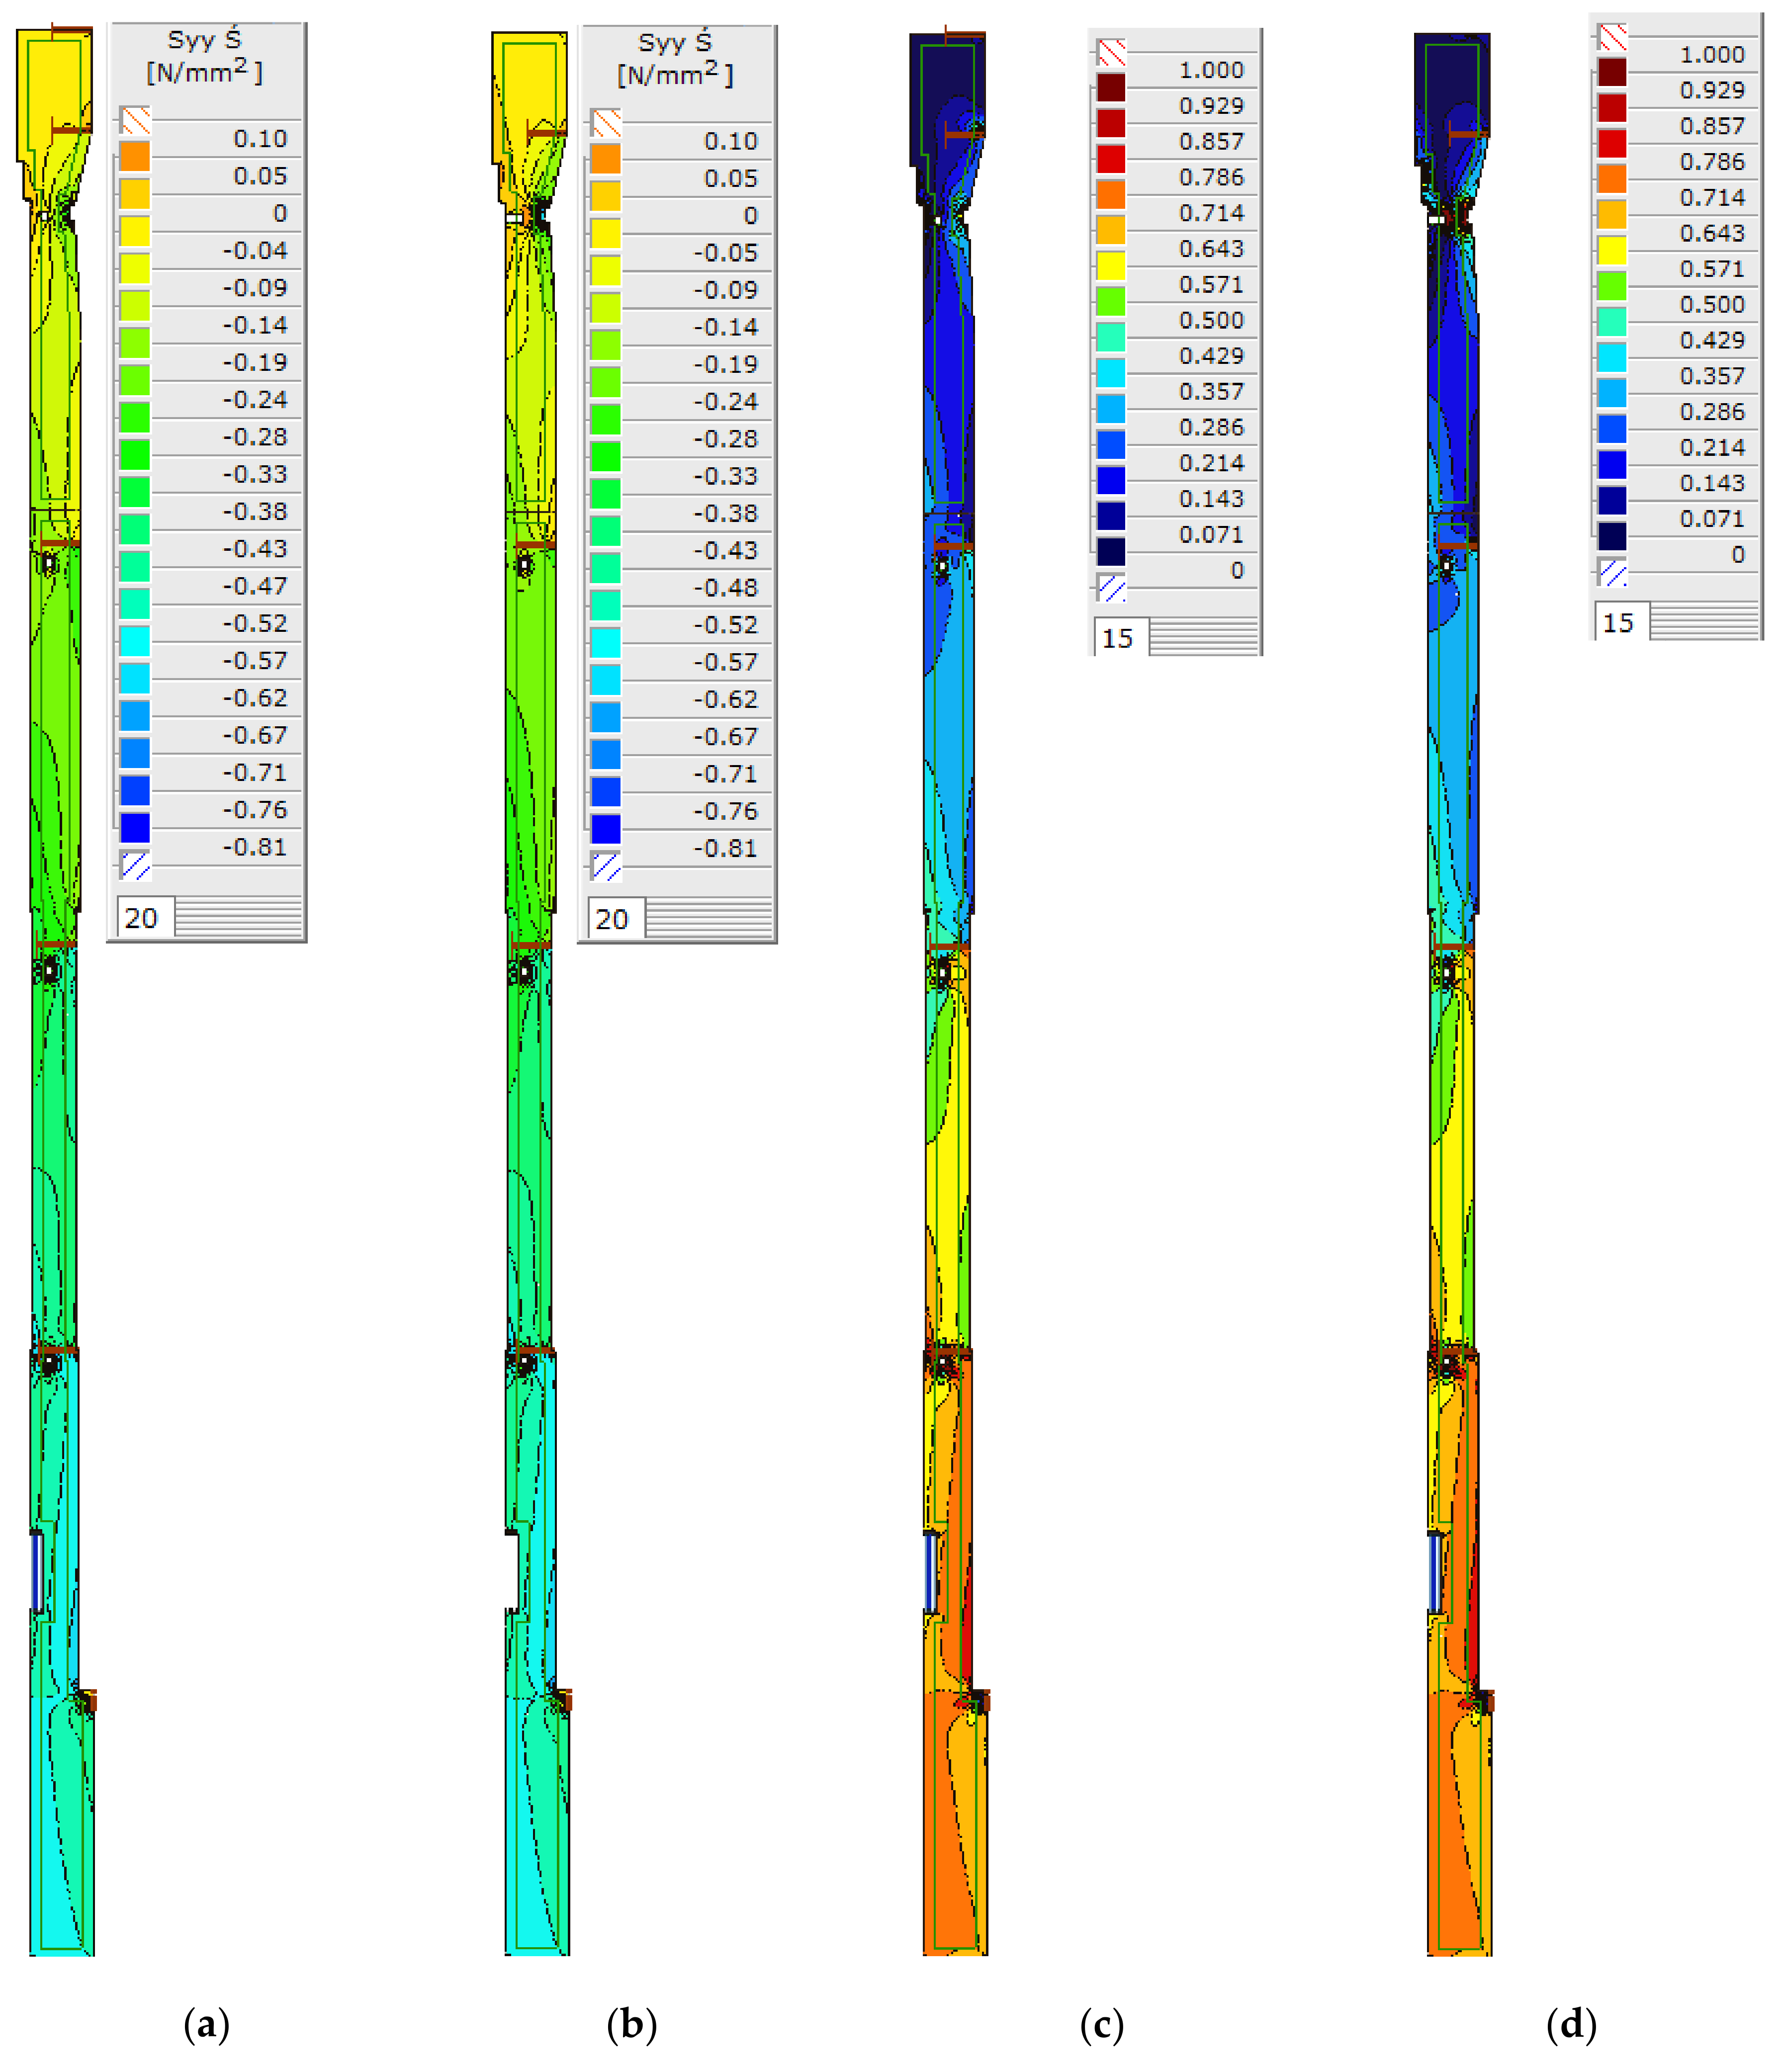
4.3. Tests Performed

Moisture content in the walls of the steel element was tested with the ultrasonic technique. The moisture content in masonry units was assessed via dielectric measurement, using a device with capacitive sensors. The measured range in the brick was 0.2~15%, at an error lower than 2%. The test results are shown in Figure 42. The moisture content in the walls ranged from 19% to a value beyond the measurement range of the device (>20%).
It is generally accepted that a wall is dry when its moisture content does not exceed 2.5%. Slightly damp walls are within the range of 2.5~5%. When the moisture content ranges from 8% to 12%, walls are seriously damp, requiring quick drying. Wet walls, with a moisture content above 12% (e.g., after a flood), require immediate drying. The performed measurements indicated moisture contents above 19%.
The thickness of the steel beam was measured with the ultrasonic technique. The employed device had a head with a measuring frequency of 5 MHz and a measurement range of 2.5–100 mm. Due to the presence of this head, the measurements were performed via the echo-to-echo technique, which did not take into account the protective coating or corrosion. The tests were conducted on a few points of the steel beam, including the collapsed area. The main issue was the narrowing of the web to 3.1 mm (Figure 43).
The results tables show that the I-beam I140′s web thickness was 5.7 mm, and the flange thickness, measured at a distance of 16.5 mm from its edge (here, the ultrasonic technique was applied), was 8.6 mm. The thickness in the central area was reduced due to corrosion to 37% for the web and 19% for the flange. The tests performed on the support area indicate a drop in the thickness by 46% for the web and 33% for the flange.

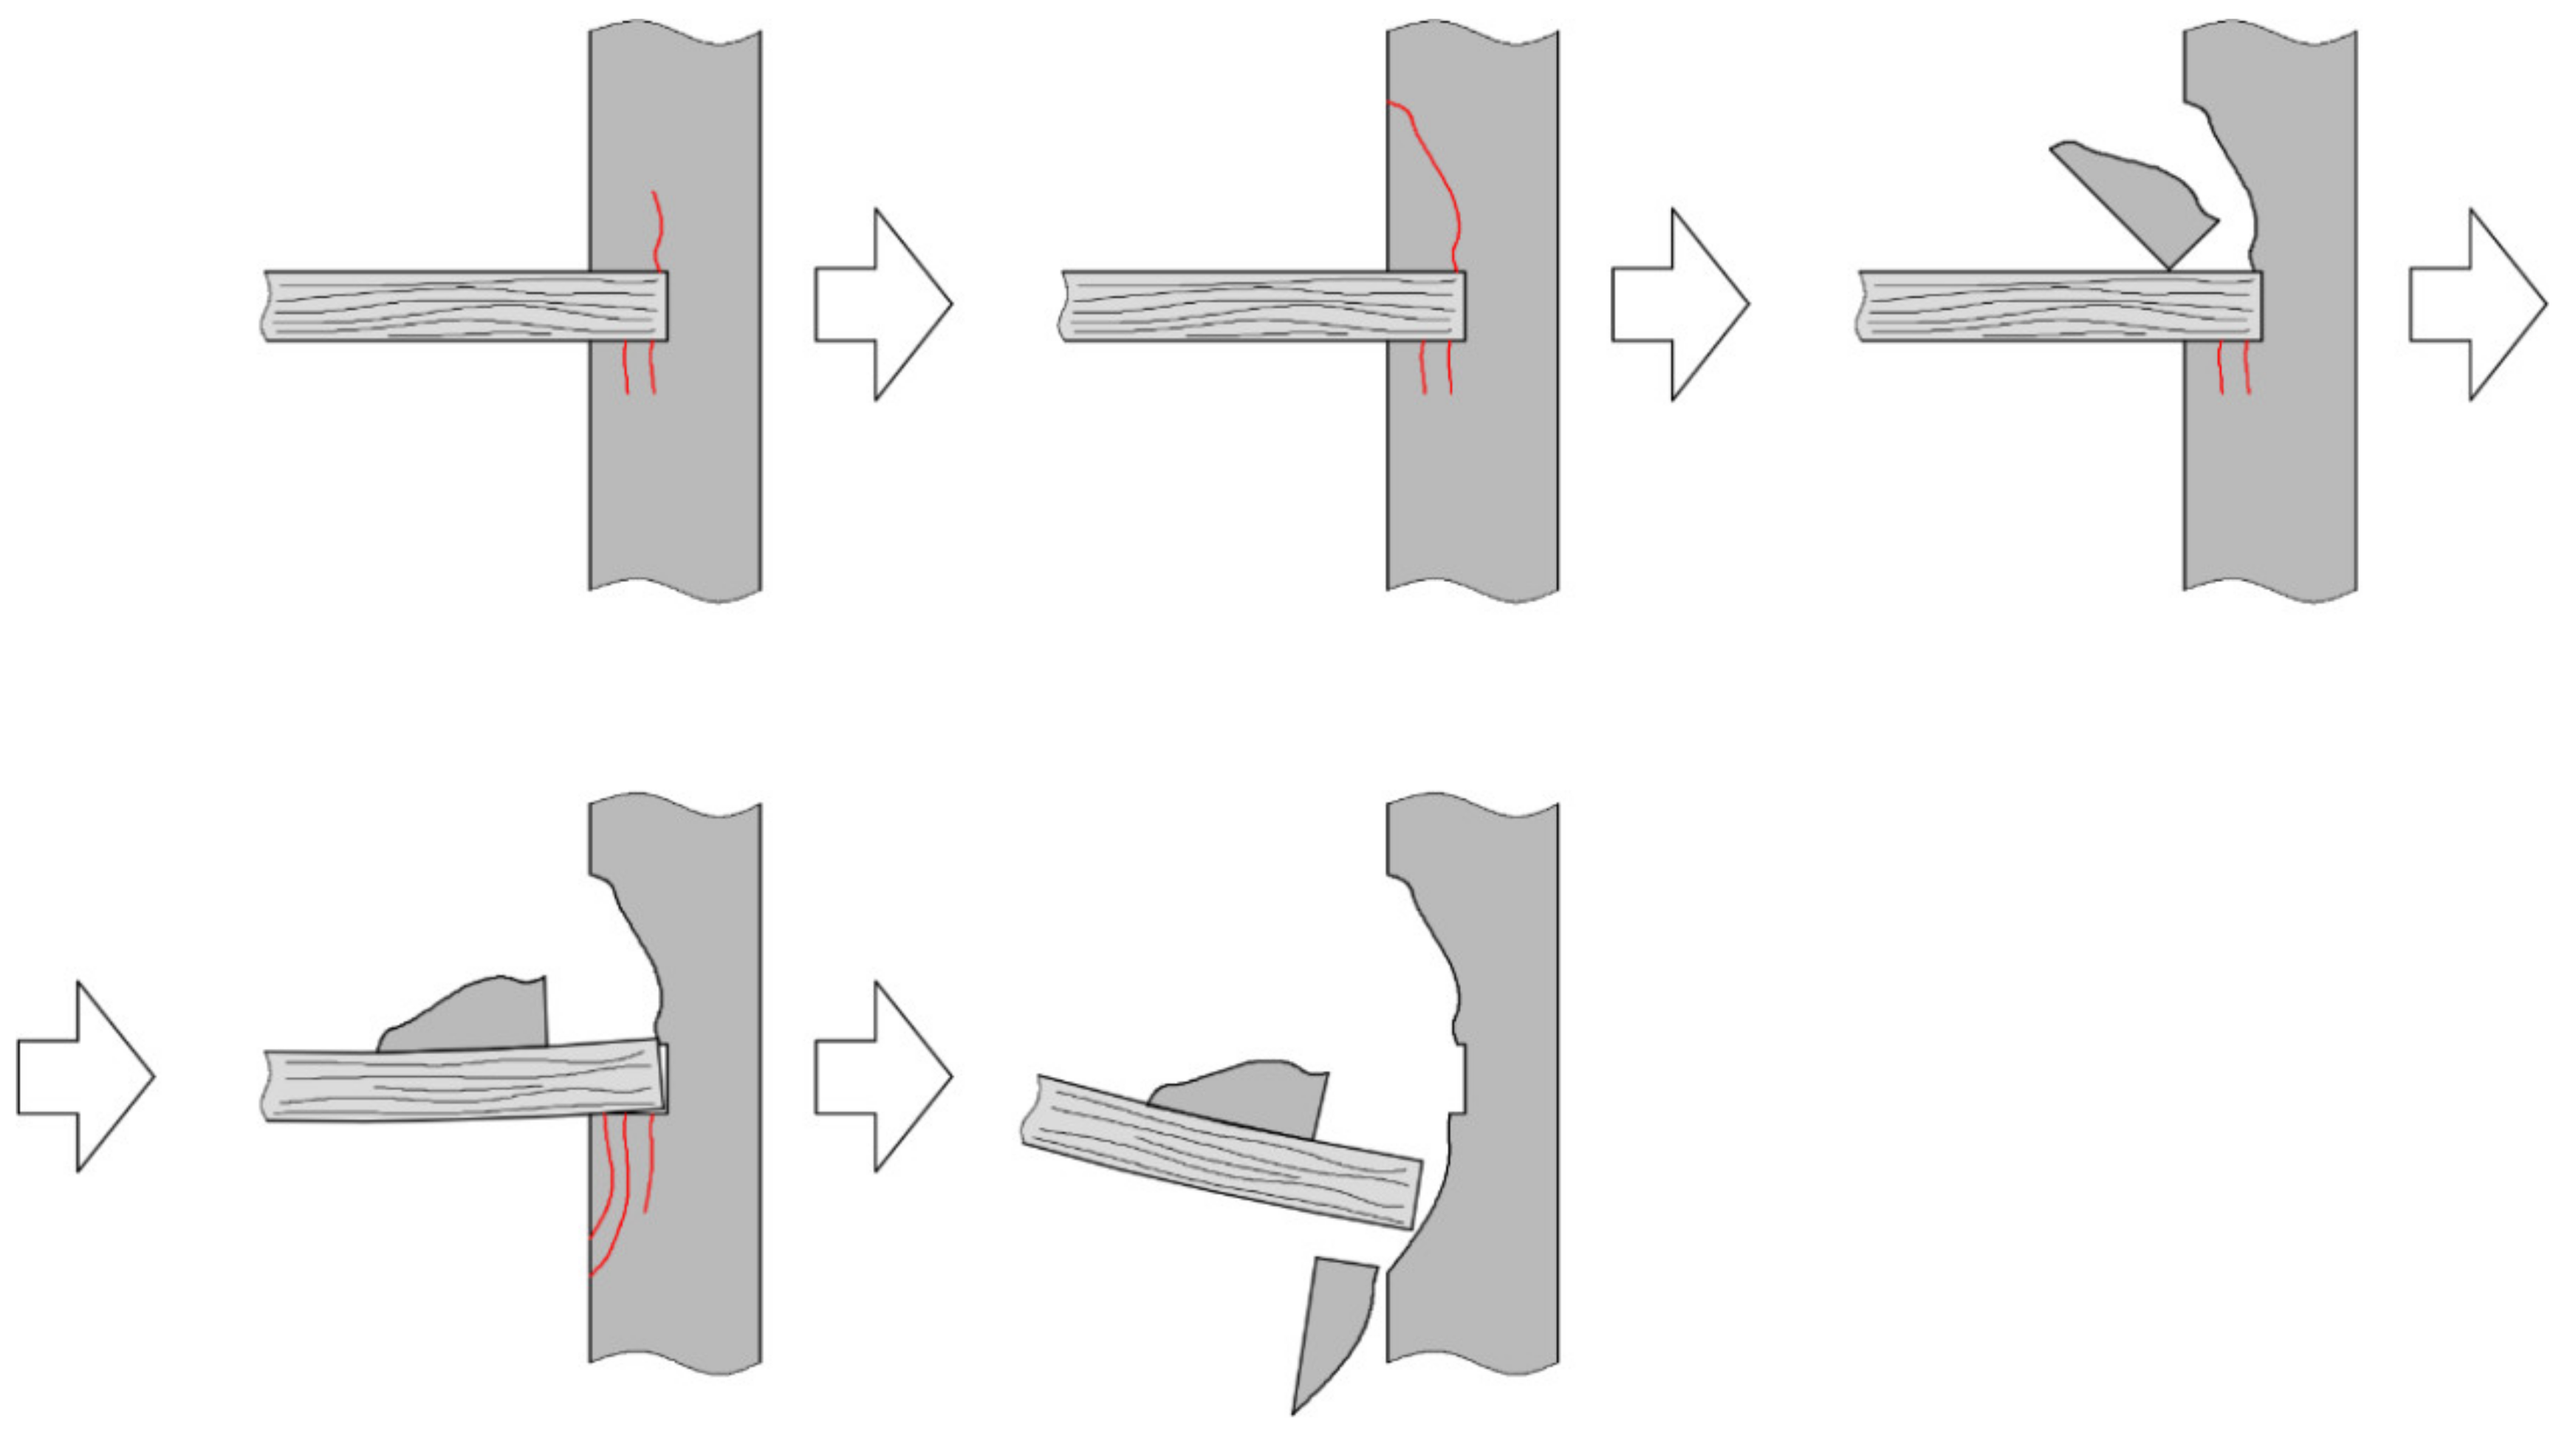
4.4. Collapse Causes

The collapse was caused by the overloading and poor conditions of the corroded steel beam. The collapse developed in two stages. Stage 1 was shearing, and in stage 2, the floor collapsed as the beam—without any support on one side—bent (Figure 44). Details of the beam failure are illustrated in Figure 45.
The verifying structural calculations were conducted in accordance with the standard EN-1993-1-1 [32]. Loads were determined after the field inspection. The main loads were heavy refrigerators located above the supports. The unloading area was also located above the support. This load arrangement determined the collapse. If the load were evenly distributed (verified by calculation), failure could only occur due to beam bending at the center of the span. If there had been no corrosion damage, the bearing capacity rate (determined by characteristic loading) would be 99% for bending and 45% for shearing. Having considered the reduced thickness of the section, the shear bearing capacity rate was 102% in the support area, and the bending bearing capacity rate was 120% in the central area. Thus, the beam failure should have been caused by bending, and not shearing. The shear could have been caused by local loosening of the masonry units and a higher moisture content in the vaults in the support area. The property manager was responsible for this collapse, as his failure to perform necessary repair works led to the severe moisture content in the basement walls and the corrosion of the leading steel beam. The location of heavy equipment and the goods receiving zone near the support significantly contributed to the occurrence of shear (Figure 46) failure rather than bending in the steel beam.

5. Conclusions

This paper presents three cases of structural collapse, each of which were caused by errors made at different stages of the construction process: during the design of renovation works, during the repair works, and during building maintenance. The reasons for the discussed damage have been specified, and verifying structural calculations were conducted. It is imperative to determine the exact reasons for structural collapse so as to prevent such cases in the future. Each structure should be analyzed individually. Proper test and computational methods should be employed for each case. Each of the described cases had a defect, but these defects were not located in the main structural element or the entire construction. Renovation errors—even in secondary elements, such as the narrowing of the cornice wall, or improper or no support of the ceilings (despite their unloading)—may lead to severe collapses. Renovation works must focus on the identification of hidden structural features, such as the homogeneity of the wall or the conditions of steel elements connected with brick vaults. Equally, treatment is the wrong approach to renovation when it does not take into account the features of the object. Design companies inexperienced in such activities often overlook the critical renovation stage.
This article aimed to address collapses caused by secondary structural elements. In the context of renovating objects, the structures of which increasingly differ from current standards, there is a significant knowledge gap regarding the rules according to which the objects were made. Accurate and detailed descriptions of cases, such as those presented in the article, are essential to determining the primary and secondary elements of a structure that should be identified during renovation works.

Author Contributions

Conceptualization, Ł.D.; methodology, Ł.D.; software, Ł.D., K.G. and J.Z.; validation, Ł.D., K.G. and J.Z.; formal analysis, Ł.D., K.G. and J.Z.; investigation, Ł.D.; writing—original draft preparation, Ł.D., K.G. and J.Z.; writing—review and editing, Ł.D., K.G. and J.Z.; visualization, Ł.D., K.G. and J.Z.; supervision, Ł.D., K.G. and J.Z. All authors have read and agreed to the published version of the manuscript.

Funding

The publication was financed by the Department of Building Structures at the Silesian University of Technology.

Conflicts of Interest

The authors declare no conflict of interest.

References

  1. Borri, A.; Corradi, M. Architectural Heritage: A Discussion on Conservation and Safety. Heritage 2019, 2, 631–647. [Google Scholar] [CrossRef] [Green Version]
  2. Cardani, G.; Belluco, P. Reducing the Loss of Built Heritage in Seismic Areas. Buildings 2018, 8, 19. [Google Scholar] [CrossRef] [Green Version]
  3. Nowogońska, B. Consequences of Abandoning Renovation: Case Study—Neglected Industrial Heritage Building. Sustainability 2020, 12, 6441. [Google Scholar] [CrossRef]
  4. Du, F.; Okazaki, K.; Ochiai, C.; Kobayashi, H. Post-disaster building repair and retrofit in a disaster-prone historical villageinChina: A case study in Shangli, Sichuan. Int. J. Disaster Risk Reduct. 2016, 16, 142–157. [Google Scholar] [CrossRef]
  5. Ruggiero, G.; Marmo, R.; Nicolella, M. A Methodological Approach for Assessing the Safety of Historic Buildings’ Façades. Sustainability 2021, 13, 2812. [Google Scholar] [CrossRef]
  6. Binda, L.; Saisi, A.; Tiraboschi, C. Investigation procedures for the diagnosis of historic masonries. Constr. Build. Mater. 2000, 14, 199–233. [Google Scholar] [CrossRef]
  7. Rodrigues, F.; Matos, R.; Di Prizio, M.; Costac, A. Conservation level of residential buildings: Methodology evolution. Constr. Build. Mater. 2018, 172, 781–786. [Google Scholar] [CrossRef]
  8. Konior, J.; Rejment, M. Correlation between Defects and Technical Wear of Materials Used in Traditional Construction. Materials 2021, 14, 2482. [Google Scholar] [CrossRef] [PubMed]
  9. Kroftova, K. Most Frequent Problems of Building Structures of Urban Apartment Buildings from 2nd Half of 19th Century and the Start of 20th Century. Buildings 2021, 11, 27. [Google Scholar] [CrossRef]
  10. Drobiec, Ł. Limitation of cracking in AAC masonry under the window zone. Mauerwerk 2017, 21, 332–342. [Google Scholar] [CrossRef]
  11. Drobiec, Ł. Study of impact of bed joint reinforcement on load-carrying capacity and crack resistance of masonry walls made of calcium silicate units. J. Build. Eng. 2021, 33, 101841. [Google Scholar] [CrossRef]
  12. Drobiec, Ł. Analysis of AAC walls subjected to vertical load. Mauerwerk 2019, 23, 387–403. [Google Scholar] [CrossRef]
  13. Kania, T.; Derkach, V.; Nowak, R. Testing Crack Resistance of Non-Load-Bearing Ceramic Walls with Door Openings. Materials 2021, 14, 1379. [Google Scholar] [CrossRef]
  14. Corradi, M.; Borri, A.; Castori, G.; Coventry, K. Experimental Analysis of Dynamic Effects of FRP Reinforced Masonry Vaults. Materials 2015, 8, 8059–8071. [Google Scholar] [CrossRef] [Green Version]
  15. Jasieńko, J.; Raszczuk, K.; Frąckiewicz, P.; Kleszcz, K.; Bednarz, Ł. Strengthening of masonry rings with composite materials. Herit. Sci. 2021, 9, 1–9. [Google Scholar] [CrossRef]
  16. Nowak, R.; Orłowicz, R. Testing of Chosen Masonry Arched Lintels. Int. J. Archit. Herit. 2020. [Google Scholar] [CrossRef]
  17. Drobiec, Ł.; Jasiński, R.; Mazur, W. Accuracy of eddy-current and radar methods used in reinforcement detection. Materials 2019, 12, 1168. [Google Scholar] [CrossRef] [Green Version]
  18. Łątka, D.; Matysek, P. Determination of Mortar Strength in Historical Brick Masonry Using the Penetrometer Test and Double Punch Test. Materials 2020, 13, 2873. [Google Scholar] [CrossRef]
  19. Nuzzo, M.; Faella, G. The Carmine Maggiore Bell Tower: An Inclusive and Sustainable Restoration Experience. Sustainability 2021, 13, 1445. [Google Scholar] [CrossRef]
  20. Nowak, R.; Orłowicz, R.; Rutkowski, R. Use of TLS (LiDAR) for Building Diagnostics with the Example of a Historic Building in Karlino. Buildings 2020, 10, 24. [Google Scholar] [CrossRef] [Green Version]
  21. Rucka, M.; Wojtczak, E.; Zielińska, M. Integrated Application of GPR and Ultrasonic Testing in the Diagnostics of a Historical Floor. Materials 2020, 13, 2547. [Google Scholar] [CrossRef] [PubMed]
  22. Wang, N.; Zhao, X.; Zhao, P.; Zhang, Y.; Zou, Z.; Ou, J. Automatic damage detection of historic masonry buildings based on mobile deep learning. Autom. Constr. 2019, 103, 53–66. [Google Scholar] [CrossRef]
  23. Borri, A.; Castori, G.; Corradi, M. Determination of shear strength of masonry panels through dierent tests. Int. J. Archit. Herit. 2015, 9, 913–927. [Google Scholar] [CrossRef]
  24. Matysek, P.; Witkowski, M. A comparative study on the compressive strength of bricks from different historical periods. Int. J. Archit. Herit. 2016, 10, 396–405. [Google Scholar] [CrossRef]
  25. EN-1996-1-1:2009. Eurocode 6—Design of Masonry Structures. Part 1-1: General Rules for Reinforced and Unreinforced Masonry Structures; CEN Comité Européen De Normalisation: Brussels, Belgium, 2009. [Google Scholar]
  26. Borri, A.; Corradi, M.; De Maria, A. The Failure of Masonry Walls by Disaggregation and the Masonry Quality Index. Heritage 2020, 3, 1162–1198. [Google Scholar] [CrossRef]
  27. De Velasco Machardo, L.; de Oliveira, U.R. Analysis of failures in the accessibility of university buildings. J. Build. Eng. 2021, 33, 101654. [Google Scholar] [CrossRef]
  28. Municipal Museum Museums in Poland. Available online: https://wodzislaw_slaski.fotopolska.eu/1620,foto.html?o=b846 (accessed on 9 June 2021).
  29. EN 772-1:2011+A1:2015. Methods of Test for Masonry Units. Determination of Compressive Strength; CEN Comité Européen De Normalisation: Brussels, Belgium, 2015. [Google Scholar]
  30. EN 1015-11:2019. Methods of Test for Mortar for Masonry. Determination of Flexural and Compressive Strength of Hardened Mortar; CEN Comité Européen De Normalisation: Brussels, Belgium, 2019. [Google Scholar]
  31. EN 1991-1-4:2005. Actions on Structures. Part 1-4: General Actions—Wind Actions; CEN Comité Européen De Normalisation: Brussels, Belgium, 2005. [Google Scholar]
  32. EN-1993-1-1:2005. Design of Steel Structures—Part 1-1: General Rules and Rules for Buildings; CEN Comité Européen De Normalisation: Brussels, Belgium, 2005. [Google Scholar]
Figure 1. Scheme presenting changes in the load arrangement after replacing a timber floor with a concrete floor: (a) stress redistribution, (b) high compressive stresses due to the addition of the new floor, (c) punching shear action. Based on [1].
Sustainability 13 10058 g001
Figure 2. Archive photo taken in 1909 [28].
Sustainability 13 10058 g002
Figure 3. View of damage from the elevation side.
Sustainability 13 10058 g003
Figure 4. Remains of top cornice.
Sustainability 13 10058 g004
Figure 5. Specimens taken for the tests: (a) contemporary brick 65 × 120 × 250 mm, (b) brick 65 × 155~160 × 310 mm (from the period of erecting the Palace—mid-18th century), (c) brick 50 × 180 × 200~210 mm (brick reclaimed from the old castle—14th century), (d) specimens of lime and cement–lime mortar, (e) specimens of cement–lime mortar.
Sustainability 13 10058 g005
Figure 6. Brick specimens prepared for testing: (a) contemporary brick 65 × 120 × 250 mm, (b) brick 65 × 155~160 × 310 mm (from the period of erection of the Palace—mid-18th century), (c) brick 50 × 180 × 200~210 mm (brick reclaimed from the old castle—14th century).
Sustainability 13 10058 g006
Figure 7. Mortar specimens taken for testing: (a) lime mortar, (b) cement–lime mortar with coarse aggregate, (c) cement–lime mortar.
Sustainability 13 10058 g007
Figure 8. Brick specimens before and after testing: (a) contemporary brick 65 × 120 × 250 mm, (b) brick 65 × 155~160 × 310 mm (from the period of erection of the Palace—mid-18th century), and (c) brick 50 × 180 × 200~210 mm (brick reclaimed from the old castle—14th century).
Sustainability 13 10058 g008
Figure 9. The mortar specimen before (a) and after (b) testing.
Sustainability 13 10058 g009
Figure 10. The design stages of a steel frame for the new roof structure: (a) stage 1—dismantling of part of the cornice masonry; (b) stage 2—constructing the tie beam, laying additional bricks to the wall and placing steel girders; (c) stage 3—constructing the wall between steel girders.
Sustainability 13 10058 g010
Figure 11. The geometry of the cornice masonry before (a) and after works performed in stage 1 (b).
Sustainability 13 10058 g011
Figure 12. Archive photo taken in 1873 before the building’s extension.
Sustainability 13 10058 g012
Figure 13. Archive photo from the beginning of the 21st century.
Sustainability 13 10058 g013
Figure 14. The collapsed area before commencement of the works: (a) wall on the second floor, (b) structural slab above one floor, (c) structural slab above the ground floor.
Sustainability 13 10058 g014
Figure 15. Photo taken immediately after the collapse.
Sustainability 13 10058 g015
Figure 16. Photo taken immediately after the collapse.
Sustainability 13 10058 g016
Figure 17. Elements of the roof system removed after the collapse.
Sustainability 13 10058 g017
Figure 18. View of the left side of the timber-framed floor.
Sustainability 13 10058 g018
Figure 19. View of stitched cracks in the front wall (a) and chases cut in the front wall for stitching (b).
Sustainability 13 10058 g019
Figure 20. Brick specimens prepared for tests.
Sustainability 13 10058 g020
Figure 21. Mortar specimens prepared for tests.
Sustainability 13 10058 g021
Figure 22. Axes of geodetic measurements of front wall drift.
Sustainability 13 10058 g022
Figure 23. Diagram presenting wall drift at the measured axes.
Sustainability 13 10058 g023
Figure 24. First phase of destruction—two visible clouds of smoke (CCTV record).
Sustainability 13 10058 g024
Figure 25. Second phase of destruction: (a) ca. 1 s before the failure; (b) onset of failure. Visible rotation of the scaffold (arrow) (CCTV record).
Sustainability 13 10058 g025
Figure 26. Diagram of the wind speed within a month before the collapse.
Sustainability 13 10058 g026
Figure 27. Failure mechanism according to Hypothesis 1.
Sustainability 13 10058 g027
Figure 28. Failure mechanism according to Hypothesis 2.
Sustainability 13 10058 g028
Figure 29. View of the cornice.
Sustainability 13 10058 g029
Figure 30. The first possible place of damage initiation—the floor below the top cornice.
Sustainability 13 10058 g030
Figure 31. The second possible place of damage initiation—the narrow wall below the second story.
Sustainability 13 10058 g031
Figure 32. Three-dimensional model of the building: (a) rendered view; (b) FEM mesh view.
Sustainability 13 10058 g032
Figure 33. The geometry of the panel model (right) compared to the actual geometry.
Sustainability 13 10058 g033
Figure 34. Map of vertical stresses, Syy.
Sustainability 13 10058 g034
Figure 35. Deformation of the spatial model: (a) front; (b) section.
Sustainability 13 10058 g035
Figure 36. Maps of vertical stresses, Syy, at the mullion level: (a) vertical stresses—model No. 1, (b) vertical stresses—model No. 2; (c) bearing capacity mobilization—model No. 1; (d) bearing capacity mobilization—model No. 2.
Sustainability 13 10058 g036
Figure 37. Map of horizontal deformations, eY (at the knee wall level: (a) model No. 1; (b) model No. 2.
Sustainability 13 10058 g037
Figure 38. Maps of vertical stresses (tensile), Syy, at the knee wall level: (a) model No. 1; (b) model No. 2.
Sustainability 13 10058 g038
Figure 39. Bearing capacity mobilization at the knee wall level: (a) model No. 1; (b) model No. 2.
Sustainability 13 10058 g039
Figure 40. Photo of the analyzed building.
Sustainability 13 10058 g040
Figure 41. View of the collapsed floor.
Sustainability 13 10058 g041
Figure 42. Measuring moisture content in the wall: (a) 19.0%; (b) 19.3%; (c) and (d) beyond the range (>20%).
Sustainability 13 10058 g042
Figure 43. Measuring the thickness of steel beam elements: (a) web of the central area—4.17 mm; (b) flange of the central area—7.01 mm; (c) web at the support—3.1 mm; (d) flange at the support—5.79.
Sustainability 13 10058 g043
Figure 44. View of the broken beam.
Sustainability 13 10058 g044
Figure 45. Details of the beam failure: (a) bending of the section; (b) shearing of the section.
Sustainability 13 10058 g045
Figure 46. Three-dimensional model of the slab: (a) cross-sectional view; (b) shear forces in the beam.
Sustainability 13 10058 g046
Table 1. Results from testing masonry units.
SpecimenWidth, mmLength, mmHeight, mmUltimate Force, kNStrength
fB, N/mm2
Strength
Mean fB, N/mm2
TypeNumber
I—contemporary brick1.111524663.6107938.1430.29
1.2113.625162.7919.132.23
1.3116.324862.1996.734.56
1.412226262.5520.316.28
1.5117.524568796.227.66
1.6114.425462955.732.89
II—18th-century brick2.1144.530665.5290.36.577.54
2.2153.530466.5397.28.51
2.3155.5157.564.8199.78.15
III—14th-century brick3.1124192.549.550621.2016.09
3.2178.6207.253.2432.911.70
3.3125.5206.552398.715.38
Table 2. Standardized mean compressive strength of masonry units.
Specimen TypeMean Strength, MPaMean Shape Factor δStandardized Mean Strength fb, N/mm2Class of Masonry Unit
I30.290.8325.125
II7.540.755.75
III30.290.7211.610
Table 3. Results from mortar tests.
SpecimenWidth, mmLength, mmHeight, mmUltimate Force, kNStrength
f, N/mm2
Strength
Mean fm, N/mm2
TypeNumber
Lime mortar1.14037300.560.380.35
1.24035300.490.35
1.34034230.390.29
1.43531280.380.35
1.54027210.390.36
Cement–lime mortar with coarse aggregate2.140402824.6515.4115.5
2.240402824.3615.23
2.340402425.916.19
2.440402322.714.19
2.540402126.3516.47
Cement–lime mortar3.140403117.3710.8610.2
3.240402916.3210.20
3.340402815.329.58
3.440402616.3710.23
Table 4. Characteristic compressive strength of masonry, N/mm2.
MortarLime MortarCement–Lime Mortar with Coarse AggregateCement–Lime Mortar
Brick
Type I
Contemporary brick
not applicable7.836.91
Type II
18th century brick
0.88not applicablenot applicable
Type III
14th century brick
1.45not applicablenot applicable
Table 5. Results from testing masonry units.
SpecimenWidth, mmLength, mmHeight, mmUltimate force, kNCompressive Strength
fB, N/mm2
Mean Strength
fB, mean N/mm2
TypeNumber
I
Hollow clay brick
127013565395.710.86-
224011865305.610.79
325712567231.77.21
41651256794.44.58
II
Solid brick
527013567321.88.83-
623514065321.89.78
7.1132926782.76.816.37
7.2129706753.65.94
813012065286.618.37-
916210062222.613.74
10130706531.83.49
Table 6. Standardized mean compressive strength of masonry units.
Specimen No.Strength fB, N/mm2Mean Shape Factor δStandardized Mean Strength fb, N/mm2Class of Masonry Unit
110.860.7808.475
210.790.8148.785
37.210.8205.915
44.580.8203.752.5
58.830.8007.065
69.780.7707.535
75.780.886 and 0.9305.785
818.370.81014.8810
913.740.81011.1310
103.490.9103.182.5
Table 7. Results from mortar tests.
SpecimenWidth, mmLength, mmHeight, mmForce
Ultimate Force, kN
Strength
f, MPa
Strength
Average
fm, MPa
(Coefficient of Variation, %)
TypeNumber
Lime mortar5.12428150.40.600.70
(23%)
5.23227150.740.86
5.32222150.380.79
5.42622150.340.59
5.52519150.240.51
5.62422150.50.95
5.72525150.40.64
6.12630100.450.580.64
6.22525130.440.70
Cement–lime mortar3.12630190.620.790.80
(7.2%)
3.22828190.590.75
3.34032190.950.74
3.42630200.660.85
3.52522190.480.87
Table 8. Characteristic compressive strength of masonry.
Specimen No.Standardized Strength of Masonry Units fb, MPaCompressive Strength of Mortar fm, MPaCharacteristic Compressive Strength of Masonry fk, MPaDesigned Compressive Strength of Masonry fd, MPa
18.470.801.00 *0.46
28.780.801.03 *0.47
35.910.800.780.35
43.750.800.57 *0.26
57.060.701.270.58
67.530.641.290.59
75.780.691.10 **0.50
814.880.692.13 **0.97
911.130.691.74 **0.79
103.180.690.72 **0.33
* calculated on the basis of tests performed on mortar from specimen No. 3. ** calculated on the basis of averaging the results for mortar specimens No. 5 and 6.
Publisher’s Note: MDPI stays neutral with regard to jurisdictional claims in published maps and institutional affiliations.

