Article

Determinants of Active Online Learning in the Smart Learning Environment: An Empirical Study with PLS-SEM

1
Smart Learning Institute, Beijing Normal University, Beijing 100875, China
2
School of Logistics and e-Commerce, Zhejiang Wanli University, Ningbo 315000, China
3
School of Education, Hangzhou Normal University, Hangzhou 311121, China
4
Research Center for Intelligent Social Governance, Zhejiang Lab, Hangzhou 310005, China
*
Author to whom correspondence should be addressed.
Sustainability 2021, 13(17), 9923; https://doi.org/10.3390/su13179923
Submission received: 27 July 2021 / Revised: 28 August 2021 / Accepted: 30 August 2021 / Published: 3 September 2021
(This article belongs to the Special Issue Digital Technologies for Sustainable Education)

Abstract

:
A smart learning environment, featuring personalization, real-time feedback, and intelligent interaction, provides the primary conditions for actively participating in online education. Identifying the factors that influence active online learning in a smart learning environment is critical for proposing targeted improvement strategies and enhancing their active online learning effectiveness. This study constructs the research framework of active online learning with theories of learning satisfaction, the Technology Acceptance Model (TAM), and a smart learning environment. We hypothesize that the following factors will influence active online learning: Typical characteristics of a smart learning environment, perceived usefulness and ease of use, social isolation, learning expectations, and complaints. A total of 528 valid questionnaires were collected through online platforms. The partial least squares structural equation modeling (PLS-SEM) analysis using SmartPLS 3 found that: (1) The personalization, intelligent interaction, and real-time feedback of the smart learning environment all have a positive impact on active online learning; (2) the perceived ease of use and perceived usefulness in the technology acceptance model (TAM) positively affect active online learning; (3) innovatively discovered some new variables that affect active online learning: Learning expectations positively impact active online learning, while learning complaints and social isolation negatively affect active online learning. Based on the results, this study proposes the online smart teaching model and discusses how to promote active online learning in a smart environment.

1. Introduction

Online studying has become an important field of educational research due to the COVID-19 pandemic. The current research on e-learning considers the following issues: Lack of an effective online learning atmosphere [1], insufficient interactivity in virtual classrooms [2], non-diversified teaching method [3], lack of online course resources [4]. The problems accused as listed above are more likely to affect online teaching and learning effectiveness and quality seriously. Studies now are mainly focus on constraints of online learning, such as satisfaction [5,6,7,8], attitude [9], adoption [10,11], acceptance [12,13,14,15,16], sustained use [17,18,19,20], motivation [21,22], use behavior [23,24,25,26,27,28,29], and knowledge sharing [30].
Online learning success heavily depends on many conditions, including the learning environment, teaching methods, educational resources, and learning expectations. The application of new technologies, such as artificial intelligence, big data, and cloud computing, has promoted the rapid development of smart learning environments, which provide more competent learning conditions for online learning. A smart learning environment is a place or space that identifies student characteristics to help them use the most appropriate tools and resources by utilizing data recording and automated assessment of the entire process to promote student learning effectively [31]. Mobile smart terminals, digital learning materials, and intelligent educational environments improve learners’ academic performance and learning outcomes [32]. Creating a smart learning environment based on the most advanced technologies offers more support to meet students’ particular needs [33], increases students’ learning satisfaction, and develops their educational achievements [34]. The intelligent features of physical sensing, personalized recommendations, and other relevant factors provide high-quality support on e-learning platforms [35]. Human-computer interaction in a virtual educational setting helps learners experience excellent teaching and learning approaches ever since the innovation of digital technologies in the 21st century [36]. Intelligent interaction is an important dimension that affects the quality of online courses and is closely related to learner satisfaction and learning efficiency [37]. Thus, a smart learning environment is essential to help develop online learning expertise and reach outstanding school achievements. However, research rarely focuses on intelligent learning environment in such a digital era.
Student active participation in their remote learning is one of the most important factors influencing their academic achievements. This study focuses on “active online learning” and emphasizes student learning initiatives in distance education. The “informality” of online learning makes students easily distracted and unable to immerse entirely in virtual classrooms. Free styled homeschooling during COVID-19, whether learners learn actively without supervision, is a core factor in evaluating whether teaching strategies successfully achieve the instructional objectives [38]. Deepening the knowledge of active online learning behaviors in a smart learning environment helps understand the underlying mechanisms of active online learning.
Active online learning motivates students to gain higher educational attainments rather than traditional pedagogies; therefore, it is of great significance to identify the influencing factors of active online learning in the smart learning environment to promote the quality of e-learning.

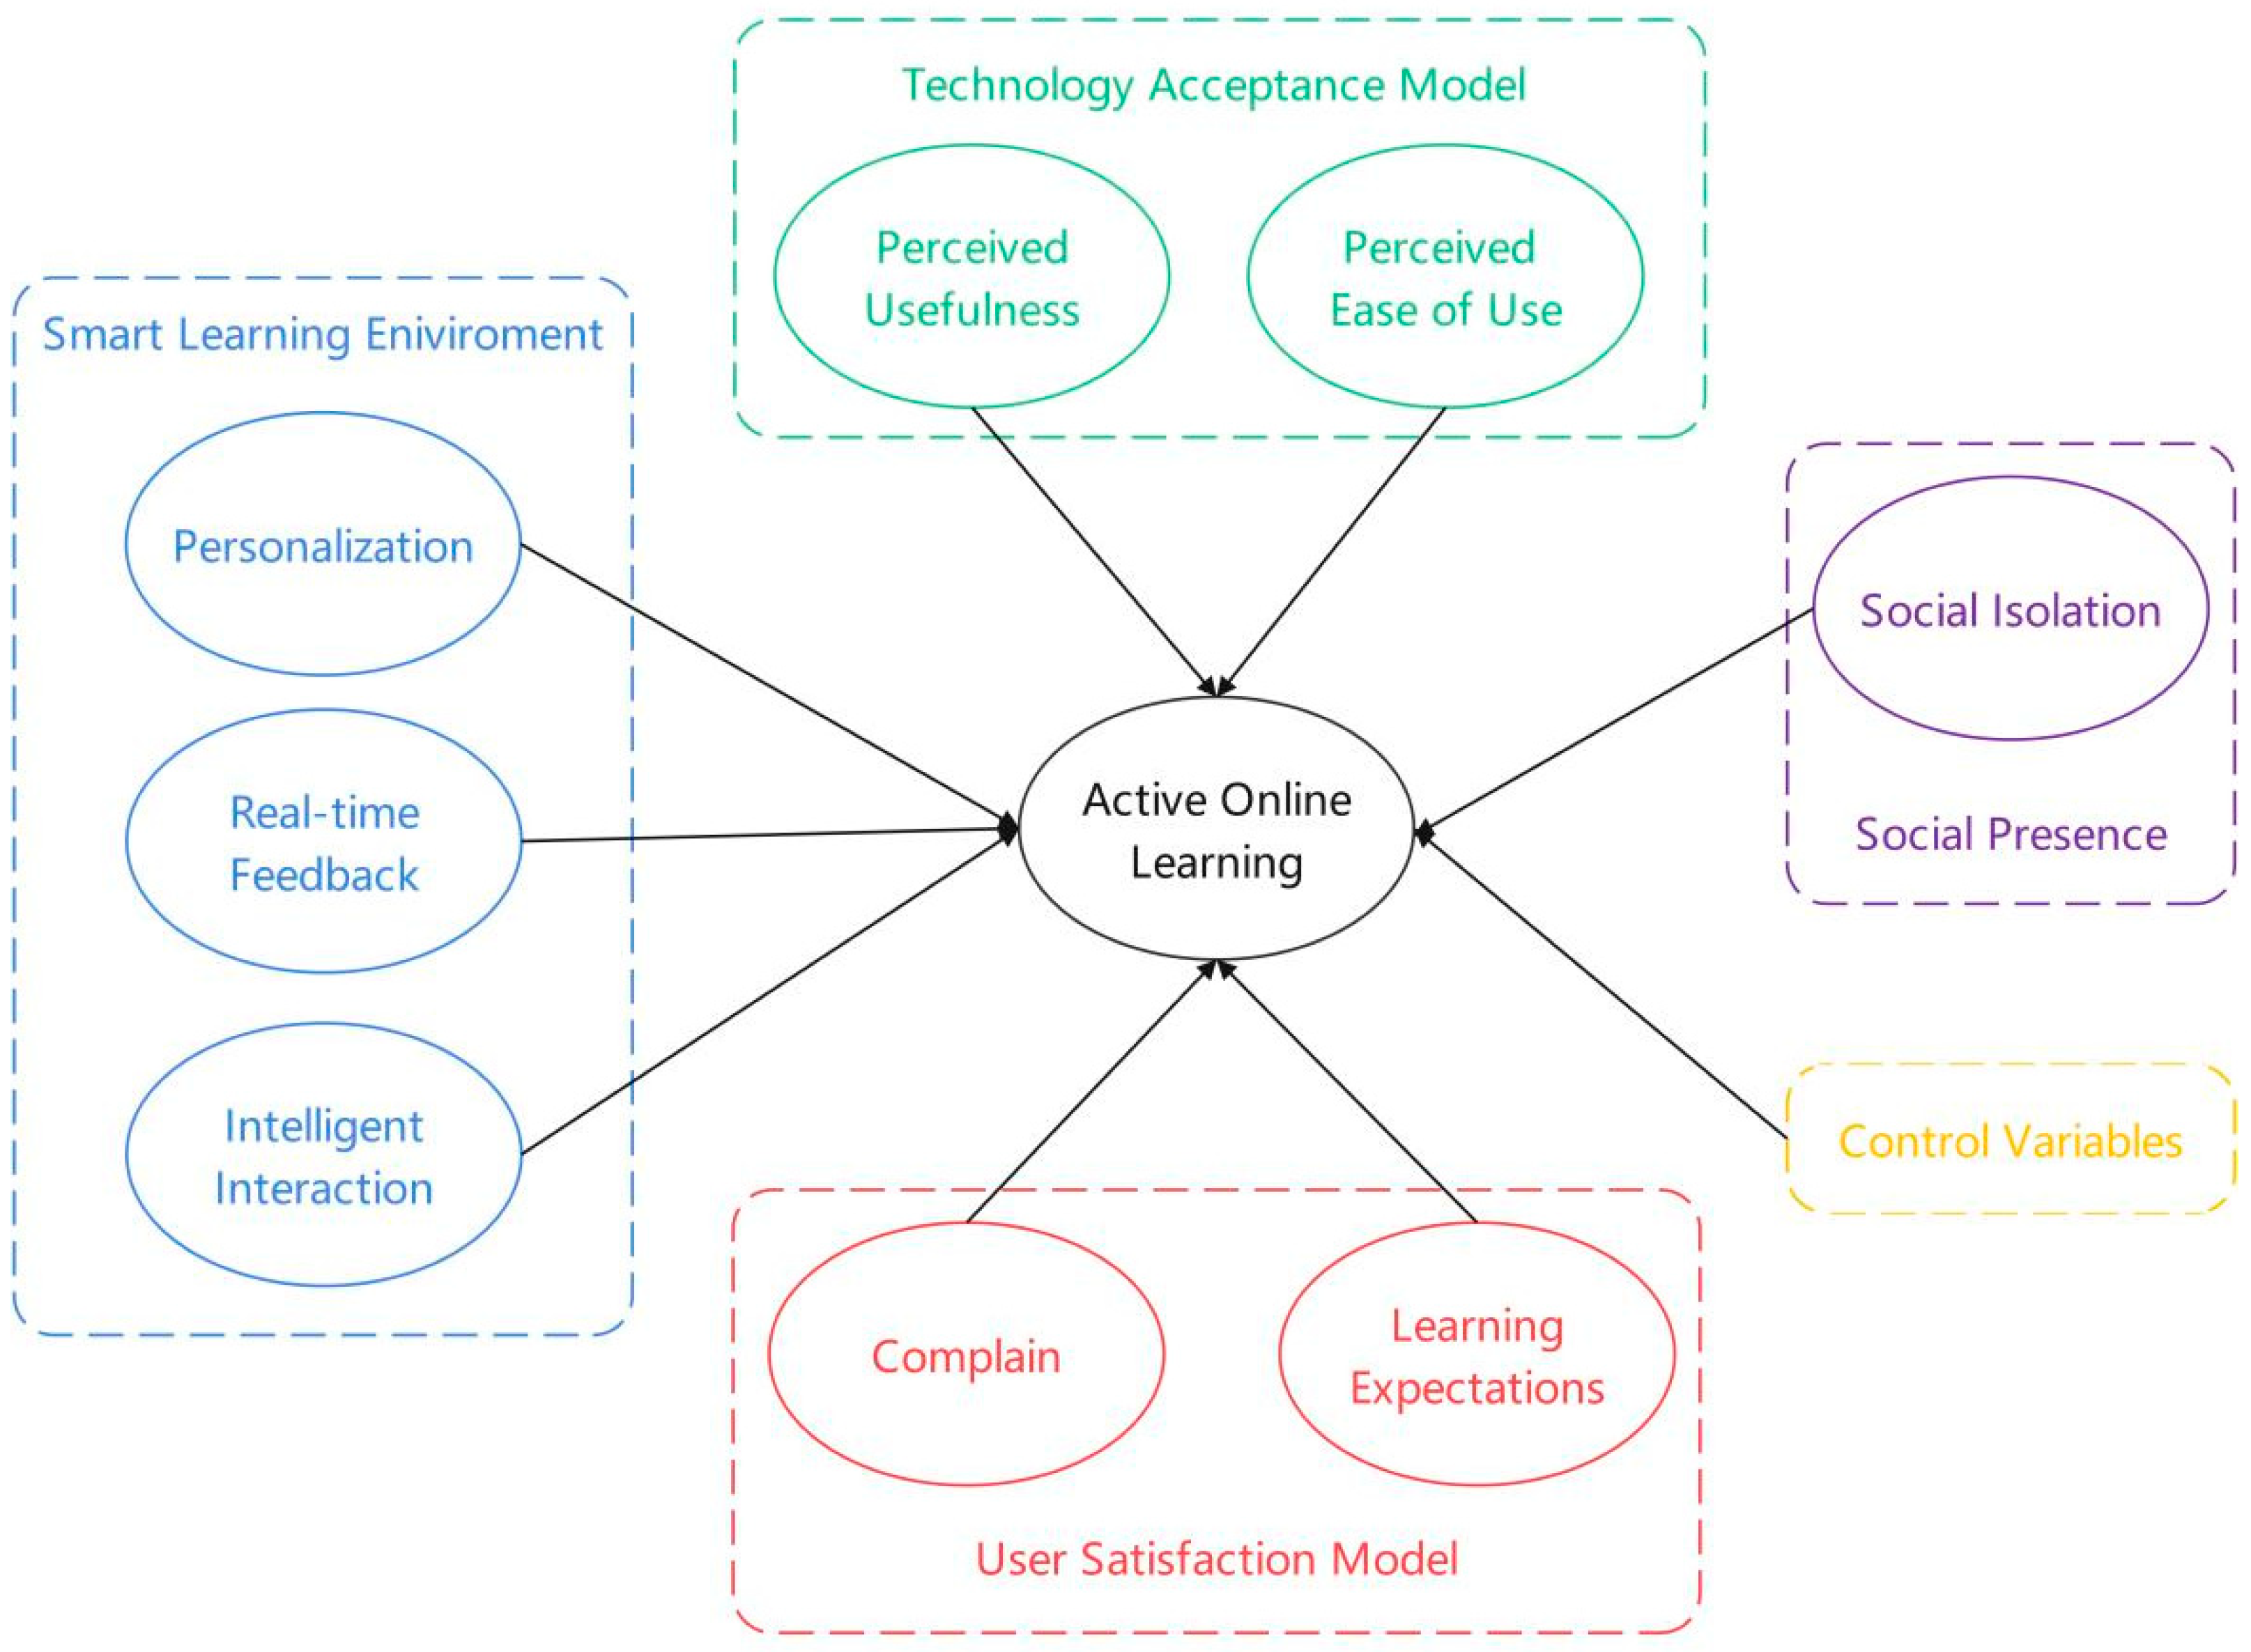
2. Research Framework and Hypothesis

2.1. Research Framework

According to the Theory of Rational Behavior, Davis et al. [39] built the Technology Acceptance Model (TAM), which indicates several external factors influence users’ usage behaviors and attitudes. TAM is also commonly used to predict individual attitudes and behaviors. Many scholars have conducted studies related to online learning, telecommuting, social media, and mobile software based on this theory [8,40]. There is a strong correlation between users’ attitudes and behavioral intentions [20,23]. The Technology Acceptance Model focuses on the antecedent influences on user behavior, including the thinking process of an individual (i.e., attitudes and willingness), and the perceived usefulness, ease of use, and extrinsic factors before adopting the behavior. The Technology Acceptance Model has been iterated and updated in several versions and remains the most popular research theory in online learning research [41], and has been widely used by most investigators in this area [29,42,43]. According to the Technology Acceptance Model, this study investigates further factors influencing college students’ active online learning in a smart learning environment.
Numerous studies have mentioned the help of personalization, intelligent interaction, and timely feedback in smart learning environments approach the quality improvement of learning [37,44,45,46], and found that perceived ease of use and perceived usefulness are essential influences on learning satisfaction [27,43,47,48], proving the impact of social isolation on online learning [49,50,51]. However, few studies have integrated the effects of the wisdom learning environment, perceptions of the learning environment, and social isolation on active learning online.
Figure 1 shows the research framework presented in this study. The study will investigate the new scenario on the topic of active online learning by observing the following factors that are characteristics of the smart learning environment, perceived usefulness and ease of use, sense of social isolation, learning expectations and complaints that occurred in the scenario, and exploring any changes among all factors after adding the new variables. Based on previous research, this study refines and aims to identify the influencing factors of active online learning and verify the relationship among these influencing factors to help teachers and students advance active online learning behaviors. Then, this study will study the hypothesis of relevant influencing factors and control following the model demonstrated in the paper.

2.2. Hypothesis

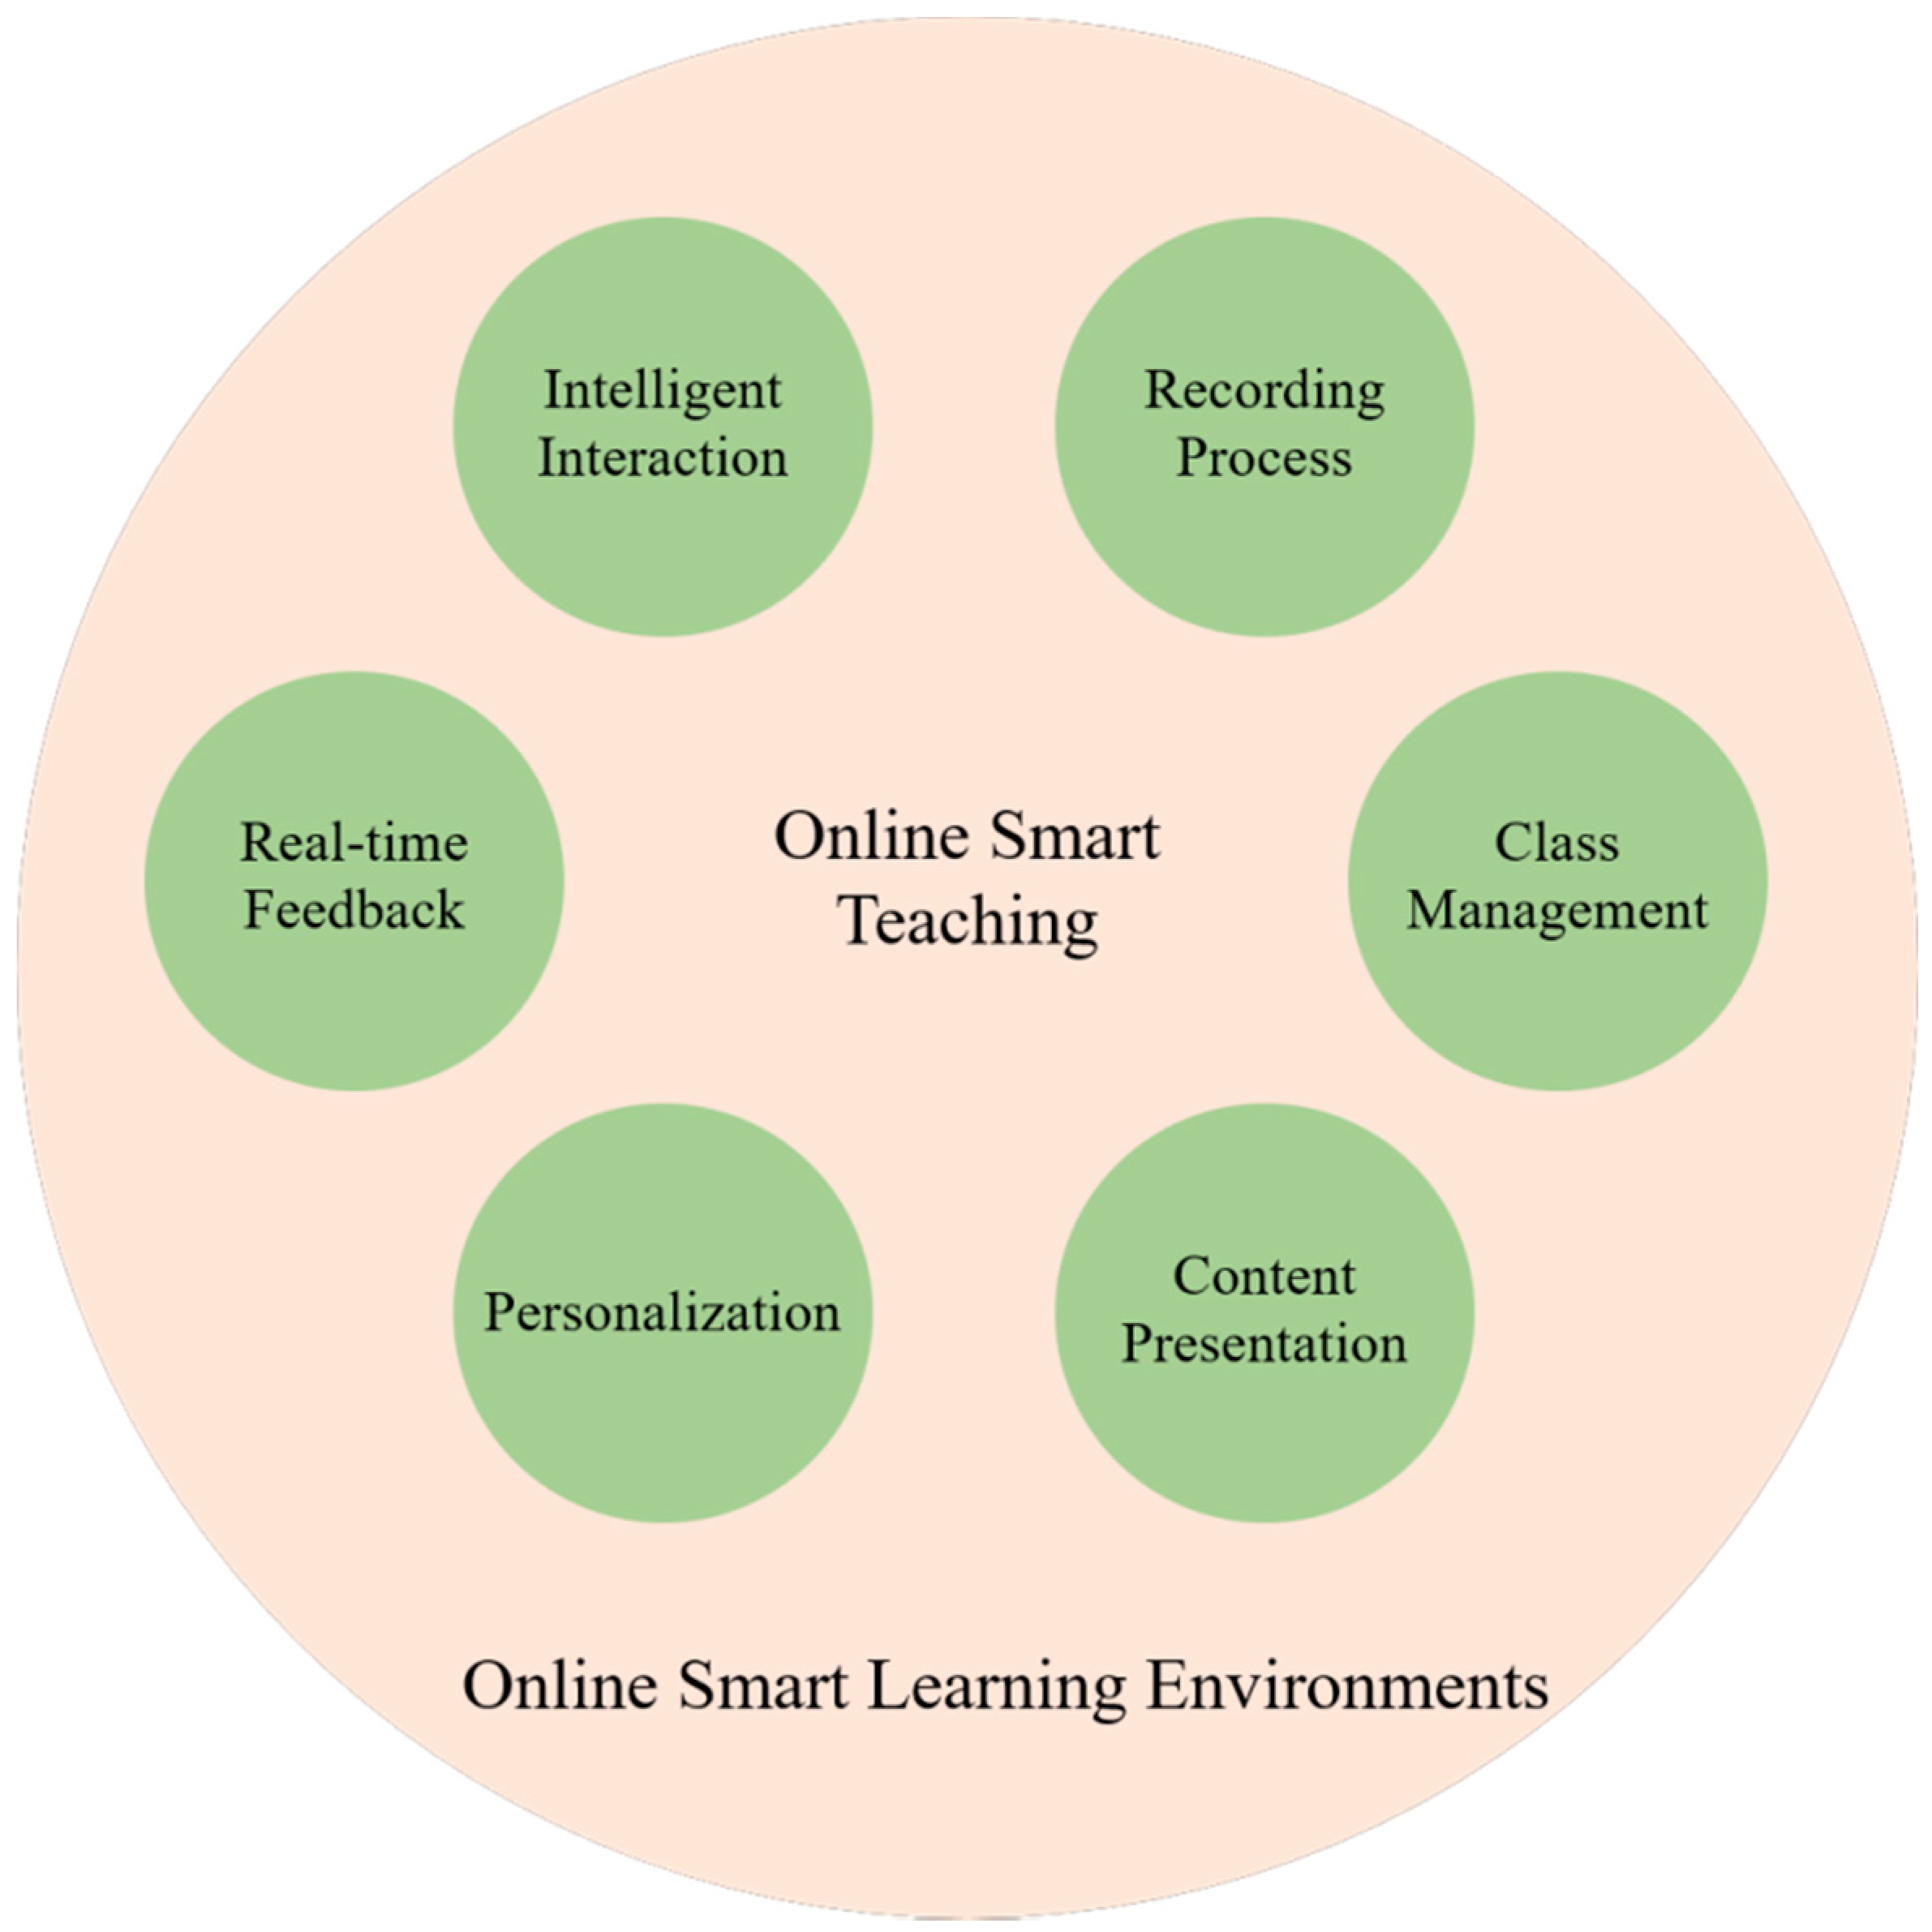
2.2.1. Smart Learning Environmental Characteristics

Typical features of smart learning environments are personalization, real-time feedback, and intelligent interaction. Personalized learning recommends learning styles and resources tailored to the learners’ preferences depending on their backgrounds and learning styles [45,46]. Lee [35] found that personalized content and instructional methods had improved student learning satisfaction and outcomes. Real-time feedback provides learners prompt responses from the system when participating in active online learning activities [44]. With plenty of digital resources, learning initiative is undertaken to make distance education accessible anytime and anywhere and receive feedback shortly; adaptive learning environments with personalized recommendations introduce learners to a better education experience [32]. Especially in online teaching and learning, prompt feedback would significantly enhance the interaction sense of cyber education [52]. The new technologies bring a more human experience of real-time feedback to students. At the same time, data collection and analysis also helps to recommend the most suitable personalized learning plan for students [44]. Kubilinskienė and Kurilov [46] developed Resource Description Framework models in accordance with intelligent semantic analysis technology to obtain the learners’ current learning activities and automatically analyze its findings, and finally contribute valuable practical suggestions to meliorate the learning efficiency and quality, thereby allowing personalized learning to meet the desired instructional goals and objectives. Sungkur [37] found that a personalized learning environment based on artificial neural networks and backpropagation algorithms can provide learners with appropriate feedback and recommendations to meet their specific learning needs. Wu et al. [43] conclude that a sound interaction and learning environment can raise learners’ satisfaction with blended digital learning. In a virtual learning environment, interaction is also a key factor affecting the effectiveness of teaching and learning [33], and adequate interaction can improve the overall satisfaction of the learning process [53]. Regards as the above analysis, the hypotheses presented in this study are:
Hypothesis 1 (H1).
There is a positive effect of personalization on active online learning.
Hypothesis 2 (H2).
There is a positive effect of immediate feedback on active online learning.
Hypothesis 3 (H3).
There is a positive effect of intelligent interaction on active online learning.

2.2.2. Perceived Usefulness and Perceived Ease of Use

According to the Theory of Technology Acceptance Model, perceived usefulness and ease of use are critical factors affecting user behaviors [39]. These two factors will affect users’ attitudes and behavior intention. Additionally, the perceived usefulness positively affects the behavior attitudes, and the perceived usefulness and behavior attitude will positively influence the behavior intention [19,54,55]. When users occasionally find that a specific behavior will increase their rate of return under a similar period or reduce the time spent achieving academic success, they will continue such behavior [23]. Individuals’ behavioral intentions depend on variables specific to perceived usefulness and are considered the fundamental determinants of users’ behavioral preferences [28], and perceived usefulness influences behavioral intentions through attitudes [23]. Teo and Van Schaik [11] found that teachers in Singapore perceived usefulness positively and directly affected preservice teachers’ behavioral intentions. Moreover, teachers were inclined to act if they perceived it to be more efficient and meaningful [56]. In virtual learning environments, perceived usefulness has a significant impact on attitudes [12,57]. An enormous number of open online educational resources, smart learning environments, and learning styles breaking the barriers of time and space maximize the probability that college students will perform active learning behaviors in virtual classrooms [58]. Sun et al. [47] demonstrated that perceived ease of use and perceived usefulness are indicative variables of learning satisfaction; Mohammadi [27] combined the TAM and the Information System Success Model to investigate e-learning and found that perceived ease of use affects learners’ willingness to learn through perceived usefulness and learning behaviors. The stability of the system and human-computer interaction all affect college students’ reading behavior [59]. Based on the above analysis, the hypotheses formulated in this study are:
Hypothesis 4 (H4).
There is a positive effect of perceived ease of use on active online learning.
Hypothesis 5 (H5).
There is a positive effect of perceived usefulness on active online learning.

2.2.3. Social Isolation

Social isolation (SI) refers to feelings of isolation and loneliness that arise when learners undertake online learning [60]. A good sense of social presence can significantly improve teaching effectiveness in online education [61,62], while isolation may weaken college students’ study motivation and willingness in their homeschooling. Students suffer from isolation and loneliness in an online learning environment, due to physical isolation from their teachers and classmates [63]. Mutually isolated remote education reduces the fundamental needs of the community, such as teacher-student and peer-communication [64], but increases the risk of socially isolated loneliness [60,65]. Minimizing social isolation and participating in interactive communication and discussion can help students promote cheerful willingness to learn and ultimately boost online learning satisfaction [49]. Reducing isolation is beneficial in promoting active learning behaviors [50] because students who keep away from teachers, schools, friends, and their classmates often experience the risk of mental health issues and illness in virtual classrooms [66], which discourages active learning behaviors. It is also tricky for learners to complete tasks under self-directed learning conditions with a sense of isolation and a lack of assistance [67]. Then a homogeneous group collaboration approach can reduce the negative emotions and stresses caused by isolation generated from distance education [68], and improve the participants’ digital learning experience. Derakhshandeh and Esmaeili [69] argued that some students might feel isolated and socially isolated in online education because of a lack of interaction between teachers and other students. Based on the above analysis, the hypotheses in this study are:
Hypothesis 6 (H6).
There is a negative effect of social isolation on active online learning.

2.2.4. Learning Expectations

Learning expectations are those learners desire to gain from active online learning [70,71]. Social influence, performance expectations, and effort expectations are critical factors influencing dynamic behavior in blended learning [72]. The online learning satisfaction of learners is often composed of their expectations and perceived usefulness [70]. Sun et al. [47] clarified that online courses’ quality also affects students’ learning satisfaction. The combined effect of an efficient system and high-quality information will considerably improve students’ e-learning satisfaction [27]. Xu et al. [71] found that learners’ learning satisfaction was influenced by teaching methods, information technology, and overall learning outcomes, as well as the assessment of expectations aggregated across these variables. Learners’ expectations are also one of the great factors influencing their learning satisfaction. Based on the above analysis, the hypothesis of this study is:
Hypothesis 7 (H7).
Students’ learning expectations have positive correlation relationships with active online learning.

2.2.5. Complaints

For the first time, Fornell et al. [73] added customer complaints to the customer satisfaction model. At the same time, the investigators also proved that customer complaints affect customer satisfaction and loyalty. In the online learning environment, learning complaints refer to students complaining about any unsatisfied issues in their digital learning [74,75,76,77]. The lack of learner-centered communication in online learning cannot motivate learners and even makes them complain that the course is boring; technical difficulties can also generate student complaints and discourage students from engaging in online education [78]. Students are satisfied with online learning when they have access to sufficient instructional materials, but low internet speed [79] or additional cost paid for fast and reliable internet plans are also sources of complaints [80]. Students need to have a stable network signal, an adequate budget for network traffic, and device power to conduct online learning [81], minimizing complaints, due to technical disruptions. Previous studies have found that overly complex software installation and tedious operation processes [72], slow processing of online learning systems, low-speed networks [82], and excessively long learning videos can lead to boring learning and less digestible knowledge [60]. All the issues caused can lead to learning complaints, which can affect active learning behavior. Based on the above analysis, the hypotheses in this study are:
Hypothesis 8 (H8).
There is a negative effect of learning complaints on active online learning.

2.2.6. Control Variables

Wang and Shannon [5] believe that gender and age will influence students’ views on the usage of online learning. They argue that male students may be more active and competent in using online learning tools [6]. Whereas, Garrison [83] believes that females in an online learning environment are more conducive to achieve better learning outcomes. Learners of different age levels are also distinguished in using online learning tools, which may cause various learning behaviors [30]. Based on the above analysis, the hypothesis of this study is:
Hypothesis 9 (H9a).
Gender will lead to different active online learning behaviors.
Hypothesis 9 (H9b).
Age will lead to different active online learning behaviors.
Hypothesis 9 (H9c).
Educational backgrounds will lead to different active online learning behaviors.

3. Method

Based on the review and summary of existing research, this study considers the influencing factors that drive college students’ active online learning, establishes a research framework for active online learning, and puts forward the hypothesis. This research will use quantitative methods to test the research hypotheses [33,51,72,84,85]. The latent variables of related observations cannot be directly observed to obtain corresponding data, so using scale measurement can help this study obtain data to test the hypothesis [33,49,51,75,77,84,85,86,87,88].

3.1. Questionnaire Design

The study model includes a total of nine latent variables, and all measure items were derived or contextually adapted from existing literature to ensure content validity [84,89,90]. Compared with the 7-level Likert scale, it is convenient for respondents to choose 5-level scales quickly and are widely used to make scale measurements [10,14,57,72,74,77]. Each latent variable was measured by three to five items on a 5-point Likert scale, ranging from 1 to 5 on a scale of strongly disagree to agree strongly. Table 1 shows scales and references.

3.2. Data Collection

After completing the preliminary design of the questionnaire, we used “Questionnaire Star” to publish the online questionnaire inviting 33 college students to conduct a pre-survey of the questionnaire through a WeChat group. We collected feedback on the questionnaire filling in the pre-survey process, and then carefully modified the preliminary questionnaire in response to the feedback suggestions from the pre-survey to ensure that the questionnaire could be filled accurately by the college students in the formal survey. The formal questionnaire mainly focused on the introduction, user personal information, and measurement scale. The introduction clarifies the purpose of the research, data usage, and privacy protection; the user personal information section in terms of gender, age, and educational backgrounds; the measurement scale contains 39 items.
Four universities in China were selected to conduct the survey, and a cluster sampling method is used to select students in the administrative class for the survey. The four universities have implemented online teaching since 2020 that all students have mastered the online learning skills to participate in the courses. Active participation in online learning will be rewarded with higher academic results to encourage students to develop online active learning habits [1,2,51].
The questionnaires were distributed by university teachers to students’ class WeChat groups or displayed on course lecture slides during class time to invite the students to participate in the survey. The invited college students voluntarily chose whether to participate in the survey or not. The online questionnaire was released from 12 May 2021, to 12 June 2021, and 528 valid questionnaires were collected in total. Table 2 shows the basic information of the sample and the basic situation of online learning.

4. Data Analysis and Results

The structural equation model (SEM) could be used to test the relationship between multiple latent variables, and at the same time, can reduce the estimation error as much as possible [5,20,29,85,86,88]. Partial least squares structural equation modeling (PLS-SEM) is more appropriate for this study than multiple regression analysis and covariance-based structural equation modeling (CB-SEM). Researchers are recommended to use PLS-SEM: When the study is exploratory in terms of theory development, multi-theoretical mixed models, testing of theoretical frameworks from a predictive perspective, testing of complex relationships with multiple variables, when the number of variables is large, when there is a lack of normal distribution, and when the sample size is small [36,90,94,95]. The previous studies have not explored the factors influencing active online learning behavior in a smart learning environment, and this study is an exploratory study that attempts to develop and empirically test a predictive and explanatory model of active online learning behavior in a smart learning environment [14,96]; this study contains a test of the theoretical framework proposed in this study from a predictive perspective to provide a future prediction of the active online learning behavior [13,51]; the framework of this study is a multi-theoretical mixed model based on a technology acceptance model, a learning satisfaction model and a smart learning environment [95]; the model proposed in this study contains eight independent variables, one dependent variable and three control variables, which is a complex model with a high number of variables [8,13]. For these reasons and analyses, PLS-SEM is the statistical analysis method applicable to this study. Therefore, this study will choose the widely used SmartPLS 3 to test the hypotheses proposed in this study [90,94,95,97].

4.1. Non-Response Bias

If there is a non-response bias in the data of this study, it will have a substantial impact on the conclusion of this study [98]. To test whether the data of this study have non-response bias, this study examined whether there is a significant difference between the previous data and the later data [99]. First, all samples are sorted in the order of response time. The top 25% of the data samples and the bottom 25% were tested using SPSS 25. The analysis results showed no significant differences in gender, age, and education (p > 0.05). Therefore, it is reasonable to believe that non-response bias will not significantly impact the results of this study [100].

4.2. Common Method Variation

The sample data in this study were all obtained from the distribution and collection of online questionnaires, which has the possibility of common method variation [101]. Therefore, this study used both procedural control and statistical to reduce the effect of standard method variation on the study results [102]. Statistical test was analyzed using the Harman one-way test [103]. The Harman one-way test using principal component analysis in SPSS 25 software yielded a maximum factor variance explained of 23.579%, which did not exceed 40%, indicating that no single factor explained most of the variance [101]. It is believed that standard method variance does not significantly affect the results of this study [103].

4.3. Measurement Model Assessment

The validity and reliability of the model were tested by examining content validity, discriminant validity, and convergent validity [90]. The current questionnaire items were derived or adapted from previous research findings, and pre-research tests have been conducted. Thus, it is reasonable to assume that they have good content validity [84,90,98]. The measurement model’s Average Variance Extracted (AVE) values are shown in Table 3, and good convergent validity is indicated when the AVE value is not less than 0.5 [90,94]. From Table 4, the square root of the AVE of the measurement model is greater than the correlation coefficient between the latent variable and other latent variables; then, it indicates good discriminant validity [90,94]. Table 5, Combined reliability (CR) and Cronbach’s Alpha values are more significant than 0.7, then the reliability of the measurement model is good [90,94]. Analyzing the above tests’ results has proved that the questionnaire has sufficient reliability and sound validity [5,24,27].
The discriminant validity of the model can also be tested by checking the value of cross-loadings [8]. Table 5 shows that the factor loadings between each measured variable and its latent variable are more significant than the cross-factor loadings between other latent variables, indicating that the measurement model possesses good discriminant validity [90,94]. Table 6, the HTMTs of this measurement model are all less than 0.47, indicating that the measurement model has good discriminant validity [90,95].
If the variance inflation factor (VIF) values in the study model are less than 5, it indicates that the study model does not have a covariance problem [90]. The VIF values of the models obtained after calculations using SmartPLS 3 software are all less than the critical value of 5, which indicates that the study model does not have a multicollinearity problem and the results of the study model are relatively stable.

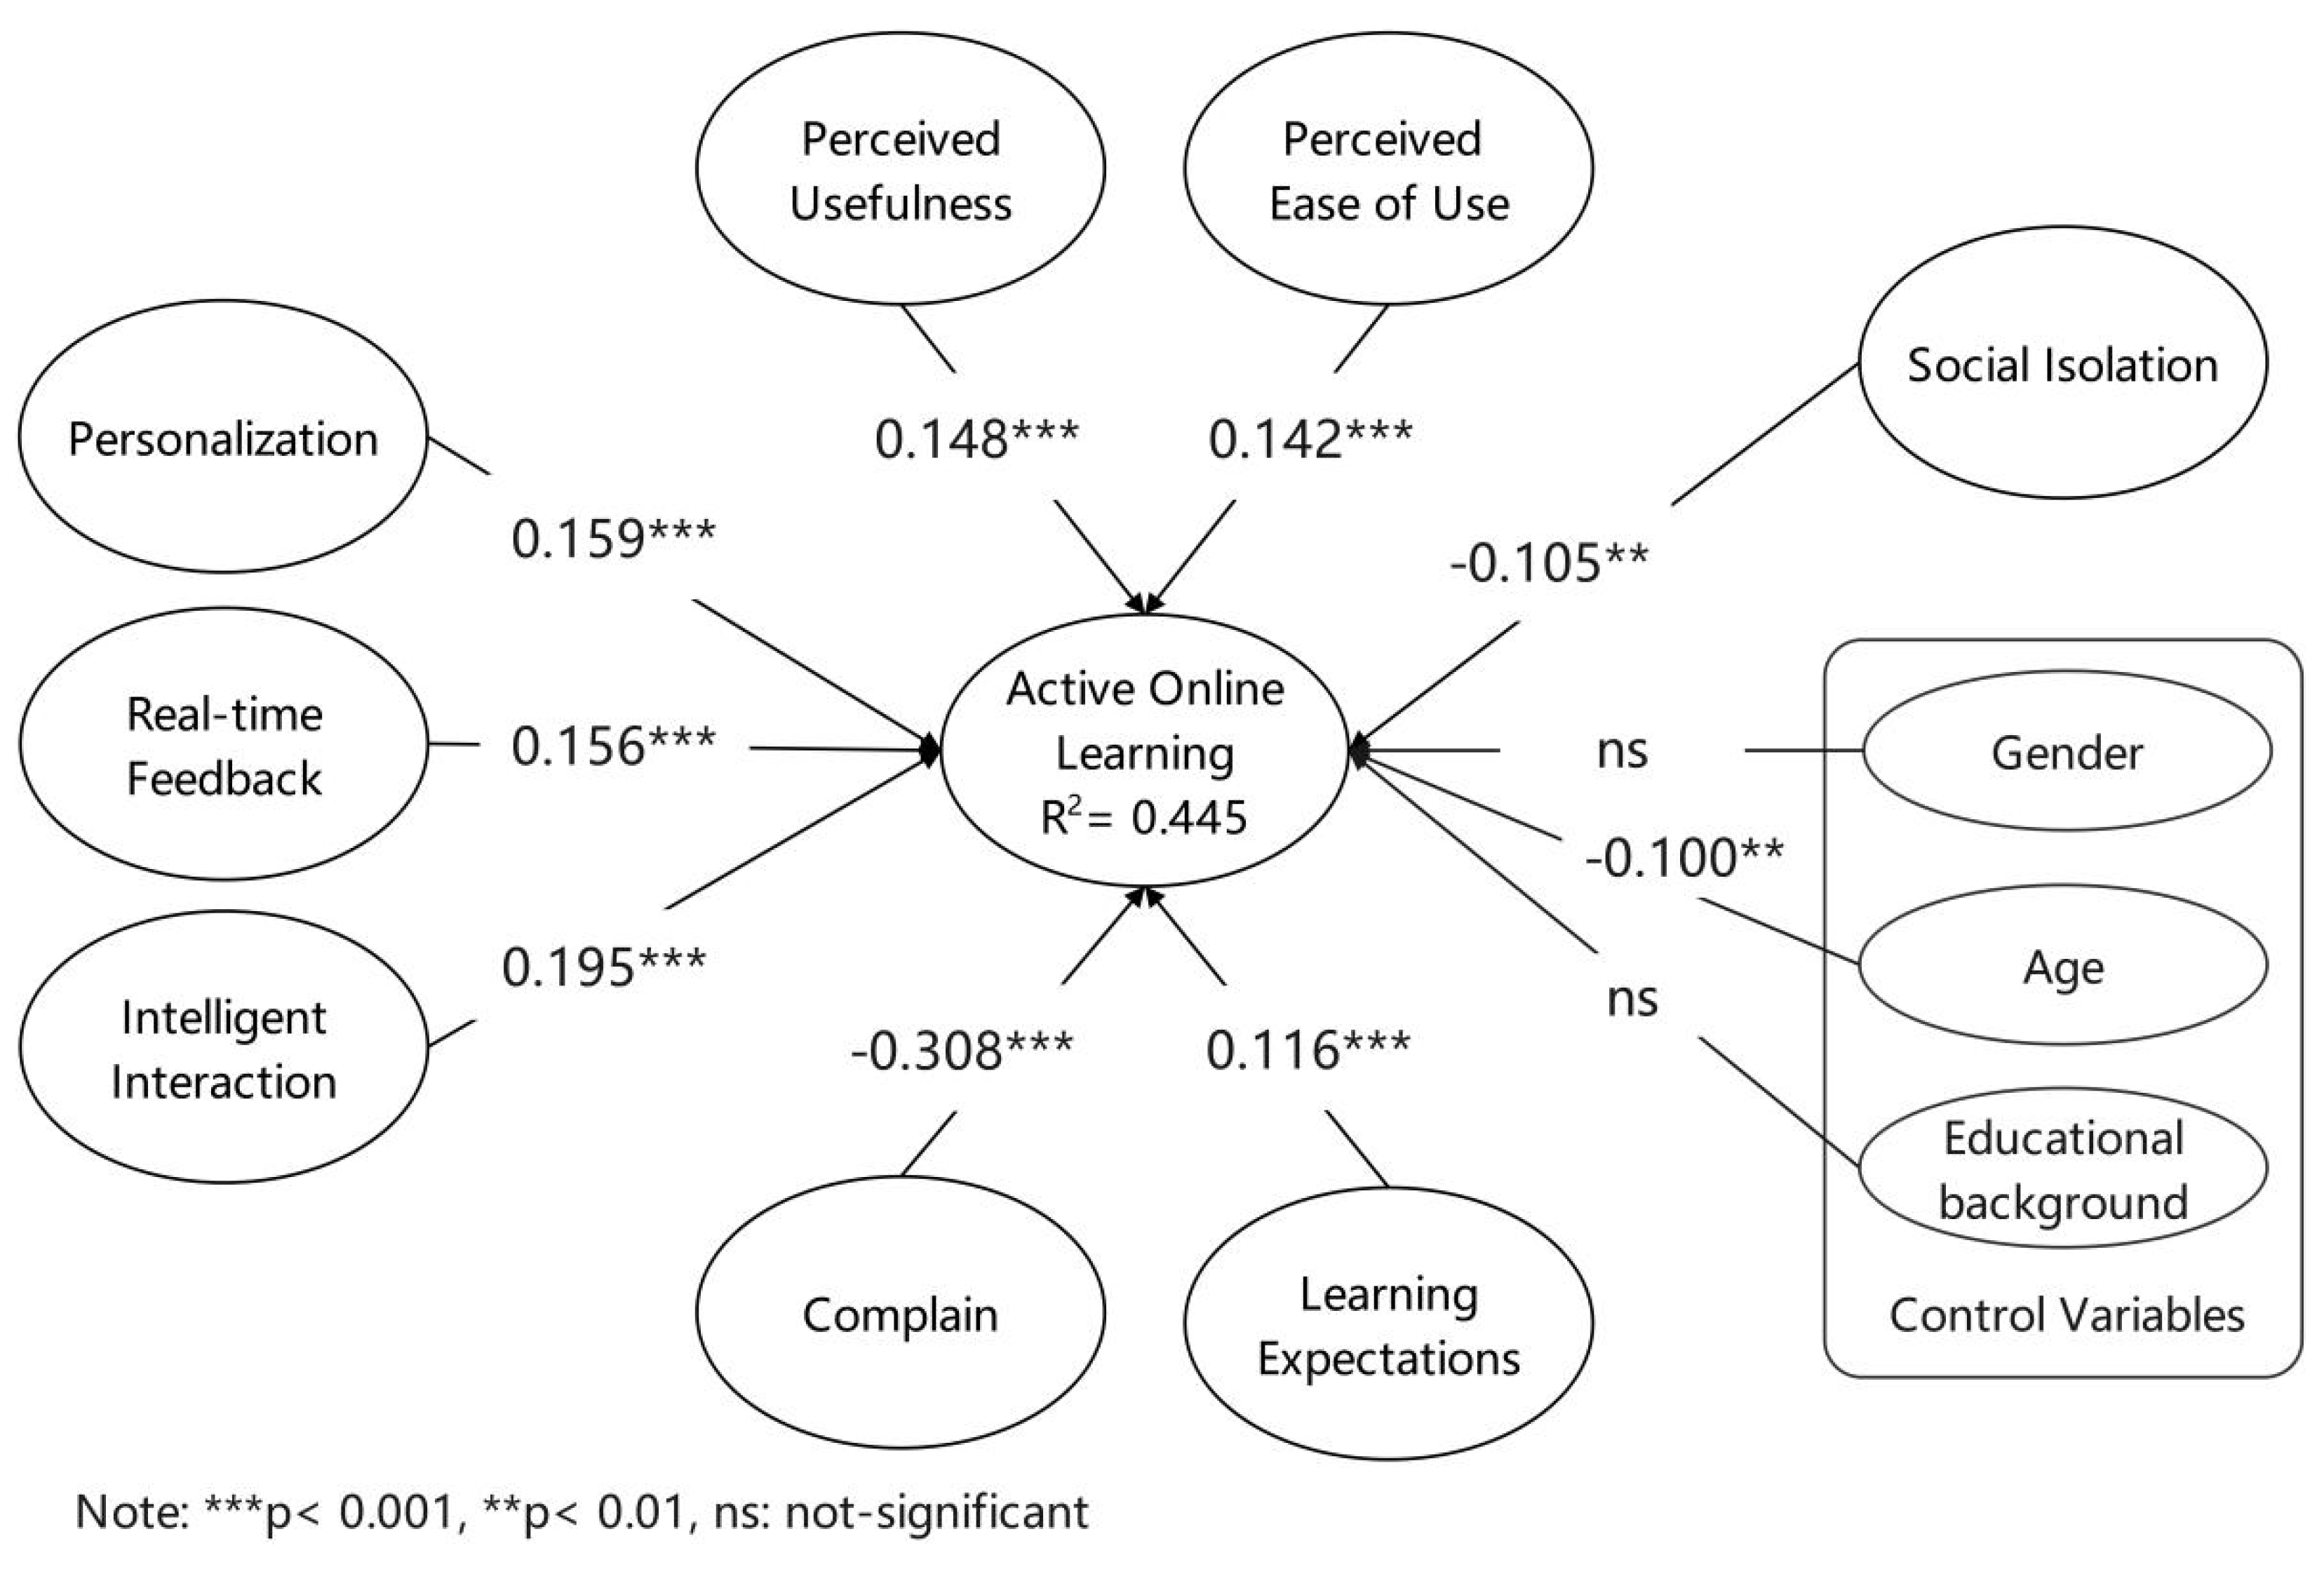
4.4. Structural Model Assessment

This study used SmartPLS 3 to build and analyze the model [90,94], and the sample size of bootstrapping was 5000 to calculate the significance of paths. Figure 2 shows the r study results on active online learning of PLS-SEM by university students.
Figure 2 shows that the R2 (explained variance) for active online learning is 0.455, indicating a good prediction of the studied model [90]. This study used Stone-Geisser’s Cross-validation method to calculate the Q2 value to evaluate the predictive relevance of the model [90,94]. Values of Q2 greater than 0, 0.25, and 0.50 are meaningful and indicate the PLS path model’s small, medium, and considerable prediction accuracy in that order [90]. The value of Q2 for active online learning obtained using the Blindfolding algorithm is 0.262, indicating a moderate prediction accuracy. Standardized Root Mean Square Residual (SRMR) can be used to measure the model fit of PLS-SEM [8,97]. The SRMR value obtained by SmartPLS 3 calculation is 0.038, which is less than the critical value of 0.08, which further shows that the overall model of this study has a reasonable degree of adaptation [90,95], and can explain the influencing factors of active online learning in the smart learning environment. The summarized hypothesis test results are shown in Table 7.

4.5. Measurement Invariance

To measure the invariance of the model, according to the measurement invariance of composite models (MICOM) developed explicitly for PLS-SEM by Henseler et al. [98], a three-step test is used to determine that the latent variables of different groups have the same connotation. First of all, different genders have adopted entirely consistent measurement items, data processing methods, and analysis techniques to have configuration invariance; secondly, the compositional invariance results passed the test (p > 0.05, two-tailed); finally, the equal mean values and variances confidence interval results show no significant difference. Therefore, it is believed that this model has exhibited full invariance in gender grouping.

5. Discussion and Conclusions

5.1. Personalization, Real-Time Feedback, and Intelligent Interaction Promote Active Online Learning

The analysis results show that personalization, real-time feedback, and intelligent interaction in smart learning environments significantly impact students’ active online learning. The quasi-permanent separation of students and teachers during online learning often has an impact on teaching presence, and social company [83], intelligent interaction and immediate, intelligent interaction and real-time feedback can somehow compensate for the lack of teaching presence and social presence, thus helping to improve the effectiveness of active online learning. Personalized smart learning environments provide learners with learning materials, learning paths, and learning partners adapted to their needs, and personalization is an essential factor in improving the quality and initiative of students’ learning [45,46].
E-learning can be divided into synchronous and asynchronous according to time, and the learning space corresponds to synchronous and asynchronous online classrooms, respectively. Whether in synchronous or asynchronous classrooms, intelligent interaction, real-time feedback, and personalization should be the fundamental elements teachers must consider when building an online learning environment. With technology development, more and more learning management systems (LMS) provide well-designed interaction, feedback, and personalization tools. Teachers should implement information technology and deeply integrate the relevant technological functions with the teaching methods to build a smart learning environment. Figure 3 shows the proposed Online Smart Teaching Model, which includes intelligent interaction, real-time feedback, personalization, content presentation, and classroom management. Content presentation, class management, and recording process are six aspects that facilitate teachers’ online smart learning environment. Content presentation refers to presenting teaching content in different teaching methodologies and solving vital and challenging class problems. Class management means that teachers can understand students’ learning status in real-time through the platform to provide targeted tutoring to an individual student. The recording process represents that the whole process of students’ learning is recorded by the system, and targeted learning analysis can be taken.
This study only explores intelligent interaction, immediate feedback, and personalization, and subsequent studies will further investigate a broader range of online innovative teaching models in conjunction with specific synchronous or asynchronous teaching.

5.2. Technology Acceptance on Active Online Learning

There is a significant positive impact of perceived ease of use and perceived usefulness for online learning, suggesting that when learners actively perceive their learning will increase benefits and supports, it will also increase the probability of implementing learning on the online platform. The relationship between perceived ease of use and perceived usefulness for behavior in the technology acceptance model is similar to existing findings [39,58]. However, previous studies lacked attention to the effects of perceived effectiveness and perceived ease of use on active online learning. Online learning requires a technology platform based on the integration of software and hardware, and it will be a significant impediment if learners do not have access to the learning supports when they encounter technical problems. Learners’ perceived usefulness of online learning comes from the subjective perception of what they have learned in the course and how it will help them in their future work or life; therefore, optimizing the learning system’s functionality and quality of resources is the way to promote active learning online. A smart learning environment aims to provide an accessible, engaged, and effective learning space [31] for online learners. Intelligent technologies should be used to solve the existing problems and lower the technology threshold. The functionality of smart learning environments (i.e., personalization, real-time feedback, intelligent communication, etc.) and the Technology Acceptance Model are associated closely. The relationship among these factors would be studied in the future to understand how online learning happens in smart environments.

5.3. A Sense of Social Isolation Is Significantly Negative for Active Online Learning

A unique finding is that social isolation directly and negatively affects active online learning, indicating that high levels of social isolation negatively affect active online learning behaviors [63,69]. When social isolation levels are higher, learners feel more isolated and lonelier, and social isolation harms active online learning and vice versa. However, research has found that a good sense of social presence and interaction can improve online learning [61], suggesting that online instructional design should utilize multiple strategies to reconnect teachers and learners in cyberspace. Learners often experience isolation and alienation in online learning environments. These negative emotions can be reduced or eliminated by enhancing learners’ social awareness [63], and creating a congenial learning environment and a sense of belonging to a group can facilitate active learning online [67]. Blended learning, which cultivates group discussions and collaborative learnings, can lower the adverse feelings of isolation and loneliness [50]; productive academic performance under such interactive learning styles supports the idea that social isolation harms active online learning. The approach of mutual help of blended learning escapes learners from the isolation of studying from home, and learners can gain more opportunities to learn and communicate with each other through the assistance of learners [65]. Learners who struggle in their studies will quickly lose self-confidence when they meet a challenge in a long time without supervision; if they could seek help from individualized tutoring offered by the intelligent learning system, it would be another story. This study confirms that social isolation is one of the most critical factors influencing active online learning and identifies the pathways through which social isolation affects active online learning.

5.4. Reduce the Gap Caused by Learning Expectations with the Help of Intelligent Technology

The results show that students’ learning expectations will significantly affect their online learning activity, proving that learning expectations are also crucial factors affecting active online learning. This result is similar to the findings of existing research [71,72]. The development of intelligent technology offers many conveniences for online learning, while personalized data analysis helps learners set expected goals to meet their specific needs. The real-time feedback feature can instantly correct learners’ learning progress ahead or behind; intelligent interaction can collect the content that learners are not satisfied with the learning process and give emotional guidance and comfort. The results of the data analysis support the hypothesis that learning expectations influence active online learning, indicating that learning expectations should be considered in the analysis of learning processes. The customer satisfaction model [73] emphasizes that expectation is a crucial factor affecting satisfaction, and this study confirms that learning expectation brings about active online learning behaviors.

5.5. Pay Attention to the Improvement Opportunities Contained in Learning Complaints

An interesting finding of this study is that learning complaints also affect active online learning. The results show that learning complaints is a factor that negatively affects active online learning, indicating that the probability of implementing active online learning decreases when there are more learning complaints. In online learning, unstable or slow Internet speed, slow system response, and insufficient battery capacity generate learners’ complaints. As the complaints spread, the expectation of active online learning decreases, and the probability of implementing active online learning behaviors decreases. Smart learning environment theory [31] helps understand the internal causes of learning complaints and provides insights into the reasons. The factors influencing complaints and how to deal with these issues should be considered to develop a smart learning environment. Unlike earlier research, this study introduces the customer satisfaction model [73] into the study of online learning, which indicates that online learning analytics should focus more on identifying specific causes of complaints rather than being confined to calming learners’ emotions.

5.6. Control Variable

The results of this study show that gender and educational background do not bring about differences in online active learning behavior, which is consistent with previous research findings [5,104], but inconsistent with the findings from Yu [105]. For the influence of gender and educational background, research results often indicated mixed results [106]. From the perspective of active online learning in the smart learning environment, teachers do not need to worry too much about the adverse effects of gender and educational background, but to pay more attention to the instructional design and delivery methods. The data analysis results indicate that age will significantly negatively affect students’ online active learning, similar to the prior research [30]. Therefore, teachers and schools need to consider this when promoting students’ active online learning.

6. Limitations and Future Study

This study focused on an active and constructed online learning research framework by combining learning satisfaction, TAM, smart learning environments, and social presence. Based on the literature review and teaching experience, the corresponding situational variables were integrated with the proposed active online learning model. Eight aspects—personalization, real-time feedback, intelligent interaction, perceived usefulness, perceived ease of use, social isolation, learning expectations, and learning complaints—were used to explore the impact of smart learning environments and related factors on active online learning. The research sample was collected through scale design and an online questionnaire, and the model was analyzed empirically using SPSS 25 and SmartPLS 3; the research hypotheses were tested with the help of partial least squares structural equation modeling. Based on these findings, this study also targeted the corresponding improvement suggestions to provide references for theoretical and implementation recommendations for better learning outcomes of active online learning in a smart learning environment.
This study has obtained specific results in theoretical development and practical revelation, but there are still some limitations, due to the objective conditions. First, future research can further evaluate the variables in-depth, for example, the differences of online synchronous learning environments and the group differences in age grouping and educational background. Second, although using a homogeneous student sample helps obtain a more decisive theoretical test [24,86], the representativeness of the sample in this study has certain limitations, which may limit the generality of the conclusions of this study. In the future, the model’s applicability can be verified by expanding the sample size and scope.

Author Contributions

Conceptualization, S.W. and J.Y.; methodology, S.W.; software, S.W.; validation J.Y. and G.S.; formal analysis, R.L.; investigation, M.L.; resources, J.Y.; data curation, S.W.; writing—original draft preparation, S.W., J.Y., G.S.; writing—review and editing, J.Y., M.L.; visualization, S.W.; supervision, J.Y.; project administration, S.W.; funding acquisition, J.Y. All authors have read and agreed to the published version of the manuscript.

Funding

This research was funded by the 2019 Zhejiang Provincial Philosophy and Social Planning Project: Design and Evaluation of Learning Space for Digital Learners (No: 19ZJQN21YB), and the key cultivating project from the school of education in HZNU “Study on learning space and smart class for digital generation students” (No. 18JYXK007).

Institutional Review Board Statement

Not applicable.

Informed Consent Statement

Informed consent was obtained from all subjects involved in the study.

Data Availability Statement

The data presented in this study are available on request from the corresponding author.

Acknowledgments

Thanks to Liangwei Tu for her assistance in the language expression of the article.

Conflicts of Interest

The authors declare no conflict of interest.

References

  1. Zhu, Z.; Guo, S.; Wu, J. Interpretation of the policy of “school closure without stopping”, key issues and response measures. China Educ. Technol. 2020, 4, 1–7. [Google Scholar]
  2. Dai, D.; Lin, G. Online home study plan for postponed 2020 spring semester during the COVID-19 epidemic: A case study of Tangquan middle school in Nanjing, Jiangsu Province, China. Best Evid. Chin. Educ. 2020, 4, 543–547. [Google Scholar] [CrossRef]
  3. Zhou, L.; Wu, S.; Zhou, M.; Li, F. ‘School’s Out, But Class’ On’, The Largest Online Education in the World Today: Taking China’s Practical Exploration During The COVID-19 Epidemic Prevention and Control As an Example. Best Evid. Chin. Educ. 2020, 4, 501–519. [Google Scholar] [CrossRef]
  4. Bao, W. COVID-19 and online teaching in higher education: A case study of Peking University. Hum. Behav. Emerg. Technol. 2020, 2, 1–3. [Google Scholar] [CrossRef] [PubMed] [Green Version]
  5. Wang, C.H.; Shannon, D.M.; Ross, M.E. Students’ characteristics, self-regulated learning, technology self-efficacy, and course outcomes in online learning. Distance Educ. 2013, 34, 302–323. [Google Scholar] [CrossRef]
  6. Shao, C. An Empirical Study on the Identification of Driving Factors of Satisfaction with Online Learning Based on TAM. In Proceedings of the 5th International Conference on Economics, Management, Law and Education (EMLE 2019), Krasnodar, Russia, 11–12 October 2019; pp. 1067–1073. [Google Scholar]
  7. Ali, A.; Bhasin, J. A Model of Information System Interventions for e-Learning: An Empirical Analysis of Information System Interventions in e- Learner Perceived Satisfaction. In Proceedings of ICRIC 2019; Springer: Cham, Switzerland, 2020; pp. 909–920. [Google Scholar]
  8. Al-Fraihat, D.; Joy, M.; Sinclair, J. Evaluating E-learning systems success: An empirical study. Comput. Hum. Behavior. 2020, 102, 67–86. [Google Scholar] [CrossRef]
  9. Nayernia, A. Development and validation of an e-teachers’ autonomy support scale: A SEM approach. Development 2020, 14, 117–134. [Google Scholar]
  10. Ajjan, H.; Hartshorne, R. Investigating faculty decisions to adopt Web 2.0 technologies: Theory and empirical tests. Internet High. Educ. 2008, 11, 71–80. [Google Scholar] [CrossRef]
  11. Teo, T.; Van, S.P. Understanding technology acceptance in pre-service teachers: A structural-equation modeling approach. Asia-Pac. Educ. Res. 2009, 18, 47–66. [Google Scholar] [CrossRef] [Green Version]
  12. Hsu, H.; Chang, Y. Extended TAM model: Impacts of convenience on acceptance and use of Moodle. Online Submiss. 2013, 3, 211–218. [Google Scholar]
  13. Li, X. Students’ Acceptance of Mobile Learning: An Empirical Study Based on Blackboard Mobile Learn/Mobile Devices in Education: Breakthroughs in Research and Practice; IGI Global: Hershey, PA, USA, 2020; pp. 354–373. [Google Scholar]
  14. Al-Maroof, R.A.S.; Al-Emran, M. Students acceptance of Google classroom: An exploratory study using PLS-SEM approach. Int. J. Emerg. Technol. Learn. 2018, 13, 112–123. [Google Scholar] [CrossRef]
  15. Gómez-Ramirez, I.; Valencia-Arias, A.; Duque, L. Approach to M-learning Acceptance Among University Students: An Integrated Model of TPB and TAM. Int. Rev. Res. Open Distrib. Learn. 2019, 20, 141–164. [Google Scholar]
  16. Kurdi, B.A.; Alshurideh, M.; Salloum, S.A.; Obeidat, Z.M.; Aldweeri, R.M. An Empirical Investigation into Examination of Factors Influencing University Students’ Behavior towards Elearning Acceptance Using SEM Approach. Int. J. Interact. Mob. Technol. 2020, 14, 19–41. [Google Scholar] [CrossRef] [Green Version]
  17. Hsu, C.L.; Lin, J.C.C. Acceptance of blog usage: The roles of technology acceptance, social influence and knowledge sharing motivation. Inf. Manag. 2008, 45, 65–74. [Google Scholar] [CrossRef]
  18. Ramayah, T.; Lee, J.W.C. System characteristics, satisfaction and e-learning usage: A structural equation model (SEM). Turk. Online J. Educ. Technol. 2012, 11, 196–206. [Google Scholar]
  19. Chang, C.C.; Yan, C.F.; Tseng, J.S. Perceived convenience in an extended technology acceptance model: Mobile technology and English learning for college students. Australas. J. Educ. Technol. 2012, 28, 809–826. [Google Scholar] [CrossRef] [Green Version]
  20. Wu, B.; Chen, X. Continuance intention to use MOOCs: Integrating the technology acceptance model (TAM) and task technology fit (TTF) model. Comput. Hum. Behav. 2017, 67, 221–232. [Google Scholar] [CrossRef]
  21. Zhang, S.; Zhao, J.; Tan, W. Extending TAM for online learning systems: An intrinsic motivation perspective. Tsinghua Sci. Technol. 2008, 13, 312–317. [Google Scholar] [CrossRef]
  22. Chen, K.C.; Jang, S.J. Motivation in online learning: Testing a model of self-determination theory. Comput. Hum. Behav. 2010, 26, 741–752. [Google Scholar] [CrossRef]
  23. Ngai, E.W.T.; Poon, J.K.L.; Chan, Y.H.C. Empirical examination of the adoption of WebCT using TAM. Comput. Educ. 2007, 48, 250–267. [Google Scholar] [CrossRef]
  24. Liu, I.F.; Chen, M.C.; Sun, Y.S.; Wible, D.; Kuo, H.C. Extending the TAM model to explore the factors that affect Intention to Use an Online Learning Community. Comput. Educ. 2010, 54, 600–610. [Google Scholar] [CrossRef]
  25. Barclay, C.; Osei-Bryson, K.M. An Analysis of Students’ Perceptions and Attitudes to Online Learning Use in Higher Education in Jamaica: An Extension of TAM. In Proceedings of the Annual Workshop of the AIS special Interest Group for ICT in Global Development, Orlando, FL, USA, 16 December 2012. [Google Scholar]
  26. Wong, K.T.; Osman, R.B.; Goh, P.; Rahmat, M.K. Understanding Student Teachers’ Behavioural Intention to Use Technology: Technology Acceptance Model (TAM) Validation and Testing. Int. J. Instr. 2013, 6, 89–104. [Google Scholar]
  27. Mohammadi, H. Investigating users’ perspectives on e-learning: An integration of TAM and IS success model. Comput. Hum. Behav. 2015, 45, 359–374. [Google Scholar] [CrossRef]
  28. Sánchez-Mena, A.; Martí-Parreño, J.; Aldás-Manzano, J. The Effect of Age on Teachers’ Intention to Use Educational Video Games: A TAM Approach. Electron. J. E-Learn. 2017, 15, 355–366. [Google Scholar]
  29. Huang, F.; Teo, T.; Scherer, R. Investigating the antecedents of university students’ perceived ease of using the Internet for learning. Interact. Learn. Environ. 2020, 3, 1–17. [Google Scholar] [CrossRef]
  30. Lai, C.; Wen, Y.; Gao, T.; Lin, C. Mechanisms of the Learning Impact of Teacher-Organized Online Schoolwork Sharing Among Primary School Students. J. Educ. Comput. Res. 2020, 58, 0735633119896874. [Google Scholar] [CrossRef]
  31. Huang, R.H.; Yang, J.F.; Hu, Y.B. From digital learning environment to smart learning environment--changes and trends of learning environment. Open Educ. Res. 2012, 18, 75–84. [Google Scholar]
  32. Guo, W.; Feng, X.; Cai, M. Factors influencing learners’ learning effectiveness in a smart learning environment. Mod. Educ. Technol. 2020, 12, 69–75. [Google Scholar]
  33. Eom, S. Effects of interaction on students’ perceived learning satisfaction in university online education: An empirical investigation. Int. J. Glob. Manag. Stud. 2009, 1, 60–74. [Google Scholar]
  34. Lee, Y.J. A study of the influence of instructional innovation on learning satisfaction and study achievement. J. Hum. Resour. Adult Learn. 2008, 2, 43–54. [Google Scholar]
  35. Atif, Y.; Mathew, S.S.; Lakas, A. Building a smart campus to support ubiquitous learning. J. Ambient Intell. Humaniz. Comput. 2015, 6, 223–238. [Google Scholar] [CrossRef]
  36. Hew, T.S.; Kadir, S.L.S.A. Predicting the acceptance of cloud-based virtual learning environments: The roles of Self Determination and Channel Expansion Theory. Telemat. Inform. 2016, 33, 990–1013. [Google Scholar] [CrossRef]
  37. Sungkur, R.K.; Maharaj, M.S. Design and implementation of a SMART learning environment for the Upskilling of Cybersecurity professionals in Mauritius. Educ. Inf. Technol. 2021, 26, 3175–3201. [Google Scholar] [CrossRef]
  38. Turney, C.S.M.; Robinson, D.; Lee, M.; Soutar, A. Using technology to direct learning in higher education: The way forward? Act. Learn. High. Educ. 2009, 10, 71–83. [Google Scholar] [CrossRef]
  39. Davis, F.D.; Bagozzi, R.P.; Warshaw, P.R. User acceptance of computer technology: A comparison of two theoretical models. Manag. Sci. 1989, 35, 982–1003. [Google Scholar] [CrossRef] [Green Version]
  40. Al-Emran, M.; Mezhuyev, V.; Kamaludin, A. Technology Acceptance Model in M-learning context: A systematic review. Comput. Educ. 2018, 125, 389–412. [Google Scholar] [CrossRef]
  41. Šumak, B.T.; Heričko, M.; Pušnik, M. A meta-analysis of e-learning technology acceptance: The role of user types and e-learning technology types. Comput. Hum. Behav. 2011, 27, 2067–2077. [Google Scholar] [CrossRef]
  42. Gibson, S.G.; Harris, M.L.; Colaric, S.M. Technology acceptance in an academic context: Faculty acceptance of online education. J. Educ. Bus. 2008, 83, 355–359. [Google Scholar] [CrossRef]
  43. Wu, J.H.; Tennyson, R.D.; Hsia, T.L. A study of student satisfaction in a blended e-learning system environment. Comput. Educ. 2010, 55, 155–164. [Google Scholar] [CrossRef]
  44. Pardo, A.; Jovanovic, J.; Dawson, S.; Gašević, D.; Mirriahi, N. Using learning analytics to scale the provision of personalised feedback. Br. J. Educ. Technol. 2019, 50, 128–138. [Google Scholar] [CrossRef] [Green Version]
  45. Kurilovas, E. Advanced machine learning approaches to personalise learning: Learning analytics and decision making. Behav. Inf. Technol. 2019, 38, 410–421. [Google Scholar] [CrossRef]
  46. Kubilinskienė, S.; Kurilov, J. On methodology of application of linked data to personalise learning. In Proceedings of the INTED 2020: 14th International Technology, Education and Development Conference, Valencia, Spain, 2–4 March 2020; pp. 845–852. [Google Scholar]
  47. Sun, P.C.; Tsai, R.J.; Finger, G.; Chen, Y.Y.; Yeh, D. What drives a successful e-Learning? An empirical investigation of the critical factors influencing learner satisfaction. Comput. Educ. 2008, 50, 1183–1202. [Google Scholar] [CrossRef]
  48. Petter, S.; DeLone, W.; McLean, E. Measuring information systems success: Models, dimensions, measures, and interrelationships. Eur. J. Inf. Syst. 2008, 17, 236–263. [Google Scholar] [CrossRef]
  49. Leong, P. Role of social presence and cognitive absorption in online learning environments. Distance Educ. 2011, 32, 5–28. [Google Scholar] [CrossRef]
  50. Joo, Y.J.; Lim, K.Y.; Kim, E.K. Online university students’ satisfaction and persistence: Examining perceived level of presence, usefulness and ease of use as predictors in a structural model. Comput. Educ. 2011, 57, 1654–1664. [Google Scholar] [CrossRef]
  51. Wang, S.F.; Huang, R.H. Research on the Mechanism and Promotion Strategy of Active online learning Intention. Open Educ. Res. 2020, 5, 99–110. [Google Scholar]
  52. Howard, S.K.; Tondeur, J.; Siddiq, F.; Scherer, R. Ready, set, go! Profiling teachers’ readiness for online teaching in secondary education. Technol. Pedagog. Educ. 2020, 30, 141–158. [Google Scholar] [CrossRef]
  53. Zhan, Z.; Mei, H. Academic self-concept and social presence in face-to-face and online learning: Perceptions and effects on students’ learning achievement. Comput. Educ. 2013, 69, 131–138. [Google Scholar] [CrossRef]
  54. Moon, J.W.; Kim, Y.G. Extending the TAM for a World-Wide-Web context. Inf. Manag. 2001, 38, 217–230. [Google Scholar] [CrossRef]
  55. Kuo, Y.F.; Yen, S.N. Towards an understanding of the behavioral intention to use 3G mobile value-added services. Comput. Hum. Behav. 2009, 25, 103–110. [Google Scholar] [CrossRef]
  56. Teo, T.; Luan, W.S.; Sing, C.C. A cross-cultural examination of the intention to use technology between Singaporean and Malaysian pre-service teachers: An application of the Technology Acceptance Model (TAM). J. Educ. Technol. Soc. 2008, 11, 265–280. [Google Scholar]
  57. Dhume, S.M.; Pattanshetti, M.Y.; Kamble, S.S.; Prasad, T. Adoption of social media by business education students: Application of Technology Acceptance Model (TAM). In Proceedings of the 2012 IEEE International Conference on Technology Enhanced Education (ICTEE), Amritapuri, India, 3–5 January 2012; pp. 1–10. [Google Scholar]
  58. Yu, N.; Wang, D.; Li, D.; Zhang, Q.; Wang, L.; Wang, H.B. The Status and Hotspots of Smart Learning: Base on the Bibliometric Analysis and Knowledge Mapping. J. Phys. Conf. Ser. 2020, 1486, 032016. [Google Scholar]
  59. Zhang, M.X. A study on college students’ willingness to use social reading app consistently—The mediating effect of immersion experience. J. Univ. Libr. 2021, 39, 100–109. [Google Scholar]
  60. Rasheed, R.A.; Kamsin, A.; Abdullah, N.A. Challenges in the online component of blended learning: A systematic review. Comput. Educ. 2020, 144, 103701. [Google Scholar] [CrossRef]
  61. Tu, C.H. The measurement of social presence in an online learning environment. Int. J. E-Learn. 2002, 1, 34–45. [Google Scholar]
  62. Akcaoglu, M.; Lee, E. Increasing social presence in online learning through small group discussions. Int. Rev. Res. Open Distrib. Learn. 2016, 17, 1–17. [Google Scholar] [CrossRef] [Green Version]
  63. Rovai, A.P. Facilitating online discussions effectively. Internet High. Educ. 2007, 10, 77–88. [Google Scholar] [CrossRef]
  64. Berenson, R.; Boyles, G.; Weaver, A. Emotional intelligence as a predictor of success in online learning. Int. Rev. Res. Open Distrib. Learn. 2008, 9, 1–17. [Google Scholar] [CrossRef] [Green Version]
  65. Shen, D.; Nuankhieo, P.; Huang, X.; Amelung, C.; Laffey, J. Using social network analysis to understand sense of community in an online learning environment. J. Educ. Comput. Res. 2008, 39, 17–36. [Google Scholar] [CrossRef]
  66. Wei, C.W.; Chen, N.S. A model for social presence in online classrooms. Educ. Technol. Res. Dev. 2012, 60, 529–545. [Google Scholar] [CrossRef]
  67. Hu, Y. Social network analysis of social presence in online collaborative learning process. Mod. Distance Educ. Res. 2013, 1, 69–77. [Google Scholar]
  68. Chen, T.; He, X.Q.; Ge, W.S.; He, J.H. Research on grouping method and application of large-scale online collaborative learning. Comput. Eng. Appl. 2020, 4, 1–9. [Google Scholar]
  69. Derakhshandeh, Z.; Esmaeili, B. Active-Learning in the Online Environment. J. Educ. Multimed. Hypermedia 2020, 29, 299–311. [Google Scholar]
  70. Lee, M.C. Explaining and predicting users’ continuance intention toward e-learning: An extension of the expectation-confirmation. Comput. Educ. 2010, 54, 506–516. [Google Scholar] [CrossRef]
  71. Xu, J.; Tian, Y.; Gao, B.; Zhuang, R.; Yang, L. A study on learner satisfaction based on learning experience in smart classrooms. Mod. Educ. Technol. 2018, 28, 40–46. [Google Scholar]
  72. Prasad, P.W.C.; Maag, A.; Redestowicz, M.; Hoe, L.S. Unfamiliar technology: Reaction of international students to blended learning. Comput. Educ. 2018, 122, 92–103. [Google Scholar] [CrossRef]
  73. Fornell, C.; Johnson, M.D.; Anderson, E.W.; Cha, J. The American customer satisfaction index: Nature, purpose, and findings. J. Mark. 1996, 60, 7–18. [Google Scholar] [CrossRef] [Green Version]
  74. Hu, F.S.; Zhang, M.M.; Li, M. Empirical evidence of factors influencing satisfaction with the new rural social pension insurance system. J. Public Adm. 2014, 11, 95–104. [Google Scholar]
  75. Peng, D.; Li, C.; Chen, G. A study on customer satisfaction of professional tennis tournaments in China—Taking the Wuhan Open as an example. J. Wuhan Inst. Sports 2016, 50, 77–83. [Google Scholar]
  76. Huang, S.J.; Xi, S.W.; Wang, J. A study of domestic entertainment-based theme park visitor satisfaction—Based on the three major theme parks in Jiangxi. Jiangxi Soc. Sci. 2018, 38, 60–67. [Google Scholar]
  77. Li, M.; Feng, Y.; Tang, P. Research on the factors influencing rural homestead exit farmers’ satisfaction—Based on research data from typical areas in Sichuan Province. West. Forum 2019, 29, 45–54. [Google Scholar]
  78. Palloff, R.M.; Pratt, K. Building Online Learning Communities: Effective Strategies for the Virtual Classroom, 2nd ed.; John Wiley & Sons: San Francisco, CA, USA, 2007. [Google Scholar]
  79. Demuyakor, J. Coronavirus (COVID-19) and online learning in higher institutions of education: A survey of the perceptions of Ghanaian international students in Online. J. Commun. Media Technol. 2020, 10, e202018. [Google Scholar] [CrossRef]
  80. Wargadinata, W.; Maimunah, I.; Eva, D.; Rofiq, Z. Student’s responses on learning in the early COVID-19 pandemic. J. Educ. Teach. Train. 2020, 5, 141–153. [Google Scholar] [CrossRef]
  81. Putri, E.R. EFL teachers’ challenges for online learning in rural areas. UNNES-TEFLIN Natl. Semin. 2021, 4, 402–409. [Google Scholar]
  82. Safford, K.; Stinton, J. Barriers to blended digital distance vocational learning for non-traditional students. Br. J. Educ. Technol. 2016, 47, 135–150. [Google Scholar] [CrossRef]
  83. Garrison, D.R.; Cleveland-Innes, M.; Fung, T.S. Exploring causal relationships among teaching, cognitive and social presence: Student perceptions of the community of inquiry framework. Internet High. Educ. 2010, 13, 31–36. [Google Scholar] [CrossRef]
  84. Xu, F.; Du, J.T. Factors influencing users’ satisfaction and loyalty to digital libraries in Chinese universities. Comput. Hum. Behav. 2018, 83, 64–72. [Google Scholar] [CrossRef]
  85. Bhattacherjee, A. Understanding Information Systems Continuance: An Expectation-confirmation Model. MIS Q 2001, 25, 351–370. [Google Scholar] [CrossRef]
  86. Baek, T.H.; Morimoto, M. Stay Away From Me: Examining the Determinants of Consumer Avoidance of Personalized Advertising. J. Advert. 2021, 41, 59–76. [Google Scholar] [CrossRef]
  87. Zhu, D. A study on the impact of e-service quality on the continuous use of social reading service users--a mobile news app as an example. Mod. Intell. 2019, 39, 76–85. [Google Scholar]
  88. Chen, Q.; Chen, H.M.; Kazman, R. Investigating antecedents of technology acceptance of initial eCRM users beyond generation X and the role of self-construal. Electron. Commer. Res. 2007, 7, 315–339. [Google Scholar] [CrossRef]
  89. Straub, D.; Boudreau, M.C.; Gefen, D. Validation guidelines for IS positivist research. Commun. Assoc. Inf. Syst. 2004, 13, 24. [Google Scholar] [CrossRef]
  90. Hair, J.F.; Risher, J.J.; Sarstedt, M.; Ringle, C.M. When to use and how to report the results of PLS-SEM. Eur. Bus. Rev. 2019, 31, 2–24. [Google Scholar] [CrossRef]
  91. DeLone, W.H.; McLean, E.R. The DeLone and McLean model of information systems success: A ten-year update. J. Manag. Inf. Syst. 2003, 19, 9–30. [Google Scholar]
  92. Hossain, M.A.; Quaddus, M. Expectation-Confirmation Theory in Information System Research: A Review and Analysis. Upsala. J. Med. Sci. 2011, 112, 347–355. [Google Scholar]
  93. Tang, J.T.E.; Chiang, C.H. Integrating experiential value of blog use into the expectation-confirmation theory model. Soc. Behav. Personal. Int. J. 2010, 38, 1377–1389. [Google Scholar] [CrossRef]
  94. Chin, W.W. How to Write Up and Report PLS Analyses; Springer: Berlin/Heidelberg, Germany, 2010; pp. 655–690. [Google Scholar]
  95. Cepeda-Carrion, G.; Cegarra-Navarro, J.G.; Cillo, V. Tips to use partial least squares structural equation modelling (PLS-SEM) in knowledge management. J. Knowl. Manag. 2019, 1, 67–89. [Google Scholar] [CrossRef]
  96. Wang, S.; Tlili, A.; Zhu, L.; Yang, J. Do Playfulness and University Support Facilitate the Adoption of Online Education in a Crisis? COVID-19 as a Case Study Based on the Technology Acceptance Model. Sustainability 2021, 13, 9104. [Google Scholar] [CrossRef]
  97. Sarstedt, M.; Cheah, J.H. Partial least squares structural equation modeling using SmartPLS: A software review. J. Mark. Anal. 2019, 7, 196–202. [Google Scholar] [CrossRef]
  98. Shiau, W.L.; Luo, M.M. Factors affecting online group buying intention and satisfaction: A social exchange theory perspective. Comput. Hum. Behav. 2012, 28, 2431–2444. [Google Scholar] [CrossRef]
  99. Armstrong, J.S.; Overton, T.S. Estimating nonresponse bias in mail surveys. J. Mark. Res. 1977, 14, 396–402. [Google Scholar] [CrossRef] [Green Version]
  100. Garrison, D.R.; Arbaugh, J.B. Researching the community of inquiry framework: Review, issues, and future directions. Internet High. Educ. 2007, 10, 157–172. [Google Scholar] [CrossRef]
  101. Podsakoff, P.M.; MacKenzie, S.B.; Lee, J.Y.; Podsakoff, N.P. Common method biases in behavioral research: A critical review of the literature and recommended remedies. J. Appl. Psychol. 2003, 88, 879. [Google Scholar] [CrossRef] [PubMed]
  102. Zhou, H.; Long, L.R. A statistical test and control method for common method bias. Adv. Psychol. Sci. 2004, 12, 942–950. [Google Scholar]
  103. Lindell, M.K.; Whitney, D.J. Accounting for common method variance in cross-sectional research designs. J. Appl. Psychol. 2001, 86, 114. [Google Scholar] [CrossRef] [PubMed] [Green Version]
  104. Coggins, C.C. Preferred learning styles and their impact on completion of external degree programs. Am. J. Distance Educ. 1988, 2, 25–37. [Google Scholar] [CrossRef]
  105. Yu, Z. The effects of gender, educational level, and personality on online learning outcomes during the COVID-19 pandemic. Int. J. Educ. Technol. High. Educ. 2021, 18, 1–7. [Google Scholar] [CrossRef]
  106. Simonson, M.; Zvacek, S.M.; Smaldino, S. Teaching and Learning at a Distance: Foundations of Distance Education, 7th ed.; Information Age Publishing: Charlotte, NC, USA, 2019. [Google Scholar]
Figure 1. Research framework.
Sustainability 13 09923 g001
Figure 2. Structural model PLS results.
Sustainability 13 09923 g002
Figure 3. Online Smart Teaching Model.
Sustainability 13 09923 g003
Table 1. Survey instrument.
Latent VariableMeasurement ItemsReferences
Perceived Usefulness1. Active online learning can improve my learning efficiency
2. Active online learning can improve my learning performance
3. Active online learning can help me accomplish my learning goals
4. Active online learning is effective
Davis [39]
DeLone and McLean [91]
Xu and Du [84]
Perceived Ease of Use1. Active online learning is easy to carry out
2. Active online learning is easy for me
3. Active online learning is convenient
Davis [39]
DeLone and McLean [91]
Xu and Du [84]
Personalization1. The personalized learning content recommended for me is what I am interested in
2. The personalized learning content recommended for me is in line with my hobby
3. The personalized learning content recommended for me is what I like to learn
4. The personalized learning content recommended for me is based on my needs
5. The personalized learning content recommended for me is pushed for my situation
Baek and Morimoto [86]
Zhu [87]
Zhang [59]
Real-time Feedback1. The link speed and running speed of active online learning systems are faster
2. Active online learning human machine is very smooth
3. Active online learning system can quickly respond to my needs
4. Active online learning system can feedback the content I need in time
Zhu [87]
Zhang [59]
DeLone and McLean [91]
Social Isolation1. Online learning reduces the opportunities for communication between students
2. Online learning reduces the opportunity for communication between students and teachers
3. Online learning reduces the discussion between students and students and teachers
4. Online learning gives me a sense of isolation
5. Online learning has made me feel lonely
Garrison et al. [83]
Leong [49]
Wang and Huang [51]
Smart Interaction1. The system will give me feedback on how to proceed when I am actively learning online
2. I think the online learning system is sensitive to my needs
3. I have a high level of interaction with the online learning system4. There is much interaction between me and the online learning system
Hew et al. [36]
Chen et al. [88]
Learning Expectations1. The experience of active online learning is better than I expected
2. The service of active online learning is better than I expected
3. The effect of active online learning is better than I expected
4. In short, the results of active online learning are better than I expected
Bhattacherjee [85]
Hossain and Quaddus [92]
Tang and Chiang [93]
Prasad et al. [72]
Complain1. If online learning is not satisfactory, I will have the idea of complaining
2. If online learning is not satisfactory, I will complain to my classmates
3. If online learning is not satisfactory, I will complain to the teacher
4. If online learning is not satisfactory, I will post a comment through the network
5. If online learning is not satisfactory, I will complain to the operator
Peng et al. [75]
Hu et al. [74]
Li et al. [77]
Online Active Learning1. I actively participate in the discussion of online learning
2. I actively summarize the knowledge learned after class
3. I am pleased to practice the knowledge learned online
4. I conduct active online learning frequently
5. I often visit the active online learning system
Bhattacherjee [85]
Wang and Huang [51]
Table 2. Demographics.
InformationTitle ItemQuantityPercentage
GenderMale24145.6%
Female28754.4%
Age≤17142.7%
18–2024847.0%
21–2313225.0%
24–2611020.8%
≥27244.5%
Educational backgroundVocational student15529.4%
Undergraduate student24546.4%
Postgraduate student10018.9%
Doctoral student285.3%
Table 3. AVE, CR, and Cronbach’s Alpha.
Latent VariableIDItemsCronbach’s AlphaCRAVE
ComplainCO50.8570.8970.636
Learning
Expectations
LE40.8170.8790.644
Active Online
Learning
AOL50.8360.8840.603
PersonalizationPER40.8350.8890.668
Perceived
Ease of Use
PEU30.8330.9000.749
Perceived
Usefulness
PU40.8560.9020.698
Real-time FeedbackRF40.8510.8990.691
Intelligent InteractionII40.8450.8960.682
Social IsolationSOI50.8880.9180.690
Table 4. Fornell-Larcker Discriminant Validity.
PERAOLCOLERFPEUPUIISOI
PER0.817
AOL0.3790.777
CO0.020−0.2600.798
LE0.2960.3400.0810.803
RF0.2650.3490.0530.2390.831
PEU0.2530.3350.1120.2530.2940.866
PU0.2400.3390.0200.2060.1860.2180.836
II0.2370.3980.0610.2750.2970.2970.2570.826
SOI−0.175−0.228−0.018−0.163−0.144−0.156−0.110−0.1540.831
Note: The values bolded on the diagonal are the square root of AVE.
Table 5. Cross-loading.
PERAOLCOLERFPEUPUIISOI
PER10.8190.3360.0080.2500.2210.1690.2070.233−0.147
PER20.7940.2820.0210.2440.2350.2330.1690.186−0.114
PER30.8310.330−0.0150.2510.1830.2160.1940.155−0.177
PER40.8230.2850.0580.2210.2320.2140.2120.200−0.129
AOL10.2840.747−0.1820.2540.2380.2130.2810.263−0.154
AOL20.3030.788−0.2250.2200.2590.2580.2610.330−0.171
AOL30.3200.814−0.2280.2970.2920.3220.2710.341−0.184
AOL40.2820.785−0.1960.2900.2610.2830.2690.320−0.210
AOL50.2820.748−0.1730.2590.3070.2140.2370.284−0.164
CO10.011−0.1910.7810.0560.0520.0820.0290.0420.022
CO20.032−0.1900.8360.0850.0720.1320.0600.0560.000
CO30.015−0.2240.7950.0750.0430.090−0.0030.011−0.016
CO40.030−0.2050.8000.0580.0330.091−0.0040.060−0.075
CO5−0.005−0.2210.7740.0500.0160.0550.0040.0750.000
LE10.2470.3080.0410.8210.2100.1920.1910.225−0.131
LE20.2020.2280.0860.7730.1670.2190.2050.212−0.152
LE30.2180.2670.0230.8070.1590.1840.1220.215−0.089
LE40.2780.2790.1150.8090.2240.2220.1470.229−0.153
RF10.2020.2650.0560.2180.8200.2360.1120.229−0.128
RF20.2260.2780.0380.1810.8070.2520.1810.252−0.089
RF30.2530.3240.0300.2050.8520.2390.1560.257−0.147
RF40.1960.2890.0560.1900.8440.2500.1660.248−0.112
PEU10.2300.2800.1330.2140.2540.8560.1850.226−0.192
PEU20.2340.3150.0620.2100.2630.8950.2020.283−0.119
PEU30.1900.2730.1000.2350.2450.8450.1780.262−0.094
PU10.1710.2850.0160.1710.1840.1890.8490.258−0.113
PU20.2060.2690.0180.1630.1710.1630.8490.231−0.098
PU30.1680.2740.0190.2080.1370.1760.8180.196−0.092
PU40.2520.3030.0130.1480.1310.1980.8270.179−0.068
II10.2210.3170.0430.2050.2250.2950.2400.811−0.108
II20.1520.3310.0350.2150.2490.2360.2020.801−0.139
II30.2150.2960.0750.2280.2290.2200.2030.828−0.096
II40.1990.3640.0500.2580.2740.2330.2070.862−0.160
SOI1−0.144−0.179−0.031−0.098−0.106−0.122−0.097−0.1610.803
SOI2−0.133−0.200−0.020−0.163−0.133−0.133−0.135−0.1260.879
SOI3−0.149−0.174−0.008−0.151−0.131−0.161−0.076−0.1330.815
SOI4−0.119−0.180−0.005−0.103−0.100−0.110−0.064−0.1020.826
SOI5−0.178−0.210−0.011−0.156−0.128−0.123−0.083−0.1220.829
Table 6. HTMT.
Table 6. HTMT.
PERAOLCOLERFPEUPUII
AOL0.451
CO0.0470.304
LE0.3550.4070.104
RF0.3150.4120.0690.284
PEU0.3040.3970.1360.3090.349
PU0.2810.4010.0390.2480.2170.256
II0.2830.4690.0770.3290.3480.3540.304
SOI0.2000.2630.0410.1910.1650.1820.1260.177
Table 7. Summary of hypothesis results.
No.Hypothetical RelationshipsResults
H1Personalization → Active online learning (+)Supported
H2Real-time Feedback → Active online learning (+)Supported
H3Intelligent Interaction → Active online learning (+)Supported
H4Perceived Ease of Use → Active online learning (+)Supported
H5Perceived Usefulness → Active online learning (+)Supported
H6Social Isolation → Active online learning (−)Supported
H7Learning Expectations → Active online learning (+)Supported
H8Complaints → Active online learning (−)Supported
H9aGender will lead to different active online learning behaviors.Not supported
H9bAge will lead to different active online learning behaviors.Supported
H9cEducational backgrounds will lead to different active online learning behaviors.Not supported
Publisher’s Note: MDPI stays neutral with regard to jurisdictional claims in published maps and institutional affiliations.

