Article

Economic Fluctuation, Local Government Bond Risk and Risk-Taking of City Commercial Banks

1
School of Management, Huazhong University of Science and Technology, Wuhan 430074, China
2
Department of Business Administration, Jiangxi College of Foreign Studies, Nanchang 330099, China
*
Author to whom correspondence should be addressed.
Sustainability 2021, 13(17), 9871; https://doi.org/10.3390/su13179871
Submission received: 31 July 2021 / Revised: 24 August 2021 / Accepted: 27 August 2021 / Published: 2 September 2021
(This article belongs to the Section Economic and Business Aspects of Sustainability)

Abstract

:
Countercyclical fiscal regulation can mitigate economic risk, but this is bound to increase the scale of local government debt during an economic downturn, and then spread risk to the banking sector, forming potential financial instability factors. We extracted the three most important variables in this process: economic fluctuation, local debt risk and bank risk-taking to build an econometric model and found that: (1) both economic fluctuations and local government bond risks have a significant impact on bank risk-taking, which is negatively correlated with local economic growth, while the increase of local government bond risks tends to increase bank risk-taking in the long run; (2) the impact of local government debt risk significantly increases the loans of city commercial banks flowing into the construction industry. Therefore, the impact of local government bond risk on city commercial banks is concentrated in the impact on their construction loans. This study has an important reference value for timely and moderate countercyclical regulation, preventing local debt risk from spreading to banks, constructing a sustainable local government−bank ecology, and promoting sustainable economic development.

1. Introduction

Countercyclical fiscal regulation can reduce economic risk, but it is bound to increase the scale of local government debt in a recession period, and spread risk to the banking industry, forming potential financial instability factors. This risk transmission chain cannot be ignored. The sudden COVID-19 pandemic in 2020 has had a huge short-term impact on the economy. Governments of all countries quickly introduced a series of macropolicy measures, including increasing the fiscal deficit ratio, issuing special national bonds, increasing the scale of local government debt, guiding the downward trend of interest rates and stimulating consumption, which will undoubtedly increase the scale of local government debt. In 2020, China’s local government bond issuance reached 6.44 trillion yuan, grew 47.7% year on year, and the government debt ratio and macro leverage ratio reached 45.8% and 270.1% respectively (data source: Ministry of Finance, Wind and National Institution of Finance and Development), both record highs. The countercyclical regulation of continuously expanding fiscal deficit is bound to have an impact on financial stability [1], which in turn restricts the effect of countercyclical finance [2]. In addition, excess debt will lead to a significantly low economic growth rate, weaken the solvency of local governments [3,4], and then affect the banking system, further increasing the factors of financial instability. Therefore, how economic fluctuation, local debt risk under the guidance of government fiscal policy and the risk-taking of city commercial banks (CCBs) interact with each other becomes an important and urgent problem to be solved. Most of the existing studies indicate that government control causes a distortion of the operation of the CCBs to some extent, but how the risk is transmitted between the government, regional economy and the CCBs is not clear. In recent years, government debt and economic fluctuation have always been closely related to infrastructure investment [5,6]. However, there is still no clear analysis of how the risks were caused by this spread. Further clarification of these issues will be conducive to the construction of benign interaction between local governments and banks, the prevention of financial risks and promotion of high-quality economic development.
Over the last 50 years, there have been four waves of debt accumulation, and people are currently in the midst of the fourth wave. This global debt crisis, combined with the current pandemic situation, threatens to plunge people into a self-fueled negative spiral involving sovereign difficulties, banking vulnerability, massive speculative bubbles and economic recession. The widespread application of new technologies such as artificial intelligence and big data has added to the difficulties of banking regulation [7,8]. In this context, government debt and bank risk management should be top priority. This research attempts to build an econometric model to study the interaction between the risk of local government debt and bank risk-taking in economic fluctuations, so as to reveal the deep connection between the three. This will help prevent excessive accumulation of government debt, prevent the spread of government debt risks to the banking sector and prevent systemic financial risks.
The rest of this article is organized as follows. Section 2 reviews the related literature about bank risk-taking, the influence of government debt on banking and fiscal countercyclical regulation, and points out the main contribution of this research. Section 3 puts forward the hypothesis to be tested on the basis of theoretical analysis. Section 4 makes a preliminary judgment on the research subject through the analysis of facts and data. In Section 5, OLS and PVAR empirical models are constructed to verify the three hypotheses. A series of robustness tests support this conclusion. Section 6 provides the conclusions and puts forward the policy implication.

2. Literature Review

In the face of changes in internal and external risks, it is the need of risk management for banks to dynamically adjust their risk-taking [9], which is statistically represented by the time series changes of risk-taking behavior indicators such as the nonperforming loan ratio (NPL), risk weighted asset intensity (RWAI) and Z-score. Empirical studies around this main line have verified that government shareholding [10], corporate governance [11], monetary policy [12,13], regulatory policy [14], economic cycle [15] and other factors can significantly affect the risk-taking behavior of banks, and economic fluctuations are obviously one of the most important factors. Banking is a typical cyclical industry, which will inevitably lead to the transmission of macroeconomic fluctuations to the banking industry [16]. The important position of banks in the financial system makes it inevitable to have an important impact on economic and financial stability [17,18]. Therefore, there is a two-way causality between macroeconomic fluctuations and bank risk-taking behavior [19], but there is no consensus on how they interact with each other. The impact of economic risk fluctuation on bank risk-taking behavior is firstly reflected in bank credit release. When the macroeconomy is in an upward cycle, the default rate of enterprise loans is reduced and the credit risk of banks is also reduced [20]. In the stage of economic downturn, the value of enterprise collateral decreases, while the enterprise default rate increases, thus increasing the credit risk of banks [21]. On the other hand, it is believed that with the expansion of the macroeconomy, borrowers are more likely to repay, so banks will increase their leverage level and show more preference for risks in order to maximize profits. In addition, the decline of interest rates will reduce the return on the assets of banks, thus increasing the risks of banks [22]. Blum and Hellwig [23] find that capital regulation is closely related to bank credit and strengthens the procyclical behavior of banks. Most scholars agree that bank risk-taking is procyclical while some disputes also exist, but there is a consensus that bank risk-taking responds to economic fluctuations to a certain extent.
The adjustment of bank risk-taking is a normal response to economic fluctuations. However, due to the important position of banking in modern financial industry, they have to be influenced by the local government, showing unusual partial countercyclicality, and the most common form is that the government influences banks through debt. Government ownership of banks is widespread in the world [24]. Political factors often influence the banks’ lending decisions [25]. Gray [26] concludes that the banking and government departments are connected through multiple channels and are influenced by explicit and implicit guarantees. Battistini et al. [27] studied European banks during the European debt crisis and found that peripheral countries in the euro zone forced their banks to hold more national bonds when risks rose through moral suasion and other means. As academics and practitioners are widely aware, government debt and banking crises always go hand in hand. Kaminsky and Reinhart [28] recorded the twin crisis phenomenon of the simultaneous occurrence of the banking crisis and the reversal of the international balance of payments. Reinhart and Rogoff [29] further explained how the government debt crisis was linked with the collapse of the banking industry.
City commercial banks in China have had an inseparable relationship with local governments since their establishment. The largest shareholders of three quarter of CCBs are local governments or state-owned enterprises, so local governments have strong control and influence over CCBs [30]. Government intervention in banks can be benign or vicious. The helping and predatory hands of government shareholders will have an important impact on the management decisions of banks [31]. Government governance has an important impact on the regulatory differences in capital adequacy ratio, the loan quality and business performance [32]. Political incentives are one of the most important factors affecting bank credit expansion [33]. Local governments need to expand fiscal expenditure for economic growth, thus expanding the scale of local debt and increasing the leverage ratio of commercial banks, which increases the possibility of systemic financial risks [34].
On the other hand, Keynes established the idea of fiscal countercyclical regulation. Neoclassical economics believes that countercyclical regulation can iron out economic fluctuations and promote economic recovery. In 2010, Basel Accords introduced the idea of countercyclical regulation into the macroprudential supervision framework, which established the position of countercyclical regulation. As early as the Central Economic Conference in December 2012, China entrusted macroeconomic policy with the task of countercyclical regulation. Since 2018, the central government has been more countercyclical in its macrocontrol thinking. In order to cope with the economic downturn caused by COVID-19 in 2020, the Chinese government has repeatedly pledged to strengthen countercyclical regulation, pay more attention to flexibility and moderation, and maintain financial stability. Countercyclical regulation has been widely accepted in the academic and practical fields. However, the European debt crisis in 2009 was accompanied by the financial crisis in 2008, which caused many scholars to put forward different views. Kose et al. [35] suggest that, supported by the countercyclical easing policies and their expectations, the situation of leverage became more and more intense, leading to the global economy gradually falling into a “swing dilemma” of deleveraging and increasing leverage. The excessively high leverage ratio increases the risk of economic downturn and magnifies the vulnerability of the economic system. The high government debt ratio limits the ability of macrocontrol to hedge the leverage ratio [36]. The decline in fiscal revenue and the decline in the value of local currency in the period of financial recession put great pressure on public finances. Data shows that in the three years after the outbreak of the subprime crisis in 2007, countries’ fiscal balances fell by more than 5% on average, with some countries’ fiscal balances falling by more than 10%. When the financial shock is interwoven with the weakening of the countercyclical ability of fiscal policy, it leads easily to a vicious spiral effect, that is, the financial bubble burst of the private sector will weaken the ability of the financial sector to implement the countercyclical fiscal policy and to remedy the financial recession. The deterioration of public finances will lead to further financial instability. From the perspective of local government, the issue of local debt originates from the theoretical research of fiscal federalism. According to the earliest studies, providing public goods through a multilevel government system is more effective than a single central government in making decisions on all public expenditures. However, fiscal transfer payments and soft budget constraints reduce the constraint efficiency of the credit market on local governments [37,38]. Different views hold that decentralization will not only increase the number of stakeholders, but also strengthen the motivation of stakeholders to ride free, which is not conducive to macroeconomic stability [39]. Jia et al. [40] find that local government spending presents obvious national countercyclical and provincial procyclical characteristics, which contribute to national economic stability but aggravate provincial economic fluctuations. As the provincial economy is an important part of the national economy, it increases the difficulty of precise countercyclical fiscal regulation. Therefore, although the idea of countercyclical regulation has been widely accepted, the resulting problems cannot be ignored.
To sum up, most of the CCB risk-taking is procyclical while local governments have the ability to influence the CCBs’ business decisions and have the need for countercyclical regulation. This situation will inevitably reflect a partial countercyclical CCB risk-taking, and become the channel for the transfer of local government debt risk to CCB risk. The mutual strengthening of local government debt risk and CCB risk causes financial instability, which in turn weakens the effect of countercyclical regulation. If these risks are magnified in both directions out of control, a government debt crisis will result and spread to the financial and real economy. The four-year recession in many countries during the European debt crisis is a case in point.
The adjustment of bank risk-taking in response to economic fluctuations is an operational requirement, and the influence of the government on banks is also common in the world [41], but there are few studies combining the three factors. More importantly, different from the existing research background, the CCB and the city investment company (CIC) are enterprises with Chinese characteristics and are experiencing the reform wave of economic and financial system. Moreover, most of the studies on bank risk-taking using the Z-score, NPL or other conventional risk-taking indicators appear not to study further or deeper. They do not look at what changes in credit resource flow are causing the changes in risk-taking. Therefore, the contribution of this study is mainly in the following three aspects: firstly, local debt risk, local economic fluctuations and bank risk-taking are included into the research framework as endogenous variables, and the interaction between them is studied to expand the research horizon of the relationship between local governments and banks, as well as the economic impact. Secondly, further research on the response of bank risk-taking and banks’ credit resource flow to the outside world is a supplement and expansion to the existing literature. Thirdly, the research on infrastructure investment as a countercyclical regulation is expanded, and the risk interaction between CCBs, CICs and the local economy is clarified when they are combined with infrastructure.

3. Theoretical Analysis and Hypothesis

It is generally believed that banks’ behavior is procyclical, which means that banks tend to expand credit during upturns and vice versa during downturns. The earliest procyclical research can be traced back to the debt-deflation theory proposed by Fisher [42] based on the economic phenomenon during the Great Depression. One of its main viewpoints is that during the financial crisis, the difficulty of debt repayment will lead to the contraction of bank credit, thus exacerbating the economic recession. Aean and Blomberg [43] find that commercial banks change the credit examining standards in different stages of the economic cycle, generally showing that they relax in the expansion period and tighten in the depression period. However, if this kind of indicator for risk assessment, such as NPL or RWAI, is used, scholars’ views vary greatly. Salas and Salas and Saurina [44] find that Spanish banks tend to expand their lending capacity in the economic boom to increase their market share, and often lend to people with poor credit records, resulting in a significant increase in nonperforming loans in the economic recession. However, Zhang and Li [45] propose a different view. They analyze it from the perspective of the Sharpe ratio and propose that high economic growth is accompanied by high nonperforming loans. At the same time, they use the data of 142 economies to make an empirical test and find that economic growth has a close positive relationship with the NPL of the banking system.
Most of the CCBs are small and medium-sized banks, which are more sensitive to local economic risk fluctuations. Therefore, during an economic boom, they tend to increase the risk-taking, but the performance of enterprises and solvency is improved so as to offset the risk of CCBs partially. This is reflected in the negative correlation between the local economic growth rate and bank risk-taking indicators, such as NPL and RWAI.
Due to historical reasons and regional characteristics, CCBs in China are deeply influenced by local governments, and local debt is one of the most important forms. A prominent phenomenon is the surge of bank loans to CICs [46]. Local governments have a significant effect on the credit behavior, asset allocation, performance and other aspects of CCBs. At the same time, local governments can influence and change the operating environment of banks through local governance, indirectly affect the risk-taking of banks [47]. On the other hand, based on the trust of the implicit endorsement of the central government, the CCBs have the moral hazard of lending to the local government, so in the decision of asset allocation, the one-sided pursuit of interest ignores the risk factors of the debtor [48]. Therefore, CICs with the background of local government can obtain greater credit support from CCBs, which makes the risk of the CICs have a greater impact on the risk-taking of the CCBs, the two are positively correlated.
Hypothesis 1 (H1).
Local economic growth is negatively correlated with the risk-taking of CCBs, while the impact of city investment bond (CIB) risk tends to increase the risk-taking of CCBs (they are positively correlated).
Keynesianism emphasizes that fiscal policy is an effective tool in economic recession. In 2010, the Basel Accords introduced the idea of countercyclical regulation and emphasized the construction of a macroprudential regulatory framework with countercyclical characteristics. Countercyclical regulation has been widely recognized. However, countercyclical regulation is bound to increase the burden of government debt, thereby affecting financial stability [49]. After the financial crisis in 2008, the financial situation of many countries deteriorated rapidly, leading to the government debt crisis, which further affected financial stability and economic growth. These also aroused the doubts of scholars on countercyclical regulation.
Infrastructure has often become the main focus for countercyclical fiscal adjustments in recent years. A large part of fiscal infrastructure investment comes from local governments. For example, in China’s “Four trillion infrastructure investment plan 2008”, 70% of the funds were raised by local governments; In the countercyclical fiscal response to COVID-19 in 2020, local governments at all levels will invest up to 34 trillion yuan in new infrastructure. The funds raised by local governments through local bonds must be reflected in the banking system. Therefore, the impact of local debt risks on the CCBs may ultimately be reflected in the CCBs’ loans to the construction industry. At the same time, since infrastructure investment is an important means of fiscal countercyclical regulation, the impact of local economic fluctuations on the construction credit of CCBs should also be reflected as countercyclical.
Hypothesis 2 (H2).
The impulse of the local economy towards construction credit of CCBs is countercyclical, that is, the impact of local economic growth tends to reduce the loans from CCBs flowing into the construction industry; the impulse of CIB risk to construction credit of CCBs is also countercyclical, that is, the impact of the rising risk of CIBs tends to make the CCBs increase construction credit.
Liu and Lu [50] propose that the interaction between the financing platforms of local government and the leverage ratio of banks will lead to the procyclical effect of platform debt risk. Since the banks’ financing leverage ratio is procyclical, the CICs are more likely to expand its debt scale in the economic upturn, while the debt risk will break out in the economic downturn. Chen [51] also holds a similar view. However, many fact-based studies do not support this view. Data show that public debt in the developed world rose sharply after several financial crises during 1970–2011. Two years after the subprime crisis in 2007, the European debt crisis broke out in 2009 when the global economy was in recovery period; In 2011, when the economy was also recovering, the debt default of Yunnan Road Investment, a local financing platform in China, triggered a local debt crisis. Although the drastic local debt reform in 2014 was designed to break the implicit guarantee of local governments to CICs, local governments are still the majority shareholders of CICs, and CICs still perform most of the infrastructure functions for local governments in the form of government purchase of services. The funds of local financing platforms mainly come from the loans of commercial banks. The rapid development of local financing platforms is the product of the continuous increase of local fiscal expenditure, and the countercyclical nature of fiscal expenditure has been recognized by most scholars [52]. Therefore, the risk of CICs who undertake a large number of infrastructure tasks should also be countercyclical: CICs are more likely to obtain more credit resources from CCBs in the economic downturn, so the risk is less. However, during the economic upturn, the infrastructure investment decreases, so the credit source for CICs decreases. The loans accumulated during the economic downturn gradually mature, so the risk is more likely to break out during the economic upturn.
Hypothesis 3 (H3).
The impulse of local economy to the risks of CIBs is countercyclical, that is, the impact of local economic growth tends to increase the risks of CIBs while economic recession reduces the risks of CIBs.

4. Facts and Data Analysis

Banks’ risk-taking behavior adjusts dynamically with the changes of the internal and external environment, so as to achieve the optimization of risk and profit. Among them, economic fluctuation is the most basic external environment for banks. For the measurement of bank risk-taking, most literature adopts indicators such as NPL, RWAI, Z-score, default rate, etc. The origin of the changes in risk-taking behavior reflected by these overall indicators is the dynamic adjustment of bank asset allocation. Loans are the largest asset of CCBs. Among the industrial flows of loans, construction and real estate are the most likely data related to CICs, and the fluctuation of these data is most likely to reflect the ”support” of CCBs to CICs.
The CIC is also known as the financing platform for local government. Local infrastructure construction and land development are the most important business of CICs. In 2008, CICs began to attract wide attention because they undertook a large number of “four trillion” infrastructure projects, and subsequently issued a large number of CIBs. In the first half of 2020, the issuance scale of CIBs exceeded 4.3 trillion yuan, accounting for more than one third of the entire bond market, and accounting for more than 70% of the interbank market. The CIB has become an important pillar of the bond market; its risk fluctuation has a great impact on CCBs. Since 2015, local governments have ceased to be final repayors of the debt of CICs, but they are still shareholders and customers of CICs. The role of the CIB as a quasi-municipal bond has been greatly weakened, but it has not disappeared completely.
Through the comparison of multiple data in the financial statements of CCBs, it is found that the construction loans of CCBs have a highly consistent synchronous fluctuation with the spread of CIBs, as shown in Figure 1. In contrast, the flow of real estate loans is more in line with (inversely aligned with) economic fluctuations. On the other hand, the risk of CIBs and economic fluctuations have a high degree of consistency. For example, 2011 was the peak of the risk of the CIB, but it happened to be the peak of economic growth. In 2016, the risk of CIBs reached the low point of the band while the economic growth was also at the low point. This seems to suggest that CICs are riskier during booms than recessions. There may be a certain degree of chance. For example, in 2011, the Yunnan Road Investment debt default event pushed the risk of CIBs to the peak. However, such a high degree of consistency in the data over the past decade seems inevitable. For example, the local debt reform in 2015 required local governments to no longer bear the implicit guarantee for the debts of CICs. However, the CIB risk did not increase significantly, but declined instead. This period happened to be a period of rising economic risks. Infrastructure construction is the main business of most CICs, and CCBs are the most important capital source for CICs, all these seem to have a delicate connection. The following section will verify the findings of the data through econometric empirical studies and give economic explanations.

5. Empirical Study and Results

5.1. The Influence of Economic Fluctuation and Local Bond Risk on CCB Risk-Taking

Data analysis and theoretical research show that there is a close relationship between CCB risk-taking, local debt risk and local economic fluctuation. Therefore, the following empirical model was constructed to test the impact of the local debt risk and economic fluctuations on the CCB risk-taking:
R I S K i t = β 0 + β 1 s p r e a d i t + β 2 G D P i t + j γ j X j t + ε i t
In Formula (1), the dependent variable RISK is the risk-taking of CCBs. Based on literature, the most widely used variables of bank risk-taking are NPL, RWAI and Z-score. Since the research in this paper focuses on the risk-taking of CCBs and their industrial loan flows, while Z-score focuses on measuring the bankruptcy risk, therefore, NPL and RWAI are more appropriate for this study.
Use spread between CIB and treasury as the proxy variable for local government debt risk. CIB spread is used to represent local debt risks in much classical literature [53,54]. Although local governments can issue bonds by themselves after 2015, local government bonds are priced irrationally sometimes [55], and their liquidity is poor. Meanwhile, the time series since 2015 is short. In order to ensure the coherence and consistency of data, the spread of CIB is chosen as the proxy variable for local debt risk. For economic fluctuations, the provincial GDP growth rate is adopted [56,57].
The control variables include the growth rate of the provincial budget expenditure, which is a measure for local fiscal expenditure, the inflation rate, the growth rate of fixed asset investment and residential investment, which are measures for local economic conditions. For monetary policy, the seasonally adjusted M1 growth rate is used. In respect of the characteristic of the CCBs, the logarithm of total assets is used to represent the scale of the CCBs, the deposit/total assets is used to represent the discipline constraint [58], the deposit/liability is used to represent the debt structure [59], the shareholder’s equity/total assets is used to represent the leverage ratio [60], the ROA is used to represent the profitability [17,61], the loan-deposit ratio and provision coverage ratio are used to represent the risk control ability [62,63].
The yield of CIBs and the treasury, as well as the macroeconomic data were obtained from the Wind database. The data of CCBs were obtained from Bankscope and CSMAR database. The variables definition are shown in Table 1. The descriptive statistics is shown in Table 2.
A Hausman test was carried out to determine whether the fixed effect or random effect model should be adopted. The results rejected the null hypothesis of random effect at the 1% level and the fixed effect model should be adopted. The model estimation results are shown in Table 3.
The regression results show that the spread of CIBs and local economic fluctuations have a significant impact on the risk-taking of CCBs, whether using NPL or RWAI. An increase in the spread per unit of CIBs will significantly increase the NPL of CCBs by 0.1 and the RWAI by 0.02 on average. This proves that local debt risk is positively correlated with the risk-taking of CCBs, which is consistent with the research results of Zheng et al. [64]. The negative relationship with GDP growth rate shows that every 1 percentage increase in the local economic growth rate will reduce the NPL of CCBs by 1.31 percentage and the RWAI by 0.28 percentage. This indicates that the increase of local GDP growth rate is helpful to reduce the risk-taking of the CCBs. Thus Hypothesis 1 is verified.

5.2. The Interaction among Economic Fluctuation, Local Bond Risk and CCB Risk-Taking

In order to further study the interactive relationship between local economic growth, CIB risk and CCB risk-taking, following Love & Zicchino [65], the panel vector autoregressive (PVAR) model was constructed to describe the interaction among the three from multiple dimensions.
y i t = α i + β t + j = 1 p Γ j y i t p + ε i t  
In Equation (2), α i and β t are fixed and time effect variables, respectively, ε i t is random disturbance, Γ j is the coefficient matrix of the variable in lag j. Subscriber i denotes the 102 CCBs, t denotes the year. y i t = ( R I S K i t , s p r e a d i t , G D P i t , b u e x i t , i n f i t ) T is 5 * 1 vector based on the panel data. In this study, the growth rate of local fiscal expenditure and the local inflation rate are added into the endogenous variables, because these two factors are closely related to the local economic growth, local debt and CCB. Thus, the explanatory power of the model can be improved.
In order to avoid pseudo regression, the unit root test is performed first. Since the data of CCB is an unbalanced panel, only the Fisher method is applicable, while LLC and Fisher-ADF are respectively used for macro data. The unit root test results show that all the data pass the significance test at 1% level, they are stationary series.
The BIC Information criterion is calculated to select the optimal lag. The results show that 1 lag is optimal for NPL and RWAI.

5.2.1. The Interaction between Economic Fluctuation, Local Bond Risk and CCB Risk-Taking

The impulse−response functions (IRF), which consider contemporaneous as well as lagged responses are presented in Figure 2 to capture dynamic interactions among the endogenous variables. The shocks’ responses are significant when the plotted 95% confidence intervals, using 200 Monte Carlo replications, do not contain 0.
As can be seen from 
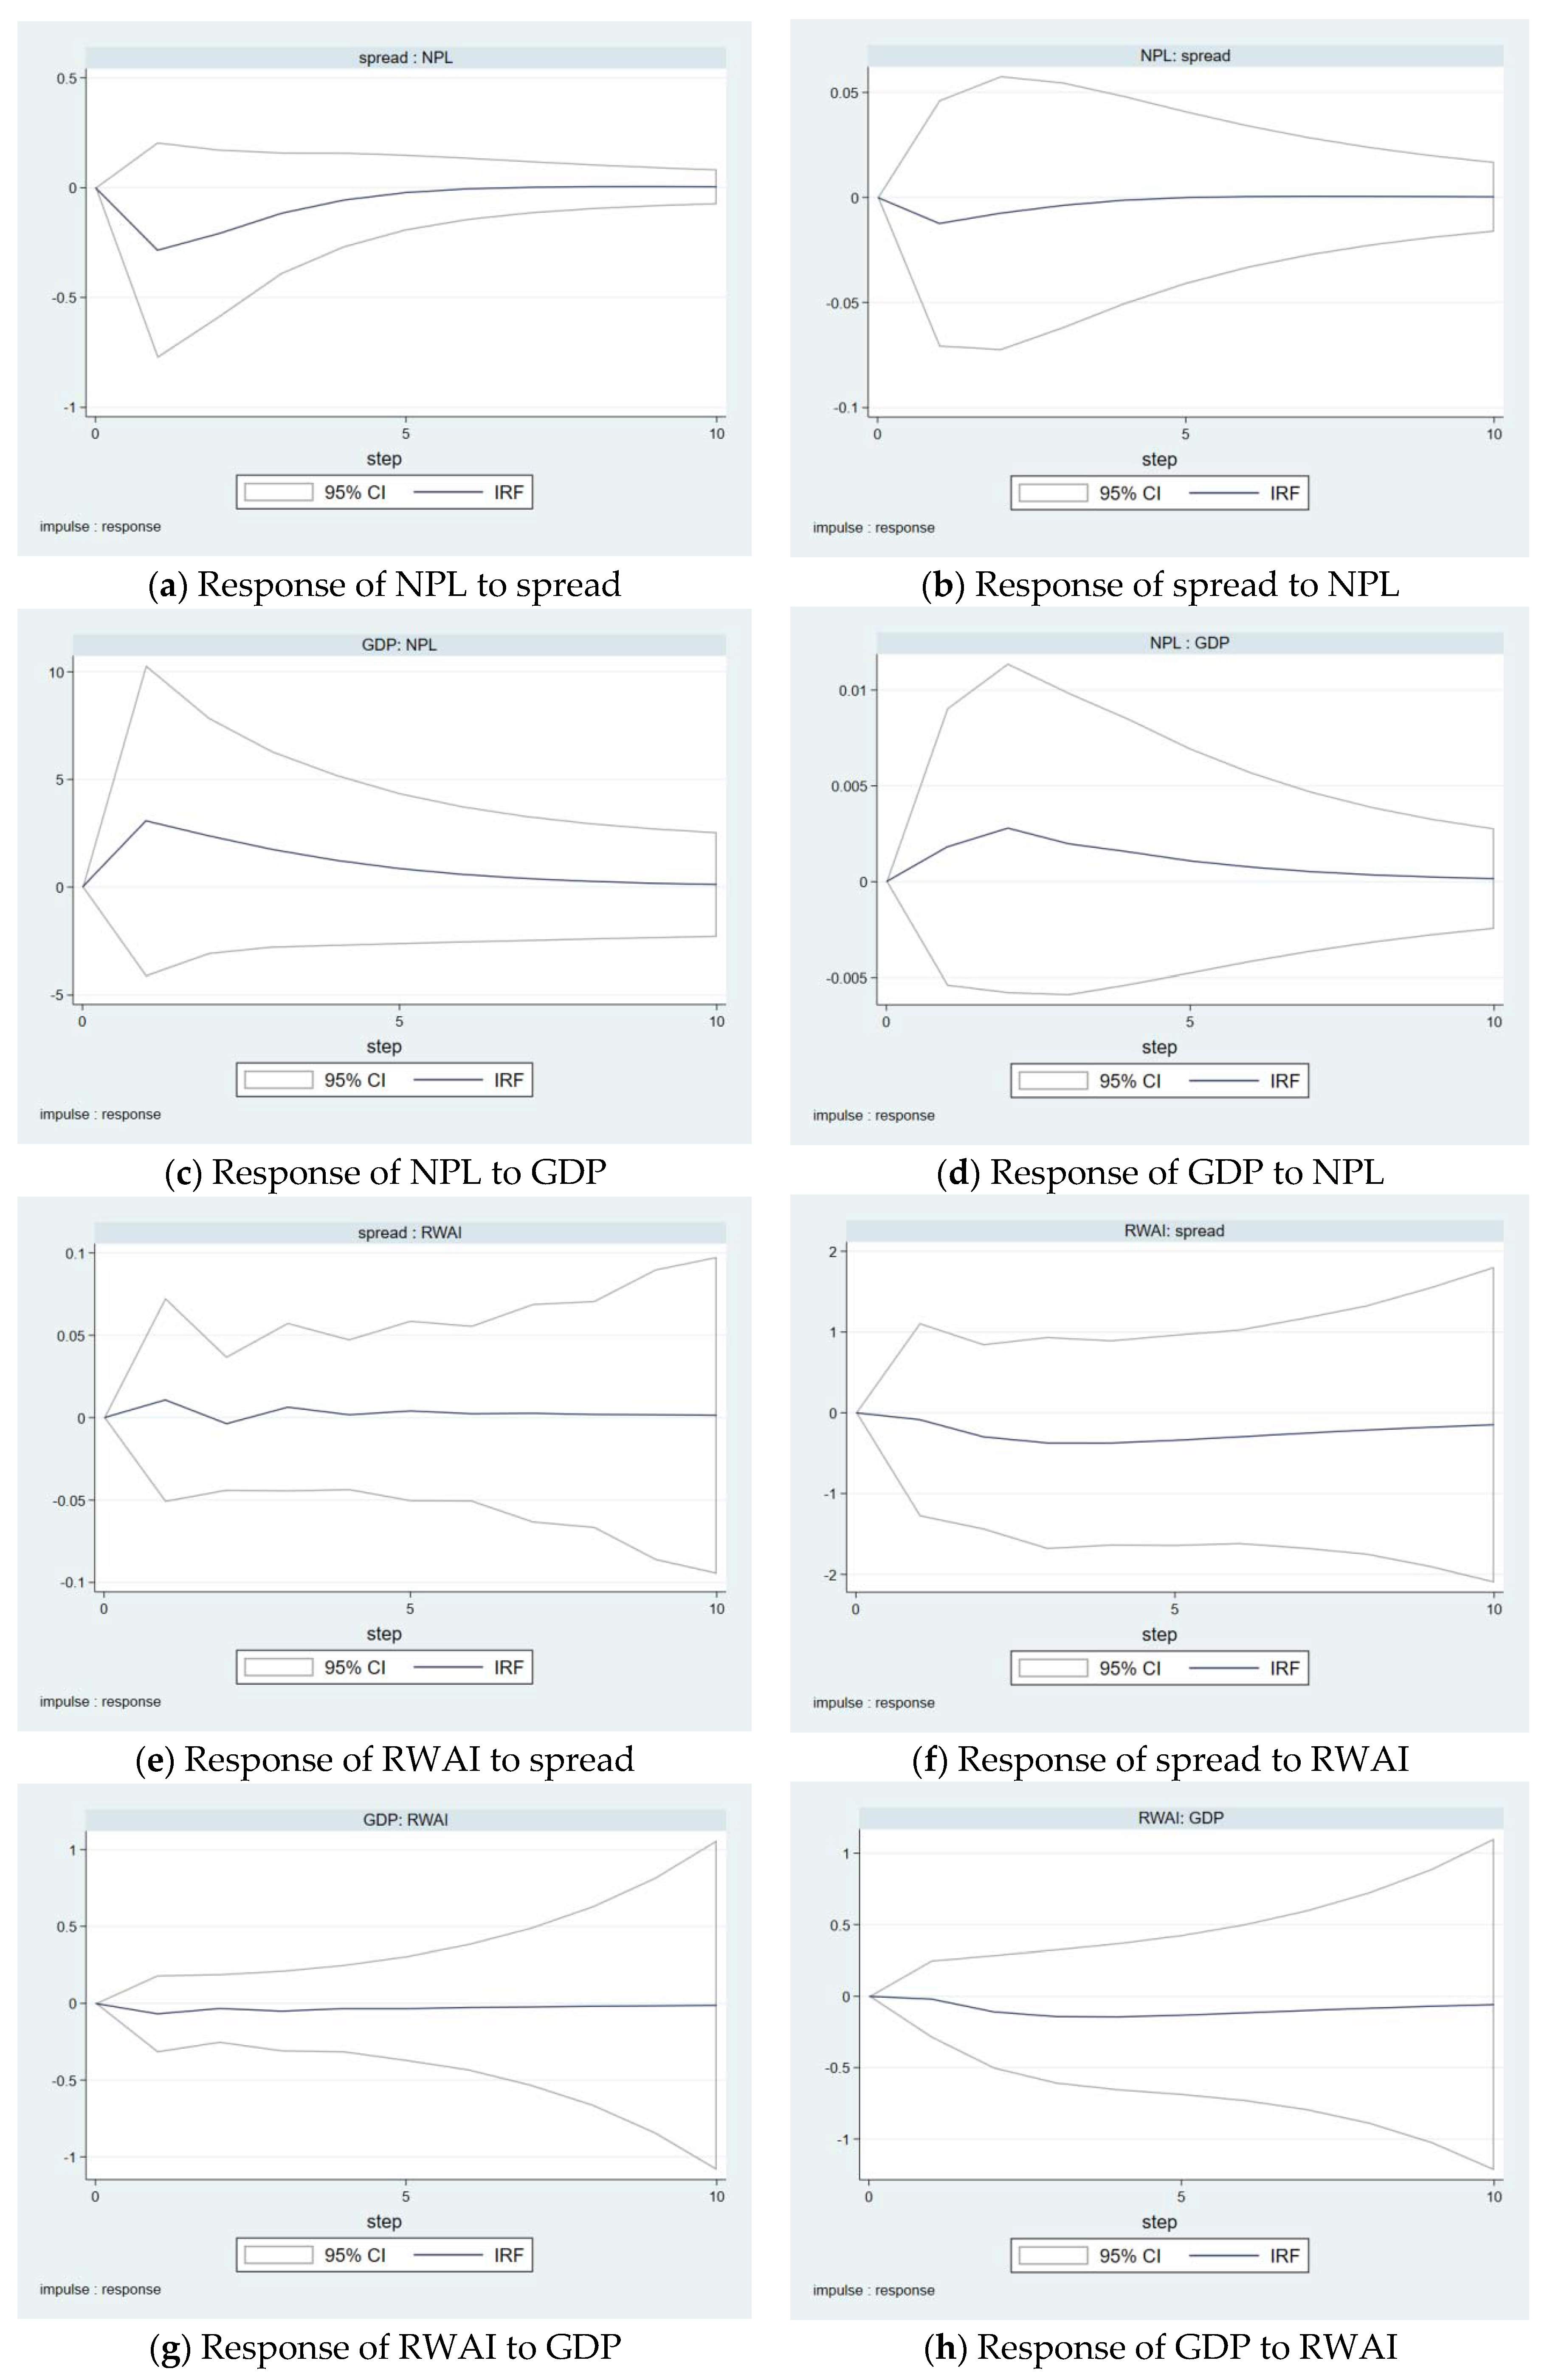
Figure 2, for the impulse of the CIB spread with a standard deviation, the NPL has a negative response in the short run, then rises after reaching the lowest point in the second period, and remains positive after becoming positive in the sixth period. It suggests that although the rise of local government bond risk has a short-term tendency to reduce the risk of CCBs, it may be because the short-term increase of local debt risk prompts CCBs to adjust their risk-taking to reduce the risk, but in the long run, it still increases the risk of the CCBs. The results for RWAI are roughly the same: for the impulse of the CIB spread with a standard deviation, the RWAI has a negative response in the first three periods, then rises after reaching the lowest point in the second period, and remains positive after becoming positive in the third period. In general, the increase in the CIB risk tends to increase the risk-taking of the CCBs, which is roughly consistent with the conclusion of OLS. On the other hand, for the impulse of the NPL with a standard deviation, the CIB spread has a negative response in the short and long run, that is, CCBs increase their risk-taking behavior of credit assets, so that the CIB risk has a negative response. The results for RWAI are broadly consistent. The above results prove that in the long run, the increase in the risk of local bonds tends to increase the CCBs risk-taking, while the increase in the risk-taking of CCBs is conducive to reducing the risk of local bonds.
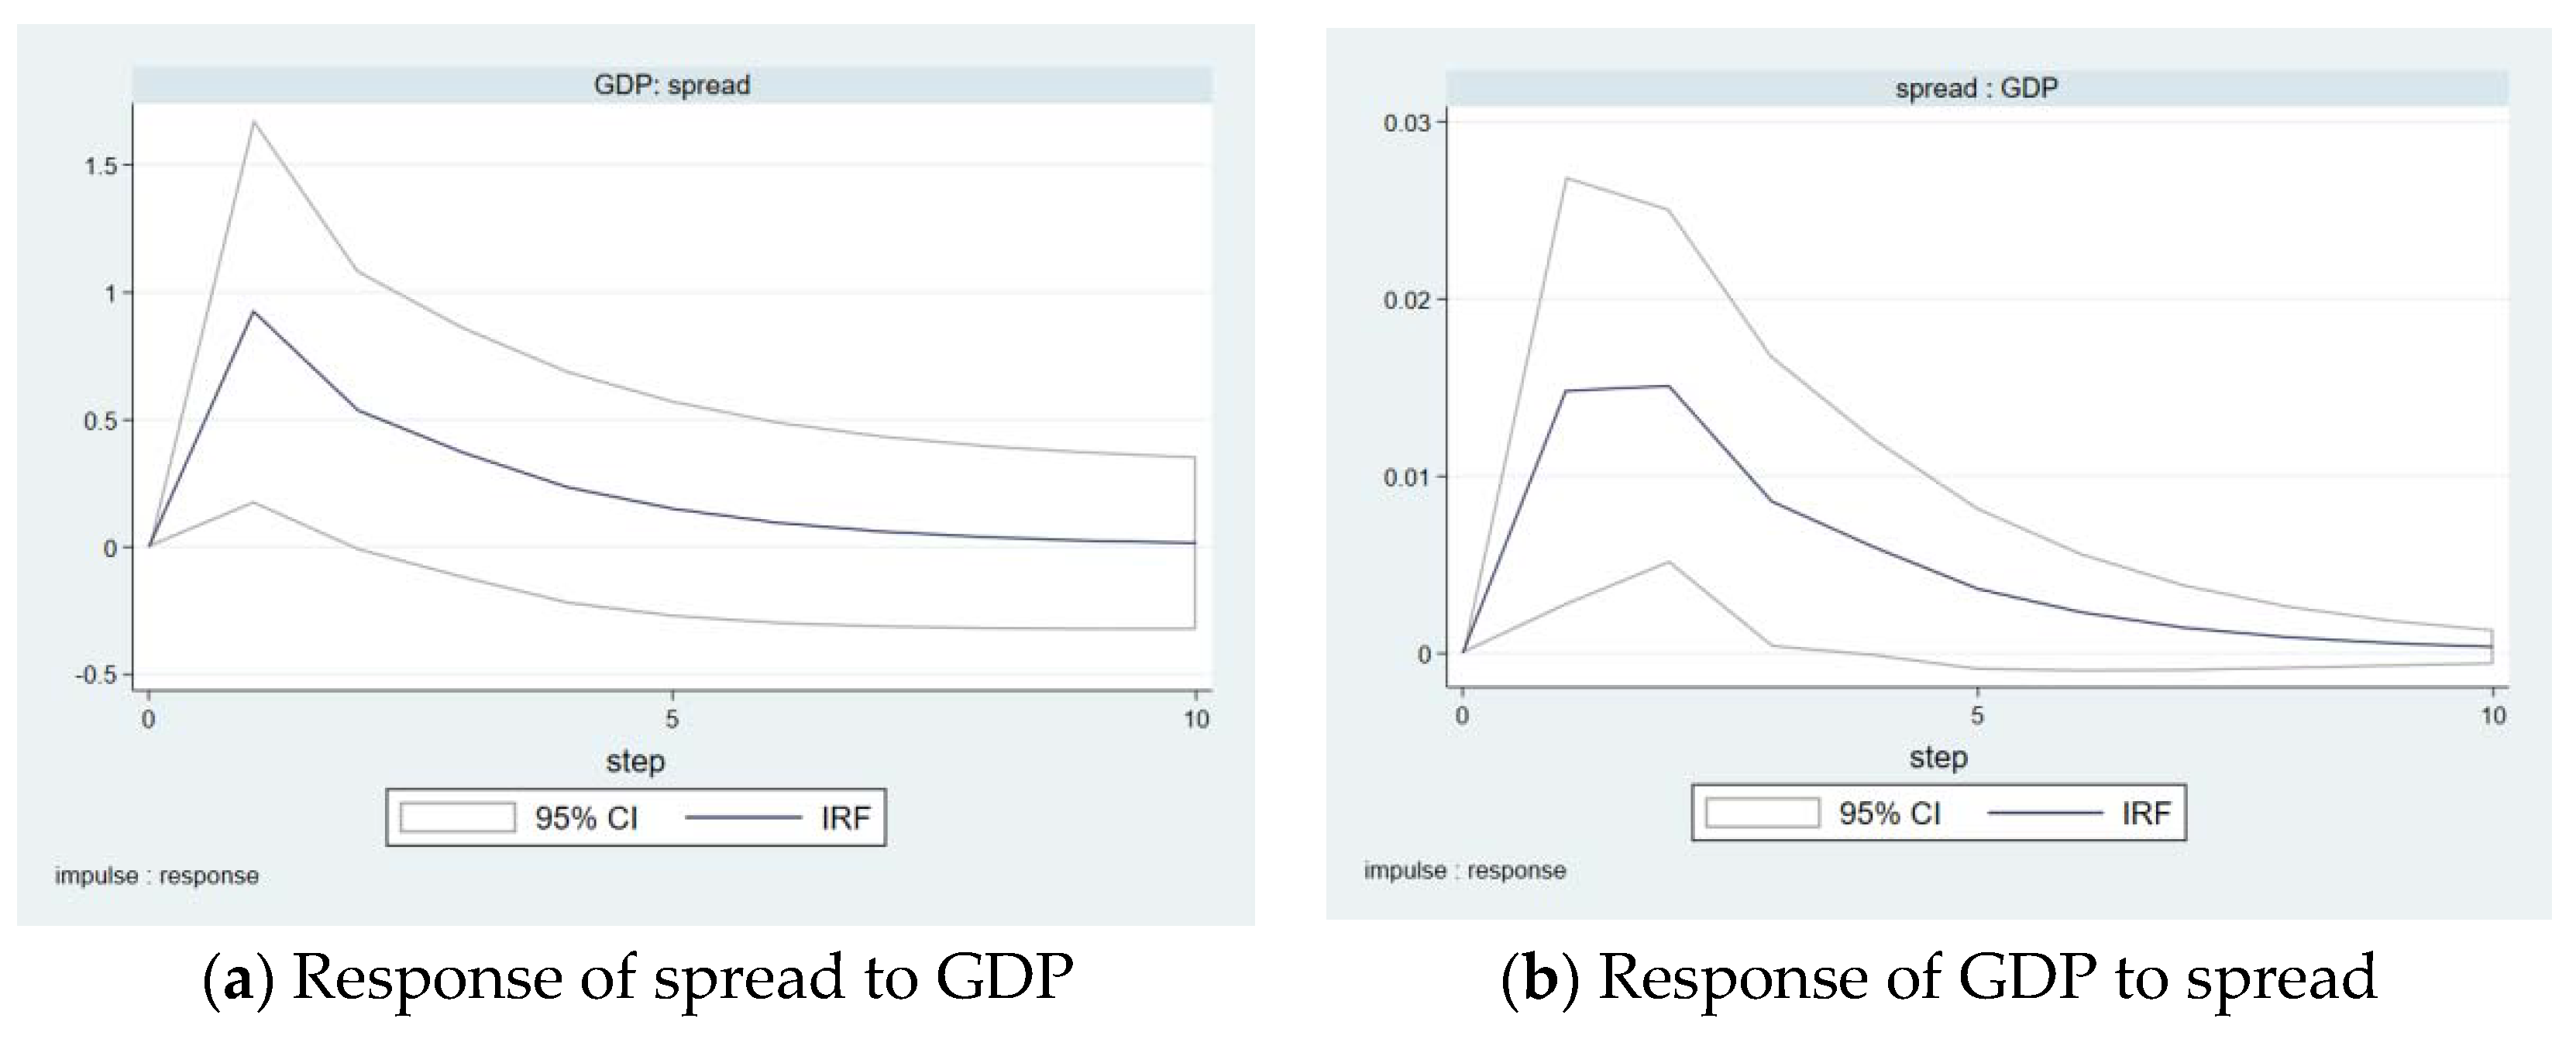
On the other hand, for the impulse of GDP with a standard deviation, the NPL has a positive response in the short run, then keeps declining after reaching the peak in the first period. This indicates that the CCBs increase the risk-taking when they feel the economic upturn, increase the high yield and high-risk credit supply, which confirms the procyclical behavior of CCBs. However, the sustained high economic growth offsets the risk of high-yield credit, making the NPL of CCBs quickly reduce. The IRF of RWAI is slightly different, but points to similar implications. For the impulse of GDP with a standard deviation, the RWAI has a negative response. This may be due to the different nature of the assets they reflect. The RWAI covers the financial assets such as bonds, which are more sensitive to the response of economic fluctuations and can reflect the economic trend more quickly, thus accelerating to offset the procyclical consequence of the risk-taking behavior of the CCBs. Therefore, in the IRF, it is only reflected as a negative response to economic growth. This implies that different types of CCB assets have different sensitivities to economic fluctuations. In a period of economic upswing, the risk of credit assets can only be reflected by the decline of risk until the improvement of corporate profits [20], while the volatility of bond assets is often ahead of the economic volatility, so the risk decline can be reflected faster. This, in fact, confirms the explanation of Hypothesis 1 from another perspective: during the economic boom, CCBs tend to increase the risk-taking, but the performance of enterprises and solvency improve so as to offset the risk of CCBs partially. Therefore, the conclusions of the IRF further support Hypothesis 1.

5.2.2. The Interaction between Economic Fluctuation and Local Debt Risk

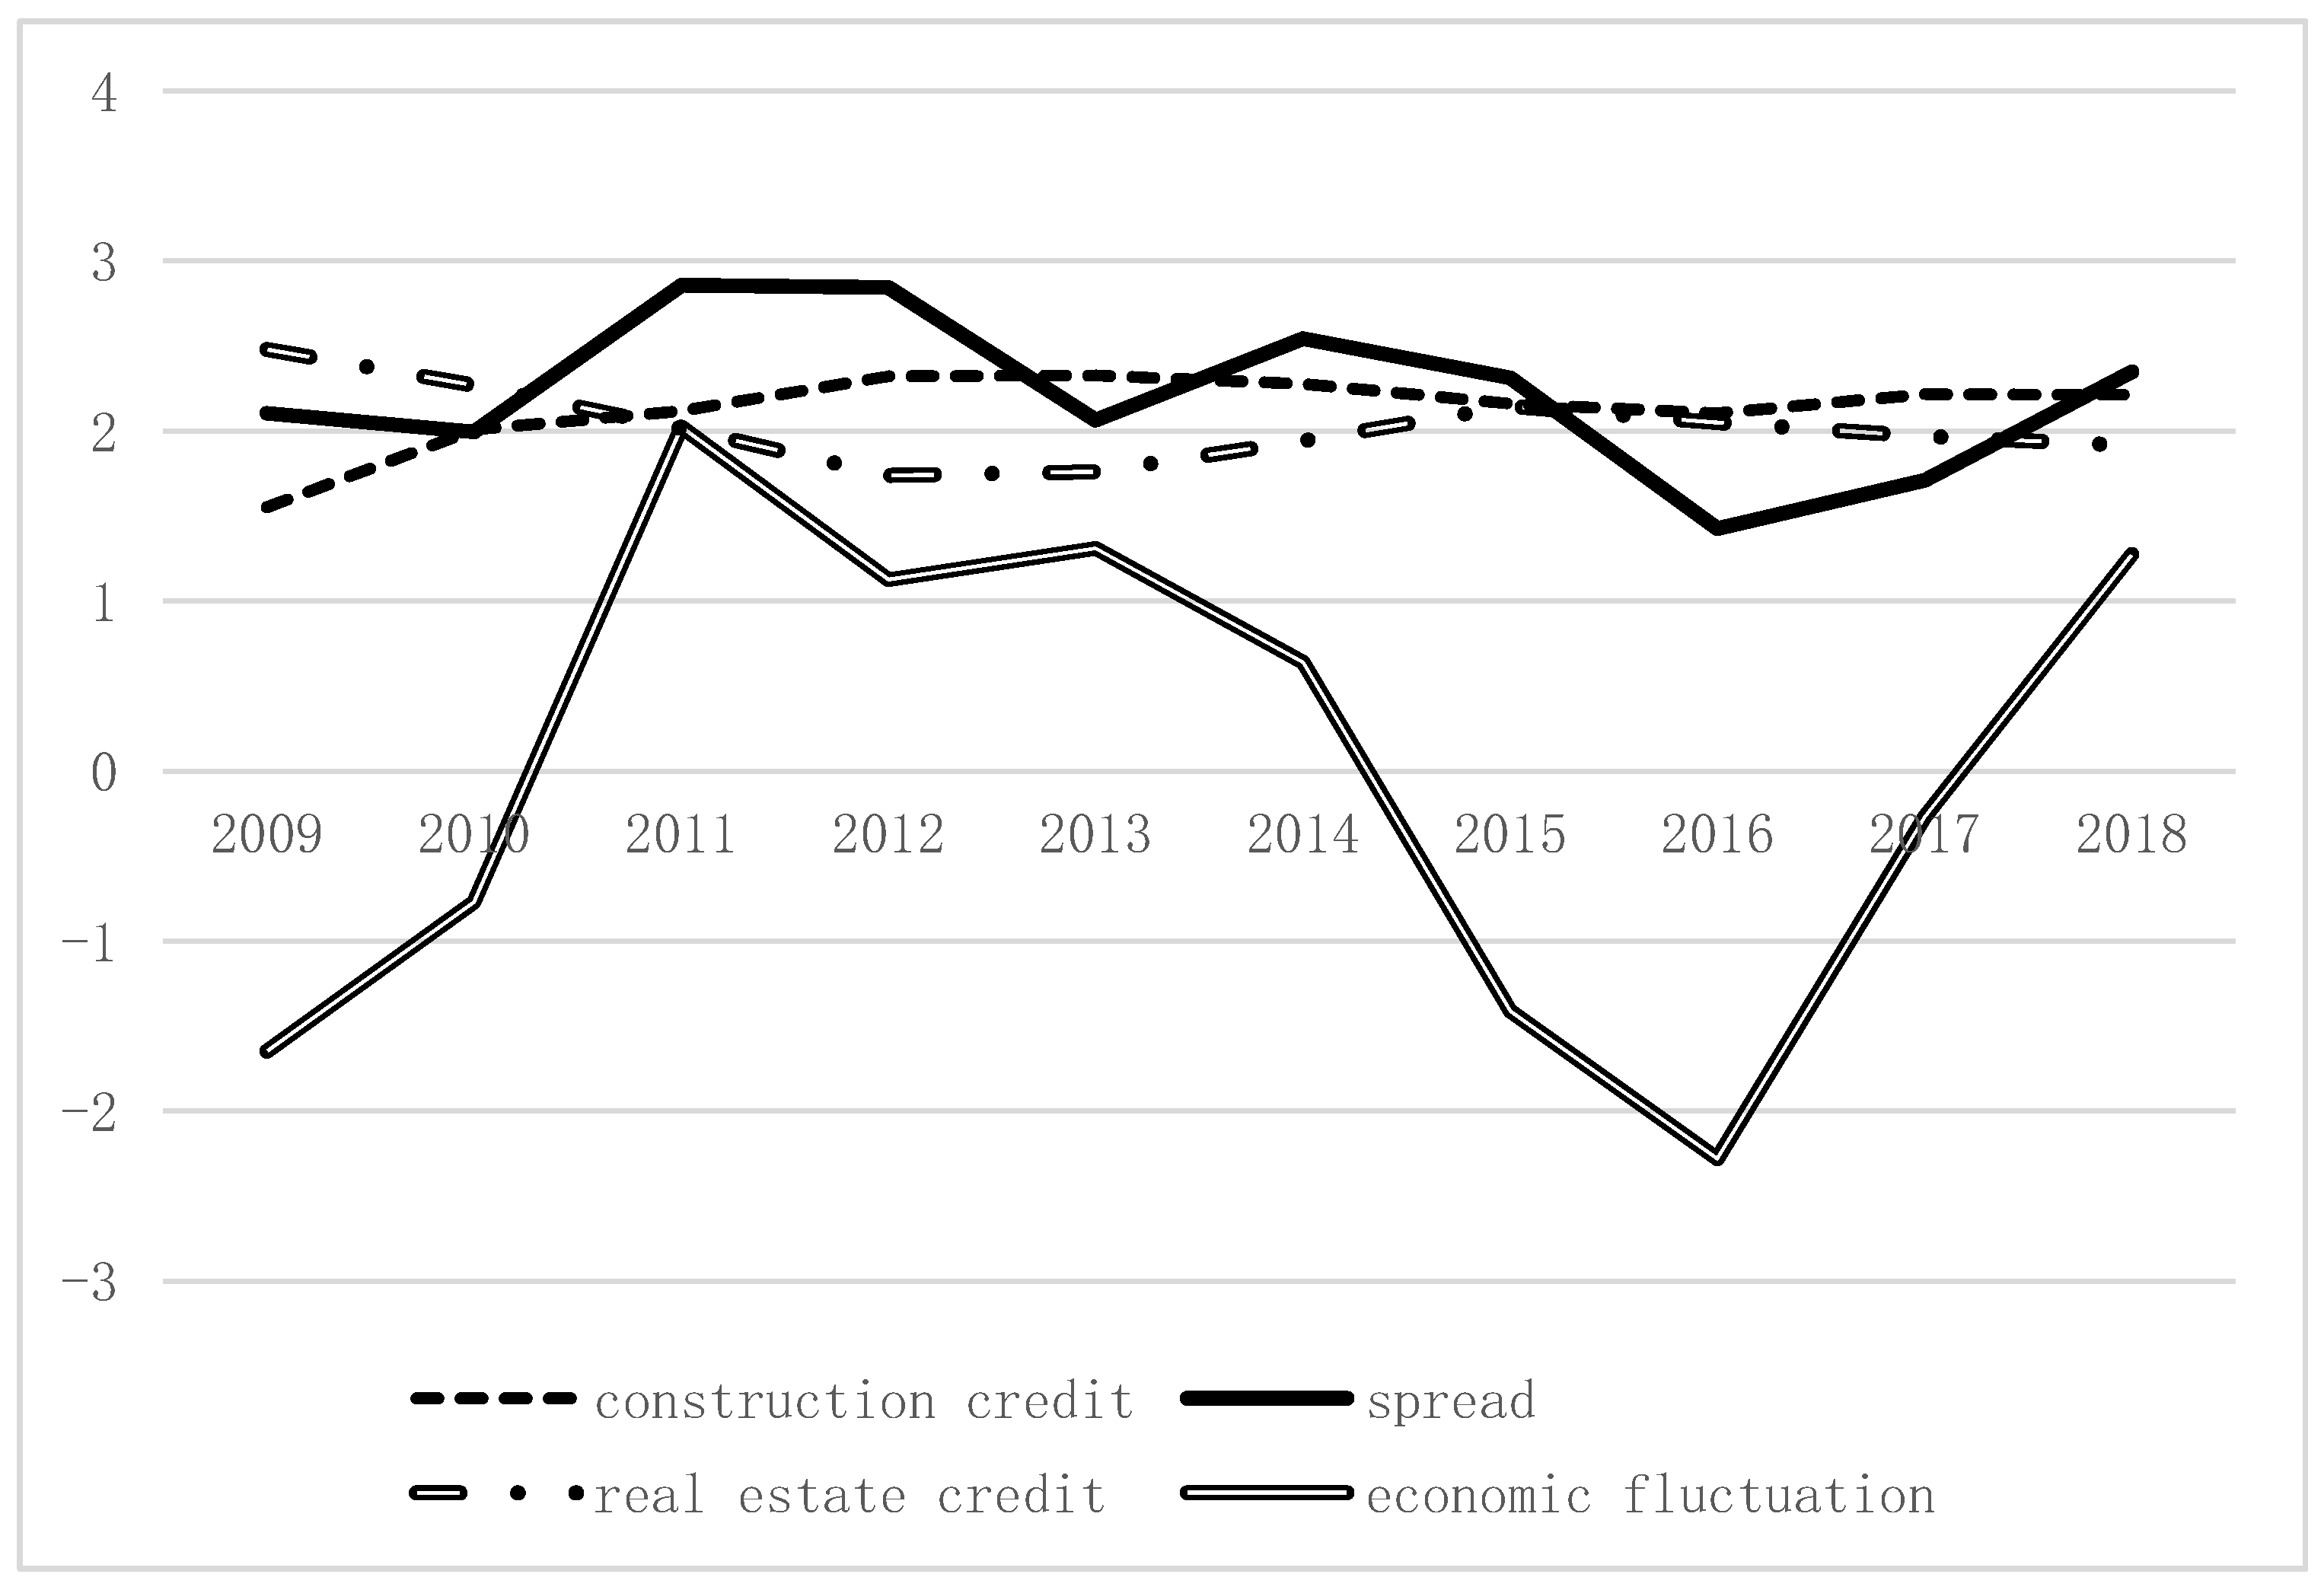
As mentioned above, the CIB risks and economic fluctuations are obviously countercyclical, that is, the CIB risks are low in a period of economic recession and vice versa. Based on the PVAR conclusion, the authors expect further studies to verify this relationship.
As can be seen from Figure 3, for the impulse of GDP with a standard deviation, the CIB spread had a positive response rapidly, then declined after reaching the peak in the first period, remained positive and converged to 0. In other words, economic growth tends to increase the risk of CIBs, which further verifies the role played by CICs in the local economy as a countercyclical regulator: in the boom period, local governments significantly reduce fiscal investment, such as infrastructure construction, the CICs are “left out in the cold”. The capital of the CCBs that flows to CICs is greatly reduced. In addition, the debt ratio of most CICs is high. Therefore, the risk of CIBs greatly increases. However, in an economic depression, local governments greatly increase fiscal investment, such as infrastructure, to boost economic growth, so a large amount of capital from CCBs flows to CICs, which greatly increases the business volume of CICs. All these, on the one hand, greatly reduce the CIC risk. On the other hand, for the impulse of CIB risk with a standard deviation, the GDP has a positive response in the short run, which then declines after reaching the peak in the third period and converges to 0. This shows that the rising risk of CIBs is accompanied by economic recovery, the fiscal investment of CICs does a good job in stimulating economic growth. The conclusions of the IRF support Hypothesis 3. Hypothesis 3 will receive more support in our subsequent studies.
Variance decomposition can further explain the relationship among the three. The variance decomposition results are shown in Table 4.
As shown in Table 4, the most important explanatory factor for CIB spread is the local GDP growth rate, which reaches 2.18% after 10 periods. This further verifies the important impact of local economic growth on the CIB spread. At the same time, local fiscal investment (buex) is also an important factor, which reaches 1.85% after 10 periods. The most important factor to explain the variance of local GDP growth is also the local fiscal investment and CIB spread. Local fiscal investment explains 29% of the fluctuation of local GDP growth after 10 periods, and CIB spread also explains 7.01% of the fluctuation, which fully demonstrates the close relationship between local public finance, local economic growth and CICs. At the same time, the NPL also explains 4.61% of the fluctuation of the local GDP growth, which is also an important factor affecting the local economy. Therefore, the conclusion of variance decomposition illustrates the close relationship between local economic fluctuations and CIB spreads, which provides further support for Hypothesis 3.
On the other hand, from the perspective of the explanatory factor for NPL, the most important explanatory factor is the local GDP growth and fiscal expenditure (buex), which reach 5.5% and 9.66%, respectively, after the 10th period. CIB spread also has a certain explanatory power on the NPL of CCBs.

5.3. A Further Study on the Loan Flow Directions of CCBs

It has been proved above that the CCB risk-taking is significantly affected by the local economic fluctuations of CIB risk. Different from the existing literature, this research tries to further study what kinds of CCB assets are most affected by local economic fluctuations and CIB risk. Since credit assets account for the largest proportion in the total assets of CCBs, following the paradigm of most existing literature, this study focuses on whether the industrial flow of CCB loans is affected by the local economic fluctuations and CIB risk. Qian et al. [66] found that CCBs will increase loan flow into the construction industry in districts where promotion pressure is high. The promotion pressure is mainly due to the pressure of local GDP growth, and the CIC’s business is mainly focused on infrastructure. Therefore, the construction industry loans from CCB are chosen to carry out further research.
As shown in Table 5, the average proportion of the loan flow into the construction industry from CCBs to the total loans (consloan) is 6.46%, and its volume is close to the proportion of the real estate loans.
The unit root test was performed firstly. Because the data of CCB are an unbalanced panel, Fisher-ADF was selected for testing. The test results showed that the variable consloan is stable. Both AIC and BIC information criteria indicated that one lag should be selected.
The estimated PVAR parameters do not provide much information, according to Galariotis et al. [67]. The IRF and the variance decomposition should be focused. Therefore, these IRF and variance decomposition provide valuable information in achieving the focal point of this study, which examines how CCB risk-taking responds to a surprise shock for economic fluctuation and CIB risk. Following some previous research [67,68] that did not discuss the estimated PVAR parameters, we thus only report the IRF and variance decomposition. However, the full results of the PVAR coefficient are available upon request.
The results of IRF are shown in Figure 4.
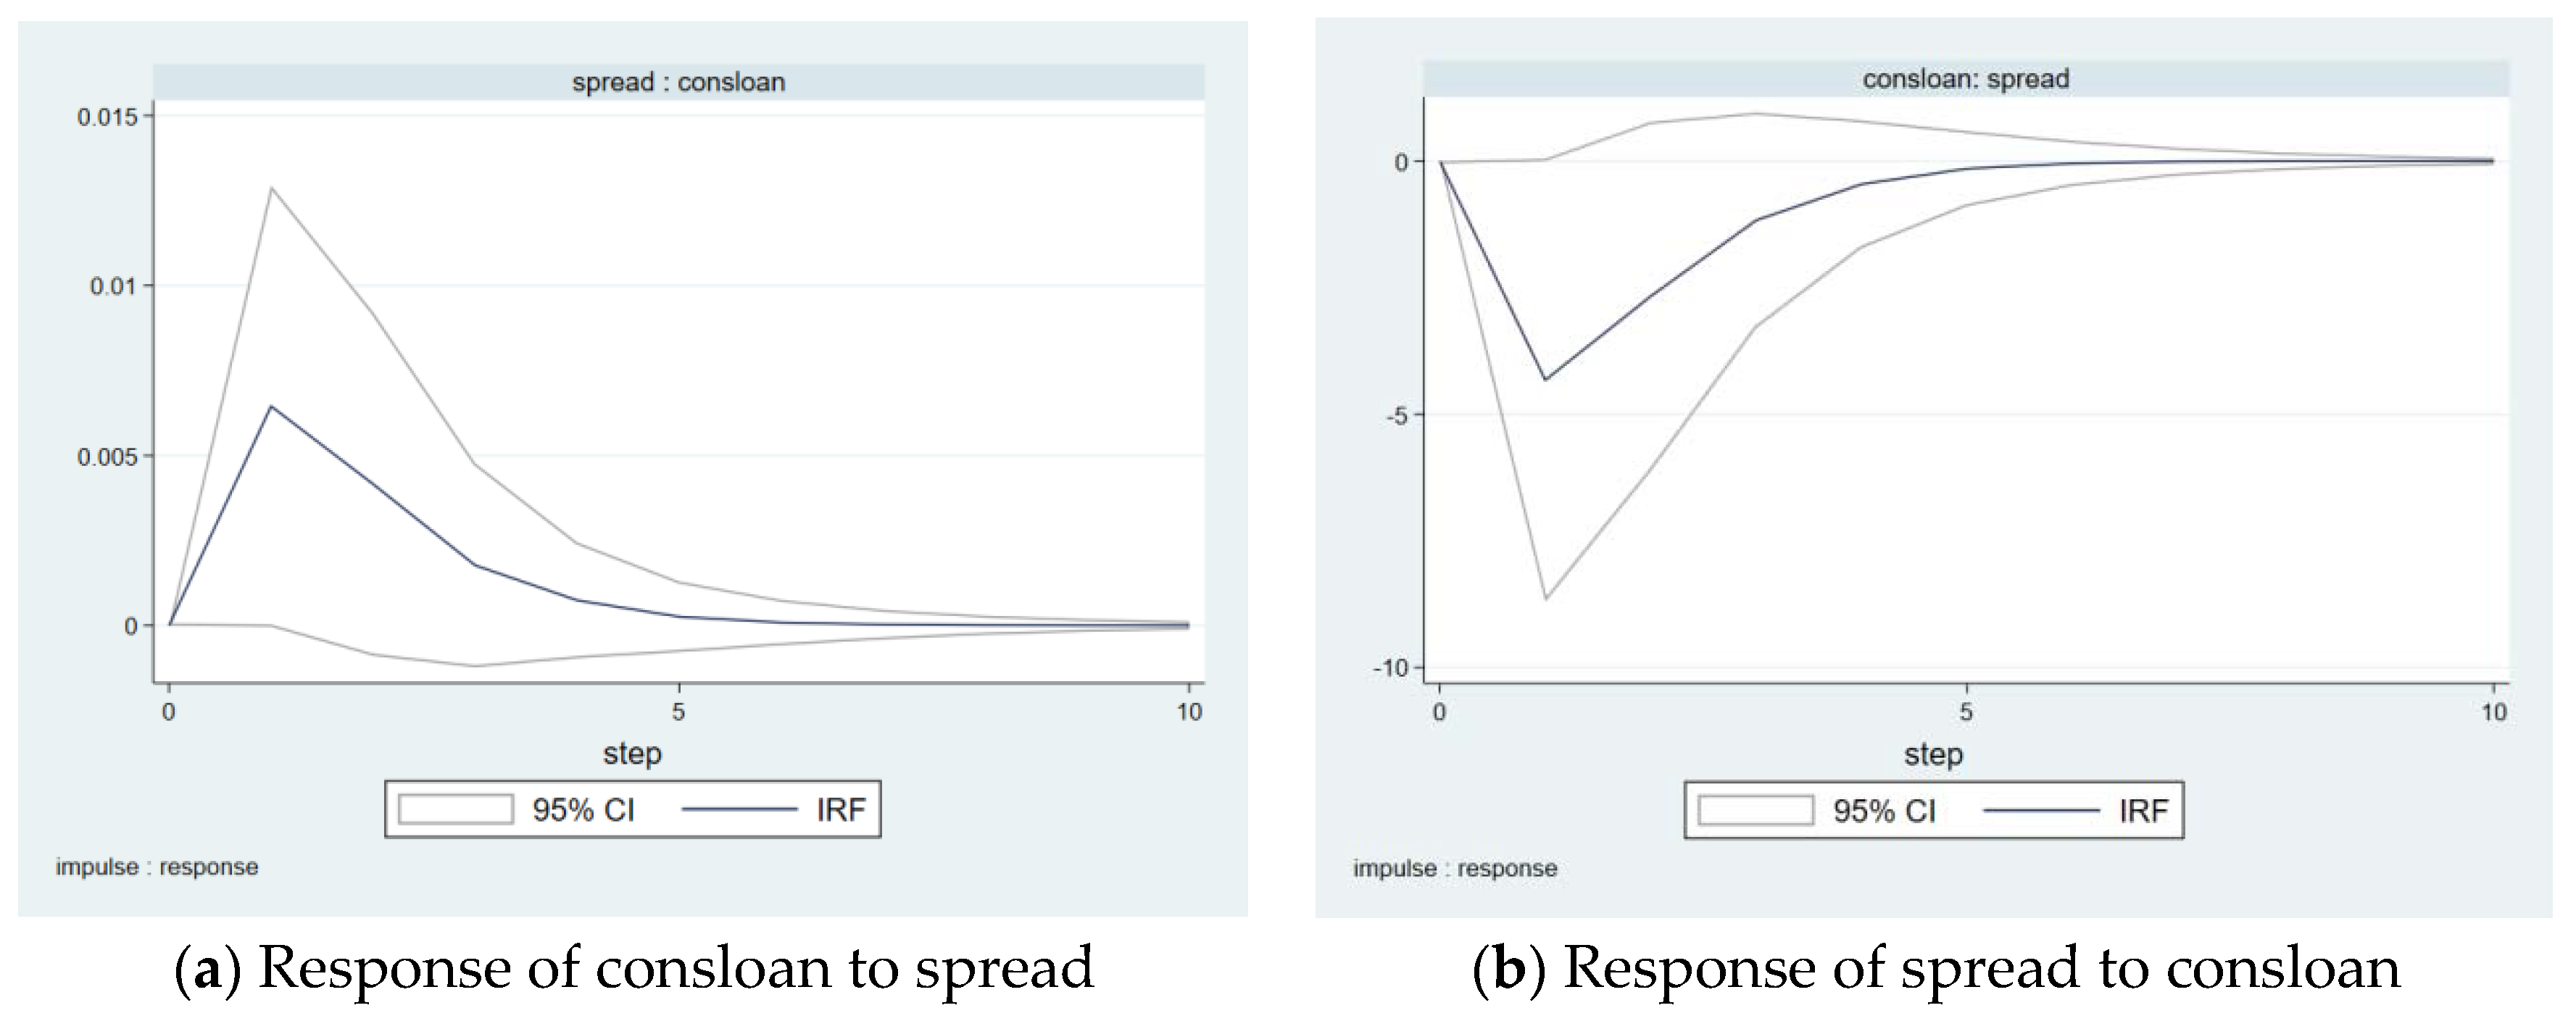
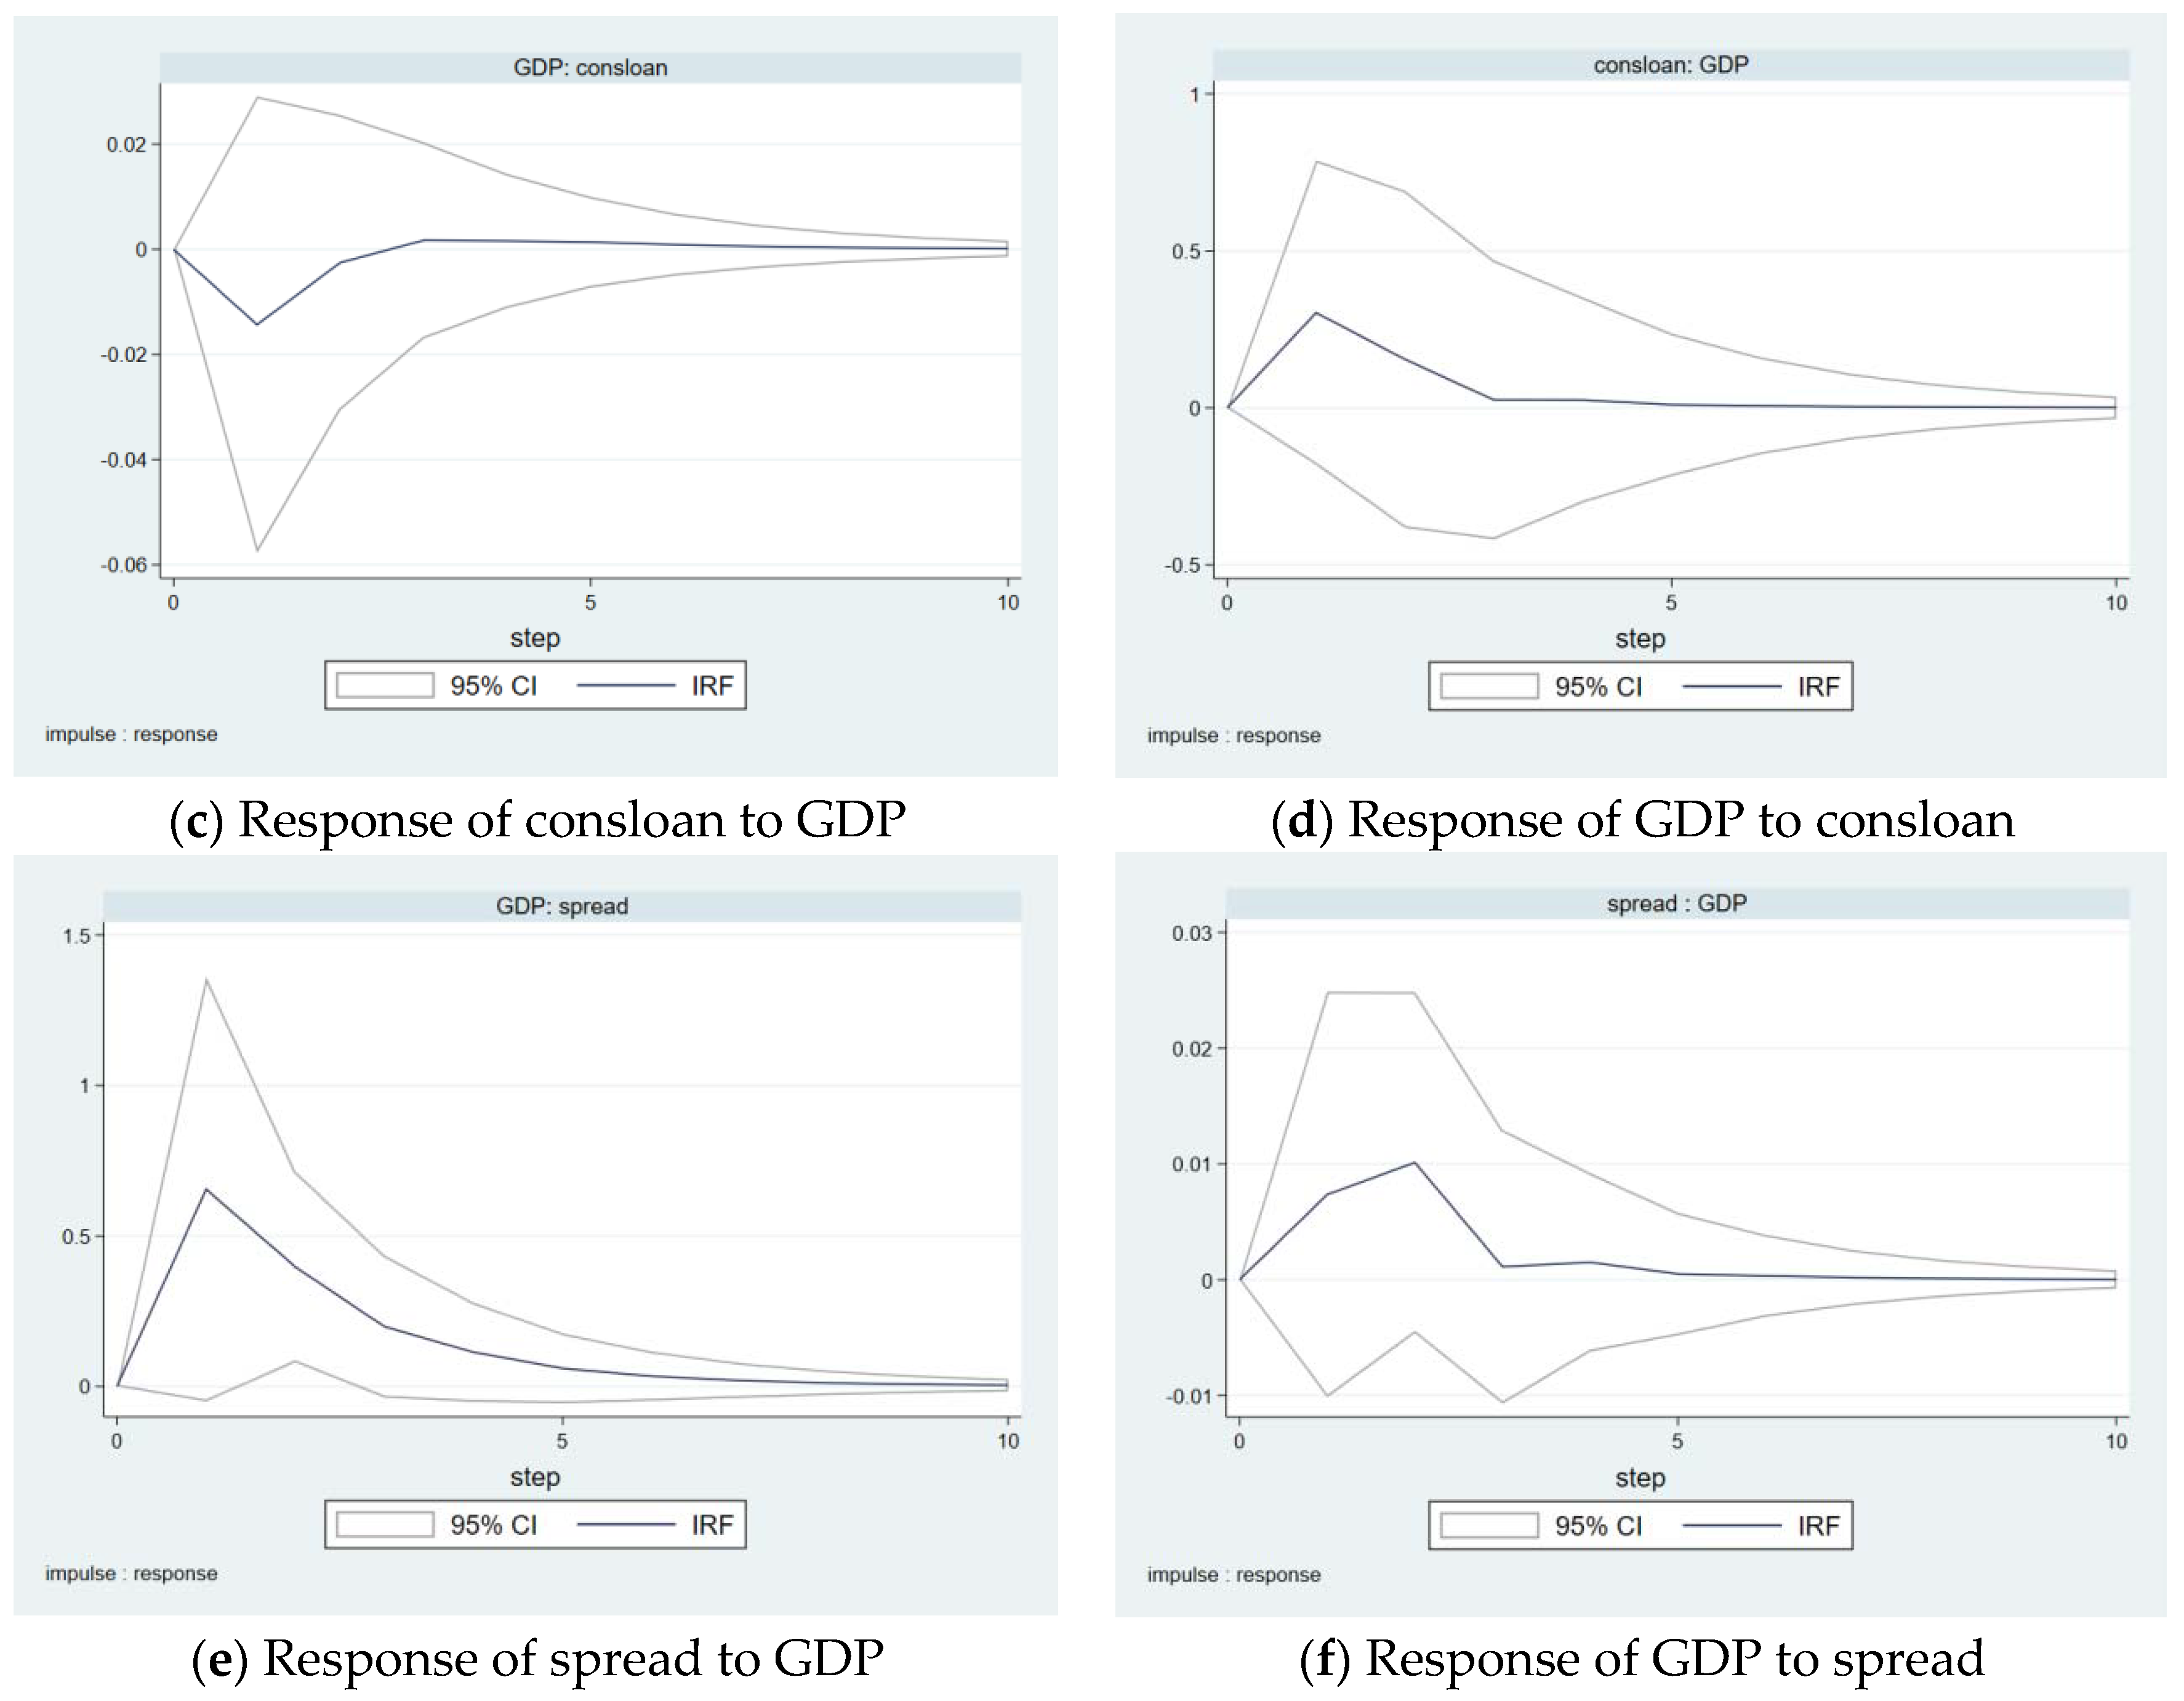
Firstly, from the perspective of the consloan’s interaction with GDP and spread. For the impulse of the CIB spread with a standard deviation, the consloan had a positive response in the short run, then declined after reaching the peak in the first period, but remained positive and converged to zero. This shows that the rise of the CIB risk makes the CCBs rapidly increase the construction industry loans. As people know, one of the most important businesses of the CIC is the construction of urban infrastructure, and CCBs are the most important source of credit funds for the CICs, while the study found that when the CIB risk rose, CCBs tended to increase construction loans. Related to the above OLS regression conclusions, all this information points to the CCBs increasing the credit supply to the CICs when their risk rises, thus increasing the CCB risk-taking. This risk transmission chain from CIB to CCB has been relatively clear. Meanwhile, Figure 4c shows that for the impulse of GDP with a standard deviation, the consloan had a sharp negative response in the short run, then rose rapidly after reaching the lowest point in the first period, became positive in the third period and converged to zero. This shows that, with the improvement of the local economy, the CCBs have rapidly reduced the construction credit supply, but in the medium and long term, they still increase the construction credit supply. This may be due to the economic growth promoted by the countercyclical fiscal regulation, which makes the construction loans fall in the short term. However, the infrastructure investment itself has a long construction cycle, so the infrastructure investment in the economic downturn period may be maintained until the economic recovery period, which also brings the local government fiscal policy partial procyclicality. This echoes the research conclusion of Jia et al. [33]. Figure 4b shows that for the impulse of consloan with a standard deviation, the CIB spread had a negative response in the short run, then rose after reaching the lowest point in the first period and converged to zero. This indicates that the construction loans of CCBs is helpful to reduce the CIB risk, further verifies the risk transmission process of the two, linked through construction credit. Figure 4d shows that for the impulse of consloan with a standard deviation, the GDP had a positive response in the short run, then declined after reaching the peak in the first period, remained positive and converged to zero. It shows that the construction loans increased by the CCBs due to the fiscal countercyclical regulation does play a role in stimulating economic growth.
Secondly, from the perspective of interaction between the local GDP growth and CIB spread, Figure 4e shows that for the impulse of GDP with a standard deviation, the spread had a sharp positive response in the short run, then declined after reaching the peak in the first period, but remained positive and converged to zero. It shows that local GDP growth tends to increase the risk of CIBs. Figure 4f shows that for the impulse of spread with a standard deviation, the GDP had a positive response in the short run, then maintained positive after reaching the peak in the second period and converged to zero. This conclusion is completely consistent with the GMM regression results of NPL mentioned above, which once again verifies that the CIB risk increases in economic prosperity, but decreases in economic recession.
The conclusions of the IRFs confirm that the impact of local economic growth tends to reduce the construction loan proportion of CCBs, while the positive impact of the CIB risk tends to make the CCBs increase the construction loan proportion. Thus, Hypothesis 2 is verified.
A series of conclusions of the model and fact analysis demonstrate that the construction industry, as the most important means of fiscal countercyclical regulation in recent years, has a significant impact on the loan flows of CCBs and CICs. During the economic recession, the countercyclical fiscal regulation mainly invests the funds into the construction industry, and the CICs undertake most of the local infrastructure. Meanwhile, the CCBs are the most important source of funds for the CICs, thus forming some strange interactions in the local economy: the economic recession forces local governments to increase infrastructure investment, so the risks of CICs, which are suppliers of local governments and undertake major infrastructure construction, are reduced, while the CCBs, as an important source of funds, significantly increase the construction loans, then the increase of construction loans indeed boosts local economic growth. As the economy recovers and business improves, CCBs are taking fewer risks. This virtuous cycle can continue if there is no significant risk to economic activity. However, empirical evidence suggests that risk does pass in this cycle. Overcommitment at any one link, which upsets the balance of the system, could create a greater risk of a vicious spiral spiraling from a virtuous one.
Finally, variance decomposition can further verify our conclusions.
From the perspective of the historical explanatory power of the capital flow of CCBs, in addition to itself, the primary explanatory factor of the consloan is the CIB spread, which reaches 1.74% after the 10th period. The impact of GDP, buex and inf is small, at 0.08%, 0.41% and 0.02%, after the 10th period. In contrast, the primary explanation factor for the spread of CIBs is also consloan, which reaches 7.56% after 10 periods, followed by GDP, 3.13% and buex, 1.78%. The construction loans ratio of CCBs and the spread of CIBs are the most important factors for each other, respectively, which once again confirms the close relationship between the construction industry, local debt and local finance. By comparing the variance decomposition of NPL in Table 6, obvious differences can be found. The primary explanatory factors of the variance of NPL and spread are both GDP and buex. Therefore, the CIB risk affects the construction loans of CCBs, and then affects the CCB risk-taking. The variance decomposition verified the unusually close relationship between construction loans and CIB spreads, which provided further support for Hypothesis 2.
From the perspective of the explanatory power to local economic growth, the variance decomposition results in Table 4 and Table 6 both show the huge effect of local fiscal expenditure on local economic growth, the explanatory power after 10 periods reaches up to about 30%. At the same time, the explanatory power of CIB spread also reached 4.55% and 7.01 respectively. These two are the biggest contributors to local GDP growth. In contrast, local GDP growth and CIB spreads are also important explanatory factors for local fiscal expenditure. This implies that the local fiscal expenditure and CIC risk are closely related to local economic growth and are the most important explanatory factors for local economic growth.

5.4. Robustness

In order to further examine the robustness of the results, the following aspects were tested:
(1) According to the principle of PVAR model, the sequence of endogenous variables may affect the conclusion of the model. We re-examined the results of the GMM estimation, IRF and variance decomposition by changing the sequence of the Cholesky decomposition of endogenous variables, the main results were basically consistent with the previous analysis.
(2) In the OLS regression, the explanatory variable was changed to the z-value for the bankruptcy risk for CCBs, the results were basically consistent with the regression results of NPL and RWAI. The regression result of Z-score is shown in Table 7.
The IRF of PVAR with Z-score is shown in Figure 5.
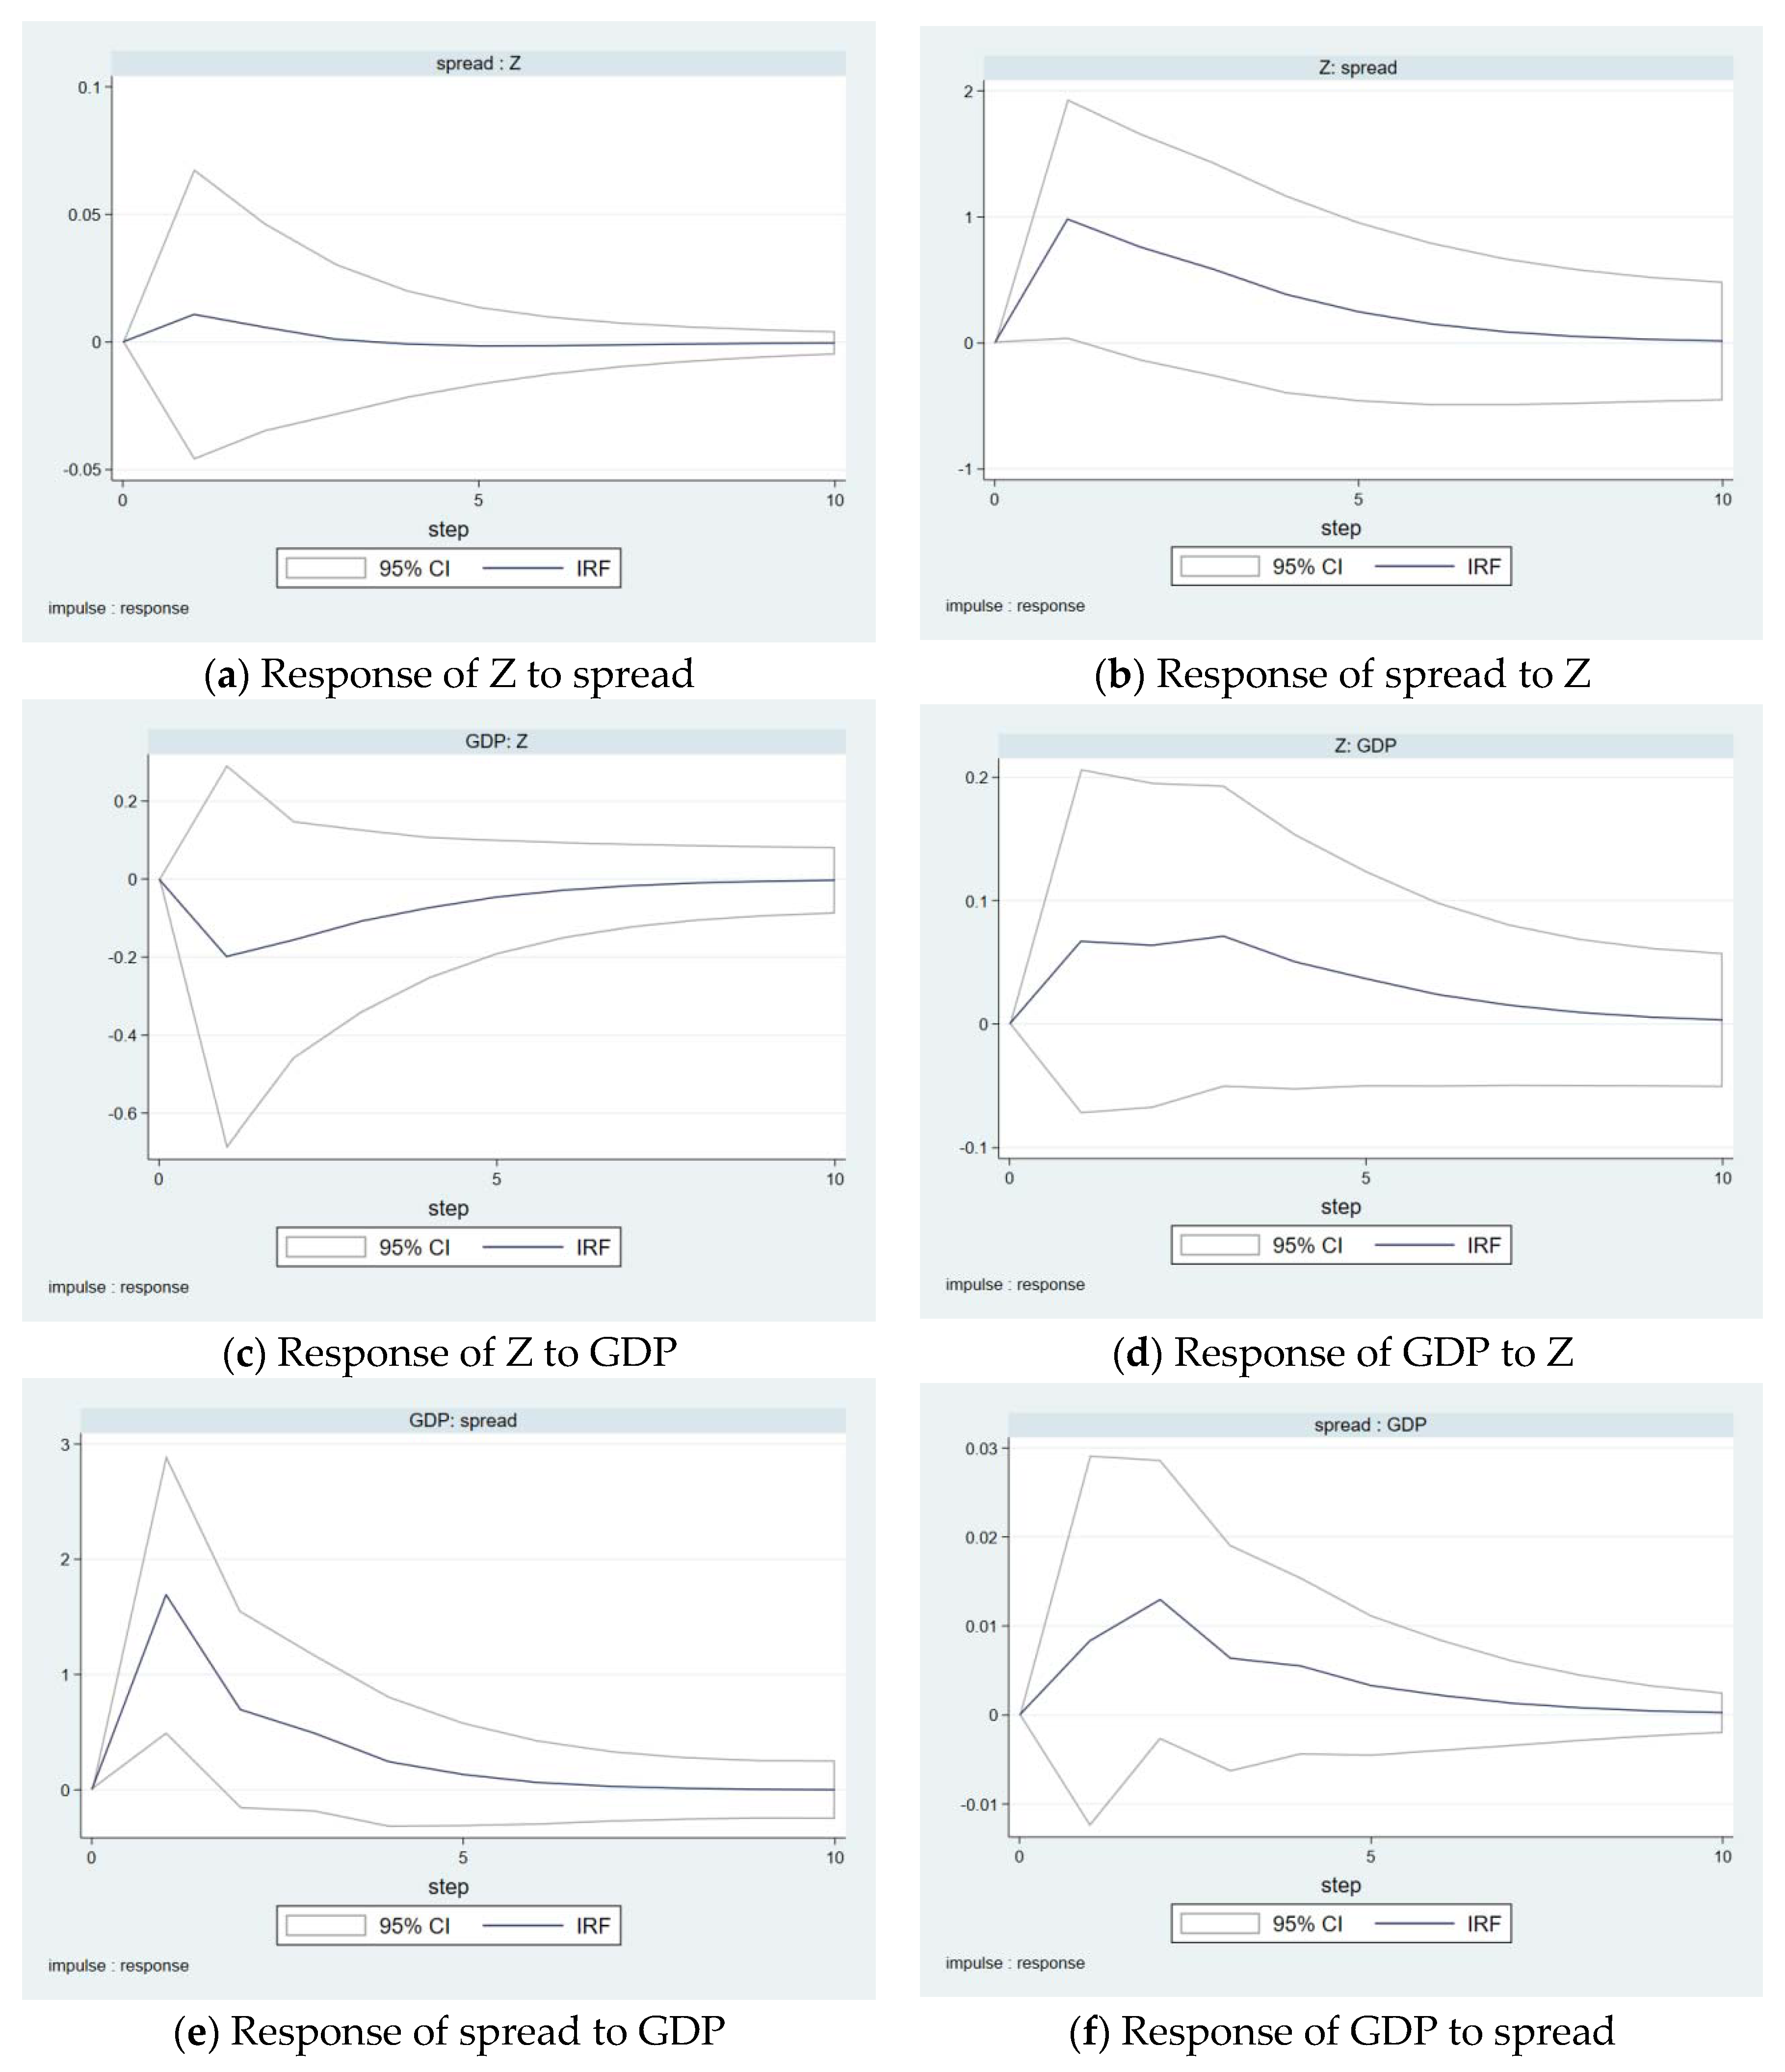
Figure 5a shows that for the impulse of spread with a standard deviation, the z-score had a positive response in the short run, a negative response in the long run. That is, in the long run, the CIB spread increases the risk of bankruptcy of CCBs, which is most similar to the conclusion of NPL and basically consistent with the conclusion of RWAI. Figure 5b shows that for the impulse of z-score with a standard deviation, the spread had a positive response. That is, the decline of the bankruptcy risk of CCBs tends to increase the CIB risk, which is completely consistent with the conclusions drawn by the aforementioned NPL, RWAI and consloan indicators. Figure 5c shows that for the impulse of GDP with a standard deviation, the Z-score had a negative response in the short run, then rose after reaching the lowest point in the first period, remained negative and converged to zero. It shows that the economic boom makes the CCBs increase their risk-taking in a procyclical manner, but the economic growth partially offsets the risks of the CCBs. This is consistent with the result of NPL, and the RWAI results are almost the same. Slightly different, the impulsive results of RWAI did not reflect the upward trend of short-term risk, possibly because noncredit assets such as bonds were more sensitive to economic fluctuations and the economic growth accelerated to offset the procyclical behavior of CCBs, so the IRF did not show an upward trend of short-term risk, but a sustained decline of risk. The interactive relationship between GDP and CIB spread reflected in Figure 5e,f is completely consistent with the above conclusion. To sum up, the conclusion that the risk-taking indicator of CCBs is replaced by Z-score can generally support the above analysis results of NPL and RWAI, the conclusion is robust.
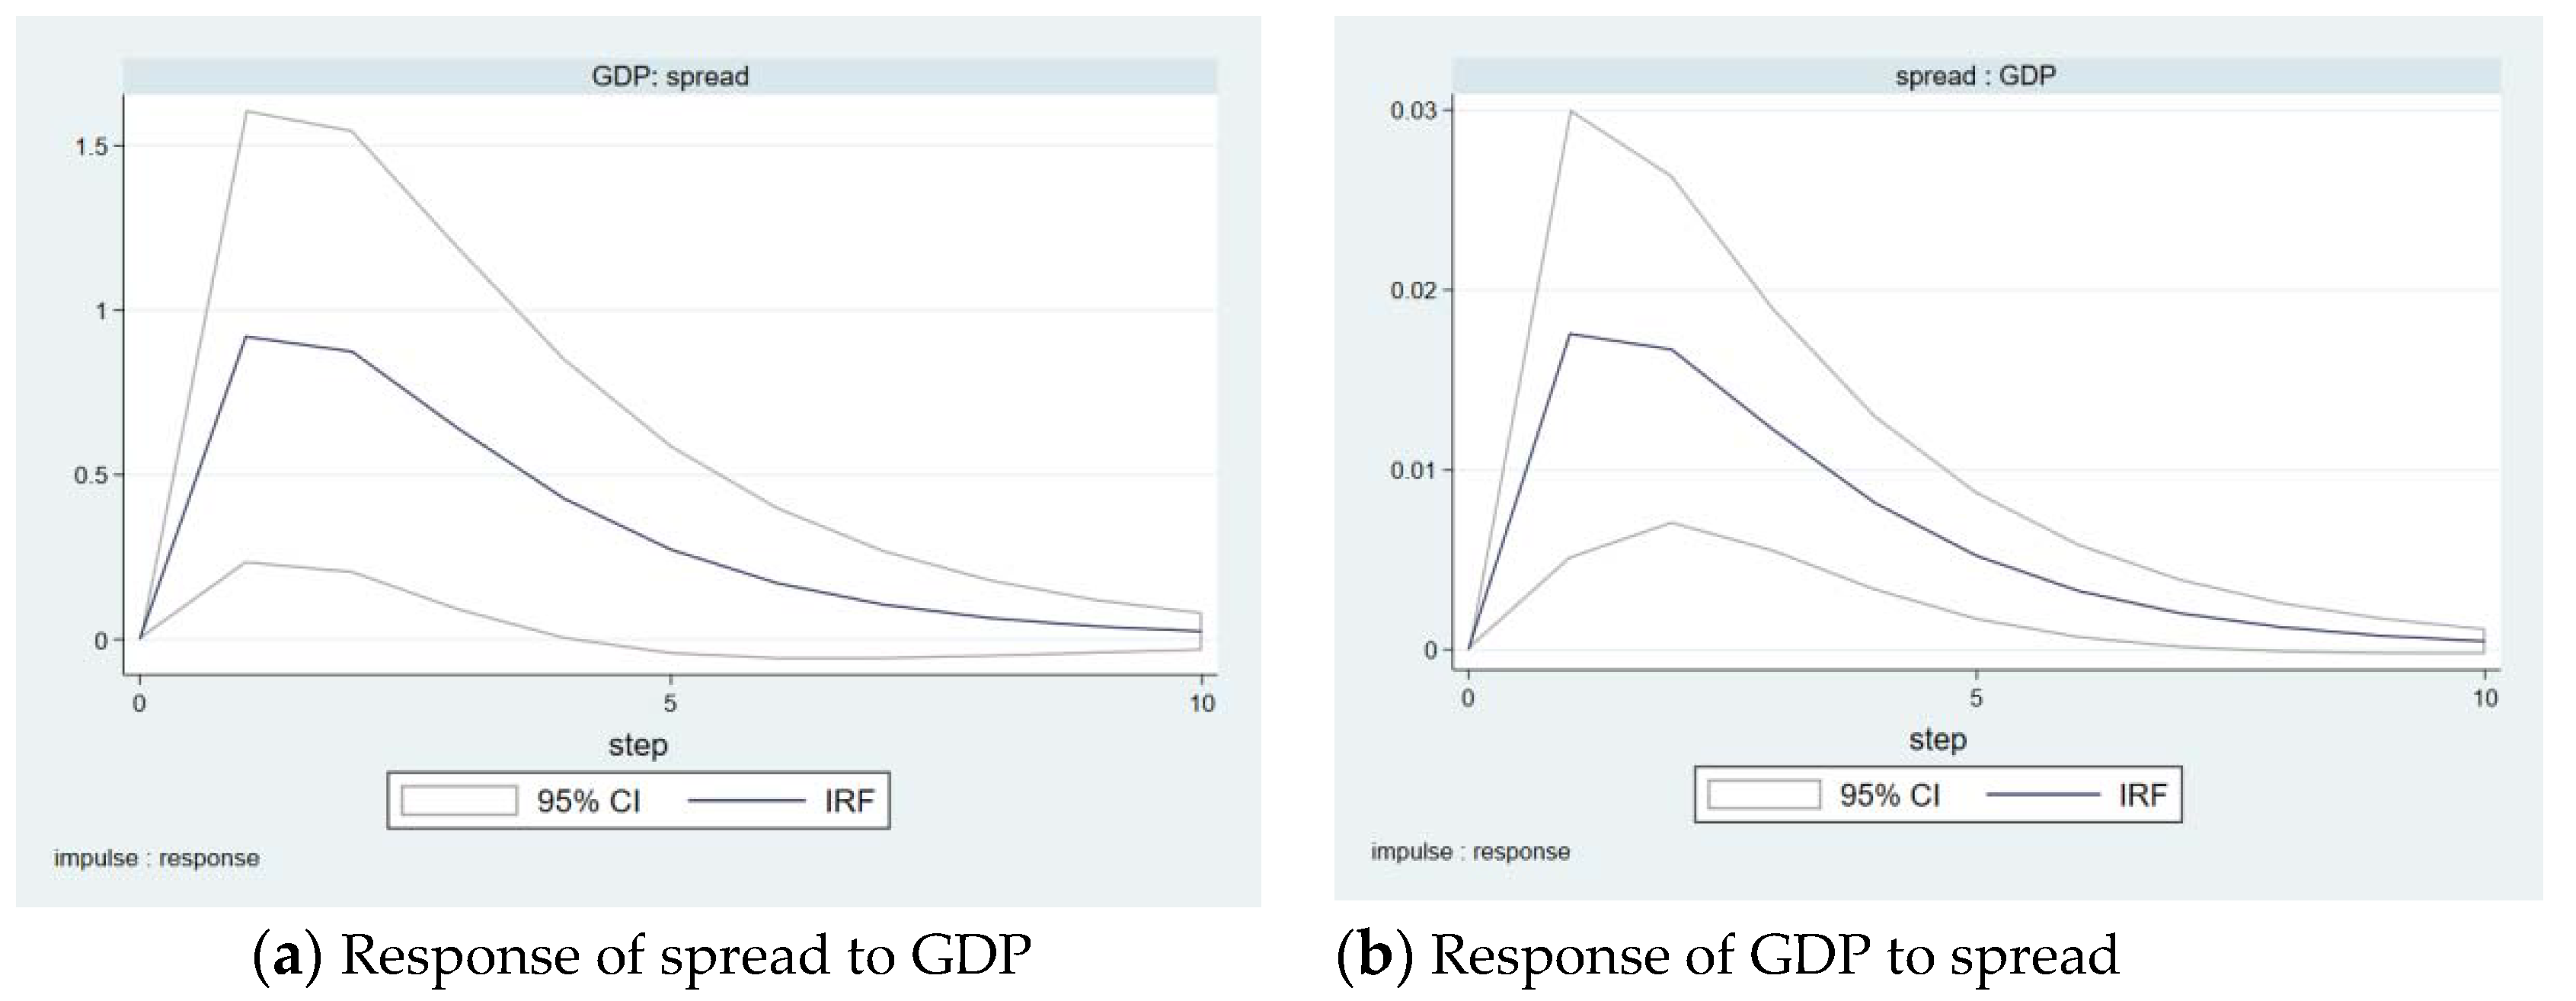
(3) In order to verify the interactive relationship between the spread of CIBs and local GDP growth, these two variables were chosen to make PVAR estimates, the conclusions significantly supported the above conclusions.
As shown in Table 8, the GMM estimation results were all significantly positive at the 1% level, and the impulse−response graphs shown in Figure 6 are completely consistent with the above conclusions.
(4) We remove variables buex and inf in PVAR model, use y i t = ( R I S K i t , s p r e a d i t , G D P i t ) T , where R I S K i t denotes NPL, RWAI and consloan, for PVAR and IRF respectively, the conclusions are basically the same.

6. Discussion

By constructing a PVAR model, this study discusses the interactive relationship between economic fluctuation, local debt risk and CCB risk-taking, which expands the view of existing research on the relationship between government and bank. Further analysis of the flow of bank credit clarified how infrastructure, as a conventional countercyclical regulation method, affects CCB risk-taking, thus constructed an analytical framework for bank risk-taking to respond to economic fluctuations and local debt risks at the macro-micro level. This study provides multilayer theoretical support for the theory of the relationship between government and bank and its interaction with economic fluctuations.

6.1. Economic Fluctuation, Local Debt Risk and CCB Risk-Taking

The significance of multiple linear regression shows that the economic fluctuations are negatively correlated with the CCB risk-taking, and the IRF provides a more comprehensive explanation: the impact of economic growth makes the CCB risk-taking tend to rise in the short term, but tend to fall in the long term. This supports the procyclical behavior theory of banks [43] and meanwhile supports the research conclusions of Salas and Salas and Saurina [44], which propose that that bank risks will be offset by the boom.
Many studies indicate that local governments influence the behavior of CCBs through multiple channels [47], among which, local debt is the most important form [46]. The results of multiple linear regression and IRF both point to a positive correlation between the risk of CIBs and the risk-taking of CCBs, indicating that the risk of local governments and banks tends to be consistent, which is consistent with the research conclusion of Zheng et al. [64]. If the CCBs have to be more or less influenced by local government, then the establishment of a good government−bank interaction will be an important premise to prevent financial risks.

6.2. Economic Fluctuation, Local Debt Risk and the Loan Flow Directions of CCBs

The loan flow of CCBs is closely related to the risk-taking of CCBs [69]. Therefore, further analysis of the loan flow of CCBs is conducive to revealing the reasons for the change of CCB risk-taking from the microlevel. Data analysis and empirical results show that the loan flow of CCBs to the construction industry is affected by local economic fluctuation and CIB risk, which is reflected as countercyclical. The conclusions of the study clarify the chain relationship of “fiscal countercyclical regulation−infrastructure investment−CICs−CCBs”: infrastructure investment is the most important fiscal countercyclical control means, CICs are the most important undertaker of government infrastructure, and CCBs are the most important source of funds for CICs. Therefore, the construction credit of the CCBs shows obvious countercyclical tendencies, which explain the positive correlation between the risk-taking of CCBs and the risk of CIBs in the above study from the microlevel. The results are compatible with Ke & Yan [70].

6.3. Economic Fluctuation and Local Debt Risk

Liu & Lu [50] and Chen [51] propose in their theoretical research that the interaction between the financing leverage of CCBs and CICs will lead to the procyclical of CIC risk, that is, CICs are more likely to expand their debt scale in the economic boom, while the debt risk will break out in the economic downturn. However, the empirical evidence in this study points to the opposite conclusions: CICs are more likely to obtain more credit resources from CCBs in the economic downturn because of the countercyclical fiscal regulation, so the risk is less. However, during the economic upturn, the infrastructure investment decreases, so the credit source for the CICs decreases. The loans accumulated during the economic downturn gradually mature, so the risk is more likely to break out during the economic upturn. The robustness test in this paper further confirmed this conclusion. The conclusion of this study updates the theoretical view and provides a perspective for further research on economic fluctuations and government debt risks.

7. Conclusions

7.1. Conclusions and Implications

Logic, facts and data analysis all show that there is a close correlation between local debt risks, economic fluctuations and CCB risk-taking. Following this idea, this research studies the significant relationship between the three indicators: local GDP growth, CIB spread and CCB risk-taking. On this basis, the interactive relationship between the three is further explored from the perspective of credit flow. The estimation results show that: (1) OLS results show that local debt risks and local economic fluctuations significantly affect the CCB risk-taking. The risk of local debt is positively correlated with the CCB risk-taking, while the local economic growth significantly reduces the risk of CCBs. (2) The PVAR results show that due to the dynamic adjustment of CCBs when they perceive external risks, the impact of CIB risks temporarily reduces the risk-taking of CCBs in the short term, but it still increases the risk-taking of CCBs in the medium and long term. In contrast, the impact of CCB risk-taking reduces the risk of CIBs in both short and long term. On the other hand, local economic growth effectively reduces the risk-taking of CCBs. (3) The CIB risk has the most significant impact on loans flowing into the construction industry, and it is countercyclical, which proves that the capital of CCBs flows to CICs against the trend when the risk is enlarged. The construction industry has become an important means of the government’s countercyclical fiscal control, which makes the risk of the CCBs tie in with the risk of local debt. At the same time, the reverse fluctuation of CIB risk and economic cycle also proves the countercyclical regulation function of CICs in local economic development. (4) The variance decomposition results show that the credit allocation of CCBs and the CIB risk have a strong explanatory power to each other, indicating the close relationship between the two sides; local finance and local debt risks together greatly explain the local economic fluctuations, illustrating the important role of local finance in local economic growth and risk control.
The above results show that the behavior of local governments is one of the most important factors of local economic growth; CICs, whose main function is city infrastructure, are an important channel for local governments to boost local economies. However, it draws CCBs into a risk system led by local governments. The risk-taking behavior of CCBs is significantly affected by local debt risks and local economic fluctuations. It is inevitable that banks around the world will be influenced by governments to some extent [24]. As the core position of the modern finance industry and even the whole economy, how to build a benign interaction between local government and banks and prevent bank risks is the first topic. This research studies the interaction between the risk of local debt, economic fluctuations and bank risk-taking, the conclusion reveals the close relationship between the three. Therefore, in order to promote the sustainable development of local debt, banks and the economy, the following three suggestions are worth learning from: (1) fiscal countercyclical control should be timely and appropriate, and the CCBs should fully consider the countercyclical risk in the loans offered for infrastructure. (2) The diversification of capital sources of CICs can effectively spread risks so as to avoid excessive accumulation of risks in banks. (3) Governments should control the scale of local government debt to ensure the effect of countercyclical regulation and prevent systemic financial risks. Many studies have proved that high government debt ratios weaken the ability and effectiveness of countercyclical regulation, contribute to financial instability, and even exacerbate economic recession. Therefore, maintaining a sustainable government debt ratio is the fundamental way to prevent the excessive spread of local debt risks to bank risks.

7.2. Limitations and Further Ways of the Research

The results make an important contribution to the literature on economic fluctuation and the government−bank relationship. There were some limitations pertaining to the study that can provide material for future research. This study is based on the current background of the reform and development of CCBs in China. The practical background of China as an emerging country makes the research conclusions not necessarily applicable to all economic entities. Meanwhile, the limitation of data availability also makes the research open to improvement. However, the research topic of this study is of wide concern in the world, and the research framework can also be applied to other economic entities, such as Southeast Asian countries, developed countries, Islamic countries, etc. By extending the research framework of this study to other countries, it is possible to seek the commonality and characteristics of the relationship between economic fluctuation, government debt risk and bank risk-taking, and obtain more novel conclusions.

Author Contributions

Conceptualization, C.Z., S.C.; data curation, S.C., Z.D.; formal analysis, S.C.; investigation, C.Z., S.C., Z.D.; methodology, S.C.; project administration, C.Z., Z.D.; resources, Z.D., S.C., C.Z.; supervision, C.Z.; writing—original draft preparation, S.C.; writing—review and editing, Z.D. All authors have read and agreed to the published version of the manuscript.

Funding

This research was funded by Science and Technology Project of Education Department of Jiangxi Province, grant number 181290.

Institutional Review Board Statement

Not applicable.

Informed Consent Statement

Not applicable.

Data Availability Statement

Restrictions apply to the availability of these data. Data was obtained from Wind, Bankscope and CSMAR and are available at https://www.wind.com.cn/, https://banks.bvdinfo.com/version-202136/home.serv?product=orbisbanks and https://www.gtarsc.com/ with the permission of Wind, B.V.D. and CSMAR.

Conflicts of Interest

The authors declare no conflict of interest.

References

  1. Chen, S. Economic growth, real estate climate and local debt risks: Impulse and stress-testing. China Real Estate 2021, 21, 39–50. [Google Scholar]
  2. Olakojo, S.A.; Onanuga, A.T.; Onanuga, O.T. Cyclical fluctuations of economic growth and monetary policy in Nigeria: Does fiscal policy also matter? J. Contemp. Afr. Stud. 2021, 39, 34–55. [Google Scholar] [CrossRef]
  3. Reinhart, C.M.; Rogoff, K.S. Errata: Growth in a Time of Debt. Am. Econ. Rev. 2010, 100, 573–578. [Google Scholar] [CrossRef] [Green Version]
  4. Reinhart, C.M.; Rogoff, K.S. Banking Crises: An Equal Opportunity Menace. J. Bank. Financ. 2013, 37, 4557–4573. [Google Scholar] [CrossRef] [Green Version]
  5. Nasution, M.E.; Wahyudi, I. Government fiscal policy impact analysis in infrastructure sector and education sector to improve public welfare. Econ. J. Emerg. Mark. 2017, 9, 51. [Google Scholar] [CrossRef] [Green Version]
  6. Jouili, T.A.; Allouche, M.A. Impacts of seaport investment on the economic growth. Promet-Traffic Transp. 2016, 28, 365–370. [Google Scholar] [CrossRef]
  7. Novak, A.; Bennett, D.; Kliestik, T. Product Decision-Making Information Systems, Real-Time Sensor Networks, and Artificial Intelligence-driven Big Data Analytics in Sustainable Industry 4.0. Econ. Manag. Financ. Mark. 2021, 16, 62–72. Available online: https://www.ceeol.com/search/article-detail?id=963242 (accessed on 24 August 2021).
  8. Riley, C.; Vrbka, J.; Rowland, Z. Internet of Things-enabled Sustainability, Big Data-driven Decision-Making Processes, and Digitized Mass Production in Industry 4.0-based Manufacturing Systems. J. Self-Gov. Manag. Econ. 2021, 9, 42–52. Available online: https://www.ceeol.com/search/article-detail?id=939808 (accessed on 24 August 2021).
  9. Adrian, T.; Shin, H.S. Procyclical Leverage and Value-at-Risk. Rev. Financ. Stud. 2014, 27, 373–403. [Google Scholar] [CrossRef] [Green Version]
  10. Sapienza, P. The effects of Government Ownership on Bank Lending. J. Financ. Econ. 2004, 72, 357–384. [Google Scholar] [CrossRef] [Green Version]
  11. Anderson, R.C.; Fraser, D.R. Corporate Control, Bank Risk Taking, and the Health of the Banking Industry. J. Bank. Financ. 2000, 24, 1383–1398. [Google Scholar] [CrossRef]
  12. Repullo, R.; Saurina, J.; Trucharte, C. Mitigating the Pro-cyclicality of Basel II. Econ. Policy 2010, 25, 659–702. [Google Scholar] [CrossRef]
  13. Hui, X.; Zhang, A. Construction and Empirical Research on the Dynamic Provisioning Model of China’s Banking Sector under the Macro-Prudential Framework. Sustainability 2020, 12, 8527. [Google Scholar] [CrossRef]
  14. Badar, A.; Sidra, A.; Yuancheng, H. Capital Regulation and Bank Risk-Taking Behavior: Evidence from Pakistan. Int. J. Financ. Stud. 2016, 4, 16–36. [Google Scholar]
  15. Dewally, M.; Shao, Y. Leverage, Wholesale Funding and National Risk Attitude. J. Int. Financ. Mark. Inst. Money 2013, 23, 179–195. [Google Scholar] [CrossRef]
  16. Segev, N. Identifying the Risk-Taking Channel of Monetary Transmission and the Connection to Economic Activity. J. Bank. Financ. 2020, 116, 105850. [Google Scholar] [CrossRef]
  17. Musa, H.; Natorin, V.; Musova, Z.; Durana, P. Comparison of the efficiency measurement of the conventional and Islamic banks. Oeconomia Copernic. 2020, 11, 29–58. [Google Scholar] [CrossRef] [Green Version]
  18. Musa, H.; Musova, Z.; Natorin, V.; Lazaroiu, G.; Boda, M.M. Comparison of factors influencing liquidity of European Islamic and conventional banks. Oeconomia Copernic. 2021, 12, 375–398. [Google Scholar] [CrossRef]
  19. Acharya, V.; Naqvi, H. The seeds of a crisis: A theory of bank liquidity and risk taking over the business cycle. J. Financ. Econ. 2012, 106, 349–366. [Google Scholar] [CrossRef] [Green Version]
  20. Makri, V. Towards an Investigation of Credit Risk Determinants in Eurozone Countries. J. Account. Manag. Inf. Syst. 2016, 15, 27–57. Available online: https://papers.ssrn.com/sol3/papers.cfm?abstract_id=2758563 (accessed on 28 July 2021).
  21. Bernanke, B.; Gertler, M.; Gilchrist, S. The Financial Accelerator and the Flight to Quality. Rev. Econ. Stat. 1996, 78, 1–15. [Google Scholar] [CrossRef]
  22. Angeloni, I.; Faia, E.; Duca, M.L. Monetary Policy and Risk Taking. J. Econ. Dyn. Control 2015, 52, 285–307. [Google Scholar] [CrossRef] [Green Version]
  23. Blum, J.; Hellwig, M. The Macroeconomic Implications of Capital Adequacy Requirements for Banks. Eur. Econ. Rev. 1995, 3, 739–749. [Google Scholar] [CrossRef]
  24. Carvalho, D.R. The Real Effects of Government-Owned Banks: Evidence from an Emerging Market. J. Financ. 2012, 69, 577–609. [Google Scholar] [CrossRef]
  25. Dinc, I.S. Politicians and Banks: Political Influences on Government-Owned Banks in Emerging Markets. J. Financ. Econ. 2005, 77, 453–479. [Google Scholar] [CrossRef]
  26. Gray, B. Credit Risk in the Australian Banking Sector. Econ. Policy Rev. 2007, 4, 61–70. [Google Scholar] [CrossRef] [Green Version]
  27. Battistini, N.; Pagano, M.; Simonelli, S. Systemic Risk, Sovereign Yields and Bank Exposures in The Euro Crisis. Econ. Policy 2014, 29, 203–251. [Google Scholar] [CrossRef] [Green Version]
  28. Kaminsky, G.L.; Reinhart, C.M. The Twin Crises: The Causes of Banking and Balance-of-Payments Problems. Int. Financ. Discuss. Pap. 1996, 89, 473–500. [Google Scholar] [CrossRef]
  29. Reinhart, C.M.; Rogoff, K.S. This Time is Different: Eight Centuries of Financial Folly. Econ. Books 2011, 20, 191–194. [Google Scholar]
  30. Clarke, D.; Lu, F. The Law of China’s Local Government Debt: Local Government Financing Vehicles and Their Bonds. Am. J. Comp. Law 2017, 65, 751–798. [Google Scholar] [CrossRef]
  31. Hong, Z. Management Ability, Private Benefits, Government Intervention and Strategic Investor Selection of State-owned Banks. J. World Econ. 2007, 12, 41–53. [Google Scholar]
  32. Zhang, X.; Li, F.; Li, Z.; Xu, Y. Macroprudential Policy, Credit Cycle, and Bank Risk-taking. Sustainability 2018, 10, 3620. [Google Scholar] [CrossRef] [Green Version]
  33. Liu, C.; Guo, F.; Fu, J.; Zhou, Q. Political Incentive, Capital Regulation and Local Bank Credit Supply. J. Manag. World 2017, 10, 36–50. [Google Scholar]
  34. Mao, R.; Liu, N.; Liu, R. The Expansion of Local Government Debt and the Mechanism of Systemic Financial Risk Triggering. China Ind. Econ. 2018, 4, 19–38. [Google Scholar]
  35. Kose, M.A.; Otrok, C.; Whiteman, C.H. International Business Cycles: World, Region, and Country-Specific Factors. Am. Econ. Rev. 2003, 93, 1216–1239. [Google Scholar] [CrossRef] [Green Version]
  36. Cardani, R.; Menna, L.; Tirelli, P. The Optimal Policy Mix to Achieve Public Debt Consolidation. Macroecon. Dyn. 2020, 24, 113–129. [Google Scholar] [CrossRef] [Green Version]
  37. Tiebout, C.M. A Pure Theory of Local Public Expenditure. J. Political Econ. 1956, 64, 416–424. [Google Scholar] [CrossRef]
  38. Farmer, J.L.; Rodriguez Lombeida, A.J. How State Interventions affect Municipalities Taking the Lead in Sustainability. Sustainability 2021, 13, 6479. [Google Scholar] [CrossRef]
  39. Treisman, D. Decentralization and Inflation: Commitment, Collective Action or Continuity. Am. Political Sci. Rev. 2000, 94, 837–857. [Google Scholar] [CrossRef]
  40. Jia, J.; Guo, Q.; Zhao, X. The Periodic Characteristic of Local Government Expenditure and Its System Root. J. Manag. World 2012, 2, 7–18. [Google Scholar]
  41. Eltrudis, D.; Monfardini, P. Are Central Government Rules Okay? Assessing the Hidden Costs of Centralised Discipline for Municipal Borrowing. Sustainability 2020, 12, 9932. [Google Scholar] [CrossRef]
  42. Fisher, I. The Debt-Deflation Theory of Great Depressions. Econometrica 1933, 1, 337–357. [Google Scholar] [CrossRef] [Green Version]
  43. Asea, P.K.; Blomberg, B. Lending Cycles. J. Econom. 1998, 83, 89–128. [Google Scholar] [CrossRef]
  44. Salas, V.; Saurina, J. Credit Risk in Two Institutional Regimes: Spanish Commercial and Savings Banks. J. Financ. Serv. Res. 2002, 22, 203–224. [Google Scholar] [CrossRef]
  45. Zhang, H.; Li, H. The Non-Performing Loan Effect of Economic Growth and Abnormal Differentiation. Macroeconomics 2014, 3, 11–23. [Google Scholar]
  46. Gong, Q.; Wang, J.; Jia, S. A Survey of Research on Local Government Debts and Fiscal Decentralization. Econ. Res. J. 2011, 7, 144–156. Available online: https://d.wanfangdata.com.cn/periodical/jjyj201107012 (accessed on 28 July 2021).
  47. Yin, W.; Liu, X. Local Government Behaviors and the Risk-taking of City Commercial Bank. J. Manag. Sci. 2017, 6, 79–91. [Google Scholar]
  48. Wu, X.; Yu, Q. Local Government Debt: Causes and Empirical Analyses. China Public Adm. Rev. 2017, 1, 22–38. Available online: https://d.wanfangdata.com.cn/periodical/ggglpl201701002 (accessed on 28 July 2021).
  49. Carrasco-Gallego, J.A. Real Estate, Economic Stability and the New Macro-Financial Policies. Sustainability 2021, 13, 236. [Google Scholar] [CrossRef]
  50. Liu, H.; Lu, Y. Research and Evaluation on the Debt Risk of Local Government Investment and Financing Platform in Transformation Period. Financ. Trade Econ. 2016, 5, 48–59. [Google Scholar]
  51. Chen, F. The Pro Cyclical and Counter Cyclical Regulation of China’s Local Government Debt. Reform Econ. Syst. 2019, 6, 143–149. Available online: https://d.wanfangdata.com.cn/periodical/jjtzgg201906022 (accessed on 28 July 2021).
  52. Vegh, C.A.; Vuletin, G. The Road to Redemption: Policy Response to Crises in Latin America. IMF Econ. Rev. 2014, 62, 526–568. [Google Scholar] [CrossRef]
  53. Ye, Z.; Zhang, F.; Coffman, D.M.; Xia, S.; Wang, Z.; Zhu, Z. China’s Urban Construction Investment Bond: Contextualising a Financial Tool for Local Government. Land Use Policy 2020, 11, 105153, in press. [Google Scholar] [CrossRef]
  54. Zhang, J.; Li, L.; Yu, T.; Gu, J.; Wen, H. Land Assets, Urban Investment Bonds, and Local Governments’ Debt Risk, China. Int. J. Strateg. Prop. Manag. 2021, 25, 65–75. [Google Scholar] [CrossRef]
  55. Wang, Z. Government Intervention and the ‘Upside down Interest Rates’ in the Issuance of Local Government Bond. J. Manag. World 2018, 11, 25–35. [Google Scholar]
  56. Wu, J.; Li, H.; Zheng, D.; Liu, X. Economic uncertainty or financial uncertainty? An empirical analysis of bank risk-taking in Asian emerging markets. Financ. Res. Lett. 2021, 39, 101542. [Google Scholar] [CrossRef]
  57. Gaganis, C.; Lozano-Vivas, A.; Papadimitri, P.; Pasiouras, F. Macroprudential Policies, Corporate Governance and Bank Risk: Cross-Country Evidence. J. Econ. Behav. Organ. 2020, 169, 126–142. [Google Scholar] [CrossRef]
  58. Bai, H.; Ba, S.; Huang, W.; Hu, W. Expected government support and bank risk-taking: Evidence from China. Financ. Res. Lett. 2020, 36, 101328. [Google Scholar] [CrossRef]
  59. Ely, R.A.; Tabak, B.M.; Teixeira, A.M. The Transmission Mechanisms of Macroprudential Policies on Bank Risk. Econ. Model. 2021, 94, 598–630. [Google Scholar] [CrossRef]
  60. Pathan, S.; Haq, M.; Faff, R.; Seymour, T. Institutional Investor Horizon and Bank Risk-Taking. J. Corp. Financ. 2021, 66, 101794. [Google Scholar] [CrossRef]
  61. Bui, T.D.; Bui, H.T.M. Threshold Effect of Economic Openness on Bank Risk-Taking: Evidence from Emerging Markets. Econ. Model. 2020, 91, 790–803. [Google Scholar] [CrossRef]
  62. Zhang, X.; Li, F.; Ortiz, J. Internal Risk Governance and External Capital Regulation Affecting Bank Risk-Taking and Performance: Evidence from PR China. Int. Rev. Econ. Financ. 2021, 74, 276–292. [Google Scholar] [CrossRef]
  63. Acosta-Smith, J.; Grill, M.; Lang, J.H. The Leverage Ratio, Risk-Taking and Bank Stability. J. Financ. Stab. 2020, 11, 100833. [Google Scholar] [CrossRef]
  64. Zheng, C.; Huang, S.; Qian, N. Analysis of the Co-movement between Local Government Debt Risk and Bank Risk in China. Singap. Econ. Rev. 2020, 3, 14–28. [Google Scholar] [CrossRef]
  65. Love, I.; Zicchino, L. Financial Development and Dynamic Investment Behavior: Evidence from Panel VAR. Q. Rev. Econ. Financ. 2006, 46, 190–210. [Google Scholar] [CrossRef]
  66. Qian, X.; Cao, T.; Li, W. Promotion Pressure, Officials’ Tenure and Lending Behavior of the City Commercial Banks. Econ. Res. J. 2011, 12, 72–85. Available online: https://d.wanfangdata.com.cn/periodical/jjyj201112006 (accessed on 28 July 2021).
  67. Galariotis, E.C.; Makrichoriti, P.; Spyrou, S. Sovereign CDS spread determinants and spill-over effects during financial crisis: A panel VAR approach. J. Financ. Stab. 2016, 26, 62–77. [Google Scholar] [CrossRef] [Green Version]
  68. Liaqat, Z. Does government debt crowd out capital formation? A dynamic approach using panel VAR. Econ. Lett. 2019, 178, 86–90. [Google Scholar] [CrossRef]
  69. Alessandrini, P.; Calcagnini, G.; Zazzaro, A. Asset restructuring strategies in bank acquisitions: Does distance between dealing partners matter? J. Bank. Financ. 2008, 32, 699–713. [Google Scholar] [CrossRef]
  70. Ke, X.; Yan, Y. Can proactive fiscal policy achieve the goal of “Beyond Keynesianism”? Evidence from China’s National Highway System. Rev. Dev. Econ. 2021, 25, 1078–1103. [Google Scholar] [CrossRef]
Figure 1. CCB industrial loans, CIB spread and economic fluctuation. Note: construction credit is the average proportion of loans from CCBs flowing into construction industry to gross loans, real estate credit is the average proportion of loans from CCBs flowing into real estate industry to gross loans. Spread = average yield of all CIBs in the year—the 10-year Treasury yield. Economic fluctuation is the mean GDP of 31 provinces processed by HP filter. In order to facilitate comparison, the construction credit, real estate credit and economic fluctuation are scaled at 1:3, 1:4 and 1:300 respectively. Data source: Bankscope, CSMAR, Wind.
Sustainability 13 09871 g001
Figure 2. Impulse-response analysis among spread, GDP and CCB risk-taking. (a) Response of NPL to spread; (b) Response of spread to NPL; (c) Response of NPL to GDP; (d) Response of GDP to NPL; (e) Response of RWAI to spread; (f) Response of spread to RWAI; (g) Response of RWAI to GDP; (h) Response of GDP to RWAI.
Sustainability 13 09871 g002
Figure 3. Impulse−response analysis between GDP and CIB spread. (a) Response of spread to GDP; (b) Response of GDP to spread.
Sustainability 13 09871 g003
Figure 4. Impulse−response analysis of CIB spread, GDP and consloan. (a) Response of consloan to spread; (b) Response of spread to consloan; (c) Response of consloan to GDP; (d) Response of GDP to consloan; (e) Response of spread to GDP; (f) Response of GDP to spread.
Sustainability 13 09871 g004aSustainability 13 09871 g004b
Figure 5. Impulse−response analysis of CIB spread, GDP and Z-score. (a) Response of Z to spread; (b) Response of spread to Z; (c) Response of Z to GDP; (d) Response of GDP to Z; (e) Response of spread to GDP; (f) Response of GDP to spread.
Sustainability 13 09871 g005
Figure 6. Impulse-response analysis between CIB spread and GDP. (a) Response of spread to GDP; (b) Response of GDP to spread.
Sustainability 13 09871 g006
Table 1. Variables definition.
Types of
Variables
Variable NamesSymbolVariables DefinitionData Source
DependentNonperforming loan ratioNPLNonperforming loan/total loanBankscope
Risk weighted asset intensityRWAIRisk-weighted assets/total assetsBankscope
IndependentCIB spreadspreadYield of CIBs−yield of treasuryWind
Local GDP growthGDPLocal GDP growth rateWind
ControlGrowth rate of local fiscal expenditurebuexGrowth rate of local fiscal expenditureWind
Local inflationinfLocal inflationWind
Local residential investmentestinvGrowth rate of local residential investmentWind
M1 growth ratem1M1 growth rateWind
Log of total assetslnassetLog of total assetsBankscope
Loan-to-deposit ratioLDRTotal loan/total depositBankscope
Provision coveragePCRLoan loss provision/nonperforming loanCSMAR
Return on total assetsROANet income/total assetsBankscope
Equity/total assetsEAEquity/total assetsBankscope
Deposit/total assetsdepassDeposit/total assetsBankscope
Deposit/liabilitydepliaDeposit/liabilityBankscope
Table 2. Descriptive statistics.
SymbolNMeanStdMinMax
NPL8981.32210.9903013.9700
RWAI4940.66250.09580.06550.9708
spread10202.21840.70980.62464.5780
GDP10200.10450.0661−0.22400.2713
buex10200.14320.0860−0.11790.5273
inf1020−0.00310.0253−0.09180.0553
estinv10202.63771.74690.05469.7579
m110200.13110.09380.00960.3203
lnasset88225.40781.043822.391028.5761
LDR6780.59290.11730.21101
PCR6003.73145.37371.000263.2121
ROA8710.00930.0039−0.00800.0247
EA8720.07140.02220.03110.3251
depass6490.73040.11780.39541
deplia6300.78640.12780.43891.0758
Table 3. OLS regression results.
(1)(2)
VARIABLESNPLRWAI
spread0.1026 ***0.0224 ***
(0.0384)(0.0084)
GDP−1.3051 **−0.2841 **
(0.5740)(0.1190)
buex0.1063−0.0427
(0.2537)(0.0341)
inf0.48170.9825 **
(0.9618)(0.4349)
ROA−57.3314 ***0.1712
(11.8147)(1.3585)
lnasset0.2978 ***0.0719 ***
(0.1090)(0.0261)
LDR1.5104 ***0.2073 ***
(0.3195)(0.0652)
depass39.5293 ***4.6615
(13.3870)(3.6362)
deplia−36.0178 ***−4.1311
(12.5035)(3.3987)
PCR−0.0194 ***−0.0010 ***
(0.0047)(0.0004)
EA33.4995 ***5.2201 *
(11.1272)(2.7449)
estinv0.0874 **0.0234 **
(0.0422)(0.0098)
m11.6679 ***
(0.2724)
Constant−10.1183 ***−1.9375 ***
(3.0948)(0.7274)
Adj. R-squared0.58300.3720
N549262
Robust standard errors in parentheses. *** p < 0.01, ** p < 0.05, * p < 0.1.
Table 4. Variance decomposition.
Impulse VariablesNPLSpreadGDPBuexInf
Variance decomposition of NPL
110000
20.9450.003680.03170.01960.000002
30.8950.004830.04430.05530.000215
40.8680.004790.05000.07660.000463
50.8550.004650.05280.08730.000579
60.8480.004610.05400.09250.000635
70.8450.004630.05460.09490.000660
80.8440.004660.05490.09590.000671
90.8430.004690.05500.09640.000675
100.8430.004710.05500.09660.000677
Variance decomposition of spread
10.0005480.999000
20.0004310.9820.01440.002010.00156
30.0004240.9690.01860.01010.00147
40.0004400.9630.02060.01470.00144
50.0004590.9600.02130.01690.00143
60.0004720.9590.02160.01790.00143
70.0004810.9580.02180.01830.00143
80.0004860.9580.02180.01840.00143
90.0004890.9580.02180.01850.00143
100.0004900.9580.02180.01850.00143
Variance decomposition of GDP
10.02000.05930.92100
20.03660.05810.6630.2420.000288
30.04230.06460.6150.2760.00257
40.04440.06770.6010.2850.00250
50.04540.06910.5950.2880.00255
60.04580.06970.5920.2900.00255
70.04600.07000.5910.2900.00256
80.04610.07010.5910.2900.00256
90.04610.07010.5910.2900.00256
100.04610.07010.5910.2900.00256
Variance decomposition of buex
10.04350.0004670.004420.9520
20.04950.007330.01450.9190.00976
30.05170.01050.02190.9060.00949
40.05280.01220.02350.9020.00956
50.05330.01290.02430.9000.00952
60.05350.01330.02460.8990.00951
70.05350.01340.02480.8990.00950
80.05360.01350.02480.8990.00950
90.05360.01350.02490.8990.00950
100.05360.01350.02490.8990.00950
Variance decomposition of inf
10.0001910.01700.01110.006020.966
20.0001650.01930.06060.04570.874
30.0006670.01880.05930.06010.861
40.0007310.01880.06020.06110.859
50.0007880.01890.06020.06160.859
60.0008070.01890.06020.06170.858
70.0008170.01890.06020.06180.858
80.0008210.01890.06020.06180.858
90.0008220.01890.06030.06180.858
100.0008230.01890.06030.06180.858
Table 5. Descriptive statistics.
Variable NameSymbolNMeanStdMinMax
Construction loan/gross loanconsloan6270.06460.02980.00610.2086
Table 6. Variance decomposition.
Impulse VariablesConsloanSpreadGDPBuexInf
Variance decomposition of consloan
110000
20.9840.01200.0005000.003190.000053
30.9800.01620.0004870.003520.000182
40.9780.01720.0006060.003820.000188
50.9780.01740.0006930.004000.000198
60.9780.01740.0007450.004080.000201
70.9770.01740.0007680.004120.000202
80.9770.01740.0007770.004140.000203
90.9770.01740.0007800.004140.000203
100.9770.01740.0007820.004140.000203
Variance decomposition of spread
10.0003381.000000
20.05260.9260.01790.003050.000352
30.07160.8900.02700.01140.000398
40.07510.8790.02990.01540.000565
50.07560.8760.03090.01700.000609
60.07560.8750.03120.01750.000629
70.07560.8750.03130.01770.000636
80.07560.8750.03130.01780.000638
90.07560.8750.03130.01780.000639
100.07560.8750.03130.01780.000639
Variance decomposition of GDP
10.003160.01570.98100
20.002860.03890.6950.2630.000219
30.002770.04480.6520.2940.00633
40.002690.04520.6410.3040.00647
50.002660.04540.6370.3080.00677
60.002650.04550.6350.3100.00684
70.002640.04550.6350.3100.00687
80.002640.04550.6340.3110.00688
90.002640.04550.6340.3110.00688
100.002640.04550.6340.3110.00688
Variance decomposition of buex
10.007940.04880.09760.8460
20.007610.05220.1170.8040.0195
30.008030.05070.1310.7920.0185
40.007920.05090.1340.7890.0190
50.007880.05080.1350.7880.0189
60.007870.05080.1350.7870.0189
70.007860.05080.1350.7870.0189
80.007860.05080.1350.7870.0189
90.007860.05080.1350.7870.0189
100.007860.05080.1350.7870.0189
Variance decomposition of inf
10.001540.007870.007290.006270.977
20.008730.01970.1250.08650.760
30.01080.02190.1220.1080.738
40.01080.02190.1250.1120.730
50.01080.02210.1260.1140.727
60.01080.02220.1260.1150.726
70.01080.02220.1260.1150.725
80.01080.02220.1260.1150.725
90.01080.02220.1260.1150.725
100.01080.02220.1260.1150.725
Table 7. OLS regression result of Z-score.
VARIABLESZ
spread0.0181 **
(0.008)
GDP−0.2659 **
(0.128)
buex−0.0925 **
(0.035)
inf0.4689 *
(0.243)
ROA15.7479 ***
(1.554)
lnasset−0.0019
(0.019)
LDR0.1346 **
(0.057)
depass5.9420 **
(2.415)
deplia−5.4245 **
(2.266)
PCR0.0005
(0.001)
EA13.5338 ***
(2.369)
estinv0.0093
(0.006)
Constant2.2277 ***
(0.508)
N548
R-squared0.8900
Robust standard errors in parentheses, *** p < 0.01, ** p < 0.05, * p < 0.1.
Table 8. PVAR result of spread and GDP.
(1)(2)
VariablesSpreadGDP
L. spread0.523 ***0.0176 ***
(0.0496)(0.00646)
L. GDP0.920 ***0.428 ***
(0.344)(0.0898)
Observations816816
Standard errors in parentheses, *** p < 0.01.
Publisher’s Note: MDPI stays neutral with regard to jurisdictional claims in published maps and institutional affiliations.

