Article

Optimum Detailed Standards to Control Non-Point Source Pollution Priority Management Areas: Centered on Highland Agriculture Watershed

National Institute of Environmental Research, Incheon 22689, Korea
*
Author to whom correspondence should be addressed.
Sustainability 2021, 13(17), 9842; https://doi.org/10.3390/su13179842
Submission received: 21 June 2021 / Revised: 17 August 2021 / Accepted: 18 August 2021 / Published: 2 September 2021

Abstract

:
The Ministry of Environment in Korea aims to reduce non-point source (NPS) pollution and improve soil water management by expanding NPS priority management areas. Six NPS priority management areas to reduce suspended solids (SS) according to soil loss were chosen as they either constitute serious hazards to the natural ecosystem due to NPS pollutants or they are areas with unusual geologic structure or strata. Although more comprehensive standards are required for effective NPS management, however, no detailed consideration factors and standards are available in the legal provisions. Therefore, in this study, based on the existing six priority NPS management areas and using results from previous studies, we present detailed legal designation standards. We found that the higher the altitude, slope, and field area ratio, the higher the effect of SS on water quality during rainfall. Additionally, there is a high correlation as R2 0.9813 between SS and the habitat and riparian index. These results are useful for establishing detailed standards for areas requiring an NPS management system, future expansion of the NPS priority management area designation, and policymaking and research for reducing NPS pollution in Korea.

1. Introduction

Recently, the deterioration of water quality in rivers and streams caused by non-point sources has become a major social problem [1]. Non-point source (NPS) pollutants are the pollutants flowing into the river from unspecified places within the watershed during rainfall, and there are several types of sources [2]. They can have significant adverse effects including eutrophication of rivers and aquatic ecosystems [3]. The Ministry of Environment in Korea introduces the NPS priority management areas designation system as part of a national policy for NPS reduction. As can be seen in Figure 1, a total of 16 watersheds were designated as NPS priority management areas as of 2020 [4]. The designation system for non-point pollution priority management areas consists of four stages. After designation, the plan was implemented by devising management measures suitable for the priority management areas to reduce NPS.
In the NPS priority management area designation system, (i) The Designation of NPS priority management area: It is designated according to Article 54 of the Water Environment Conservation Act (step 1), (ii) Management measures of NPS priority management area: the measures of management are established according to Article 55 (step 2), and (iii) Implementation plans for NPS priority management area: the implementation plan is established according to Article 56 (step 3) [5], (iv) Practice of Implementations plans of NPS management (step 4) so as to establish management periods, management targets, and an NPS reduction implementation plans annual evaluation. Thereafter, during the set management period, the progress on the project and management target are evaluated through annual evaluations [6]. The first step of the system, designation of the priority management area, is determined on whether the area meets the legal basis for requiring NPS management according to the NPS priority management areas designation standard from No. 1 to No. 6, Article 76 of enforcement decree on the NPS priority management area designation under Article 54 of the Water Environment Conservation Act [4].
The six areas, accounting for about 38% of the 16 designated NPS priority management areas, are in Gangwon Province (Doam Lake, three places in Soyang Lake, Golji Stream, and Daegi Stream) where the proportion of highland fields is high. These areas were designated as regions with unusual geologic features and strata (Sub-para. 5: an area deemed to require special management due to its unique geological or stratigraphic structure) and those affecting water quality and health of aquatic ecosystems (Sub-para. 2: an area where non-point pollutants cause or are expected to cause significant harm to the natural ecosystem) due to the continuous generation of NPS from sediment overflow during rainfall.
In particular, a large volume of turbid water is generated from these watersheds with large amounts of barren or cultivated land which is highland agricultural due to heavy rainfall in the East Asian summer monsoon season. The representative highland crops are soybeans, radishes, cabbages, potatoes, and carrots and begin to seed from March and harvest from July to October. However, the highland agricultural areas need allochthonous soil addition for artificial topsoil layer formation every year by the high soil loss due to intensive rainfalls during East Asian summer Monsoon season of June to September [7]. At this time, when soil water is introduced, sediment is deposited between the pores of the diatoms of the riverbed, and the habitats of aquatic ecosystems such as benthic macroinvertebrate and fish are damaged [8,9], and thus sediment outflow is a direct cause of hazards in water bodies.
The number of NPS priority management areas is expected to reach 20 by 2025 [9]. This is because livestock-based (Biochemical Oxygen Demand (BOD5) 43.3%, Total Phosphorus (T-P) 43.7%) and land-based (BOD5) 48.7%, T-P 52.5%) pollution loads account for more than 90% of NPS pollution load (kg/day) by source [9]. NPS pollutants discharged from the agricultural sector need to be intensively managed, and the drainage zone for soil water management in highland fields is planned to expand from 37.9 km2 in 2020 to 47.2 km2 in 2025 [10].
In line with these plans for expansion, objective detailed standards need to be established for selecting the NPS priority management areas, in particular, the six NPS priority management areas to be designated for soil water reduction. They are currently designated by the designation standards Sub-para. 2 and Sub-para. 5. as Table 1.
Therefore, the objectives of this study include investigating (1) the topographical characteristics of pollutants (SS) of NPS and (2) The correlation between water quality and aquatic ecosystem suggesting detailed legal standards for Non-point Pollution Control Areas Sub-para. 2 and Sub-para. 5.

2. Materials and Methods
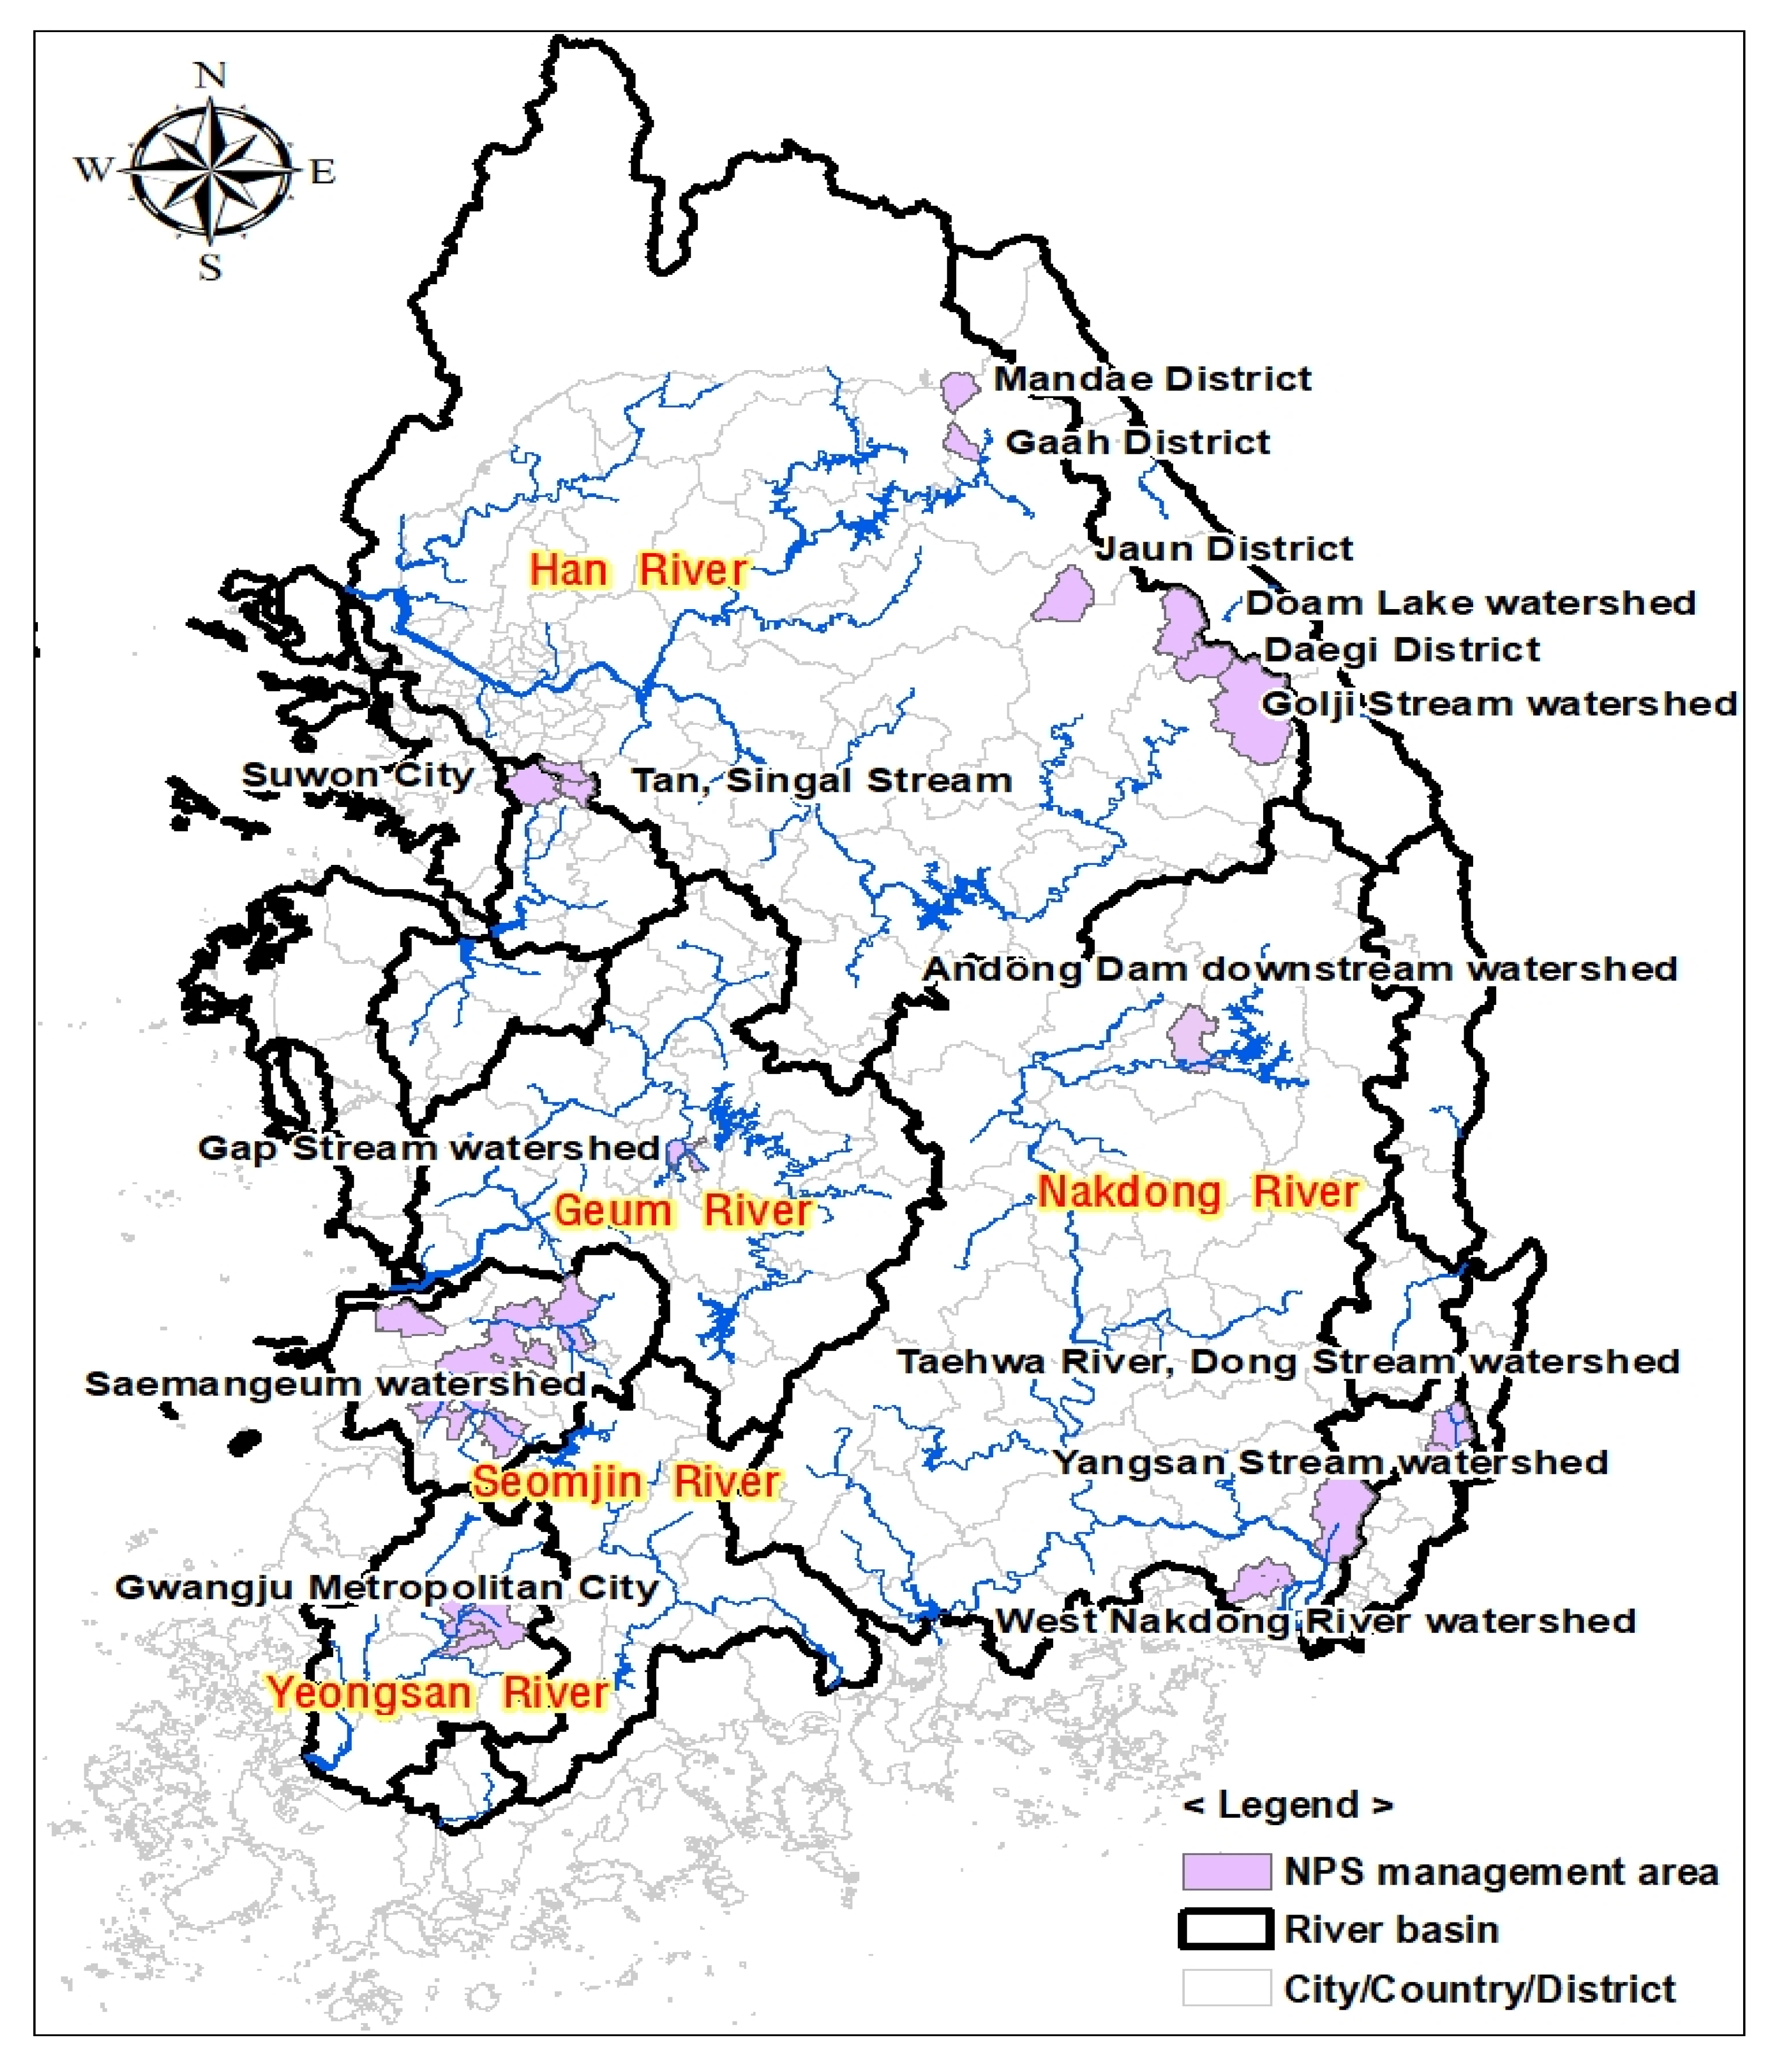
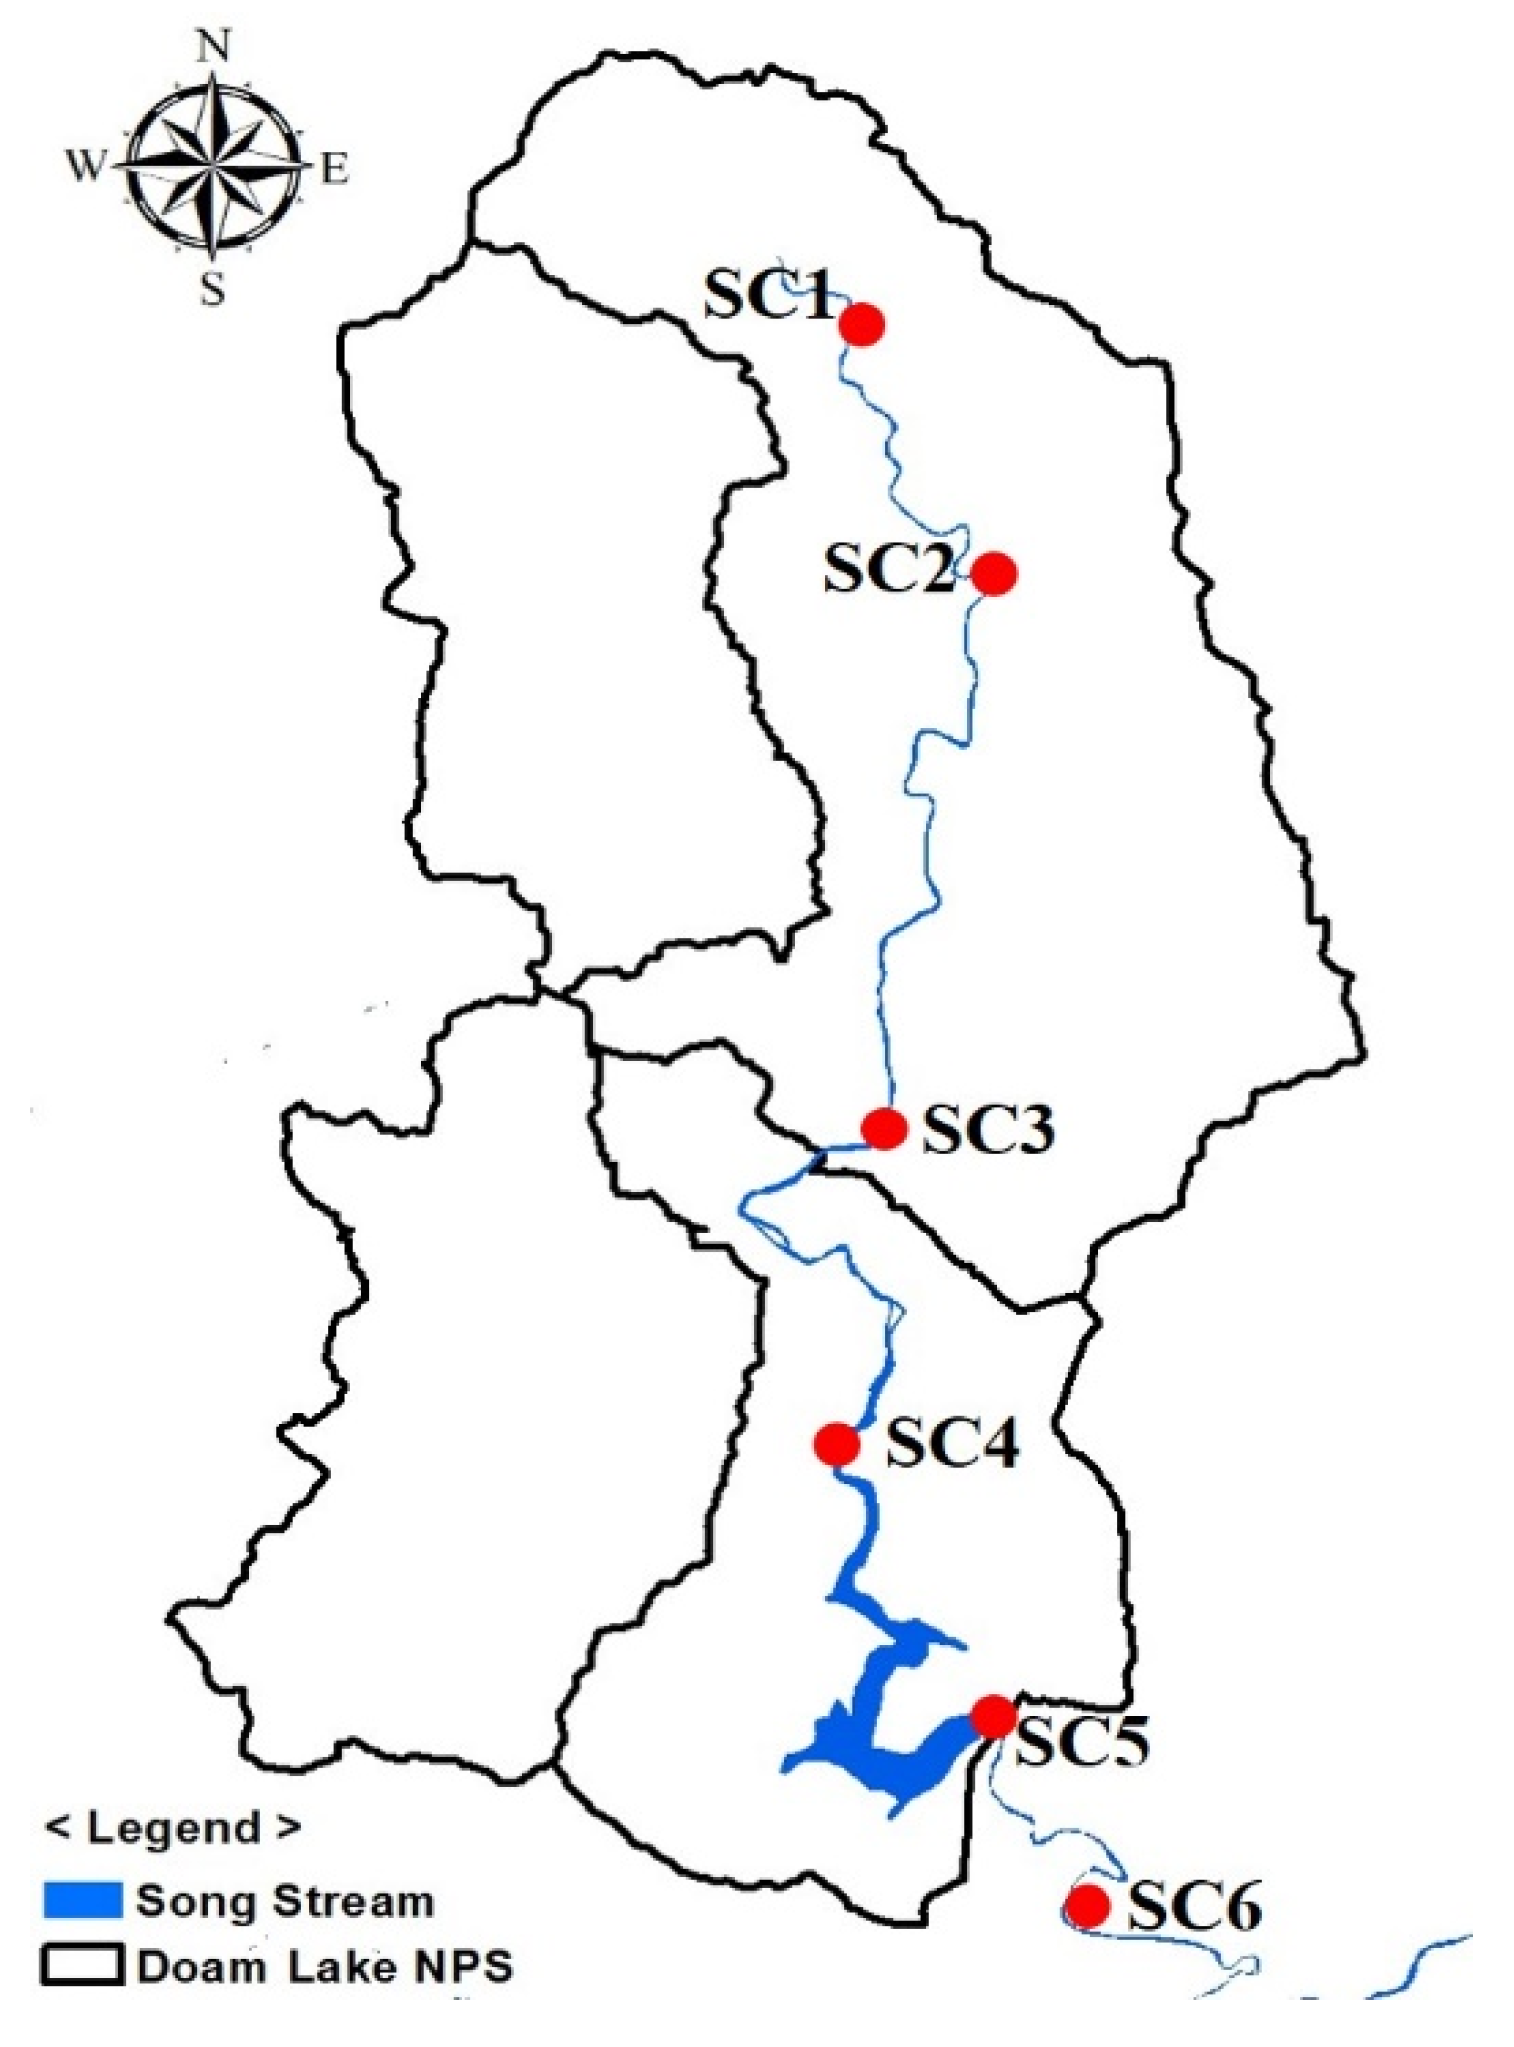
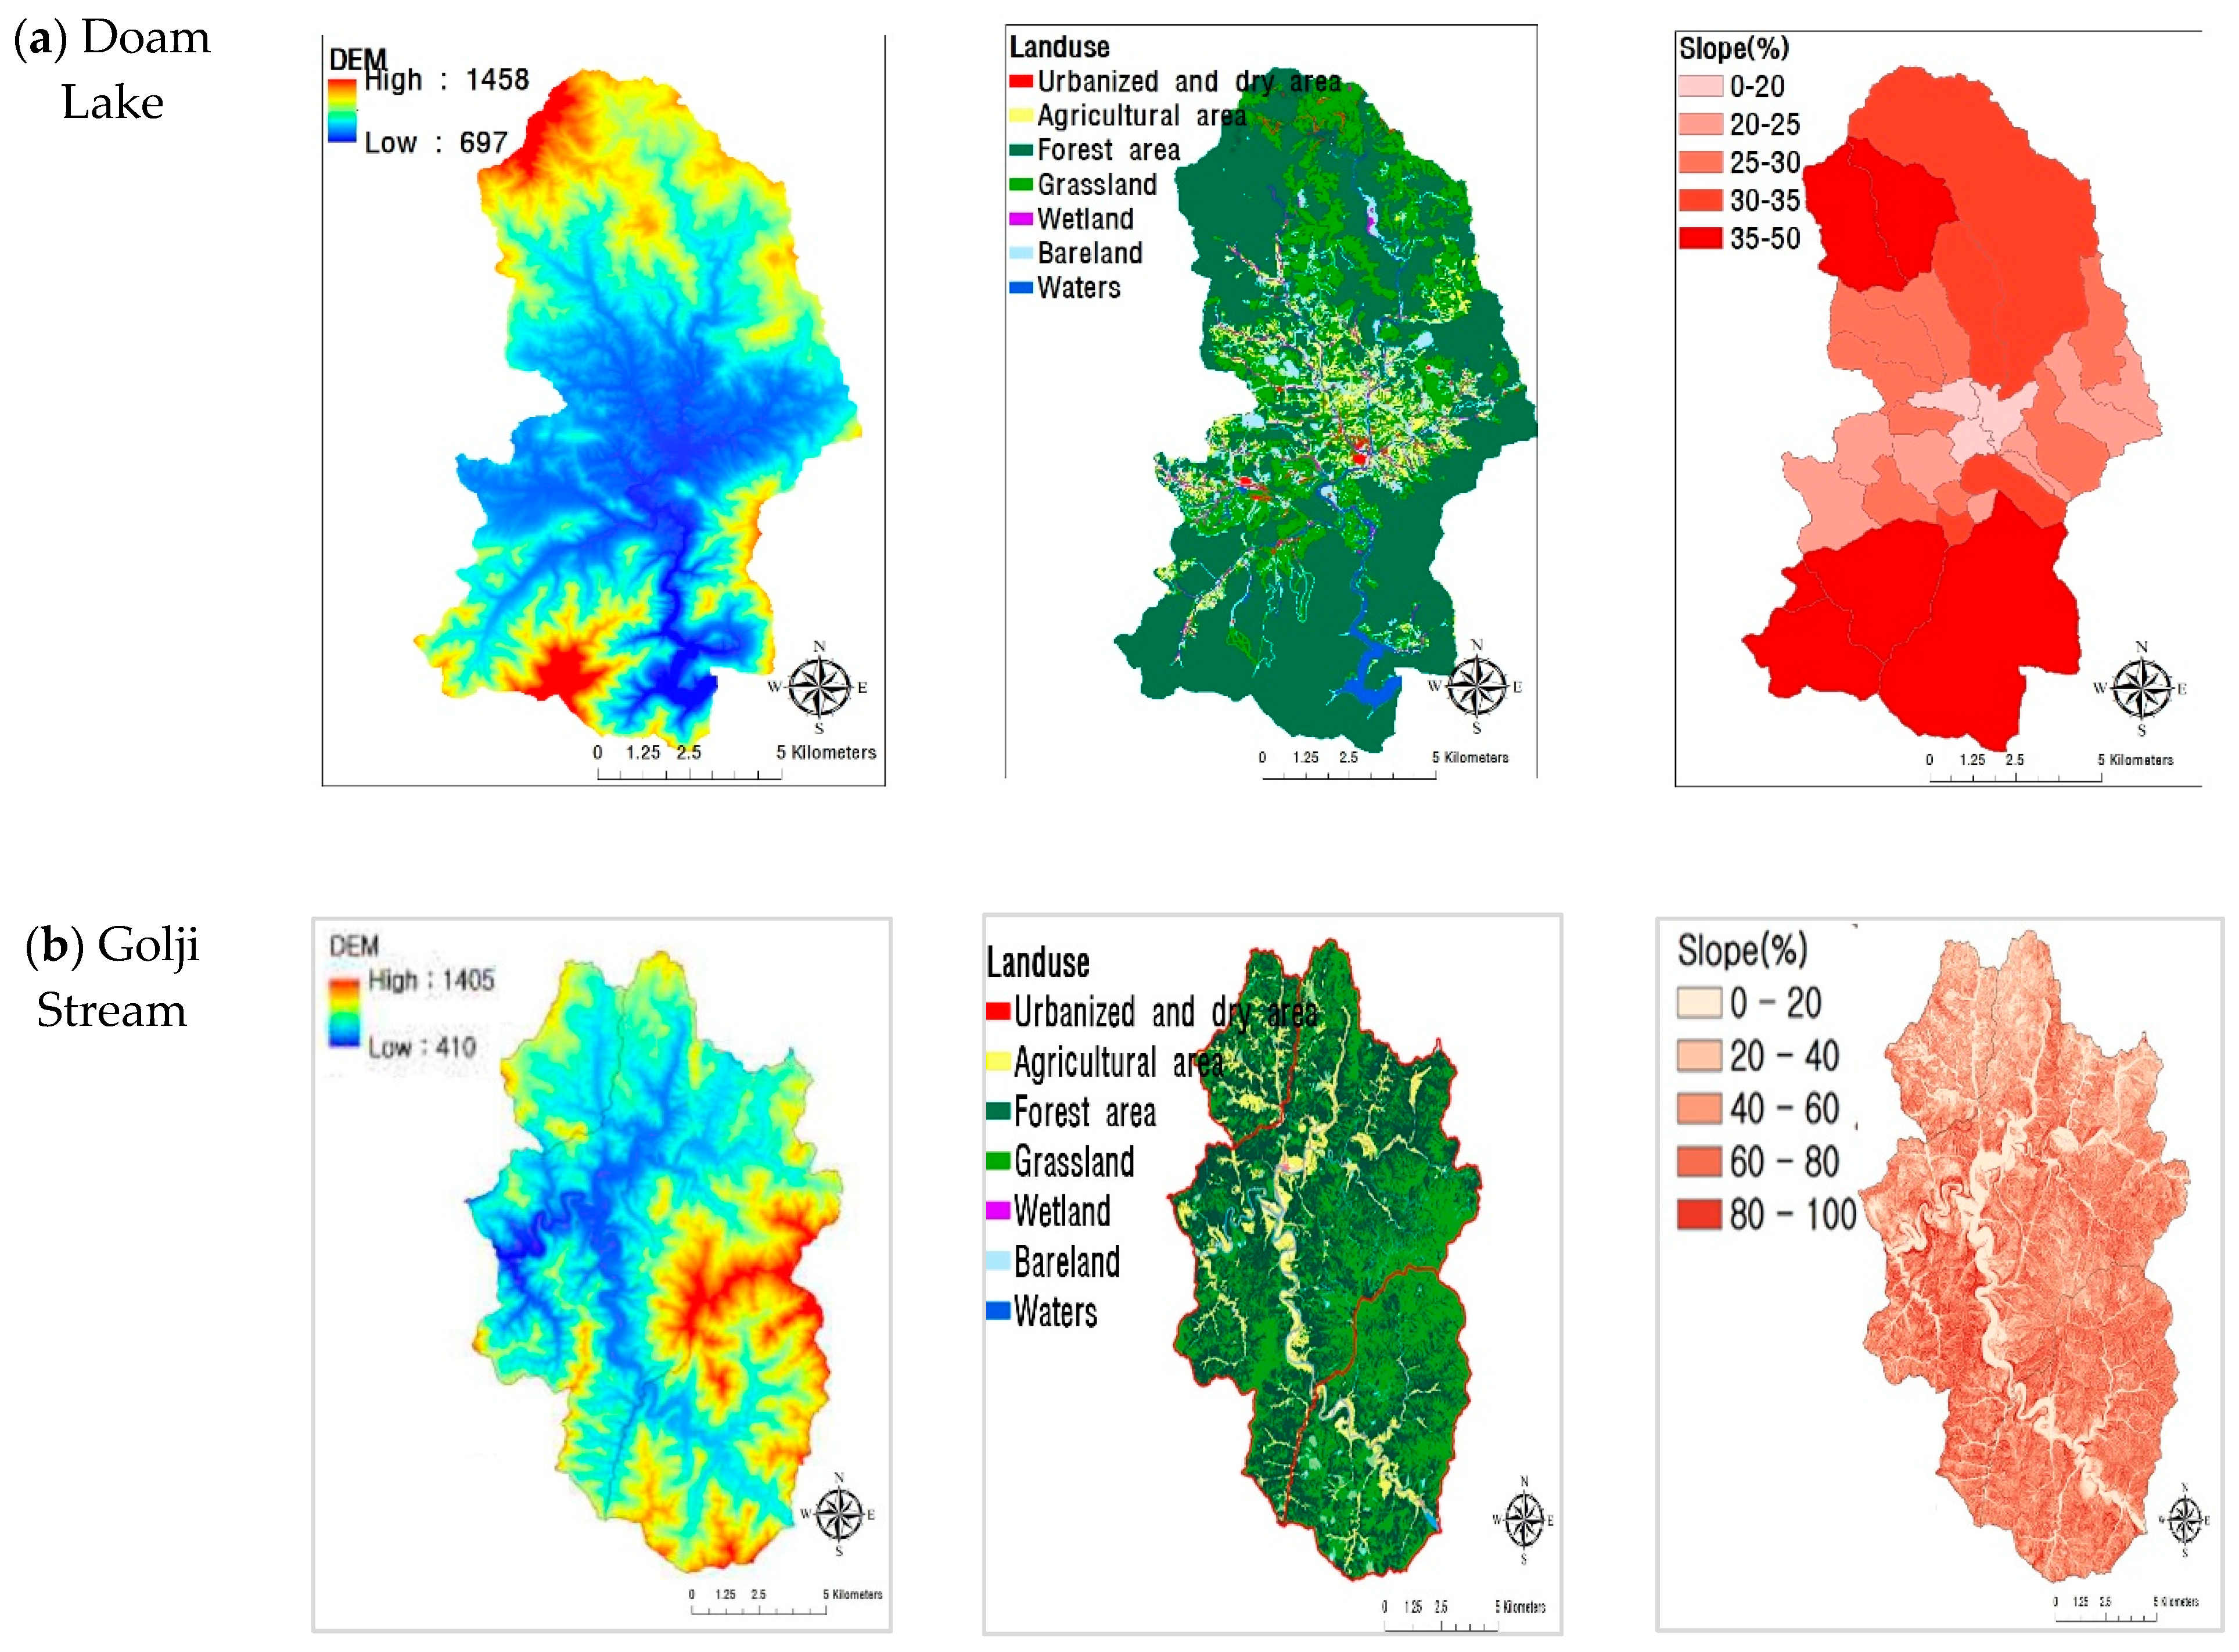
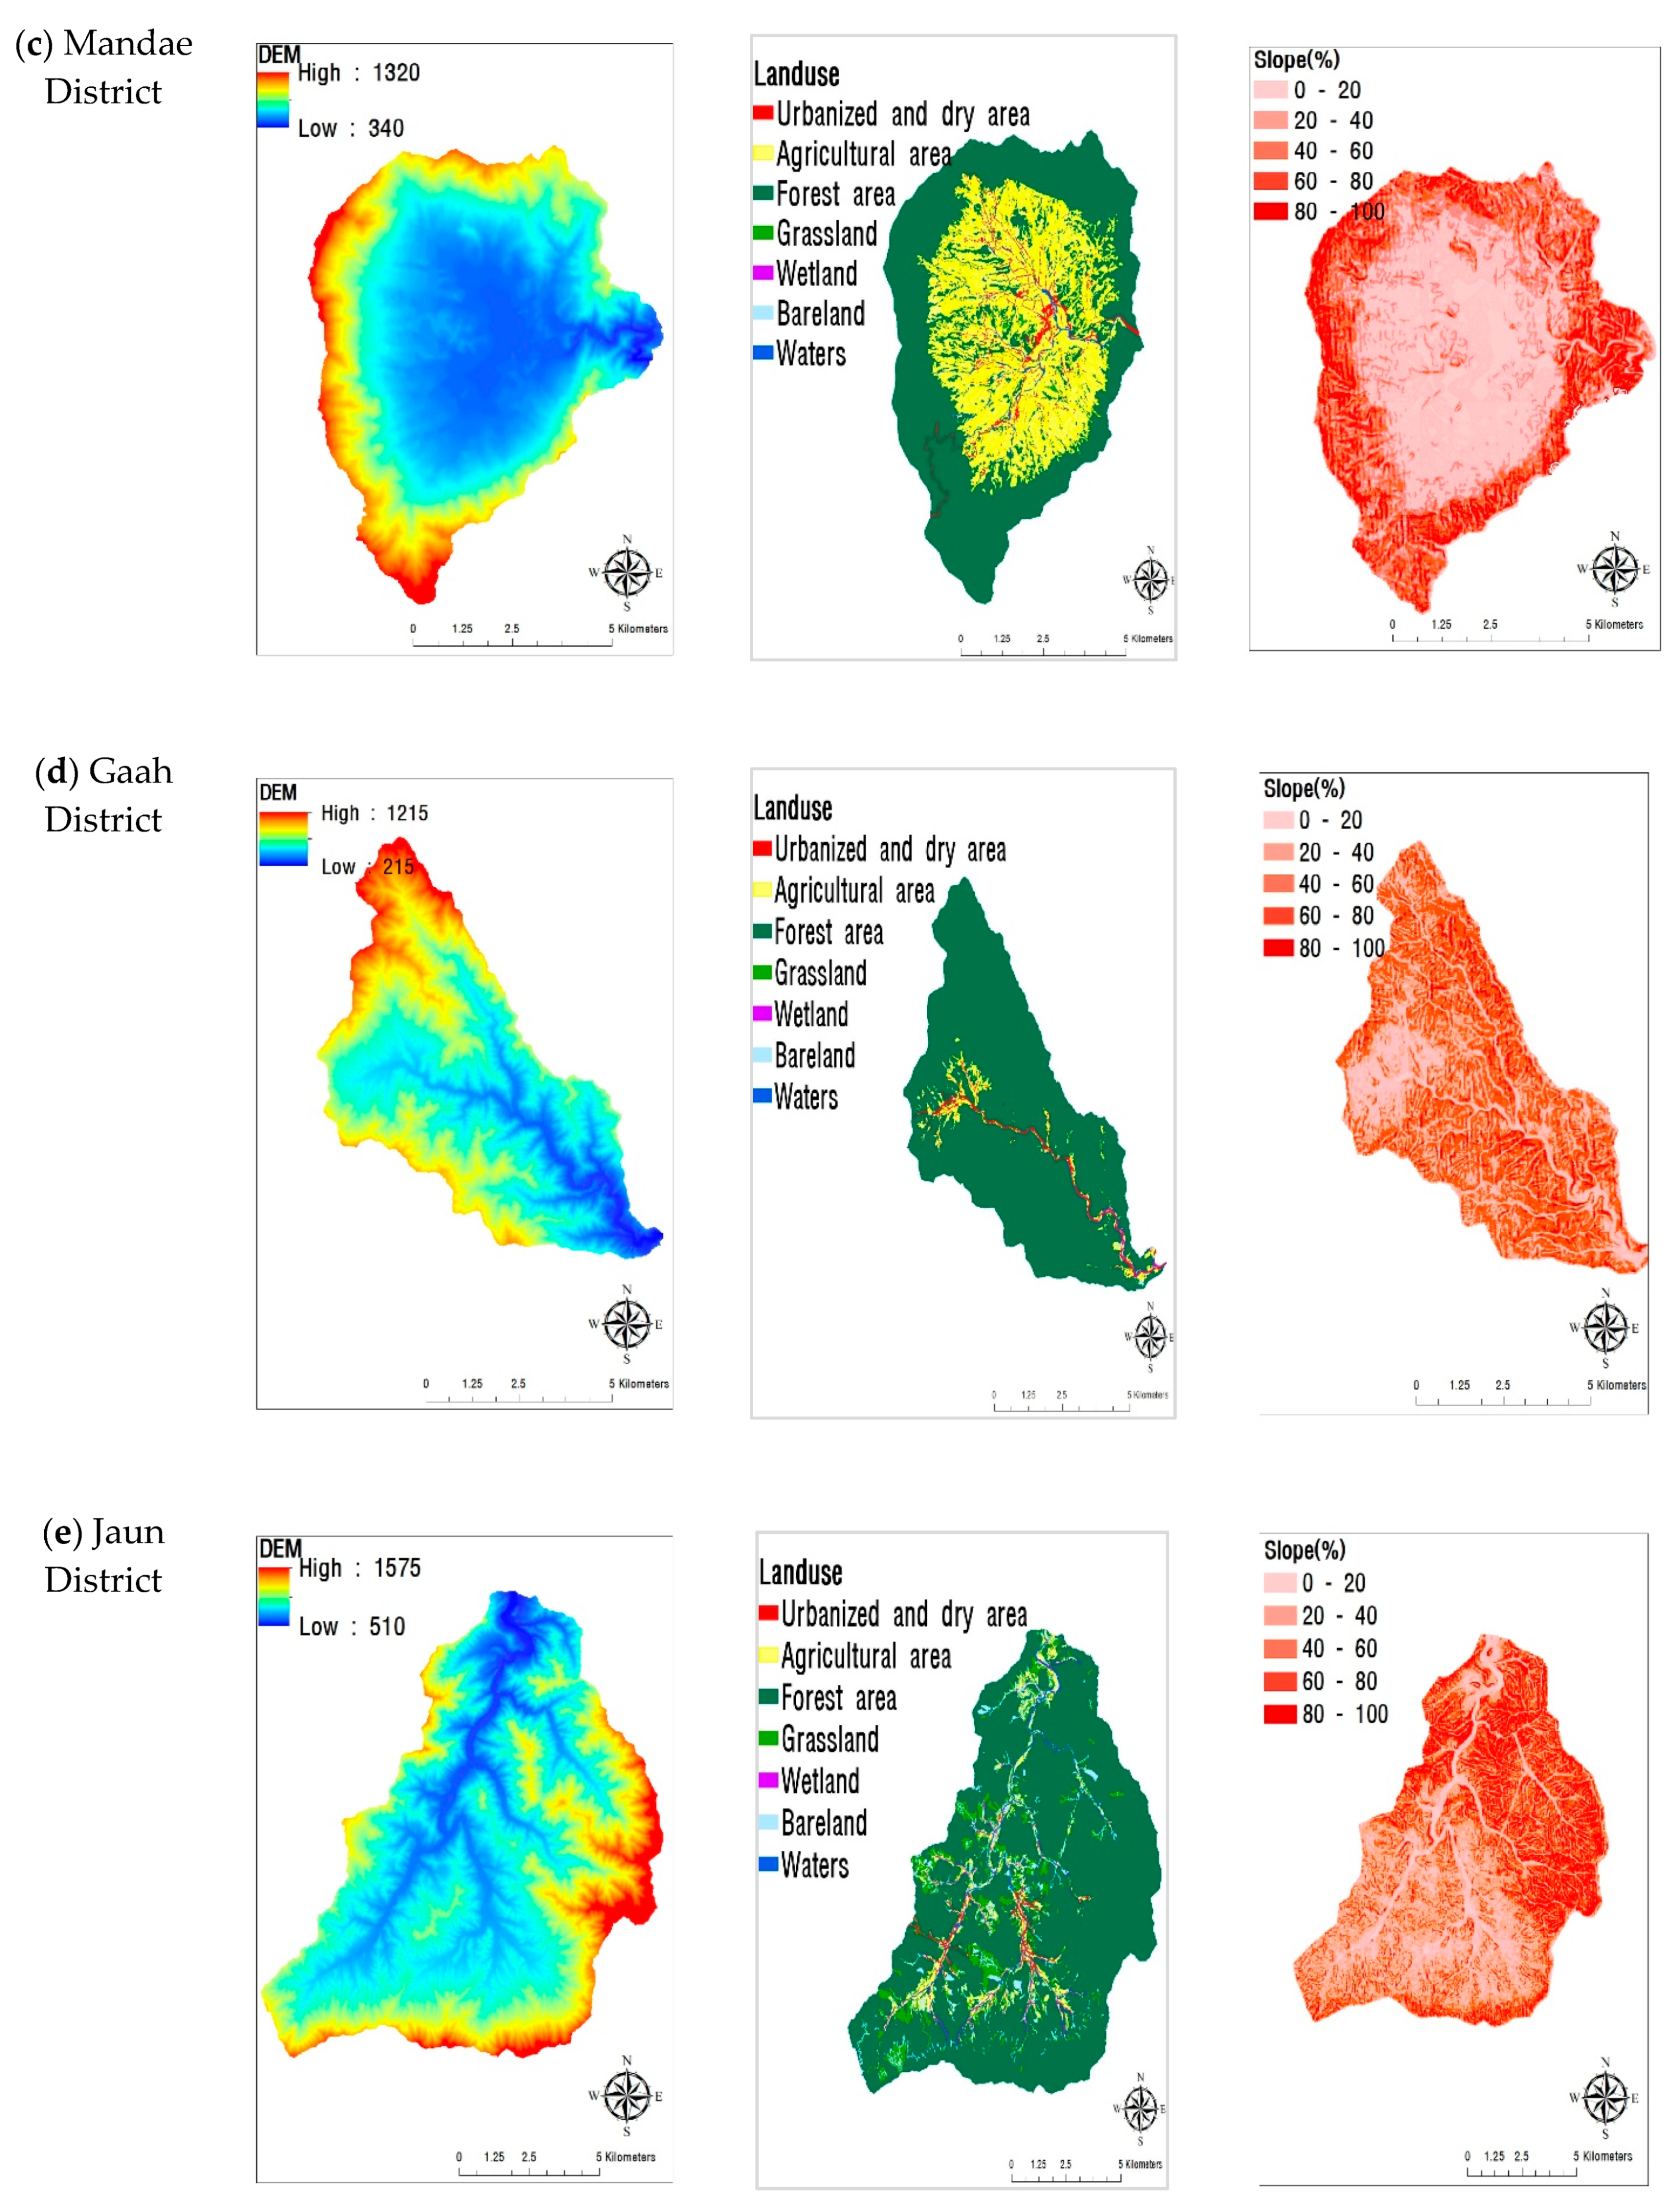
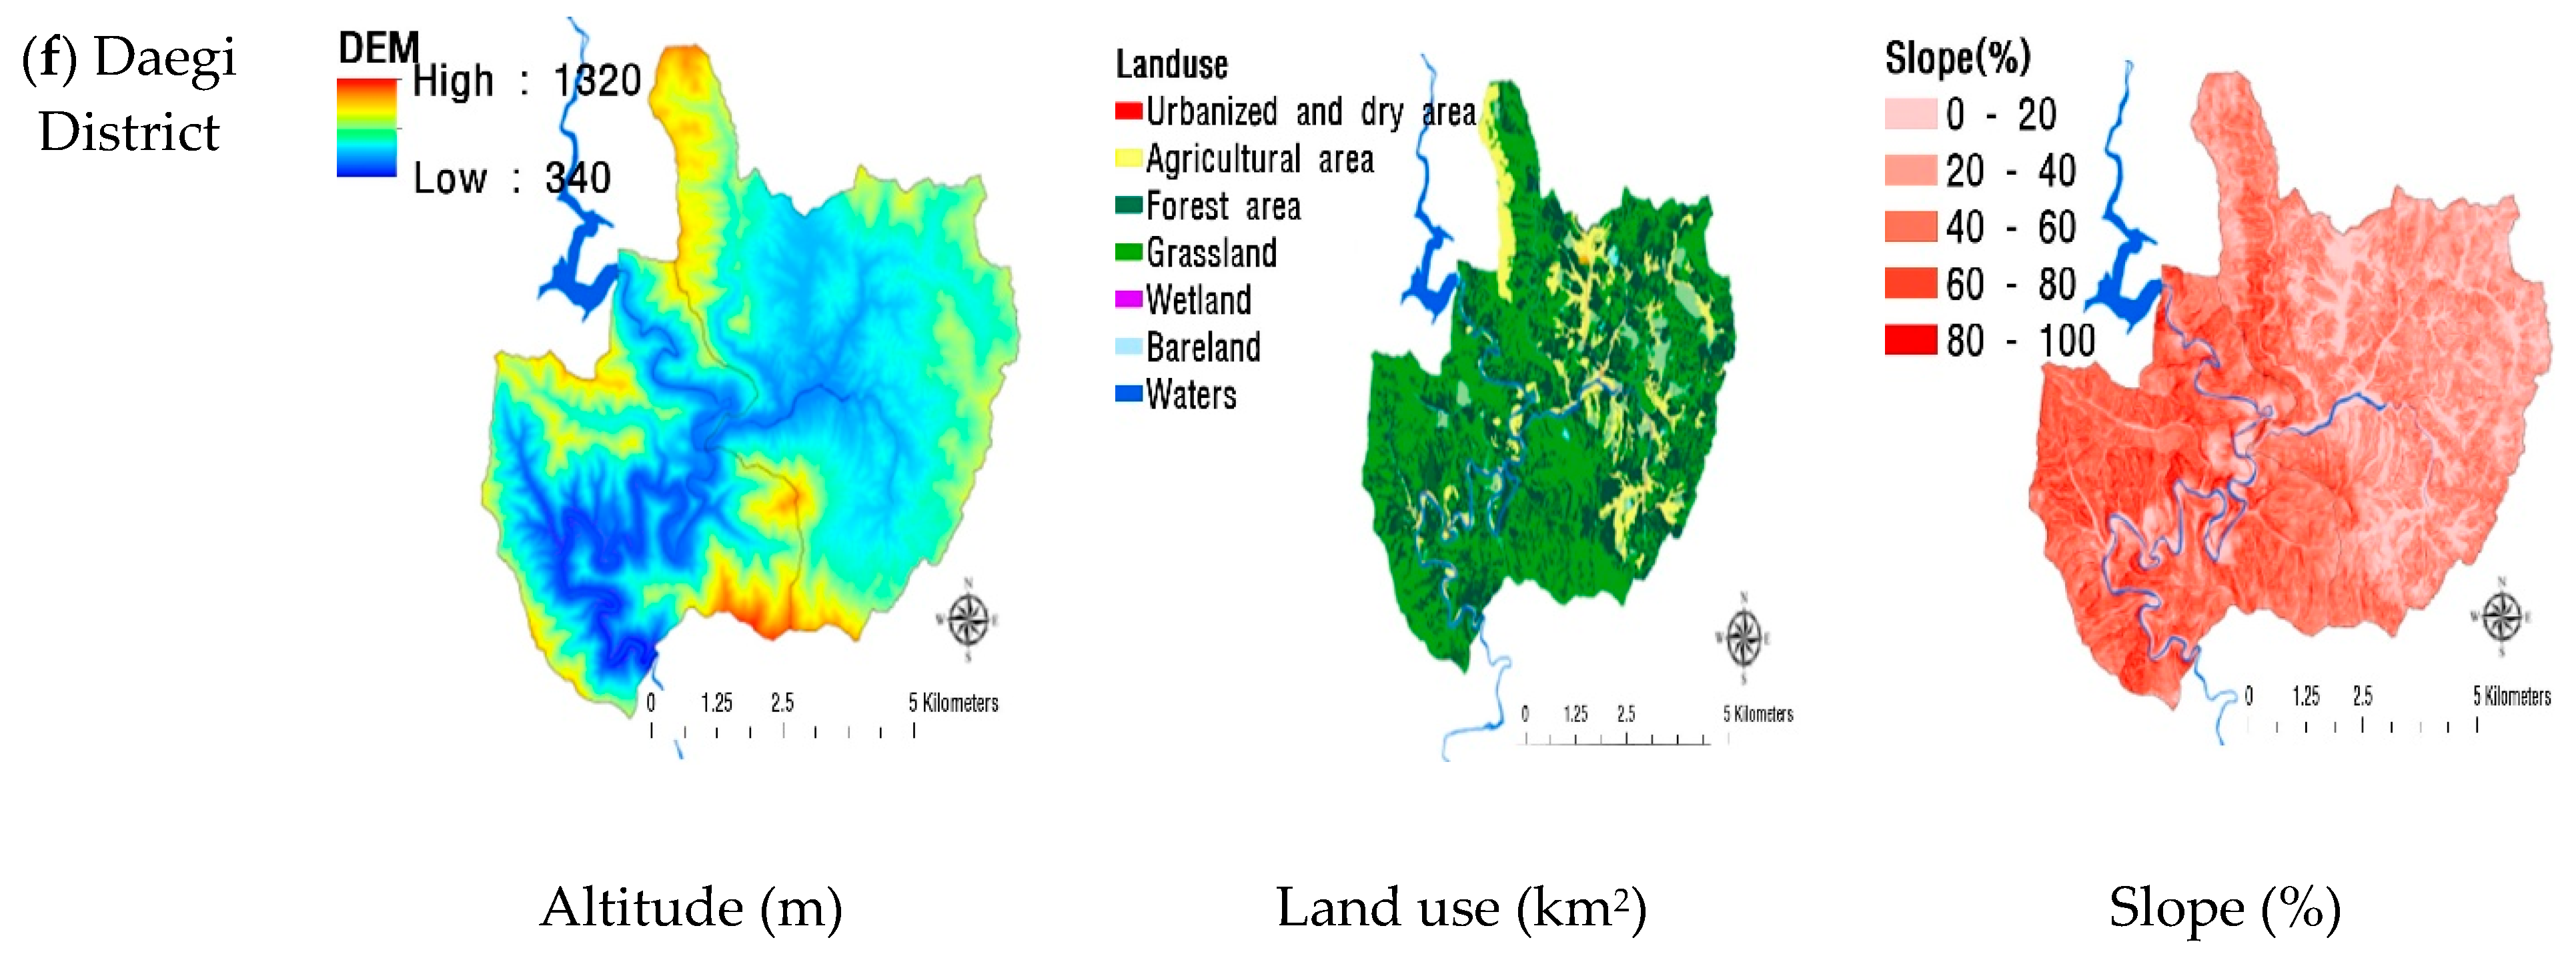
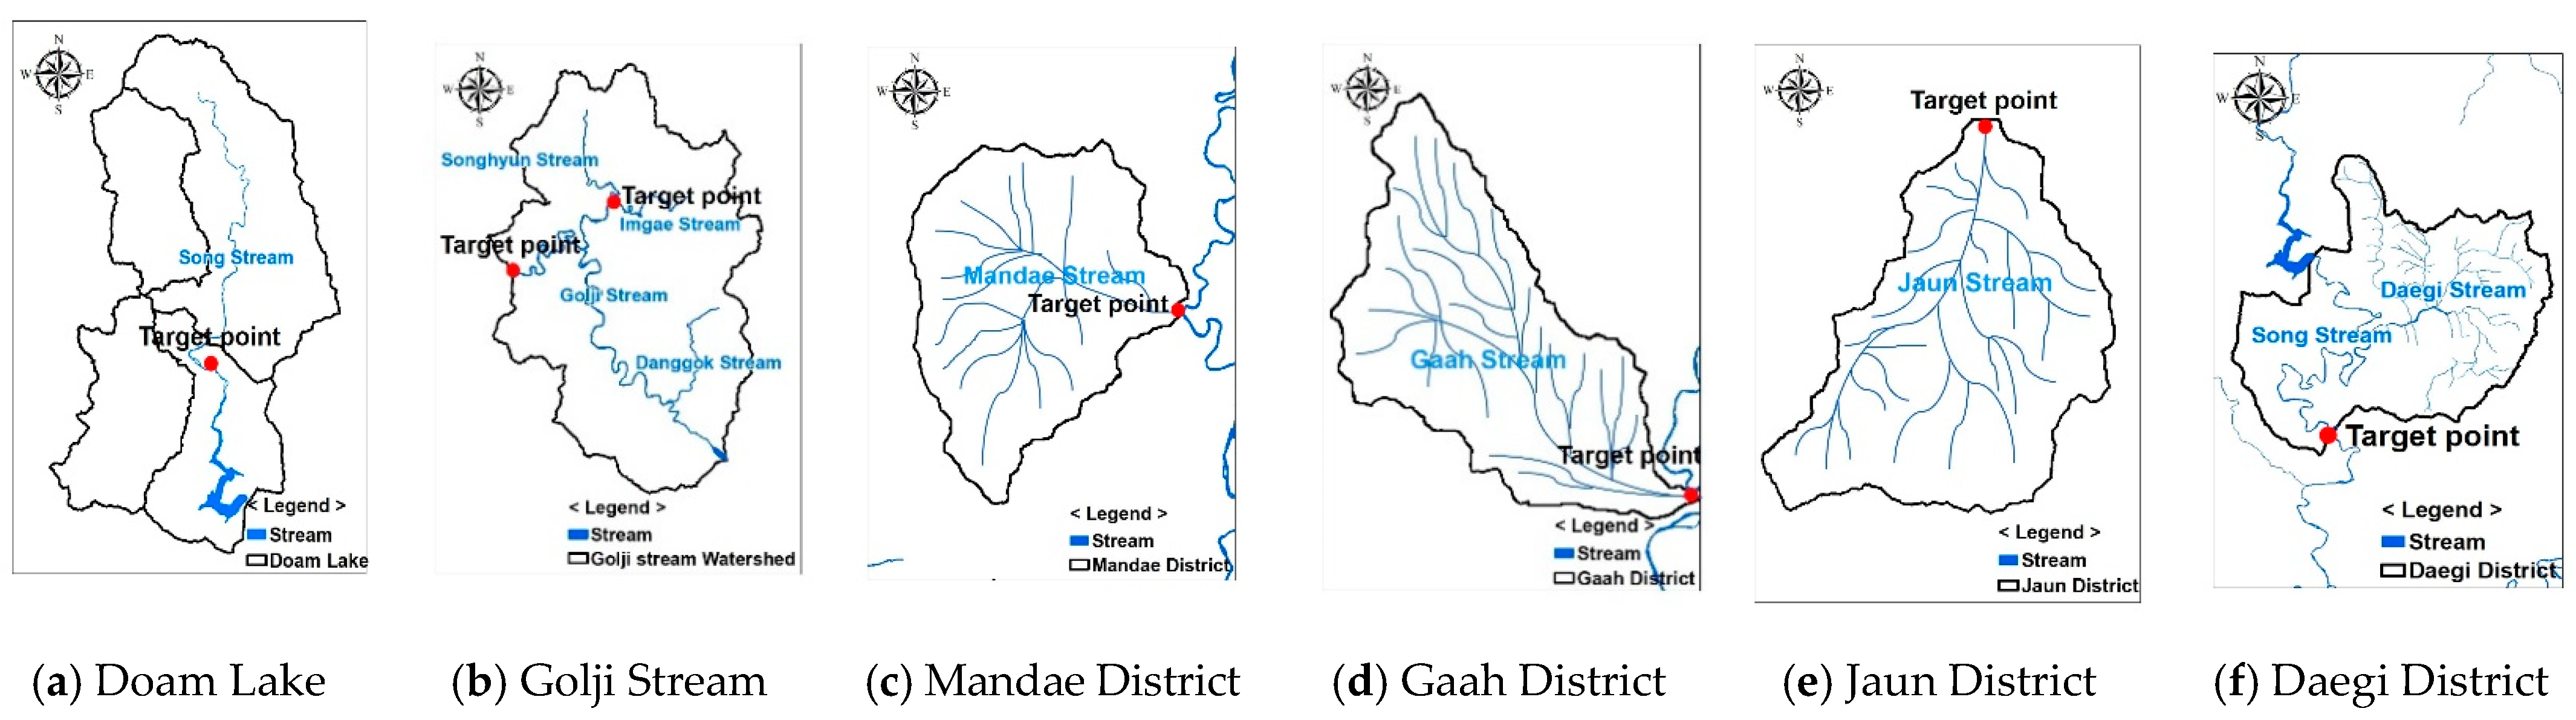
2.1. Study Area

The study areas are six designated areas that meet the standards of Sub-para. 2 and Sub-para. 5 for the NPS priority management areas as Figure 1. In the order of date of designation, the areas are Doam Lake (2007), Golji Stream (2013), Mandae District (2018), Gaah and Jaun District (2018), Daegi District (2018). The main management target of these areas is SS (mg/L), and structural and non-structural management measures are implemented for the purpose of improving NPS management through soil water reduction.

2.2. Necessity for Improvement of Designation Standards (Sub-Para. 2 and Sub-Para. 5)

As shown in Figure 2a, various plans and methods have been implemented to reduce NPS, but non-point discharge load (%) increased with a decrease in point source discharge load, which indicates that improvement is required for NPS pollution management [11]. As shown in Figure 2b, it can be seen that the ratio of non-point source discharge among the total discharge load is higher in livestock and land systems than in living, industry, and landfill systems [12].
In order to reduce non-point pollution sources, it is necessary to manage non-point pollution sources generated in the land system as shown in Figure 2b. Sediment pollutants account for a large part of stormwater runoff and various pollutants, including nutrients, metals, hydrocarbons, etc., are adsorbed. TP, SS, and turbidity increased with increasing discharge and steadily decreased after rainfall cessation [13]. Generally, P losses from agricultural land are related to soil erosion [14,15]. The hydrologic export of P is influenced by meteorological factors including rainfall amount, rainfall intensity, and the number of antecedent dry days [8]. There is a net accumulation of P in the system even though nutrient loss and soil erosion occur during the summer monsoon season in areas with intensive agriculture [16]. When they flow into rivers and lakes during rainfall, it causes water pollution and harms the health of the aquatic ecosystem due to a fatal effect on photosynthesis, respiration, growth, and reproduction of aquatic organisms. Organic pollutants are discharged from a wide range of places, such as dry fields, rice paddies, and forests. In Gangwon Province, which has a large number of farming activities, pollutants related to pesticides should also be considered. A literature review of research in South Korea shows that, as shown in Figure 3, Gangwon Province had the second-highest occurrence of water quality contamination incidents after Gyeonggi Province. Gangwon Province has experienced many NPS incidents related to water quality and damage to aquatic ecosystems (e.g., fish kills) [17].
Among the designated NPS priority management areas as Figure 1, six met the standards of Sub-para. 2, as areas with NPS-originated ecosystem hazards, and Sub-para. 5, as areas of unusual geologic and strata structure, were selected as NPS priority management areas for sediment reduction. This is because these areas were judged to require NPS management as areas with NPS-originated ecosystem hazards due to the effects of sediment.
However, Sub-para. 1 (exceeding the water quality environment standard, above 50% of contribution rate of the non-point delivery loads) and Sub-para. 3 (population 1 million or more) have the objective criteria of designation of NPS priority management area [4]. There are no objective criteria for concerns of NPS, only evaluation items in Sup-para. 2 and 5 [18]. In particular, in the case of Sun-para. 2., the impact of NPS is evaluated as the health of the aquatic ecosystem, but there is no standard for correlation between water quality and the aquatic ecosystem. Furthermore, there is an administrative difficulty that causes NPS management designation to take four years to finalize the approval rather than two years based on the law [18].
Therefore, it is necessary to arrange objective standards for effective NPS priority management area designation.

2.3. Survey Method

All six of the designated areas are located in Gangwon Province, and these areas were selected due to their unusual geologic structures and environmental hazards from the discharge of turbid water due to problems in the watershed land use. Based on the characteristics of the pre-designated area and the results of the study, the discharge of NPS pollutants (pollutants generating turbid water) is thought to be directly related to the risk as disturbance of the natural ecosystem and therefore, by analyzing the characteristics of the six NPS priority management areas, items necessary for detailed standards for designation under standard Nos. 2 and 5 were analyzed. In particular, using previous research data [19] on the Song Stream watershed, the correlation between water quality and aquatic ecosystem was analyzed.
Designation standard No. 2 addresses the risk to natural ecosystems. In order to establish standards for water quality and aquatic ecosystem considering the features of highland fields with a high risk of soil water runoff during rainfall, as well as impacts on the aquatic ecosystem from turbid water, Doam Lake watershed was selected for the study. Then, the items of aquatic ecosystems with the highest correlation with water quality impact from sediment were identified through correlation analysis to develop the detailed standards. The aquatic ecosystem grade was determined based on the river health evaluation standard [20].
As shown in Figure 4, points for the survey of river flow rate, water quality, and aquatic ecosystem in Doam Lake NPS priority management area. There are a total of 6 survey points (SC1-SC6) ranging from the uppermost stream to the point after discharge into Doam Lake, the analysis items are turbidity (NTU), SS (mg/L), BOD (mg/L), and TP (mg/L), and the data on flow rate and water quality were monthly from May to December 2016–2018 [15].
The aquatic ecosystem survey was conducted before and after rainfall in order to identify changes in the ecosystem due to rainfall and was conducted 8 times in total. The items for analysis were trophic diatom index (TDI), benthic macroinvertebrate index (BMI), fish assessment index (FAI), and habitat and riparian index (HRI) [21]. Aquatic ecosystem health was evaluated based on the standards specified in River Living Environmental Water Quality Standards and Aquatic Ecosystem Health Standards under Framework Act on Environmental Policy, as shown in Table 2.
Sub-para. 5 of the designation standards refers to an area that is recognized in terms of needing special management due to its unusual geologic or strata structure of the area. Therefore, the land use, slope, altitude, and event mean concentration (mg/L) of the water quality at major points during rainfall were classified and analyzed using the regional average values for the six designated areas as of 2020.

3. Results and Discussion

3.1. Preparation of Detailed Standards for Designation (Sub-Para. 2)

According to sub-para2 of the Water Environment Conservation Act, the NPS priority management area refers to areas that cause serious hazards to the natural ecosystem or are expected to create NPS pollutants. Through analyzing the characteristics of the six regions, a risk of a hazard in the aquatic ecosystem due to soil water from rainfall-runoff was expected, and thus these areas were selected based on Sub-para. 2. Accordingly, detailed standards for Sub-para. 2 should be categorized according to the biological grade of aquatic organisms and river environment, environmental condition indices, and natural ecosystem incidents and cases.

3.1.1. Domestic and International Cases

According to a previous study [22] on the influence of turbid water on the aquatic ecosystem in the upstream watershed of the Han River, in the Daegi Stream, which is the turbid water stream, the benthic macroinvertebrate index was around 1/2 of the control stream due to the effect of turbid water. It has been reported that the habitation status was poor in the NPS priority management areas due to a decrease in pores in the stream bed [4,23,24,25]. In the Doam Lake watershed, through analyzing the distribution of trophic diatoms, benthic macroinvertebrates, and fish in the upstream region, it was found that TDI values for trophic diatoms lowered from upstream to downstream, and the number of species and abundance were low for benthic macroinvertebrates downstream affected by turbid water [26].
A study in Japan found a negative correlation between the difference in turbidity and the biomass of benthic macroinvertebrates. The macroinvertebrates showed avoidance behavior, moving from turbid water to clean water regions [27].
A previous study reported a positive correlation between water quality during rainfall and the biological index; finding that when the water quality during rainfall was poor, the biological index was low [23]. In South Korea, a large volume of turbid water is generated by heavy rainfall in the East Asian summer monsoon season, having a significant impact on the structure of aquatic ecosystems, as well as the source of water pollution, but few studies have evaluated aquatic ecosystem health in regions vulnerable to turbid water risk.

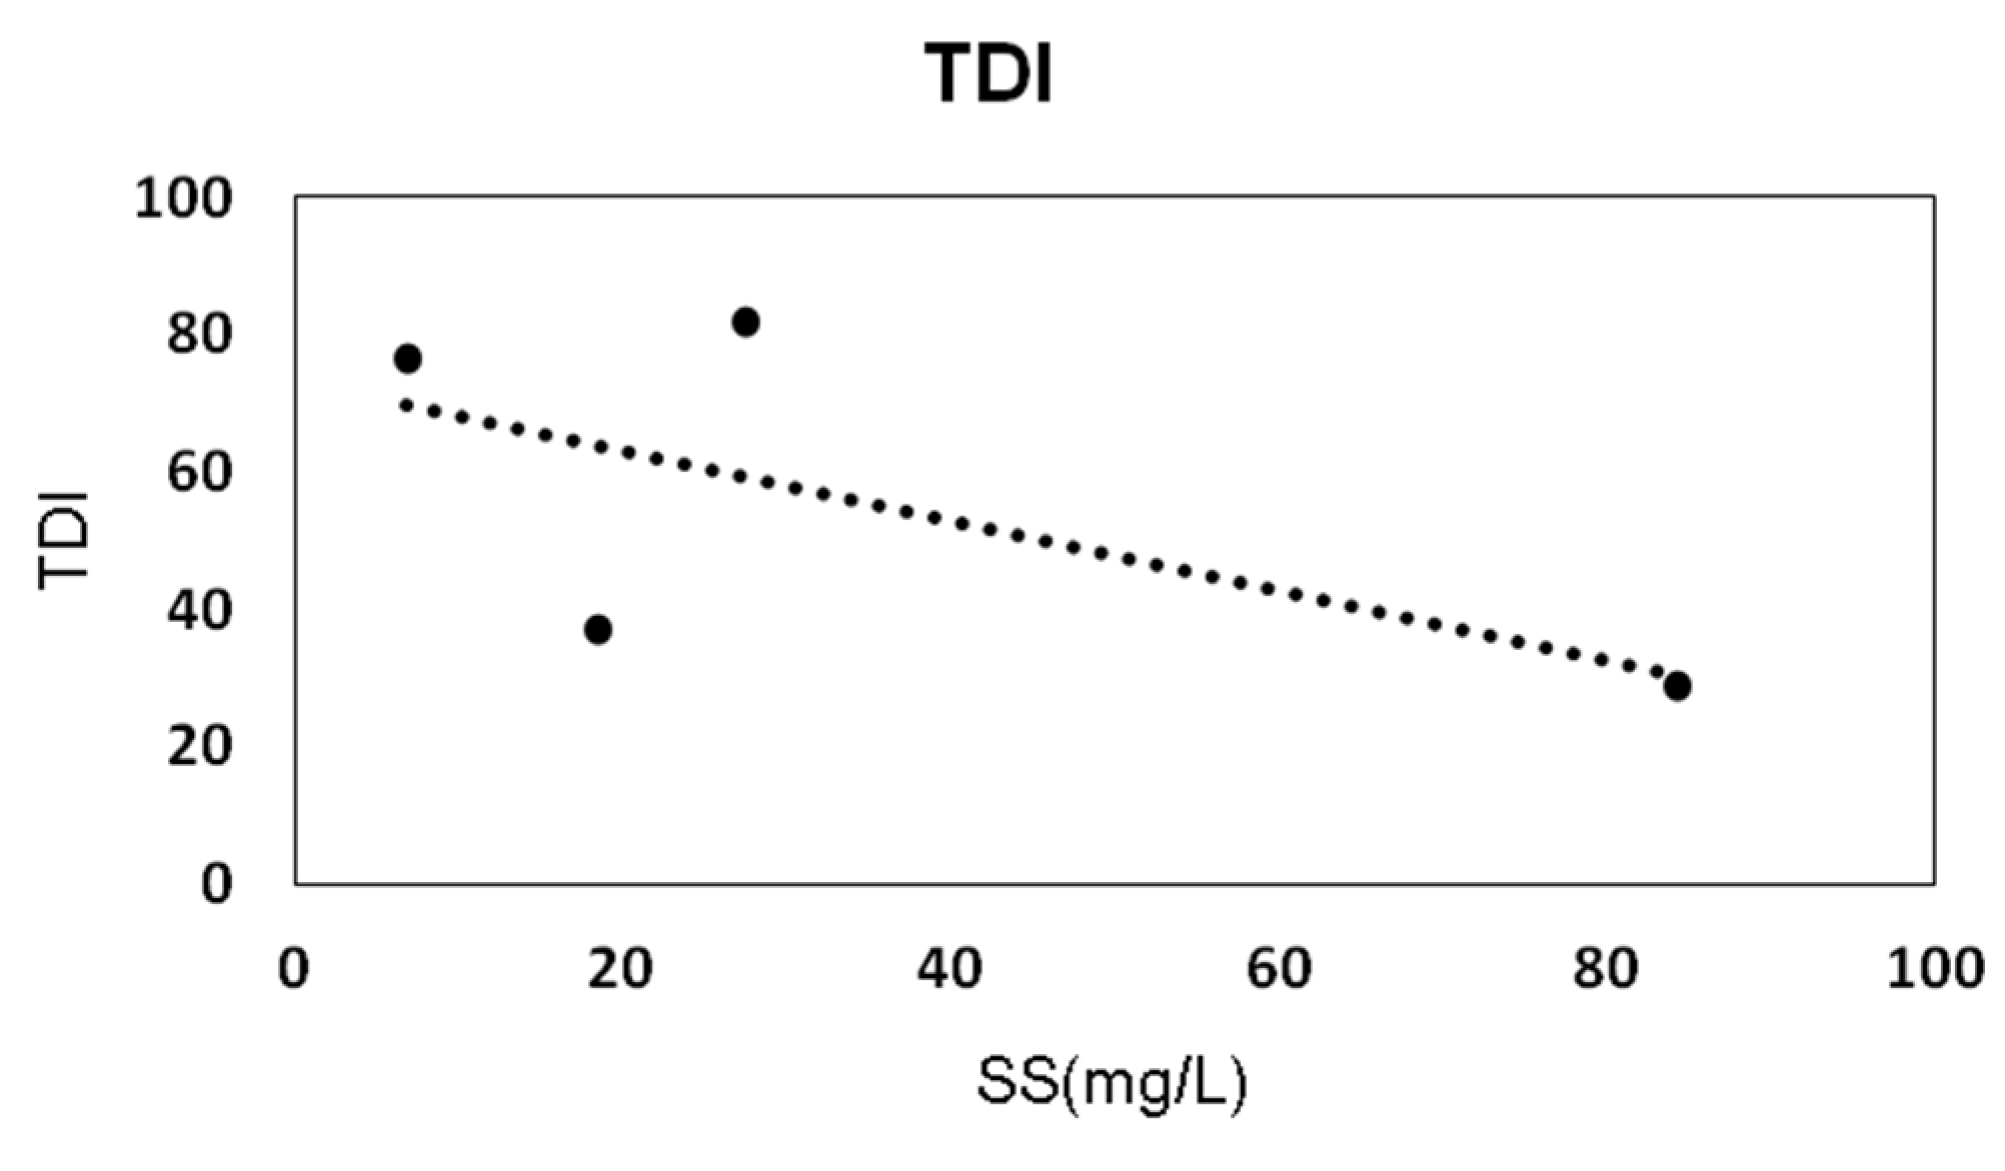
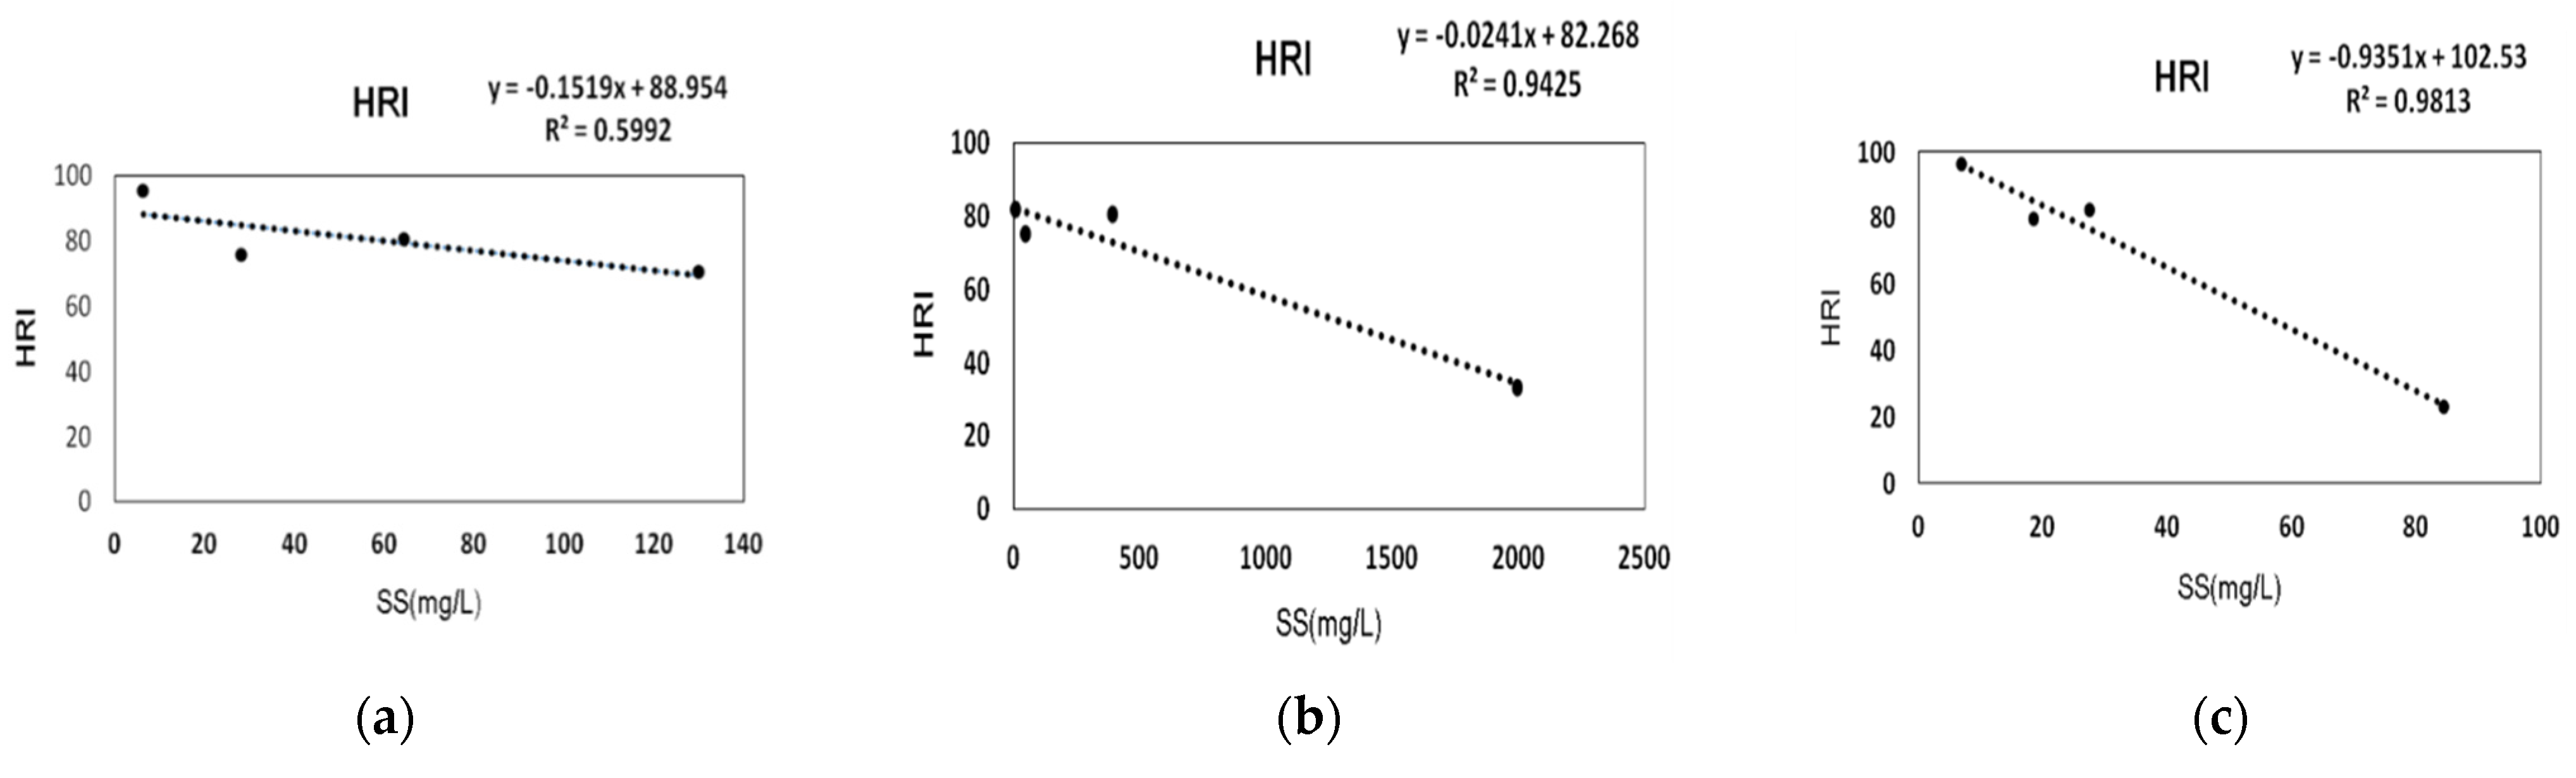
3.1.2. Result of Water Quality and Aquatic Ecosystem Survey

The water quality during rainfall was analyzed according to the maximum value as measured here. According to the results of a 2018 study by the National Institute of Environmental Research [23] which analyzed aquatic ecosystem health assessment indices and water quality items at 960 survey points in South Korea, there was no high correlation between aquatic ecosystem and SS (mg/L) but there was a significant negative correlation between TDI and BMI and BOD, TN, and TP. Another study reported FAI was negatively correlated with BOD and had a significant positive correlation with TN and TP.
In this study, SS (mg/L), the water quality item with the highest correlation with soil water and aquatic ecosystem health indices, was analyzed in areas where water quality and aquatic ecosystem health were surveyed concurrently (six places). According to Table 3, the median value of SS (mg/L) was 8–96 mg/L for the period of 2016–2018, but the maximum value during rainfall was 27.4–1969.0 mg/L. At the time of maximum value, the aquatic ecosystem health index, TDI, was reported to be “bad” and was higher than any other index.
The water quality result represented by SS (mg/L) and the aquatic ecosystem health indices were analyzed by year. Out of the six survey points, SC1-3, SC6 a total of four points, were selected for analysis (survey points SC 4 and 5 had data missing for aquatic ecosystem health during rainfall). The water quality was analyzed with the maximum values which is the highest concentration measured, and the mean concentration of each survey point was used.
In terrain and geologically unusual areas, soil loss increases SS (mg/L) in rivers during rainfall [24]. However, the increase of the SS (mg/L) in rivers can have a direct impact on changes in various biological clusters by significantly changing the river ecosystem’s bottom substrate [25]. We analyzed the effects of TDI, a stone-attached creature due to SS (mg/L) during rainfall. As a result, the higher the concentration of SS (mg/L), the lower index of TDI resulted in “very bad”. The result of TDI, the primary producer of the river ecosystem food chain, means that it is difficult for it to play a role in the fundamentals of energy transfer within the aquatic ecosystem. The higher the concentration of SS (mg/L), the more likely the river’s aquatic ecosystem will cause harm, Figure 5.
As shown in Figure 6, HRI had the highest R2 with SS (mg/L). Areas with SS (mg/L) values of 100 mg/L and smaller were defined as “poor” in terms of the river living environmental standard and “bad” in terms of the HRI index.
HRI refers to the physical external environment affecting living organisms in rivers and streams. It is judged that the NPS according to the physical external environment is most closely related to SS (mg/L) of water quality in the evaluation.
Using the regression equation shown above (y = −0.9351X + 102.53, as of 2018), the Daegi Stream watershed, a recently designated NPS priority management area, as compared with the biomonitoring network point. As can be seen in Table 4, when compared against the actual HRI measurements (biomonitoring network among water environment network, B Song StreamA2 point, Ministry of Environment), in 2017, the SS (mg/L) of the Daegi Stream watershed was 17.2 mg/L and HRI was 86, classified as “high”, showing similar results to that of the national biomonitoring network (“good” grade).
Insufficient or missing data in the survey period is a clear limitation of the spatial scope of this study; therefore, further supplementation is required in the future.
However, the main consideration of this study was to determine the aquatic ecosystem health indices with the highest correlation with water quality, to examine the correlation between water quality and the health of aquatic ecosystems. As shown in Table 4, when SS (mg/L) was 80 mg/L or lower, the HRI grade was “poor” and when SS (mg/L) was 60 mg/L or lower, HRI grade was “moderate”, indicating that this study has identified a correlation between water quality and aquatic ecosystem.
There are no results of surveys or research in South Korea regarding the suitability of applying SS 25 mg/L as a criterion. However, there is an international case of presenting guidelines in which the water quality control from turbid water impact is conducted in relation to aquatic ecosystem considering items such as turbidity, SS (mg/L), and bed materials of the streams, Table 5.
In Canada, the criteria for turbid water are clearly presented based on SS (mg/L) values or turbidity among water quality items. A previous study reported that there was no significant damage to fish habitat under the condition of SS (mg/L) at 25 mg/L or smaller, but when SS (mg/L) was 400 mg/L or larger, there was a significant adverse impact on the habitat environment [28]. In addition, it was also reported that there was no impact with SS (mg/L) below 10 mg/L, but there was a potential impact in the range of SS (mg/L) at 10–100 mg/L, and the effect was significant at SS (mg/L) above 100 mg/L [29].
Therefore, we determine that a criterion of SS 25 mg/L during rainfall, can serve as an adequate indicator for the selection of NPS priority management areas taking into account the correlation with aquatic ecosystem health, with regard to Sub-para 2 of NPS priority management areas.

3.2. Preparation of Detailed Standards for Designation (Sub-Para. 5)

The Sub-para. 5 means that “an area deemed to require special management due to its unique geological or stratigraphic structure.” Through analyzing the characteristics of the six priority management areas, a lot of erosion of the surface is caused by rainfall, which causes soil to be lost and can have a high impact on rivers and aquatic ecosystems. Accordingly, detailed standards for Sub-para. 5 should be categorized according to altitude, land use, slope, and water quality.

3.2.1. Geological or Stratigraphic Structure

The area of the Doam Lake watershed (designated in 2007) is 148.73 km2 and the area of the fields that is a highland field area is 12.07 km2, which accounts for about 18.2%. The altitude of the entire watershed is above 700 m, and highland fields with slopes of 15% or more were 147.75 km2, accounting for about 99% of the total watershed area.
The area of the Golji stream watershed (designated in 2013) is 398.34 km2 in total, consisting of forest fields (87.5%) and fields (13.38 km2, 7.9%). All fields located in the NPS priority management areas were above 400 m in altitude. Highland fields with slopes of 15% or more were 13.24 km2, 42.2% of the total field area [30].
The upper stream of Soyang Lake (designated in 2015) consists of Mandae, Gaah, and Jaun Districts in the Yanggu, Inje, and Hongcheon Counties of Gangwon Province. Land-use type (%) in this area was in the order of forest and field. In the watershed area of Mandae District, fields occupy 17.32 km2 (26.72%) out of the total area (64.82 km2), and 45.3% of fields have slopes above 15%. Altitude in this region is above 300 m. The watershed area of Gaah District is 35.83 km2 and the field area is 0.02 km2; the proportion of field area is only 0.05%, but 100% of the field area has slopes above 15%. Altitudes in all field areas are above 200 m. The watershed area of Jaun District is 134.39 km2 and the field area is 11.84 km2, accounting for about 0.09%, however, fields with slopes above 15% accounted for 44.5% of the field area and altitudes were all above 400 m [31]. The area of the Daegi Stream watershed (designated in 2018) is 99.9 km2 and the field area is 8.6 km2, accounting for about 8.6%. Among the field area, the highland field area was 7.8 km2 and all are above 400 m in altitude. 91.9% of the highland fields had altitudes above 400 m and slopes above 15% [32].
For all the areas described above, the ratio of fields was high, although less than the forest and most had altitudes above 400 m (except Gaah District) and slopes above 15%. In Daegi District, the most recently designated area, up to 99% of the NPS priority management area composed of highland field, recognized as major sources of NPS. Therefore, in Figure 7, we determine that the criteria of altitude above 400 m and slope above 15% can serve as indicators for Sub-para. 5 and that the ratio of field (paddy field) to the forest should be considered. In addition, if the percentage of highland fields exceeds 50% of the total field area, the area can be regarded as an unusual structure in terms of geology and strata, thus satisfying the detailed standards.
The U.S. manages to soil runoff as the CPA (Conservation Reserve Program). The CRP is the policy in which the government pays a sum of money when the agricultural land vulnerable to soil erosion leaves fallow for 10 to 15 years accounting for one-third of the total annual expenditure (approximately $6 billion) of the U.S. Department of Agriculture. Additionally, Spain provides subsidies for converting agricultural land into pasture to prevent soil erosion.
Overseas countries mainly manage soil erosion and water pollution under an incentive system that provides subsidies. However, Japan is similar to Korea, considering the overall soil runoff reduction in detail, such as altitude, slope, land use, and agriculture. Japan implemented measures to reduce soil runoff in consideration of topography. The soil water flowed into rivers and nearby seas and then caused water pollution and coastal areas from Okinawa in Japan. To solve these problems, the “Ordinance on Prevention of Soil Runoff in Okinawa” was enacted in 1994. Since September 2013, the company has established a plan to prevent soil runoff in Okinawa and then proceed with improvement measures for soil runoff from 2013 to 2021 [33].

3.2.2. Water Quality

According to the strong rainfall every year, a large amount of soil loss generated has a significant impact on water quality and ecosystems in Korea. In many countries, SS (mg/L) generation from soil loss is recognized as a source of pollution as well as a factor that reduces biodiversity in the ecosystem. Then specific standards are set and managed [34]. Furthermore, SS (mg/L) increases, such as soil loss, can significantly change the river ecosystem’s lower substrate, which can have a direct impact on changes in various biological clusters [25].Therefore, SS (mg/L) was considered in this study.
In the Doam Lake watershed, the event mean concentration of SS at points after the confluence of the main stream of the Song Stream during rainfall was at 672.4 mg/L (0.8–18,829.0 mg/L), about 54 times higher than at times of no rainfall [35].In the Golji stream watershed, the event mean concentration SS (mg/L) at the point of critical water level mark (Songye Bridge), which is the management target point for Imgye Stream (2012–2015), during rainfall was 256.3 mg/L (53.2–459.3 mg/L), about 58 times higher than during times of no rainfall. According to Figure 8, In the management target point of the Golji stream (2012–2015), which is Golji stream 2 (Yeoryang Bridge 1), the event mean concentration of SS (mg/L) was 76.0 mg/L (8.1–143.8 mg/L), about 17 times higher than during times of no rainfall [36].
In the upstream watershed of Soyang Lake, SS (mg/L) was 646.5 mg/L in the Mandae Stream (2009–2017) of the Mandae District during rainfall, about 33 times higher than that during no rainfall. SS (mg/L) was 50.0 mg/L during rainfall in the Gaah Stream of Gaah District (2015–2017), about 19 times higher than during no rainfall. SS (mg/L) was 248.9 mg/L in the Jaun Stream of Jaun District (2015–2017) during rainfall, about 73 times higher than during no rainfall [37]. In the Daegi Stream watershed, SS was 412.4 mg/L (22.8–3280.0 mg/L) at Anbandegi (D3) (2013–2018) during rainfall, about 10 times higher than at times of no rainfall, and SS (mg/L) was 27.9 mg/L (8.5–74.0 mg/L) in Song Stream confluence point (S4), about twice higher than during times of no rainfall [33].
As a result of analyzing the water quality during rainfall in each area, the ratio of the distribution for fields other than the forest was high, and the ratio of highland fields was over 50% or higher on average. The event mean concentration of SS (mg/L) during rainfall was 672.4 mg/L at maximum in the Doam Lake watershed, which is the highest value among all areas. In Jaun District, the highest concentration of SS (mg/L) during rainfall was 73-fold that of no rainfall. The Doam Lake watershed had the highest altitude among the six NPS priority management areas at above 700 m, and in this area, highland fields account for 99% of the area. From these results, it can be seen that the concentration of NPS discharged into streams during rainfall in the designated areas differs according to the ratio of fields, altitude, and slope.
Therefore, with regards to the detailed standards of Sub-para. 5, the NPS priority management areas should be selected according to the level of NPS (in the case of areas with soil water outflow, SS (mg/L) can be used) that can be discharged into streams after analyzing the data of the ratio of fields, altitude, and slope.

4. Conclusions

In order to select the NPS priority management areas designated for soil water reduction, it is imperative to establish objective, detailed standards. Therefore, based on the six areas currently designated under legal designation standards Sub-para. 2 and Sub-para. 5, we determined the following: (1) areas with more than 50% field ratio, altitude higher than 400 m, and more than 15% in slope; (2) the higher the altitude, slope, and field ratio, the higher the effect of suspended solids (SS) on water quality during rainfall: (3) there is a high correlation between SS and HRI.
From analyzing the measurement data of the areas designated for the detailed standards of Sub-para. 2, we determined that (1) SS and HRI have a positive correlation, and (2) the level of the health of the aquatic ecosystem due to NPS impact can be determined based on the values of biological indices, based on an SS (mg/L) value of 25 mg/L which are water quality considered with aquatic ecosystem health and water quality standards or the average grade of rivers in Korea. When SS (mg/L) was 80 mg/L or lower, the HRI grade was poor and when SS (mg/L) was 60 mg/L or lower, HRI grade was moderate, indicating that this study has identified a correlation between water quality and aquatic ecosystems.
The limitations of this study are that a sufficient amount of data was not available as the study utilized data of previously designated NPS priority management areas and results of previous studies. Despite this, the designation of NPS priority management areas due to soil water (sediment) from rainfall-runoff from this study shed light on the correlation between water quality and aquatic ecosystems. They will be useful for establishing detailed standards and future plans for expanding designated areas, as well as for policy and research for improving NPS reduction.

Author Contributions

Conceptualization, J.K.; methodology, J.K.; software, J.K.; formal analysis, J.K., J.C. and J.M.L.; investigation, J.K., J.C. and J.M.L.; resources, J.K.; data curation, J.K., J.C. and J.M.L.; writing—original draft preparation, J.K.; writing—review and editing, J.K.; visualization, J.K.; supervision, B.P. and M.P.; project administration, B.P., M.P., K.K. and Y.K.; All authors have read and agreed to the published version of the manuscript.

Funding

This research was supported by a grant from the National Institute of Environmental Research (NIER), funded by the Ministry of Environment (ME) of the Republic of Korea, grant numbers NIER-2020-01-01-054.

Institutional Review Board Statement

Not applicable.

Informed Consent Statement

Not applicable.

Data Availability Statement

Not applicable.

Conflicts of Interest

The authors declare no conflict of interest.

References

  1. Park, C.G. Risk of Harmful Algal Bloom in the Four Major Rivers and Problems in Governmental Responsive Measures, Korea Water Resources Association. Water Future 2015, 48, 41–50. [Google Scholar]
  2. The Ministry of Environment. Water Environment Conservation Act; No. 2018-69; The Ministry of Environment: Sejong City, Korea, 1990.
  3. Keunwoo, H.; Sungbin, P.; Jeonghe, P.; Sangho, J.; Jaewan, C.; Kiseong, K. Design of Optimum Volume of Sediment Settling Pond by Slope at Highland Agricultural Watershed Using WEPP Model. J. KSAE 2010, 52, 87–94. [Google Scholar]
  4. The Ministry of Environment. Water Environment Conservation Act; The Ministry of Environment: Sejong City, Korea, 2021.
  5. Kim, J.S.; Ryu, J.C.; Choi, J.Y.; Lee, J.M.; Na, E.H.; Shin, D.S.; Lee, J.K. A Study on the Plan for Selection of Prioritization Management Area for Reduction of Non-Point Pollution in Gwangju Metropolitan City. Env. Policy 2019, 27, 189–214. [Google Scholar]
  6. Ryu, J.C.; Kim, J.S.; Choi, J.Y.; Jang, H.S.; Shin, D.S.; Lee, J.K.; Na, E.H. Evaluation on the effect of sediment outflow reduction according to the implementation of soil water reduction project in NPS management areas of Doam Lake watershed. Environ. Policy 2018, 26, 1–19. [Google Scholar]
  7. Jang, S.S.; Ahn, S.R.; Kim, S.J. Evaluation of executable best management practices in Haean highland agricultural catchment of South Korea using SWAT. Agric. Water Manag. 2017, 180, 224–234. [Google Scholar] [CrossRef]
  8. Reza, A.; Eum, J.; Jung, S.; Choi, Y.; Owen, J.S.; Kim, B. Export of nonpoint source suspended sediment, nitrogen, and phosphorus from sloping highland agricultural fields in the East Asian monsoon region. Environ. Monit. Assess. 2016, 188, 1–15. [Google Scholar] [CrossRef]
  9. Gangwon Province. NPS Management areas: Golji Stream Watershed; The Ministry of Environment: Sejong City, Korea, 2013.
  10. The Ministry of Environment. The 3rd Rainfall-Runoff NPS Management Measures; The Ministry of Environment: Sejong City, Korea, 2021.
  11. The Ministry of Environment. Water Environment Information System. Available online: Water.nier.go.kr (accessed on 8 August 2020).
  12. National Institute Environment Research. Technical Guidelines for Total Amount Management of Water Quality Pollution; National Institute Environment Research: Incheon, Korea, 2017.
  13. Kim, K.; Kim, B.; Eum, J.; Seo, B.; Shope, C.L.; Peiffer, S. Impacts of land use change and summer monsoon on nutrients and sediment exports from an agricultural catchment. Water 2018, 10, 544. [Google Scholar] [CrossRef] [Green Version]
  14. Sharpley, A.N.; Daniel, T.C.; Edwards, D.R. Phosphorus movement in the landscape. J. Prod. Agric. 1993, 6, 492–500. [Google Scholar] [CrossRef]
  15. Haygarth, P.M.; Jarvis, S.C. Transfer of phosphorus from agricultural soils. Adv. Agron. 1999, 66, 196–249. [Google Scholar]
  16. Reza, A.; Eum, J.; Jung, S.; Choi, Y.; Jang, C.; Kim, K.; Owen, J.S.; Kim, B. Phosphorus budget for a forested-agricultural watershed in Korea. Water 2019, 11, 4. [Google Scholar] [CrossRef] [Green Version]
  17. Korea Environment Corporation. Water Quality Incident Survey by Region; Korea Environment Corporation: Incheon, Korea, 2020. [Google Scholar]
  18. Korea Environment Corporation. A Study on Establishment of Improvement Measures for NPS Management Areas Designation System; Korea Environment Corporation: Incheon, Korea, 2020. [Google Scholar]
  19. Wonju Regional Environmental Agency. Survey of Song Stream and Doam Lake Aquatic Ecosystem Structure; Wonju Regional Environmental Agency: Wonju, Korea, 2018.
  20. The Ministry of Environment. Framework Act on Environmental Policy: Environmental Standards for Living around River; The Ministry of Environment: Sejong City, Korea, 2020.
  21. The Ministry of Environment. Establishment and Operational Plans for Water Environment Monitoring Network; The Ministry of Environment: Sejong City, Korea, 2021.
  22. Han River Basin Commission. Study on the Impact of Turbid Water on the Aquatic Ecosystem in the Upstream Watershed of the Han River; Han River Basin Commission: Hanam, Korea, 2007. [Google Scholar]
  23. National Institute of Environmental Research. A Study on Biomonitoring Network Monitoring and Development of Assessment Method; National Institute of Environmental Research: Incheon, Korea, 2018.
  24. Jung, S.; Jang, C.; Kim, J.K.; Kim, B. Characteristics of water quality in storm runoffs from intensive highland agriculture area. J. Korean Soc. Water Qual. 2009, 25, 102–111. [Google Scholar]
  25. Kwak, S.J.; Bhattrai, B.D.; Kim, E.J.; Lee, C.K.; Lee, H.J.; Heo, W.M. Characteristics of nonpoint pollution discharge on stormwater runoff from Lake Doam watershed. Korean J. Limnol. 2012, 45, 62–71. [Google Scholar]
  26. Wonju Regional Environmental Agency. Doam Lake Watershed Monitoring Survey; Wonju Regional Environmental Agency: Wonju, Korea, 2014.
  27. Wonju Regional Environmental Agency. A Study on Differences in Biomass of Macro Invertebrates in Japan; Wonju Regional Environmental Agency: Wonju, Korea, 2002.
  28. European Inland Fisheries Advisory Commission. Turbid Water and Aquatic Ecosystem Standards; European Inland Fisheries Advisory Commission: Vigo, Spain, 2015. [Google Scholar]
  29. USEPA. Turbid Water and Aquatic Ecosystem Standards; USEPA: Washington, DC, USA, 2015.
  30. The Ministry of Environment. Golji Stream Watershed NPS Management Areas Implementation Plan Approval; The Ministry of Environment: Sejong City, Korea, 2017.
  31. National Institute of Environmental Research. Management Measures of the NPS Management Area for Soyang Lake Upstream Watershed; National Institute of Environmental Research: Incheon, Korea, 2016.
  32. National Institute of Environmental Research. Management Measures of the NPS Management Area for Song Stream Watershed; National Institute of Environmental Research: Incheon, Korea, 2018.
  33. Lee, S.W.; Choi, Y.S.; Park, M.J.; Kim, K.S.; Park, J.H.; Ryu, I.G.; Hwang, S.H.; Yu, S.J.; Lee, J.K.; Lee, Y.J.; et al. A Study on management and reduction plan of non-point source in Doam lake watershed(II); NIER-RP-2016-351; National Institute of Environmental Research: Incheon, Korea, 2016.
  34. Ji-yong, C.; Ji-hyun, L. Effective Water Management Plan for Multipurpose Dam Reservoir through Basin Management; Korea Environment Institute: Sejong City, Korea, 2005. [Google Scholar]
  35. Wonju Regional Environmental Agency. Doam Lake Watershed Monitoring Survey, 2009–2017; Wonju Regional Environmental Agency: Wonju, Korea, 2017.
  36. Gangwon Province. Report on Implementation Plan for Golji Stream Watershed NPS Management Areas; Gangwon Province: Gangwon, Korea, 2017. [Google Scholar]
  37. Gangwon Province. Report on Implementation Plan for Soyang Lake Upstream Watershed NPS Management Areas; Gangwon Province: Gangwon, Korea, 2020. [Google Scholar]
Figure 1. The NPS priority management areas (As of 2020).
Sustainability 13 09842 g001
Figure 2. Non-point discharge loads in total discharge loads: (a) non-point discharge loads (2013~2018); (b,c) non-point discharge loads ratio by type of pollutant in 2018 as wems.nier.go.kr.
Sustainability 13 09842 g002
Figure 3. Status of water quality contamination incidents: (a) yearly status of water quality contamination incidents in Korea; (b) status of water quality contamination incidents by region in Korea.
Sustainability 13 09842 g003
Figure 4. Monitoring points of Doam Lake among NPS priority management areas.
Sustainability 13 09842 g004
Figure 5. SS (mg/L) and TDI analysis (2018).
Sustainability 13 09842 g005
Figure 6. Correlation between river and aquatic ecosystem health: (a) analysis of 2016 Health Assessment Index; (b) analysis of 2017 Health Assessment Index; (c) analysis of 2018 Health Assessment Index.
Sustainability 13 09842 g006
Figure 7. Characteristics of altitude and slope according to the land use of the applicable areas in the six NPS priority management areas (Sub-para. 2 and Sub-para. 5).
Sustainability 13 09842 g007aSustainability 13 09842 g007bSustainability 13 09842 g007c
Figure 8. Target areas for designated management: (a) Doam Lake; (b) Golji stream; (c) Mandae District; (d) Gaah District; (e) Jaun District; (f) Daegi District.
Sustainability 13 09842 g008
Table 1. The NPS priority management areas (as of 2020).
The NPS Priority Management AreasArea (km2)Designation StandardTargetDate of Designation
Doam Lake148.732 and 5SS2007.8.23
Golji stream watershed398.342 and 5SS2013.12.24
Mandae District64.14 2 and 5SS2015.10.15
Gaah District47.32 and 5SS2015.10.15
Jaun District133.182 and 5SS2015.10.15
Daegi District99.902 and 5SS2018.10.26
Table 2. Aquatic ecosystem health standards.
GradeTrophic Diatom Index
(TDI) (1)
Benthic Macroinvertebrate Index
(BMI) (2)
Fish Assessment Index (FAI) (3)Habitat and Riparian Index
(HRI) (4)
High(A)≥60≥70≥87.5≥80
Good(B)≥50≥60≥68.7≥60
Moderate(C)≥40≥40≥43.7≥40
Poor(D)≥30≥20≥25≥20
Bad(E)<30<20<25<20
(1) Trophic Diatom Index: It is the primary producer of the food chain in the river ecosystem and refers to the diatoms attached to the gravel or stones of the riverbed among algae responsible for energy transfer in the ecosystem. (2) Benthic Macro Invertebrate Index: Benthic macroinvertebrates are the primary and secondary consumers of the river ecosystem, and they are biological indicators that reflect regional characteristics. It refers to a biota in which aquatic insects account for most of the species appearing in the ecosystem. (3) Fish Assessment Index: Organisms at the apex of the food chain in the water columns representing omnivores, herbivores, insectivores, and carnivores at various trophic levels. (4) Habitat and Riparian Index: Physical external environment influencing living organisms in the river watershed.
Table 3. Result of water quality and river health assessment (2018).
PointWater Quality IndicatorsAquatic Ecosystem Health Indicators (Index)
SS (mg/L)TDIBMIFAIHRI
MeanMax
SC11.66.876.5
(Good)
93.9
(High)
68.8
(Good)
96.5
(High)
SC22.627.481.7
(Good)
93.2
(High)
91.7
(High)
82.5
(High)
SC31184.328.7
(Bad)
61.0
(Moderate)
91.7
(High)
23.0
(Poor)
SC412.528.6----
SC521.955.3----
SC61018.577.1
(High)
65.0
(Moderate)
77.1
(High)
80.0
(Good)
Table 4. Result of regression analysis of 2018 data with high R2 value in HRI analysis.
SSHRI
mg/LIndexGrade
2084High
2579Good
4065Good
6046Moderate
8028Poor
1009Bad
<100--
Table 5. Standards for turbidity and suspended sediment deposition in British Columbia, Canada (Draft).
CategoryMaximum TurbidityMaximum Suspended SedimentBed Material
Water environment
(clean water)
background concentration (NTU): ≤8
=>8 NTU in 24 h,
30-day average: 2NTU
background concentration (mg/L): ≤25
=>25 in 24 h,
30-day average: 5 NTU
≤2 mm: <10%
≤3 mm: <19%
≤6.35 mm: <25%
Water environment
(turbid water)
background concentration (NTU): 8~80
=>8
background concentration (NTU): ≥80
=>10% of background concentration
background concentration(mg/L): 25~250
= >25
background concentration (mg/L): ≥250
=>10% of background concentration
Geometric mean diameter
≤12 mm
Fredle number ≤ 5 mm
Industrial wastewater, Livestock wastewater background concentration (NTU): ≤50
=>10
background concentration (NTU): ≥50
=>20% of background concentration
background concentration (mg/L): ≤100
=>20
background concentration(mg/L): ≥100
=>20%
Publisher’s Note: MDPI stays neutral with regard to jurisdictional claims in published maps and institutional affiliations.

