Article

The Role of Value Appropriation Capability of Chinese Multinationals in Operating Cross-Border Business Models

1
International Business School, Yunnan University of Finance and Economics, Kunming 650221, China
2
School of Management, Zhejiang University of Technology, Hangzhou 310023, China
3
Department of Economics, Management and Institutions, University of Naples Federico II, 80100 Naples, Italy
*
Author to whom correspondence should be addressed.
Sustainability 2021, 13(17), 9812; https://doi.org/10.3390/su13179812
Submission received: 14 August 2021 / Revised: 26 August 2021 / Accepted: 27 August 2021 / Published: 1 September 2021
(This article belongs to the Special Issue Sustainable Cross-Border Business Models)

Abstract

:
In an ever increasingly competitive and unstable global market, multinational corporations (MNCs) are greatly pressurised to use inherent capacities and develop effective cross-border business models (CBMs) that can transform value into the desired outcome. Amid high uncertainties, MNCs are required to develop some critical capabilities to operate CBMs to the best of their ability. More specifically, it is vital for MNCs to have a unique capability that enables them to more effectively synergise with these commonly recognised capabilities (e.g., technological innovation capabilities (TIC) and marketing capability (MC) alongside the global value chain (GVC)) to sustain balance among and gain profits with stakeholders. From the literature review, we first identified value appropriation capability (VAC) as one of the most important capabilities and thereby developed three hypotheses. Based on the hypotheses, we investigated how VAC efficiently moderates MNCs’ capabilities to appositely operate CBMs. Then, empirical panel data between 2011 and 2019 in the Chinese manufacturing industry were used to examine the hypotheses. The results reveal that VAC, TIC and MC positively impact MNC performance. Moreover, VAC–TIC interaction significantly improves MNC performance, and VAC–MC interaction positively improves MNC performance. Our findings provide novel insights into the CBM literature by examining the importance of VAC for operating CBMs alongside its multifaceted effects on MNC performance, especially in times of uncertainty.

1. Introduction

Alongside the prevalence of the global value chain (GVC), it has become a common strategy for multinational corporations (MNCs) to operate with strategic CBMs to achieve competitive advantages [1,2,3,4,5]. The GVC framework illustrates how value is created and captured by MNCs through the cooperation of various stakeholders, such as R&D partners, raw material suppliers, distributors and customers. Echoing this concept, the literature shows that, to operate CBMs, MNCs need to develop some key capabilities for better collaboration with multiple stakeholders, among which technological innovation capability (TIC) and marketing capability (MC) are considered the most important ones [6,7]. It is because, while TIC and MC are considered the fundamental engine of a self-transformation process, they are a means to assess and predict customer needs and competitor behaviours accurately in the ever-changing global market environment [8,9]. For MNCs, TIC and MC are the central platforms of permanent value transformation from knowledge creation, new products and service processes to cost management and customer delivery; every organisation needs TIC to create value and MC as a vehicle to deliver it to the customers.
However, facing the uncertainties in today’s world economy, TIC and MC seem to be insufficient for MNCs to operate CBMs successfully. Research has suggested that relying solely on TIC and MC is insufficient to determine the excellence of MNCs because the operation of CBMs involves multiple stakeholders, which necessitates some other key capabilities to properly equilibrate them [10,11]. Following this line of thought, some scholars have recently considered value appropriation capability (VAC) [12,13]. It is because VAC enables MNCs to acquire all relevant benefits from their innovation activities; that is, VAC is the capability to transform products into a desired value [13,14] following their position in the GVC and the effectiveness of their CBMs [14].
Nevertheless, most existing research on VAC focuses on the mechanism of profiting from modular innovation [15,16,17,18] but has ignored exploring how it affects MNC performance. More specifically, research addressing how MNCs use VAC to operate CBMs to enhance firm performance under turbulent times remains limited [19,20]. To fill this gap, we aim to investigate the role of VAC in influencing the performance of MNCs with appropriate CBMs during uncertainty, with an important interest in the moderating power of VAC on TIC and MC.
The main contribution of this study is to enrich the business model literature by identifying the importance of VAC for operating CBMs and examining its multifaceted effects on MNC performance, especially during uncertainty. Thus, this study also provides novel insights into management practice.
The remainder of this paper is organised as follows. Section 2 overviews previous studies on corporation capability and performance and the proposed hypotheses. Section 3 details the methods used in this study, and Section 4 presents the empirical results. Finally, Section 5 provides the conclusions, management implications, limitations of this study and future research directions.

2. Materials and Methods

2.1. Theoretical Foundation and Hypothesis Development

The concept of unrecognised or inappropriate value remains very abstract in an ever-evolving GVC. While value may be seen as incomes, remuneration and labour contracts, the appropriate CBM an MNC needs to operate its values is far more difficult to detect, let alone measure [4,5]. Hence, identifying the key capabilities that are able to operate their CBMs becomes a constant priority for MNCs [1,21] to maintain a position in the GVC and strive among stakeholders, even in turbulent times. VAC is considered among scholars as a key capability that is able to play a moderating role in operating CBMs to produce the desired results for MNCs [11,13]. Moreover, in the intensely competitive global market, VAC is seen as the foundation for MNCs to sustain profitability [9,10]. Therefore, regardless of problems, the moderating effect of VAC is a primary priority for researchers and managers, although TIC and MC will also significantly impact firm performance [22]. Here, this study extensively investigates the interacting effects of VAC with TIC and VCA with MC to ascertain the moderating power of VAC on CBMs to produce an MNC’s desired results.

2.1.1. The Importance of Value Appropriation among MNCs Facing Uncertainties

VAC is defined as the “production of products and services at the lowest feasible cost and their sale at the price that is closest to customers’ willingness to pay” [4,6]. Because it is presented from the perspective of a corporation, this is comparable to what [23] refers to as trade value, but it also includes the production process and cost. Hence, VAC is largely accomplished via the combination and transformation of resources and values into desired, affordable and accessible goods [24]. Furthermore, our definition of VAC is a broad term that encompasses various operations that businesses undertake to reduce costs and defend an operational profit margin. VAC is an MNC’s ability to determine and manage the amount it costs for producing a product or service, alongside the amount a consumer pays for it. Consequently, VAC occurs both within and outside the organisation—in the marketplace. Firms appropriate the value they generate through different corporate- and business-level methods targeted at lowering costs alongside maintaining the most reasonable and sustainable level of income while maintaining their relevance in the GVC [25]. MNCs achieve VAC by controlling output, distribution and value creation processes [26]. The VAC of MNCs is determined by their position in the value network and the effectiveness of other strategic capabilities [27]. Accordingly, TIC and MC play major roles in MNCs’ cross-border business development. In the intensely competitive global market, these capabilities are the foundation for corporations to achieve sustainable functionality. MNCs could only generate profit from a CBM context by leveraging continuous TIC and MC [28].
Moreover, considering the competitive business landscape riddled with uncertainties and turbulences nowadays, MNCs can only survive by operating with appropriate CBMs [3,29] to obtain results and control increasingly complex activities alongside the GVC, such as input, processes, output and distribution [30]. Here, the VAC must become critically important to the MNC for its effectiveness of transforming a CBM into a powerful moderating machine, holding together the internal operation of MNCs while maintaining its connection with relevant stakeholders [19,30]. From this concept, we derive the following hypothesis:
Hypothesis 1 (H1).
VAC directly impacts MNCperformance amid uncertainties.

2.1.2. TIC and MC Contributions to MNC Performance

TIC is broadly seen as the central backbone of competitiveness, underlying organisational structures, processes and innovative production of MNCs [31,32] to hold a suitable position in the market [33,34]. This capability could be diverse depending on the MC of the corporation [9,19] because it is one of the foundational instruments for entering new markets to exploit and expand existing market shares and endow MNCs with a comparative advantage [20,31]. Under the existing technological trajectory, the differences in the TIC of corporations exhibit a self-reinforcing positive feedback effect. When leading corporations create advanced technology by continually developing new knowledge, underperforming corporations are situated between the lagging and catching-up parts of the business cycle [20,32]. New technological revolution has enabled either a survival or jump in the technological trajectory, which has enabled MNCs to improve their competitiveness in the global market.
Furthermore, TIC does not always promote firm profitability [29,33]. In some situations, MNCs have not obtained considerable profit despite their first-mover advantages in technological innovation, whereas technological followers and late-market entrants have achieved higher market share and business performance. Since profiting from the innovation framework was introduced by [34], the topic of how MNC performance benefits from innovation has attracted considerable attention from academic and managerial experts [35]. MNCs do not make selfless contributions to collective benefits. Instead, the innovation activity of MNCs involves a logic of “reproduction”; that is, during technological innovation, MNCs seek collective benefits through inter-organisational collaborations to maximise their MC so that, during the process of technology commercialisation, MNCs will also maximise the interaction impact of VAC and MC [26,34]. Rather than the possession and control of innovation resources, MNCs emphasise the moderating effect of VAC. Regarding TIC and MC amid uncertainty, the moderating effect of VAC becomes paramount [13,36]. Accordingly, VAC, which was considered a moderating variable, is now considered an endogenous variable that MNCs can control through strategic management. The reorganisation of VAC and technology facilitates TIC and MC, changes in organisational structures and improvements to management procedures, promoting changes in the key elements of the CBM adopted by MNCs [37] and thereby improving their business performance. MNCs must develop new technology through R&D to acquire advanced scientific and technological research results, but scientific and technological knowledge must be supported by the VAC to be converted into valuable products and services [30,32]. This reveals the moderation effect of value appropriation within the concept of innovation to boost performance; therefore, we hypothesise as follows:
Hypothesis 2 (H2).
TIC and MC impact MNC performance amid uncertainties.

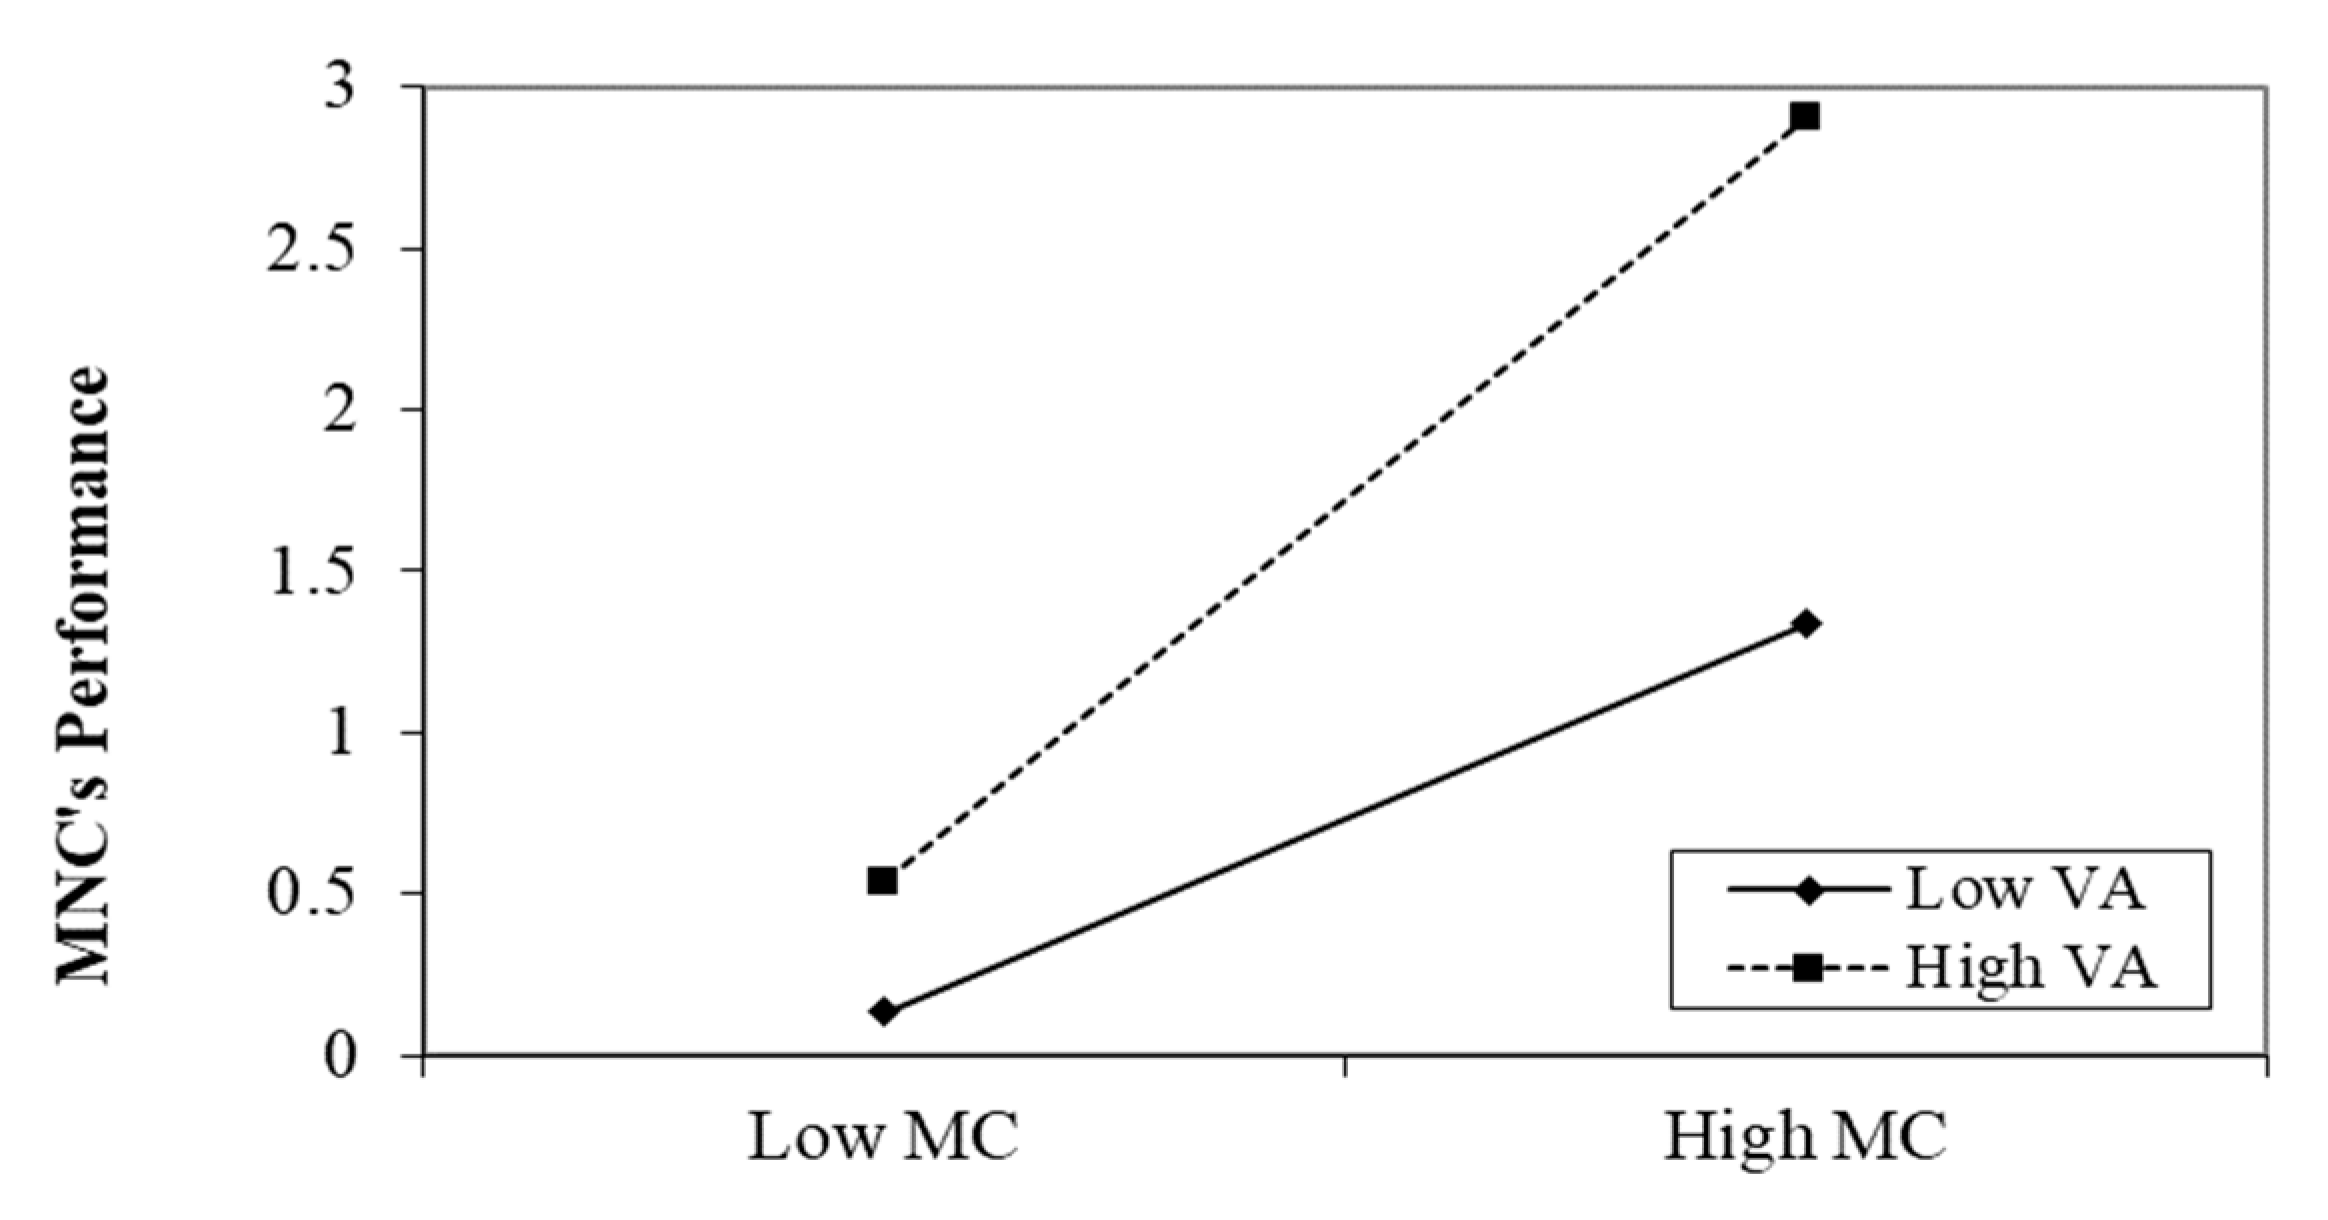
2.1.3. The Interaction Effect of TIC and MC on Firm Performance

MC is the integrative process designed to apply the collective knowledge, skills and resources of the corporation to the market-related needs of the business, enabling the business to add value to its goods and services, adapt to market conditions, leverage market opportunities and meet competitive threats [38,39]. Although the research findings regarding MCs are inconsistent, they exhibit several commonalities. MC denotes a corporation’s ability to focus on customer needs and establish favourable relationships with customers, enabling the corporation to acquire loyal customers [39]. MC also enables corporations to continually create and deliver value to customers [10,14,33] and adapt to changes in market environments.
Accordingly, this capability enables MNCs to accurately assess and predict customer needs and competitor behaviours in the ever-changing global market environment [25,27]. Research on the formation and development of MC, which is a source of long-term competitive advantages for MNCs, provides crucial references for such corporations to enhance their performance.
However, changing market circumstances and varied degrees of competition among MNCs impact and modify their TIC and MC. MNCs are pushed to reinvent a CBM due to the new global realities to sustain and/or expand their MNC performance at both the global and local levels. Because business model development is a system-wide quest for the best ways of assembling different pieces of a business, key processes and important resources to generate superior market values and profit returns, planning, orchestrating and executing a global business model that best fits the MNC while yielding the highest possible return come with a level of challenges [23,30]. Regardless of how much autonomy an MNC possesses, executing or innovating a CMB necessitates planning and cross-border coordination, all of which leave the MNC with unexpected challenges or uncertainties. Almost all MNCs, especially the most established and experienced ones, face a tremendous task in coordinating procedures and resource appropriation to adopt the fittings business model. The authors of [40] explored how MNCs respond to opportunities and uncertainties and their strategic VAC. They discovered that MNC adaptation is increasingly influenced by the moderating power of VAC and that perceived uncertainty negligibly impacts VAC. The reorganisation of TIC and MC facilitates changes in resource appropriation and improves management procedures and promotes changes in the key elements of the CBM adopted by MNCs [41], thereby securing their business performance in the long run.
MNCs can only generate profit from a cross-border market context by leveraging continuous TIC and MC [39,42]. The possibility of profiting from innovation must be transformed into unavoidable profitability for MNCs [43]. This transformation requires strategic VAC. Insufficient TIC and MC may prevent MNCs from acquiring the value they have created through innovation. Moreover, some corporations lacking noteworthy MC may acquire the values created by other corporations through a high VAC. The VAC of a corporation promotes its ability to acquire value from TIC and MC. It is with this concept that this paper proposes the following hypothesis:
Hypothesis 3 (H3).
The VAC–TIC interaction positively moderates MNC performance.
Hypothesis 4 (H4).
The VAC–MC interaction positively moderates MNC performance.

2.2. Methods

This study focused on the foundation of hypotheses and a case-study method to investigate the place of inherent capabilities in managing the Chinese manufacturing sector. This approach is also relevant for evaluating the models used by MNCs for their operation. The case study was also designed to deeply understand the implications of uncertainties for the Chinese manufacturing sector at the lower part of the GVC. In essence, our data selection, as extensively described below, was performed with the aim of highlighting the best cases for credible results. This is fundamental to managerial concepts of how MNCs can achieve desirable outcomes through blending inherent capabilities with specific models.

2.2.1. Sample and Data

The preliminary samples of this study comprised A-share-listed MNCs operating in the Chinese manufacturing industry between 2011 and 2019. Moreover, we included only parent and subsidiary corporations whose overseas sales revenues constituted a minimum of 30% of their total sales revenues. Further, the exclusion criteria were as follows: (1) corporations lacking data on major financial indicators, such as R&D investment, the number of R&D personnel and the number of patent applications; (2) corporations whose annual reports lacked the necessary data regarding this study; (3) corporations whose ratio of sales revenues to R&D expenses, total assets to R&D expenses or primary business revenue to total profit were below 1; and (4) corporations with ST or *ST labels. Finally, 523 A-share MNCs were obtained for empirical analysis using a panel data model. Considering the lag of variable influence and to reduce variable endogeneity, the dependent variable—MNC performance—was measured as one-year lagged. Other variables were treated as data in the exact years specified. Corporate data were obtained from the Wind database and Chinese Stock Market financial databases and were manually organised from the selected MNCs’ annual reports. The collected data were processed and analysed using STATA 15.1.
Since the Chinese economic reform, the manufacturing industry has made gigantic transformational leaps and remains one of the pillars of the Chinese economy [11]. Accounting for one-fifth of the global workforce and despite such remarkable advancements [10], the Chinese manufacturing industry remains in the process of upgrading itself from a labour-intensive to a modern high-tech industry [10,11]. Therefore, it occupies a lower position in the GVC, unlike the manufacturing industry in other parts of the world [13]. This positioning makes the Chinese manufacturing industry most vulnerable to uncertainties in the world market [9,10,11]. Since China has become the world’s factory, the timeframe of our data (2011–2019) was selected considering the repercussions of the 2010 Eurozone debt crisis and the 2015 Brexit “yes” vote on the Chinese manufacturing industry.

2.2.2. Measurement

MNC performance. Following the studies of [9,25,30], we used the growth rate of profit to measure MNC performance and used the return on equity for the robustness test.
Technological innovation capability. Following the studies of [5,26,37], we used the number of granted invention patents to measure technological innovation capability.
Marketing capability. Following the studies of [17,39], we used the natural logarithm of sales revenue as a proxy variable for measuring marketing capability.
Value appropriation capability. Following the studies of [13,15,19], we measured value appropriation (VA) capability as the ratio of the value added to sales (VAS) to the total output (VA = VAS/total output).
Control variables. Adding to technological innovation and marketing capabilities, studies have reported other factors that may influence MNC performance, such as corporation size, age, ownership, R&D expenditure investment, R&D human capital investment, market competition and subsidiary investment models [9,39,41]. Therefore, these factors were considered control variables in this study. Table 1 presents the specific measurement method for each variable.

3. Results

3.1. Descriptive Statistics and Correlation Analysis

Table 2 lists the means, medians, standard deviations and minimal and maximal values of the examined variables alongside the numbers of observed samples for these variables. The mean, approximate median, maximal and minimal values for MNC performance were 19.09, 0.038, 24.51 and 10.34, respectively, indicating that the selected MNCs exhibited relatively small differences in their business performance. In contrast, the MNCs exhibited considerable differences in their maximal and minimal values for technological innovation and marketing capabilities (maximal values of 83.00 and 27.47, respectively, and minimal values of 0.00 and 11.60, respectively). Moreover, the mean values of technological innovation and marketing capabilities (10.27 and 21.89, respectively) exceeded their medians (5.000 and 21.69, respectively). The aforementioned results demonstrate that MNCs differed considerably in technological innovation and marketing capabilities. The maximal, minimal and mean values for value appropriation capability were 58.84, −1.000 and 0.230, respectively, indicating that, overall, the MNCs exhibited unsatisfactory value appropriation capability. Of the control variables, the MNCs differed considerably in corporation age, corporation size and the intensity of R&D human capital investment; however, the differences in other control variables were relatively small.
Table 3 presents the Pearson correlation coefficients between the variables. Value appropriation, technological innovation and marketing capabilities positively correlated with MNC performance at the 1% significance level. Nevertheless, the relationship between the independent and dependent variables was further explored using regression analysis. Of the control variables, the corporation size, corporation age, subsidiary investment model and Herfindahl–Hirschman Index significantly positively correlated with MNC performance. However, intensity of R&D expenditure investment did not correlate significantly with MNC performance, and the intensity of R&D human capital investment negatively correlated with MNC performance. This will be explained afterwards.

3.2. Analysis of Regression Results

The sample data selected in this study were panel data, and before regression analysis, we used the Breusch–Pagan and Hausman tests to confirm whether the regression model should be an ordinary least square, fixed effect or random effect model. According to the results of the Breusch–Pagan test, the null hypotheses were rejected (p = 0.000), indicating that the random-effect model outperformed the fixed-effect model. However, the Hausman test also rejected the null hypothesis (p = 0.000). Therefore, the fixed-effect model was selected for regression analysis.
(1) The effect of VAC performance
Table 4 presents the regression analysis results regarding the significance of VAC in an MNC’s CBM operation and its final impact on performance. Column 1 of this table presents the regression results illustrating the effects of the control variables on the dependent variable. Corporation size (CS) and corporation age (CA) exhibited positive relationships with MNC performance at the 1% significance level, while cons also showed a positive relationship at 10% significant level. The HHI and IM exhibited negative relationships with MNC performance at the 1% and 10% significance levels. Intensity of R&D human capital investment (RDH) showed a positive but insignificant relationship with MNC performance. Column 2 presents the regression results for the effect of VAC on MNC performance. VAC positively influenced MNC performance at the 5% significance level, and the corresponding correlation coefficient was 0.002. Accordingly, an increase in the VAC of MNCs induced improvements in their performance; accordingly, H1 was supported.
(2) The interaction effects of VAC and TIC on MNC performance
To verify the moderating effect of VAC on TIC, the interaction terms of VAC and TIC were incorporated into the empirical regression analysis. Column 3 of Table 4 presents the regression results for the moderating effect of VAC on the relationship between TIC and MNC performance. TIC positively affected MNC performance at the 1% significance level, and the corresponding correlation coefficient was 0.001. Moreover, the correlation coefficient between VAC and TIC was 0.011 at the 1% significance level. VAC positively affected MNC performance at the 1% significance level, and the corresponding correlation coefficient was 0.008. Thus, VAC positively moderated the relationship between TIC and MNC performance according to H3.
(3) The interaction effects of VAC and MC on MNC performance
To evaluate the moderating effect of VAC on MC, the interaction terms of VAC and MC were regressed. Column 4 presents the regression results on the moderating effect of VAC on the relationship between MC and MNC performance. MC positively affected MNC performance at the 1% significance level, and the corresponding correlation coefficient was 0.021. VAC positively affected MNC performance at the 1% significance level, and the corresponding correlation coefficient was 0.375. The correlation coefficient between MC and VAC was 1.822 at the 1% significant level. Accordingly, VAC positively moderated the relationship between marketing capability and MNC performance. Thus, H4 and H2 were confirmed.
Figure 1 and Figure 2 depict the moderating effects of VAC based on the empirical test results listed in Table 4. From Figure 1, the slope of the high-value appropriation curve differs considerably from that of the low-value appropriation curve. Moreover, a considerable distance exists between the two curves. These observations indicate that VAC significantly moderated the relationship between TIC and MNC performance. When VAC was low, the MNCs exhibited equal performance irrespective of their TICs. When VAC was high, MNCs with high TIC outperformed those with low TIC. Moreover, the overall performance of the MNCs with high VAC surpassed that of the MNCs with low VAC. From Figure 2, a significant difference was observed between the slopes of the high- and low-value appropriation curves. The distance between these curves increased with MC, indicating that VAC significantly moderated the relationship between MC and MNC performance. When VAC was low, MNCs exhibited equal performance regardless of their MCs. When VAC was high, MNCs with high MC outperformed those with low MC. Moreover, the overall performance of the MNCs with high VAC surpassed that of the MNCs with low VAC.

3.3. Robustness Test

The robustness of the empirical analysis results was tested using the two-period lag data and ROE on MNC performance as the dependent variable (Table 5). M1 to M3 are the regression results of the dependent variable lagging two periods. M4 to M6 are the regression results of replacing the dependent variable with ROE. The results show that the empirical analysis results obtained in this study exhibited satisfactory robustness.

4. Conclusions and Discussion

Numerous studies have elaborated on the effects of different dynamic capability types based on variables such as corporate innovation performance [1,5,6,7]. Specifically, research has elucidated the direct and indirect effects of various capabilities on corporate innovation and performance from different perspectives [2,6,8,9]. This study incorporates existing viewpoints to examine the direct effects of TIC and MC on MNC performance from the perspective of CBMs suitable for times of uncertainty. Regarding the changes in direct effects, this study examined the moderating function of MNCs’ VAC on the relationships of TIC and MC with MNC performance among stakeholders within the GVC [4,6].
An empirical analysis was conducted using data from 175 A-share-listed MNCs operating in the Chinese manufacturing industry to verify the proposed hypotheses. The results indicate that VAC directly affects MNC performance. It also shows that TIC positively affects MNC ability to execute the required functions of creating new technology that enhances reasonable results [3,8,19]. This in turn aids the key operations of the CBM adopted by MNCs to enhance their business performance. MC results similarly support MNCs’ ability to acquire, integrate and restructure resources according to internal processes and for partners within a GVC [29,30,38]. MNCs with a high marketing capability can promptly assess market movements in a competitive and challenging global market. The results therefore prove that TIC and MC support corporations in developing appropriate CMBs for seizing market opportunities and satisfying consumers’ ever-changing needs [2,7,8].
Furthermore, this study investigated the moderating effects of VAC on the relationships of TIC with MNC performance and MC with MNC performance. The results reveal that VAC, as a central moderator, remarkably improved TIC’s and MC’s impact on MNCs’ performance almost with a similar intensity. When VAC was high, MNCs with high TIC clearly outperformed those with low TIC, as indicated by the difference between the two ascending slopes of the two curves (Figure 1). MNCs with high MC also significantly outperformed those with low marketing capability, as indicated by the large difference in the slopes of the two curves (Figure 2). The results solve the dilemmas of innovators, which refer to the inability of corporations with first-mover advantages in TIC and MC to acquire innovation value, especially in times of uncertainty. TIC and MC, which constitute well-known MNCs’ strengths, are rather the fundamental factors and antecedents for the formation of CBMs, while VAC is the ultimate operational driver to run the CBMs effectively to transform value to required products and serve all partners within the GVC, even when the market is unstable. Accordingly, the VAC of MNCs determines their internal functionalities and external repositioning.
Moreover, the results have clearly proved the pivotal role of VAC in operating CBMs to surmount uncertainties and moderate the impact of TIC and MC to reposition MNCs in the GVC, no matter the market instability.
The results of this study provide a reference for MNC managers for the identification and operation of MNCs’ capabilities with the appropriate CBMs. Predictably, the post-COVID-19 era is one of those times when the global economy would be confronted with unprecedented turns, and MNCs, instead of relying solely on innovation and the market, must effectively evaluate and elevate the adequate capability to operate and integrate CBMs adapted to the prevalent condition in view. MNC executives and managers must retained the crucial influences of VAC on TIC and MC and their enhanced impact on the business performance of their corporations.

5. Limitations and Directions for Future Research

This study has certain limitations. First, it focuses on MNCs in the manufacturing industry and does not examine MNCs from other industries, overlooking the consideration that the TIC and MC of MNCs vary with industries. Second, it explores the relationship between various corporation capabilities and MNC performance only from the perspective of CBMs; however, other subsidiary elements also affect MNC performance. Future studies should examine MNCs from different industries in detail and compare them regarding these relationships, adding to examining the relationships among factors in other aspects of MNCs’ profiting from innovation.

Author Contributions

Conceptualization, H.Q., G.K.A. and F.C.; methodology, H.Q.; validation, T.C.; formal analysis, H.Q.; resources, T.C.; writing—original draft preparation, H.Q. and G.K.A.; writing—review and editing, T.C. and F.C.; supervision, F.C. All authors have read and agreed to the published version of the manuscript.

Funding

This research received no external funding.

Institutional Review Board Statement

Not applicable.

Informed Consent Statement

Not applicable.

Data Availability Statement

Not applicable.

Acknowledgments

We would like to express our heartfelt appreciation to Yunlong Duan, Hongli Gao and Zhenyu Huang, for their contribution and support since the conception of this idea up to the completion of this paper. We also want to say thank you Lei Huang for their presence and daily encouragement until this article was written.

Conflicts of Interest

The authors declare no conflict of interest.

References

  1. Demil, B.; Lecocq, X.; Ricart, J.E. Introduction to the SEJ special issue on business models: Business models within the domain of strategic entrepreneurship. Strateg. Entrep. J. 2015, 9, 1–11. [Google Scholar] [CrossRef]
  2. Bei, X. Trademarks, specialized complementary assets, and the external sourcing of innovation. Res. Policy 2019, 48, 103709. [Google Scholar] [CrossRef]
  3. Zott, C.; Amit, R.; Massa, L. The business model: Recent developments and future research. J. Manag. 2011, 37, 1019–1042. [Google Scholar]
  4. Gereffi, G.; Lee, J. Why the world suddenly cares about global supply chains. J. Supply Chain Manag. 2012, 48, 24–32. [Google Scholar] [CrossRef]
  5. Gereffi, G.; Lee, J. Economic and social upgrading in global value chains and industrial clusters: Why governance matters. J. Bus. Ethics 2016, 133, 25–38. [Google Scholar] [CrossRef]
  6. Osiyevskyy, O.; Dewald, J. Explorative versus exploitative business model change: The cognitive antecedents of firm-level responses to disruptive innovation. Strateg. Entrep. J. 2015, 9, 58–78. [Google Scholar] [CrossRef]
  7. Cerulli, G. The impact of technological capabilities on invention: An investigation based on country responsiveness scores. World Dev. 2014, 59, 147–165. [Google Scholar] [CrossRef]
  8. Chesbrough, H.; Rosenbloom, R.S. The role of the business model in capturing value from innovation: Evidence from Xerox corporation’s technology spin- off companies. Ind. Corp. Chang. 2002, 11, 529–555. [Google Scholar] [CrossRef] [Green Version]
  9. Duan, Y.; Huang, L.; Cheng, H.; Yang, L.; Ren, T. The moderating effect of cultural distance on the cross-border knowledge management and innovation quality of multinational corporations. J. Knowl. Manag. 2021, 25, 85–116. [Google Scholar] [CrossRef]
  10. Chin, T.; Hu, Q.; Rowley, C.; Wang, S. Business models in the Asia-Pacific: Dynamic balancing of multiple cultures, innovation and value creation. Asia Pac. Bus. Rev. 2021, 27, 331–341. [Google Scholar] [CrossRef]
  11. Chin, T.; Shi, Y.; Rowley, C.; Meng, J. Csonfucian business model canvas in the Asia Pacific: A Yin-Yang harmony cognition to value creation and innovation. Asia Pac. Bus. Rev. 2021, 27, 342–358. [Google Scholar] [CrossRef]
  12. Anzola-Román, P.; Bayona-Sáez, C.; García-Marco, T. Profiting from collaborative innovation practices: Identifying organizational success factors along the process. J. Manag. Organ. 2019, 25, 239–262. [Google Scholar] [CrossRef] [Green Version]
  13. Hu, Q.; Zhu, T.; Lin, C.-L.; Chen, T.; Chin, T. Corporate social responsibility and firm performance in China’s manufacturing: A global perspective of business models. Sustainability 2021, 13, 2388. [Google Scholar] [CrossRef]
  14. Fang, E.; Zou, S.M. Antecedents and consequences of marketing dynamic capabilities in international joint ventures. J. Int. Bus. Stud. 2009, 40, 742–761. [Google Scholar] [CrossRef]
  15. Han, K.; Mittal, V.; Zhang, Y. Relative Strategic Emphasis and Firm Idiosyncratic Risk: The Moderating Role of Relative Performance and Demand Instability. J. Mark. 2017, 81, 25–44. [Google Scholar] [CrossRef]
  16. Abdelkafi, N.; Täuscher, K. Business models for sustainability from a system dynamics perspective. Organ. Environ. 2016, 29, 74–96. [Google Scholar] [CrossRef]
  17. Figueiredo, P.N. Innovation capability building and learning mechanisms in latecomer firms: Recent empirical contributions and implications for research. Can. J. Dev. Stud. 2012, 33, 14–40. [Google Scholar]
  18. Teece, D.J. Business models, business strategy and innovation. Long Range Plan. 2010, 43, 172–194. [Google Scholar] [CrossRef]
  19. Albino, P.; Dussauge, P.; Shaver, J. Firm non-market capabilities and the effect of supranational institutional safeguards on the location choice of international investments. Strateg. Manag. J. 2018, 39, 2770–2793. [Google Scholar] [CrossRef]
  20. Ceccagnoli, M. Appropriability, preemption and firm performance. Strateg. Manag. J. 2009, 30, 81–98. [Google Scholar] [CrossRef]
  21. Tower, A.P.; Hewett, K.; Saboo, A. Reexamining the tradeoff between value creation and value appropriation: The role of internal organizational resources vs. External strategic international alliances. J. Bus. Res. 2021, 123, 302–312. [Google Scholar] [CrossRef]
  22. Henderson, R.M.; Clark, K.B. Architectural innovation: The reconfiguration of existing product technologies and the failure of established firms. Adm. Sci. Q. 1990, 35, 9–30. [Google Scholar] [CrossRef] [Green Version]
  23. Fan, P. Catching up through developing innovation capability: Evidence from China’s telecom-equipment industry. Technovation 2006, 26, 359–368. [Google Scholar] [CrossRef]
  24. Chesbrough, H.W. Business model innovation: Opportunities and barriers. Long Range Plan. 2010, 43, 354–363. [Google Scholar] [CrossRef]
  25. Mcgahan, A.M.; Silverman, B.S. Profiting from technological innovation by others: The effect of competitor patenting on firm value. Res. Policy 2006, 35, 1222–1242. [Google Scholar] [CrossRef] [Green Version]
  26. Henkel, J.; Baldwin, C.Y.; Shih, W. IP modularity: Profiting from innovation by aligning product architecture with intellectual property. Calif. Manag. Rev. 2013, 55, 65–82. [Google Scholar] [CrossRef] [Green Version]
  27. Lee, K.; Malerba, F. Catch-up cycles and changes in industrial leadership: Windows of opportunity and responses of firms and countries in the evolution of sectoral systems. Res. Policy 2017, 46, 338–351. [Google Scholar] [CrossRef]
  28. Kumaraswamy, A.; Mudambi, R.; Saranga, H.; Tripathy, A. Catch-up strategies in the Indian auto components industry: Domestic firms’ responses to market liberalization. J. Int. Bus. Stud. 2012, 43, 368–395. [Google Scholar] [CrossRef]
  29. Giuliani, E.; Martinelli, A.; Rabellotti, R. Is co-invention expediting technological catch up? A study of collaboration between emerging country firms and EU inventors. World Dev. 2016, 77, 192–205. [Google Scholar] [CrossRef] [Green Version]
  30. Kim, L. Stages of development of industrial technology in a developing country: A model. Res. Policy 1980, 9, 254–277. [Google Scholar] [CrossRef]
  31. Camisón, C.; Villar-López, A. Organizational innovation as an enabler of technological innovation capabilities and firm performance. J. Bus. Res. 2014, 67, 2891–2902. [Google Scholar] [CrossRef]
  32. Hansen, U.E.; Lema, R. The co-evolution of learning mechanisms and technological capabilities: Lessons from energy technologies in emerging economies. Technol. Forecast. Soc. Chang. 2019, 140, 241–257. [Google Scholar] [CrossRef]
  33. Filippetti, A.; Peyrache, A. The patterns of technological capabilities of countries: A dual approach using composite indicators and data envelopment analysis. World Dev. 2011, 39, 1108–1121. [Google Scholar] [CrossRef]
  34. Petralia, S.; Balland, P.A.; Morrison, A. Climbing the ladder of technological development. Res. Policy 2017, 46, 956–969. [Google Scholar] [CrossRef]
  35. Teece, D.J. Profiting from technological innovation: Implications for integration, collaboration, licensing and public policy. Res. Policy 1986, 15, 285–305. [Google Scholar] [CrossRef]
  36. Kuramoto, G.R.; Kindl, D.C.S. Internationalization process and technological capability trajectory of Iguaçu. J. Technol. Manag. Innov. 2012, 7, 117–130. [Google Scholar] [CrossRef] [Green Version]
  37. Fu, X.; Pietrobelli, C.; Soete, L. The role of foreign technology and indigenous innovation in the emerging economies: Technological change and catching-up. World Dev. 2011, 39, 1204–1212. [Google Scholar] [CrossRef] [Green Version]
  38. Guenzi, P.; Troilo, G. Developing marketing capabilities for customer value creation through marketing-sales integration. Ind. Mark. Manag. 2006, 35, 974–988. [Google Scholar] [CrossRef]
  39. Day, G.S. The capabilities of market-driven organizations. J. Mark. 1994, 58, 37–51. [Google Scholar] [CrossRef]
  40. Morgan, N.A.; Vorhies, D.W.; Mason, C.H. Marketing orientation, marketing capabilities, and firm performance. Strateg. Manag. J. 2009, 20, 909–920. [Google Scholar] [CrossRef]
  41. Bodlaj, M.; Coenders, G.; Zabkar, V. Responsive and proactive market orientation and innovation success under market and technological turbulence. J. Bus. Econ. Manag. 2012, 13, 666–687. [Google Scholar] [CrossRef] [Green Version]
  42. Yu, L.; Li, H.; Wang, Z.; Duan, Y. Technology imports and self-innovation in the context of innovation quality. Int. J. Prod. Econ. 2019, 214, 44–52. [Google Scholar] [CrossRef]
  43. Yuan, W.; Bao, Y.; Olson, B.J. CEOs’ ambivalent interpretations, organizational market capabilities, and corporate entrepreneurship as responses to strategic issues. J. World Bus. 2017, 52, 312–326. [Google Scholar] [CrossRef]
Figure 1. The interaction effect of VAC and MC on MNC performance.
Sustainability 13 09812 g001
Figure 2. The interaction effect of VAC and TIC on MNC performance.
Sustainability 13 09812 g002
Table 1. Variables and measurement.
VariablesVariable NameVariable Measurement
Dependent variableMNC performance (MP)Growth rate of profit
Independent variablesTechnological innovation capability (TIC)The number of granted invention patents
Marketing capability (MC)The natural logarithm of sales revenue
Moderating variableValue appropriation capability (VAC)Added value/total output
Control variablesCorporation size (CS)Logarithm of total assets
Corporation age (CA)Difference between measure year and established year
Subsidiary investment model (IM)1 means cross-border mergers and acquisitions, and 0 means others.
Intensity of R&D expenditure investment (RDE)R&D expenditure/main business income
Intensity of R&D human capital investment (RDH)Logarithm of R&D personnel
Herfindahl–Hirschman Index (HHI)The first five major stockholders to own stocks in the proportion of the sum of squares.
Table 2. Descriptive statistics of variables.
VariableMeanP50S.DMin.Max.N
MP19.090.0381.61010.3424.514670
TIC10.275.00014.220.00083.003116
MC21.8921.691.52511.6027.474669
VAC0.2300.1121.482−1.00058.844145
CS22.4522.251.36417.0227.754670
CA16.3816.176.0422.00052.674670
IM0.2100.0000.4080.0001.0004707
RDE0.0250.0210.0270.0001.0404297
RDH15.8712.9612.110.03087.752485
HHI0.0880.0440.1060.0000.7944666
Table 3. Correlation coefficient matrix of variables.
VariablesMPVACTICMCCSCAIMRDERDHHHI
MP1.000
VAC0.053 ***1.000
TIC0.349 ***0.0111.000
MC0.720 ***0.055 ***0.366 ***1.000
CS0.740 ***0.058 ***0.393 ***0.927 ***1.000
CA0.116 ***−0.0050.109 ***0.209 ***0.196 ***1.000
IM0.032 **0.039 **0.0180.039 ***0.065 ***0.024 *1.000
RDE0.007−0.0010.119 ***−0.055 ***−0.096 ***−0.035 **−0.034 **1.000
RDH−0.039 *−0.0070.122 ***−0.204 ***−0.121 ***−0.079 ***−0.0140.360 ***1.000
HHI0.242 ***−0.046 ***0.122 ***0.358 ***0.323 ***0.060 ***0.005−0.053 ***−0.166 ***1.000
Note: *, ** and ***, respectively, indicate that they pass the test at the level of 10%, 5% and 1%.
Table 4. Regression results.
Variables(1)(2)(3)(4)
M1M2M3M4
VAC 0.002 **0.008 ***0.375 ***
(0.001)(0.002)(0.060)
VAC × TIC 0.011 **
(0.000)
TIC 0.001
(0.000)
VAC × MC 1.822 ***
(0.292)
MC 0.021 ***
(0.006)
CS0.678 ***0.017 ***−0.009 *−0.000
(0.069)(0.005)(0.005)(0.007)
CA0.088 ***−0.007 ***0.003 **−0.008 ***
(0.015)(0.001)(0.001)(0.001)
IM−0.091 *−0.001−0.003−0.001
(0.051)(0.003)(0.003)(0.003)
RDE0.301−0.0700.009−0.079
(0.915)(0.060)(0.041)(0.060)
RDH0.0000.0000.0000.000
(0.000)(0.000)(0.000)(0.000)
HHI−2.097 ***−0.046−0.028−0.051
(0.541)(0.036)(0.037)(0.035)
_cons2.529 *−0.223 **0.188 *−0.278 ***
(1.428)(0.100)(0.107)(0.104)
N2478247424012474
R20.1460.0370.0400.061
F55.87910.6764.15614.101
p0.0000.0000.0000.000
Standard errors are in parentheses; *, ** and *** indicate that they pass the test at the levels of 10%, 5% and 1% significance, respectively.
Table 5. Robustness test results.
Variables(1)(2)(3)(4)(5)(6)
M1M2M3M4M5M6
VAC 0.011 ***0.015 *** 0.003 *0.220 ***
(0.000)(0.045) (0.001)(0.057)
VAC × TIC 0.171 *** 0.161 *
(0.000) (0.011)
TIC 0.002 ** 0.006 **
(0.001) (0.004)
VAC × MC 0.314 *** 2.010 ***
(0.002) (0.302)
MC 0.072 *** 0.908 ***
(0.351) (0.444)
CS0.030 *1.157 ***0.991 **0.682 ***1.429 ***0.934 *
(0.016)(0.264)(0.386)(0.194)(1.141)(0.485)
CA0.009 ***0.179 ***0.362 ***−0.088 **2.846 ***0.478 ***
(0.003)(0.066)(0.053)(0.042)(0.283)(0.067)
IM0.012 *−0.063−0.0330.3100.338 *0.130
(0.031)(0.227)(0.242)(0.408)(0.968)(0.303)
RDE0.4811.001 *0.044 **9.7810.8150.655 *
(0.503)(0.606)(0.038)(6.579)(0.973)(0.304)
RDH0.023 *0.028 **0.3090.0010.005 *0.043 *
(0.015)(0.020)(0.984)(0.001)(0.001)(0.031)
HHI0.224−5.207 ***−4.368 ***3.780 *0.559 *−1.486
(0.182)(1.446)(1.607)(2.288)(6.175)(2.016)
_cons−0.191−18.307 ***−6.261−11.865 ***5.468 ***3.661 ***
(0.347)(5.260)(4.949)(4.332)(2.724)(0.291)
N247428543146247428493139
R20.1850.3380.3410.1420.1030.353
F16.0013.2822.2122.9538.32516.200
p0.0140.0000.0000.0010.0000.000
Standard errors are in parentheses; *, ** and *** indicate that they pass the test at the levels of 10%, 5% and 1% significance, respectively.
Publisher’s Note: MDPI stays neutral with regard to jurisdictional claims in published maps and institutional affiliations.

