Article

How to Restrain Regulatory Capture and Promote Green Innovation in China. An Analysis Based on Evolutionary Game Theory

School of Economics and Management, Harbin Engineering University, Harbin 150001, China
Sustainability 2021, 13(17), 9752; https://doi.org/10.3390/su13179752
Submission received: 22 July 2021 / Revised: 13 August 2021 / Accepted: 24 August 2021 / Published: 30 August 2021

Abstract

:
In response to severe environmental challenges, green innovation (GI) has been thoroughly considered by various governments. Although China has promulgated many environmental policies to promote environmental governance, regulatory capture and the lack of independent external supervisors lead to a challenging future. This study employs an evolutionary game method to explore how the policy burden and media affect decision-making between local governments and manufacturing enterprises. On this basis, the simulation method is used to examine critical factors that affect regulatory capture and GI. The results show that the policy burden is the main factor that causes regulatory capture. When the policy burden exceeds a certain threshold, it will cause regulatory capture and hinder GI. Moreover, media, as an external supervisor, can restrain regulatory capture and promote GI significantly. Specifically, when the capacity of media supervision is high enough, due to the positive role of the media, it will inhibit the negative effects of policy burdens. Finally, combined with the different development stages of China’s green industry, the corresponding policy recommendations are given. These results extend the research of regulatory capture and provide a reference for governments to promote environmental governance in practice.

1. Introduction

The Covid-19 pandemic is the worst public health and economic crisis in a century. On 14 August 2021, around 4,348,600 people had died from Covid-19 across the world. Governments all over the world shut down economic activities in response to the global pandemic, leading to massive jobs losses and a global economic crisis. The only highlight in this foreboding picture is that the economic decline has reduced environmental impacts [1]. Significantly, as the biggest developing country globally, China has achieved remarkable economic development over the past 40 years. Even in 2020, the worst period of the pandemic, China’s GDP increased by 2.3 % , acceding one trillion yuan for the first time. However, the economic growth of China comes at the cost of the environment [2,3]. According to statistics from the Ministry of Ecology and Environment of the People’s Republic of China, in 2020, there were 135 cities whose urban air was not qualified according to the Technical Regulation for Ambient Air Quality Assessment of China (HJ 663—2013), accounting for 40.1 % of 337 monitoring cities. The number of days when the air quality of 337 monitoring cities reached severe pollution was 1497, and the total sewage discharge volume was 57.6 billion cubic meters. These wastes have caused severe environmental problems and hindered the achievement of sustainable development goals. Therefore, during post-Covid-19 recoveries, it is necessary to restore the economy without simply restoring old environmental degradation patterns.
Green growth is the most widely accepted solution to stop environmental degradation [4]. In addition, the authors of Li and Zeng [5] propose that green innovation (GI) is an essential measure to realize green growth. The value of GI on achieving sustainable development goals is increasingly recognized in recent years [6]. Promoting GI is also the fundamental requirement of China’s 14th Five-Year Plan. Notwithstanding that the central government has put the sustainable development goals at the heart of policy-making, formulating several environmental policies, the overall efficiency of environmental governance does not meet expectations. The GI of manufacturing industries is insufficient, and the phenomenon of illegally discharging pollutants continues to repeat, making the effects of policies into question. Why does this phenomenon occur? According to Stigler’s research, regulatory capture is the process through which the regulated monopolies end up manipulating the state agencies that are suppose to control them [7]. When the phenomenon of regulatory capture occurs, a special interest is prioritized over the general interests of the public, leading to policy inefficiency and affecting R&D [8].
China is deepening the reform of environmental management and strengthening decentralization of environmental governance. Under this system of environmental management, the local government owns primacy in environmental governance [9]. However, whether the local government implements environmental policies as public needs is to a large extent connected with the promotion mechanism of local officials [10]. Local officials are not only responsible for environmental governance, but also undertaking multiple policy burdens such as achieving economic growth targets, maintaining employment rate, etc. [11]. Because the promotion of officials is closely related to economic growth targets [12], and the better the local economy develops, the higher the likelihood of officials being promoted [13]. In this case, manufacturing enterprises can utilize policy burdens local governments undertake to manipulate regulatory process and force local officials to lax supervision on manufacturing enterprises’ environmental behaviors, thus leading to regulatory capture. To restrain regulatory capture, external specialized agencies, such as the media, are proposed to supervise the regulatory process and deal with information asymmetry [11,14].
Therefore, how to increase the efficiency of environmental governance? What impacts do policy burdens and media have on regulatory capture and GI? What are the evolutionary paths of local governments and manufacturing enterprises decision-making behaviours under different levels of policy burdens and media supervisory capacity in environmental governance? Based on these questions, this research aims to enrich and improve the theoretical study of the regulatory capture, and has important practical significance for promoting GI, enhancing the efficiency of environmental governance, and achieving sustainable development goals. The research contributions of this paper are as follows. The first contribution is extending the research of regulatory capture and proving the negative effect of policy burdens on regulatory capture. Additionally, this paper fills a gap for the potential impact of external supervisory agencies, such as media, on restraining regulatory capture and GI. Ultimately, it helps governments make better decisions to promote environmental governance.
The rest is structured as follows. Section 2 gives a literature review. In Section 3, the evolutionary game model has been established to analyze evolutionary mechanisms of environmental governance. Section 4 presents the results of numerical simulation and discussion. Conclusions and implications are provided in Section 5.

2. Literature Review

2.1. The Development of Regulatory Capture Theory

Downs [15] gives the foundation of the modern “capture” theory of political behavior. In Downs’s view, private interests are willing to put regulations into effect by persuasion, campaign contributions, or other political action to benefit their interests. Stigler [7] claims that although a policy is set up to prevent monopoly, the economic interest may use the public resources and powers by providing officials with political votes and bribery to benefit their economic status. And Posner [16] claims that even though the priority of the policy formulation is for public interests, due to the influence of regulated interests, the policy ends up being ‘captured’ by private interests it should discipline.
Peltzman is not satisfied with Stigler’s conclusion that the regulatory agencies only serve a single economic interest. Based on Stigler’s idea, Peltzman [17] incorporates multiple interest groups into the regulatory decision model and shows the effect of the supply-demand relationship between producers and consumers on regulatory behavior, indicating that regulatory behaviors are often affected by interactions among multiple interest groups. Notwithstanding the introduction of multiple interests theory makes the research on regulation capture breakthrough the quantitative limit of a single subject, it is hard to explain the phenomenon of collective regulation capture in real life. Also, multiple interest theory ignores informational asymmetries.
Laffont and Tirole [18] consider the informational asymmetries, bring the demand and the supply side together, and develop an agency-theoretic approach. Laffont points out that the regulatory structure is two-tiered: agency (the supervisor) and Congress (the principle). There exist informational asymmetries between the principal (Congress) and the supervisor (agency). The agency can obtain the information from the enterprises and report to Congress. Therefore, interest groups can collude with the agency to retain specific kinds of information. In this case, the agency may conceal information for personal gains and only report the information beneficial to the enterprises to Congress, thus forming collective regulation captures. The framework of “regulatory authority-the agency-multiple interest groups” makes the theory of regulatory capture breakthroughs in the limits of organizational boundaries, and to a certain extent, provides theoretical guidance for the practice of weakening of the regulatory capture in Western countries in the last century.

2.2. The Affecting Factors of Regulatory Capture

Local governments generally have policy burdens such as promoting economic development and maintaining employment rates [19]. When manufacturing companies do not carry out GI and violate environmental regulations to discharge pollution, as long as manufacturing enterprises’ revenue is highly related to the local economy and employment, they can use policy burdens they undertake to intervene in the regulatory process, making it difficult for local governments to impose strict penalties on enterprises and even provide cover and shelter for them [11]. Shen et al. [20] use the instrumental variable method to examine the effect of central government’s behaviors of setting economic development goals on the regional GI, indicating that the economic development goals have significant inhibitory effects on regional green technology innovation, and the inhibitory effect is more prominent in cities with faster economic growth and over-fulfillment of economic development goals. As a result, environmental problems are getting worse, and the development of GI is hindered.
The negative effect of policy burdens on regulatory capture not only occurs in environmental governance but also in other fields. We take state-owned enterprises as an example. KORNAI* [21] proposes a concept called “soft budget constraint” when analyzing the socialist economy and thinks soft budget constraints will bring about many problems in the economy, such as the moral hazard of managers, which cause the operation inefficiency of enterprises. Since state-owned enterprises undertake policy burdens such as protecting industries, maintaining social stability, and stimulating economic development, the government has to rescue loss-making state-owned enterprises by increasing financial subsidies, giving loans support, reducing taxes, and so on [19].
The central government of China has found out the built-in “environmentally unfriendly” policy burdens in the cadre performance system and promulgated environmental regulations such as the “Leading Officials’ Accountability Audit of Natural Resource” and incorporated the environmental performance into the performance evaluation of local officials. However, the overall policy efficiency needs to be improved. Feng et al. [22] explore the relationship of Accountability Audit of Natural Resource and political promotion in China and show that to some extent, the accountability can decrease the dependence on the traditional “political tournament mechanism”. Wu and Cao [23] show the link between pollution control and the promotion of officials, but this kind of link only exists at the county level, not at the municipal and provincial level.
Scholars also indicate that the external supervisory agency, such as media, can restrain regulatory capture [24,25,26,27]. Laffont and Meleu [24] study the reciprocal supervision in an institution with one principal and two agents. This study shows that the information exchange between two agents may hurt the principal, and such a dual supervisory structure enhances the possibility of collusion, indicating that the principal should have a third party be the supervisor to avoid regulatory capture. Fremeth and Holburn [25] propose that the information asymmetries between regulators and enterprises increase the costs of setting up new policies, and information asymmetry can be reduced through previous regulatory experience, knowledge gained from interest groups, or information from other supervisory institutions. Gong et al. [26] suggest allowing and protecting media reports and encouraging the establishment of private supervision institutions can reduce the asymmetry of information. Gao et al. [27] indicate the positive effect of media in promoting government information disclosure in environmental accidents. Grafton and Williams [28] show that the evidence of regulatory capture in the Murray-Darling Basin stems from a 2017 media investigation of water theft in the northern Murray-Darling Basin.

2.3. The Affecting Factors of GI

GI is a process that contributes to the creation of new products and technologies intending to reduce environmental degradation [29], and GI includes innovation in energy conservation, pollution prevention, waste recycling, green product design, and environmental management [30]. Many scholars have evaluated the affecting factors of GI. From the perspective of enterprises, green R & D expenditure [31,32], top management [33,34,35,36,37], organizational culture and employee [37,38,39], corporate profitability [40], and knowledge sharing [41,42,43] are main factors which affect the GI. From the perspective of market, market demands [36,44], the demand of customers and the stakeholders [36,40,45], and market competition [32,36,46] are main factors affecting GI. From the perspective of government, government support [47,48], environmental regulations [49,50,51,52,53] and policy burdens [20] are the main factors that affect the outcome of GI.
The government’s strong macro-control capabilities of China are extremely effective in promoting GI [47,52]. Thus, this study mainly focuses on the perspective of government. Many scholars prove that environmental regulation positively affects GI [49,50,52]. However, sometimes environmental regulations are inefficient and even inhibiting the occurrence of GI [10,51,53]. The regulatory capture theory shows that due to the government’s multiple goals and official’ personal incentives, the regulated enterprises may influence the regulatory agency and officials through bribery and other methods and ultimately lead to inefficiency of the regulation [7,16]. Therefore, based on the regulatory capture theory, research on restraining regulatory capture and improving the efficiency of environmental governance is of great significance to promote GI.

2.4. Evolutionary Game Theory in Environmental Governance

Evolutionary game theory is an effective tool for modeling decision-making process [54], providing a mathematical solution to the conflict and cooperation of stakeholders [55,56]. Besides, evolutionary game theory considers the bounded rationality of stakeholders [57] and the dynamics of the decision-making process [58], which is conducive for analyzing the evolutionary mechanism of decision-making related to environmental governance.
Many researchers have used the evolutionary game theory to study the decision-making process of the government and enterprises in environmental governance. Wang et al. [59] establish an evolutionary game model to analyze the decision-making process between the government that manages environmental pollution and the firm that generates contamination and suggest using a dynamic penalty to control the environmental pollution. Zhang et al. [60] construct an evolutionary game model to analyze the impacts of government policies on manufacturers’ choices of green innovation mode, declaring carbon tax and innovation subsidy may facilitate radical innovation. Similarly, Zhao and Bai [61] adopt evolutionary game theory to investigate the effect of different government policies on motivating the producers’ green innovation. Sheng et al. [62] employ evolutionary game theory to analyze the strategical choices among the central government, local governments, and enterprises under different environmental regulations. Moreover, this study claims that increased default penalties and compliance incentives are the most effective for environmental governance. However, these studies consider the government as the only supervisor of environmental governance.
Further, Gao et al. [27] examine the role of social media on information disclosure of environmental incidents through evolutionary game theory. The results indicate that social media can affect information disclosure of environmental incidents through top-down intervention and bottom-up reputation mechanisms. Chen et al. [63] use evolutionary game theory to model the relationship among government, enterprise, and the public in environmental governance and prove public participation significantly promotes the control of industrial wastes. The authors of Xu et al. [64] build the tripartite evolutionary game model to explore the strategical choices among governments, environmental services companies, and pollutant discharging enterprises. The results show that the “public-private-partnership” governance system and administrative penalties are the key points to the governance of environmental pollution. However, these studies all tacitly assume that the government can effectively implement environmental policies and promote GI. The scenarios where government policies fail due to regulatory capture have not yet been discussed. Further, the role of policy burdens in regulatory capture is not verified.

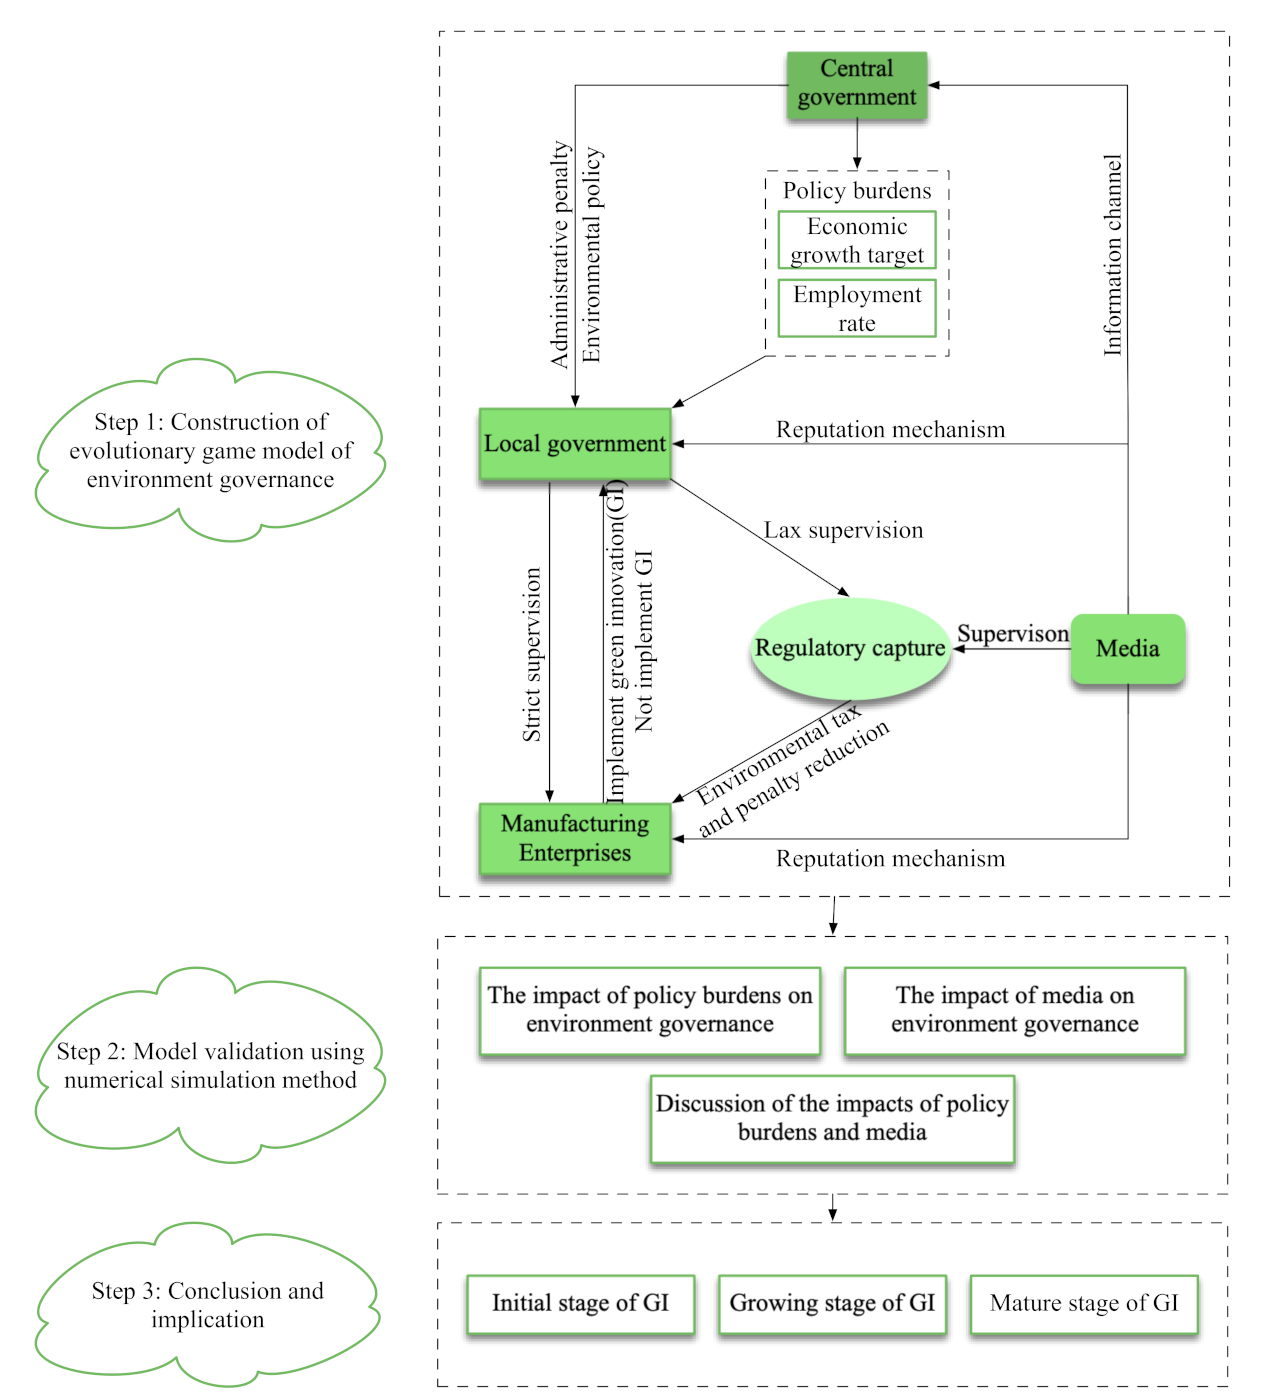
2.5. Toward and Analytical Framework

In the process of environmental governance, regulatory capture between local governments and manufacturing enterprises will influence their willingness to solve environmental problems. To fix this issue, restraining regulatory capture and promoting GI through systematic studies is urgent for achieving sustainable development goals.
To sum up, previous studies theoretically analyzed the impact of policy burdens on regulatory capture and the connection between regulatory capture and GI. Multiple studies also show that the external supervisory agency, such as the media, can participate in the supervisory process of environmental governance and deal with the information asymmetry between the public and the government, thereby decreasing the negative effect of policy burdens and restraining regulatory capture. However, it is still necessary to verify the impacts of policy burdens and media on the decision-making process of local governments and manufacturing enterprises.
Based on existing research, the paper uses evolutionary game theory to explore how the policy burdens and media reshape the decision-making between local governments and manufacturing enterprises in environmental governance. Then, this study has revealed the behavioral change between local governments and manufacturing enterprises through numerical simulation. Besides, we have discussed the difference between the impacts of policy burdens and media on environmental behaviors. Ultimately, combined with the different development stages of China’s green industry, the corresponding policy recommendations are given.
As shown in Figure 1, the process of environmental governance includes the following main bodies: central government, local government, manufacturing enterprises, and media. Central government formulates environmental policies, economic growth targets, and employment rate targets. The local government undertakes policy burdens, implements environmental policies, and supervises the environmental behaviors of manufacturing enterprises. Manufacturing enterprises undertake tasks of providing jobs, paying taxes, and implementing green innovations. The media is responsible for supervising the decision-making process and exposing information to the public and central government.
Manufacturing enterprises choose to implement GI or not implement GI. The local government decides to strictly supervise manufacturing or lax supervision. The decision of lax supervision represents that due to policy burdens, the implementation of environmental policies has been affected, resulting in regulatory capture. The local economy and employment are highly dependent on manufacturing enterprises. Implementing GI requires a lot of R&D investment, and the return of green innovation is lagging, which will affect the company’s operations and revenues in the short term. As a result, the regional economy and employment rate will suffer losses. The authors of Cherry et al. [65] find that public opposition to the efficiency-enhancing environmental tax is a significant barrier to addressing environmental challenges. Thus, as the primary supervisor of environmental governance, the local government should support the R&D of GI by environmental tax deduction. Besides, as the main implementer of environmental governance, manufacturing enterprises can implement GI to get a competitive advantage, achieving long-term development [46].
At the same time, the media can participate in environmental governance in two ways. First, the media participates in the environmental governance by reputation mechanism [27]. The reputation mechanism of media is that the media can realize its supervisory function by influencing the reputation of governments, enterprises, or individuals [66]. Second, media will act as an information channel of the central government, expose information to the central government and introduce administrative penalties from the central government [27]. In particular, the media judges whether regulatory capture exists by checking local environmental improvement and the application and authorization of green patents for manufacturing enterprises. Therefore, only when manufacturing enterprises choose not to implement GI, the media has a chance to find regulatory capture.

3. Research Method

3.1. Main Assumptions and Variables

Based on the above discussion, there exist a lot of stakeholders in the process of environmental governance. From the perspective of participating subjects of environmental governance, the key assumptions are proposed in this paper.
Assumption 1.
In the decision-making, there are two game players, which are local governments and manufacturing enterprises [59].
Assumption 2.
Manufacturing enterprises can choose strategy g 1 to implement GI, or choose strategy n 1 not to implement GI [61]. Similarly, the local government can choose strategy g 2 to strictly supervise manufacturing enterprises or choose strategy n 2 to lax supervision [63]. Because the game players have the characteristics of bounded rationality and limited information [67], they cannot always make the decision that maximizes their own interests.
Assumption 3.
Local economy and employment is highly dependent on manufacturing enterprises [63]. When the government strictly supervise manufacturing enterprises, the operation and revenue of enterprises will be affected. As a result, the regional economy will suffer losses L 1 . We assume the government’s supervision costs are C 1 [68]. The value of L 1 represents the policy burdens of the local government. When the government chooses lax supervision, there is a β probability of finding manufacturing enterprises not to implement GI, β ( 0 , 1 ) [69].
Assumption 4.
When manufacturing companies do not implement GI, the local government will impose penalties P 1 per unit of pollutants on manufacturing enterprises [68]. In this case, the revenue of manufacturing enterprises is fixed as R 1 [61]. Manufacturing enterprises will discharge Q unites of pollutants during producing process. For every unit of pollutant, manufacturing enterprises need to pay environmental tax t [70]. When manufacturing enterprises implement GI, manufacturing enterprises can reduce q joins of contaminants. However, GI usually requires R & D expenditures, which will increase the cost of manufacturing enterprises. Besides, the local government will give environmental tax reductions to manufacturing enterprises that implement GI. This study assumes that the R & D expenditures are C 2 per unit of pollutant [61], and the ratio of environmental tax reduction is γ, γ ( 0 , 1 ) [65].
Assumption 5.
Due to technical limitations, media has a φ probability of finding manufacturing enterprises and governments’ regulatory capture [27]. The φ represents the capacity of media supervision. Besides, media supplement the government’s supervisory role, reducing the cost of supervision. In this case, we assume that the government’s supervision cost is C 3 , the loss of manufacturing enterprises’ reputation is L 2 , the profit of manufacturing enterprises’ reputation is R 2 , the local government’s reputation loss is L 3 [27], and the penalties from the central government are P 2 [71].
Table 1 is the description of the main parameters.
Suppose the proportions of manufacturing enterprises who have chosen to implement GI or not implement GI are x and 1 x respectively, x 0 , 1 , and suppose that the proportions of local governments who have chosen strict supervision and lax supervision are y and 1 y respectively, y 0 , 1 . The payoff matrix of manufacturing enterprises and the local government are shown in Table 2, where Φ 1 = R 1 + φ R 2 q C 2 ( 1 γ ) t ( Q q ) , Φ 2 = ( 1 γ ) t ( Q q ) + φ C 3 C 1 L 1 , Φ 3 = R 1 + φ R 2 q C 2 β ( 1 γ ) t ( Q q ) , Φ 4 = β ( 1 γ ) t ( Q q ) + φ C 3 β C 1 β L 1 , Φ 5 = R 1 t Q P 1 Q φ L 2 , Φ 6 = t Q + P 1 Q + φ C 3 C 1 L 1 , Φ 7 = R 1 β t Q β P 1 Q φ L 2 , and Φ 8 = β t Q + β P 1 Q + φ C 3 β C 1 β L 1 φ L 3 φ P 2 .

3.2. Analysis of Evolutionary Stability Strategy under Media Participation

3.2.1. Evolutionary Process

Supposed the E 11 is the expected profits of manufacturing enterprises when they choose strategy g 1 , E 12 is the expected profits of manufacturing enterprises when they choose strategy n 1 , and E 1 ¯ is average expected profits of manufacturing enterprises. The equations are shown below:
E 11 = y Φ 1 + ( 1 y ) Φ 3
E 12 = y Φ 5 + ( 1 y ) Φ 7
E 1 ¯ = x E 11 + ( 1 x ) E 12
In the process of the evolutionary game, the replicator dynamic equation for manufacturing enterprises is defined as Equation (4).
F ( x ) = d x d t = x ( 1 x ) E 11 E 12 = x ( 1 x ) y ( Φ 1 Φ 3 Φ 5 + Φ 7 ) + Φ 3 Φ 7
Supposed the E 21 is the expected profits of the local government when they choose strategy g 2 , E 22 is the expected profits of the local government when they choose strategy n 2 , and E 2 ¯ is average expected profits of the local government. The equation are shown below:
E 21 = x Φ 2 + ( 1 x ) Φ 6
E 22 = x Φ 4 + ( 1 x ) Φ 8
E 2 ¯ = y E 21 + ( 1 y ) E 22
In the process of the evolutionary game, the replicator dynamic equation for the local government is defined as Equation (8).
F ( y ) = d y d t = y ( 1 y ) E 21 E 22 = y ( 1 y ) x ( Φ 2 Φ 4 Φ 6 + Φ 8 ) + Φ 6 Φ 8
Then, the two-dimensional dynamic system is established as Equation (9).
F ( x ) = d x d t = x ( 1 x ) E 11 E 12 = x ( 1 x ) y ( Φ 1 Φ 3 Φ 5 + Φ 7 ) + Φ 3 Φ 7 F ( y ) = d y d t = y ( 1 y ) E 21 E 22 = y ( 1 y ) x ( Φ 2 Φ 4 Φ 6 + Φ 8 ) + Φ 6 Φ 8
When F ( x ) = 0 , and F ( y ) = 0 , we have x = 0 , x = 1 , x = Φ 6 + Φ 8 Φ 2 Φ 4 Φ 6 + Φ 8 y = 0 , y = 1 , y = Φ 3 + Φ 7 Φ 1 Φ 3 Φ 5 + Φ 7 . Therefore, dynamic system has five evolutionary equilibrium points, which are (0,0), (0,1), (1,0), (1,1), and ( x , y ).

3.2.2. Evolutionary Equilibrium Stability Analysis

According to FRIEDMAN [72], we can establish a Jacobian matrix J of the dynamic system and use the determinant and trace of the matrix to determine manufacturing enterprises and the government’s evolutionary equilibrium strategy. The Jacobian matrix J, the determinant, and trace of the matrix are obtained by Equations (10)–(12). Only when d e t J > 0 , t r J < 0 , the evolutionary equilibrium point is asymptotically stable. In addition, since t r J = 0 , the evolutionary equilibrium point ( x , y ) does not have asymptotic stability.
J = F ( x ) x F ( x ) y F ( y ) x F ( y ) y = ( 1 2 x ) y ( Φ 1 Φ 3 Φ 5 + Φ 7 ) + Φ 3 Φ 7 x ( 1 x ) ( Φ 1 Φ 3 Φ 5 + Φ 7 ) y ( 1 y ) ( Φ 2 Φ 4 Φ 6 + Φ 8 ) ( 1 2 y ) x ( Φ 2 Φ 4 Φ 6 + Φ 8 ) + Φ 6 Φ 8
d e t J = ( 1 2 x ) y ( Φ 1 Φ 3 Φ 5 + Φ 7 ) + Φ 3 Φ 7 ( 1 2 y ) x ( Φ 2 Φ 4 Φ 6 + Φ 8 ) + Φ 6 Φ 8 x ( 1 x ) ( Φ 1 Φ 3 Φ 5 + Φ 7 ) y ( 1 y ) ( Φ 2 Φ 4 Φ 6 + Φ 8 )
t r J = ( 1 2 x ) y ( Φ 1 Φ 3 Φ 5 + Φ 7 ) + Φ 3 Φ 7 + ( 1 2 y ) x ( Φ 2 Φ 4 Φ 6 + Φ 8 ) + Φ 6 Φ 8
When the local government chooses strategy g 2 , we assume Δ A = Φ 1 Φ 5 , which represents the manufacturing enterprises’ profits difference between strategy g 1 and n 1 . When the local government chooses strategy n 2 , we assume Δ B = Φ 3 Φ 7 , which represents the manufacturing enterprises’ profits difference between strategy g 1 and n 1 . Similarly, we assume Δ C = Φ 2 Φ 4 , and Δ D = Φ 6 Φ 8 , representing the local government’s profits difference between strategy g 2 and n 2 when manufacturing enterprises choose strategy g 1 and n 1 separately. The evolutionary stability strategy(ESS) depends on the symbol judgment of the above four equations. Besides, it is easy to prove Δ A > Δ B , Δ C < Δ D . Therefore, according to the different symbols of the equation, it can evolve into the following nine scenarios.
Scenario 1.
When Δ A > 0 , Δ B > 0 , Δ C > 0 , Δ D > 0 , the result of the local stability analysis is in Table 3. As shown in Table 3, (0,0) is an unstable points. (0,1) and (1,0) are saddle points. Point (1,1) represents the evolutionary stability strategy(ESS) in the dynamic system, which indicates that under Scenario 1, manufacturing enterprises will implement GI, and the local government will strictly supervise manufacturing enterprises.
Scenario 2.
When Δ A > 0 , Δ B > 0 , Δ C < 0 , Δ D > 0 , the result of the local stability analysis is in Table 3. As shown in Table 3, (0,0) is an unstable point. (0,1) and (1,1) are saddle points. Point (1,0) represents the evolutionary stability strategy(ESS) in the dynamic system, which indicates that under Scenario 2, manufacturing enterprises will implement GI, and the local government will choose lax supervision.
Scenario 3.
When Δ A > 0 , Δ B > 0 , Δ C < 0 , Δ D < 0 , the result of the local stability analysis is in Table 3. As shown in Table 3, (0,1) is an unstable point. (0,0) and (1,1) are saddle points. Point (1,0) represents the evolutionary stability strategy(ESS) in the dynamic system, which indicates that under Scenario 3, manufacturing enterprises will implement GI, and the local government will choose lax supervision.
Scenario 4.
When Δ A > 0 , Δ B < 0 , Δ C > 0 , Δ D > 0 , the result of the local stability analysis is shown in Table 4. As shown in Table 4, (1,0) is an unstable point. (0,0) and (0,1) are saddle points. Point (1,1) represents the evolutionary stability strategy(ESS) in the dynamic system, which indicates that under Scenario 4, manufacturing enterprises will implement GI, and the local government will strictly supervise manufacturing enterprises.
Scenario 5.
When Δ A > 0 , Δ B < 0 , Δ C < 0 , Δ D > 0 , the result of the local stability analysis is shown in Table 4. As shown in Table 4, (0,0), (0,1), (1,0) and (1,1) are all saddle points. When the local government chooses to strictly supervise manufacturing enterprises, the profits of implementing GI are greater than that of maintaining the original production. When the local government chooses lax supervision, the profits of implementing GI are less than that of maintaining the original production. Therefore, manufacturing enterprises’ strategy choice depends on the local government’s strategy. When manufacturing enterprises maintain the original production, the profits of strict supervision are greater than that of lax supervision. When manufacturing enterprises implement GI, the profits of strict supervision are less than that of lax supervision. Therefore, the local government’s strategy choice depends on manufacturing enterprises’ strategy. In this case, the strategy choices of both players of the game will continue to change so that they cannot converge on a particular point of equilibrium.
Scenario 6.
When Δ A > 0 , Δ B < 0 , Δ C < 0 , Δ D < 0 , the result of the local stability analysis is shown in Table 4. As shown in Table 4, (0,1) is an unstable point. (1,0) and (1,1) are saddle points. Point (0,0) represents the evolutionary stability strategy(ESS) in the dynamic system, which indicates that under Scenario 6, manufacturing enterprises will not implement GI, and the local government will choose lax supervision.
Scenario 7.
When Δ A < 0 , Δ B < 0 , Δ C > 0 , Δ D > 0 , the result of the local stability analysis is shown in Table 5. As shown in Table 5, (1,0) is an unstable points. (0,0) and (1,1) are saddle points. Point (0,1) represents the evolutionary stability strategy(ESS) in the dynamic system, which indicates that under Scenario 7, manufacturing enterprises will not implement GI, and the local government will strictly supervise manufacturing enterprises.
Scenario 8.
When Δ A < 0 , Δ B < 0 , Δ C < 0 , Δ D > 0 , the result of the local stability analysis is shown in Table 5. As shown in Table 5, (1,1) is an unstable point. (0,0) and (1,0) are saddle points. Point (0,1) represents the evolutionary stability strategy (ESS) in the dynamic system, which indicates that under Scenario 8, manufacturing enterprises will not implement GI, and the local government will strictly supervise manufacturing enterprises.
Scenario 9.
When Δ A < 0 , Δ B < 0 , Δ C < 0 , Δ D < 0 , the result of the local stability analysis is shown in Table 5. As shown in Table 5, (1,1) is an unstable point. (0,1) and (1,0) are saddle points. Point (0,0) represents the evolutionary stability strategy(ESS) in the dynamic system, which indicates that under Scenario 9, manufacturing enterprises will not implement GI, and the local government will choose lax supervision.
Based on the theory of industry life cycle [73,74], this study divides the life cycle of GI development into three stages: initial stage, growing stage, and mature stage.
In the initial stage, the R&D cost of GI is high, but the return of GI is low. If the local government strictly supervises manufacturing enterprises and puts administrative penalties on them, it will further decrease the willingness of enterprises to implement GI. Thus, Scenario 9 represents the initial stage of GI, corresponding to ESS (0,0). In this stage, manufacturing enterprises will not implement GI, and the local governments will choose lax supervision.
In the growing stage of GI, the resources and industrial chains of the GI industry are integrated. Although the return of GI is gradually increasing, the overall profits of implementing GI and strict supervision still lack stability, leading to periodic fluctuations of strategy combination between local governments and manufacturing enterprises at this stage. Thus, Scenario 2, Scenario 3, Scenario 4, Scenario 5, Scenario 6, Scenario 7, and Scenario 8 represent the growing stage of GI, corresponding to ESS (0,1), ESS (1,0), and ESS (1,1). This means that the GI development depends on the strength of the cooperation between local governments and manufacturing enterprises.
In the mature stage, the green industry has formed scale benefits. With the adjustment of environmental policies, the local government and manufacturing enterprises can achieve a win-win based on market rules. Thus, Scenario 1 represents the mature stage of GI, corresponding to ESS (1,1). All of the main bodies of environmental governance evolve in the direction of restraining regulatory capture and promoting GI at this stage. When GI and related industry has developed to a certain scale and formed a completely sustainable development system, the development of GI will enter a mature stage.

3.3. Simulation

The numerical simulation is a dynamic method that can intuitively display the strategic choices of evolutionary game players and help policymakers understand the potential effects of critical factors on the decision-making process [71]. Therefore, to validate the above theoretical results more intuitively, this study uses numerical simulations to test the impacts of policy burdens and media on the decision-making between local governments and manufacturing enterprises. Policy burdens and media supervision are considered as the critical factors that affect the efficiency of environmental policies. The evolutionary state of the strategic choice of game players with different policy burdens and media supervisory capabilities can be graphically demonstrated by numerical simulations. Thus, this paper simulates the evolutionary game between manufacturing enterprises and the local government and analyzes the impacts of policy burdens and media on regulatory capture and GI.
We set the parameter values through discussion and calculation to satisfy the conditions of nine scenarios [27]. The reasonable values of the parameters are shown in Table 6. Specifically, it is hard to quantify policy burdens and the capacity of media supervision. Therefore, we use experimental values to study how policy burdens and media affecting the decision-making process. As Table 6 says, the revenue of maintaining original production R 1 = 10 , so the loss of local economy will not be over 10, L 1 0 , 10 . Besides, limited by capacities of media supervision, the probability for media of finding regulatory capture φ 0 , 1 .
After setting the parameter value range of policy burdens and media supervisory capacities, we consult experts in related fields to divide the value of policy burdens and media supervisory capacities into three levels: low-level, middle-level, and high-level. By summarizing experts’ suggestions and numerical calculations, we set the demarcation line for policy burdens of low-level and mid-level to 4 and the demarcation line of mid-level and high-level to 7. For media supervisory capacities, the demarcation line of low-level and mid-level is 0.4, and the demarcation line of mid-level and high-level is 0.7. Finally, as Table 7 says, we determine the different value ranges of policy burdens and media supervisory capacities and complete the parameter settings corresponding to nine scenarios.

4. Results

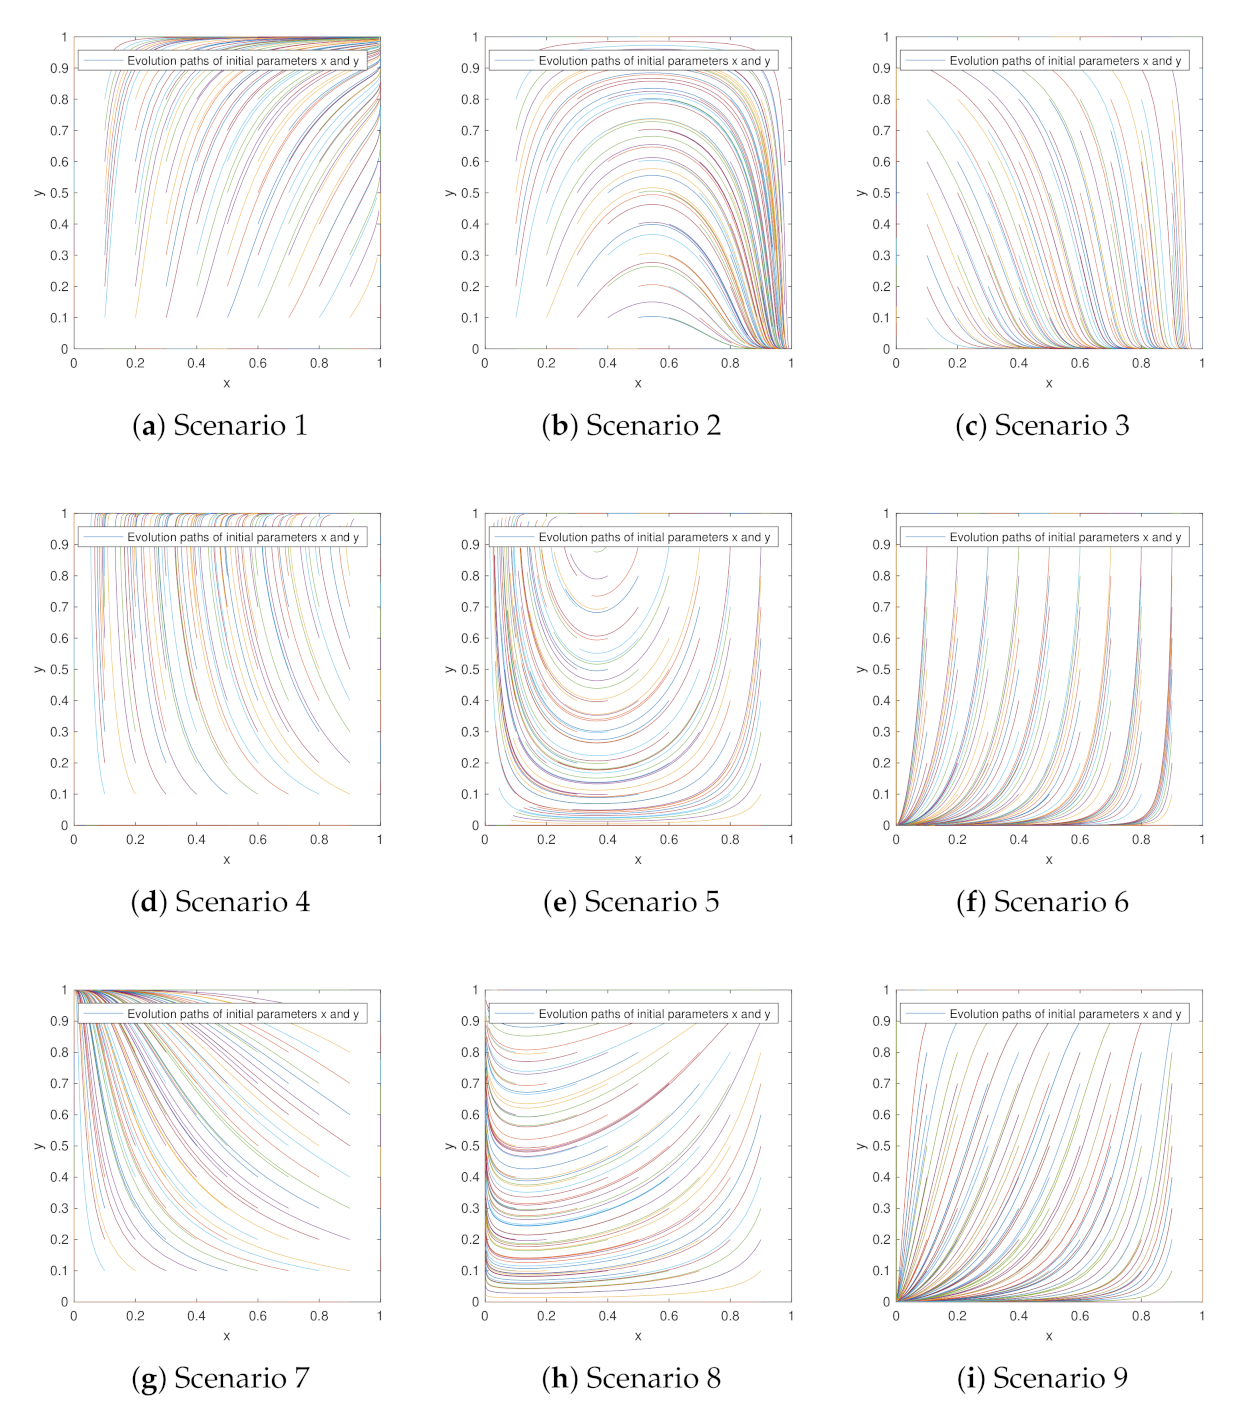
4.1. Initial Game Strategy

According to different circumstances in the initial stage, experimental values are set. The dynamic evolution paths of local governments and manufacturing enterprises are shown in Figure 2. In the initial stage, the different exploration values are used to analyze ideological changes of the initial game strategy under the nine scenarios.
The equilibrium points gather to (1,1) in Scenario 1 and Scenario 4, which means that the probability of strict supervision and implementing GI will gradually approach (1,1) over time. The equilibrium points gather to (0,0) in Scenario 6 and Scenario 9. It implies that local governments and manufacturing enterprises will eventually evolve into the strategies (Lax supervision, Not implement GI). However, the equilibrium points can not evolve to a specific point in Scenario 5, which means that the strategies of local governments and manufacturing enterprises are periodic fluctuating. The equilibrium points gather to (0,1) in Scenario 7 and Scenario 8. In this case, manufacturing enterprises will not implement GI because of high GI costs and low returns, and local governments will choose lax supervision for policy burdens. The equilibrium points gather to (1,0) in Scenario 2, Scenario 3. It indicates that manufacturing enterprises will implement GI as the return of GI increases, and local governments will choose lax supervision to avoid economic losses. Based on the above simulation analysis, we find that local governments and manufacturing enterprises will continuously adjust their strategies corresponding to different circumstances in the decision-making process, which is consistent with the dynamics and bounded rationality of evolutionary game theory.
In order to estimate the influences of policy burdens and media on the decision-making of local governments and manufacturing enterprises, Scenario 5 is used as a simulation experiment environment.

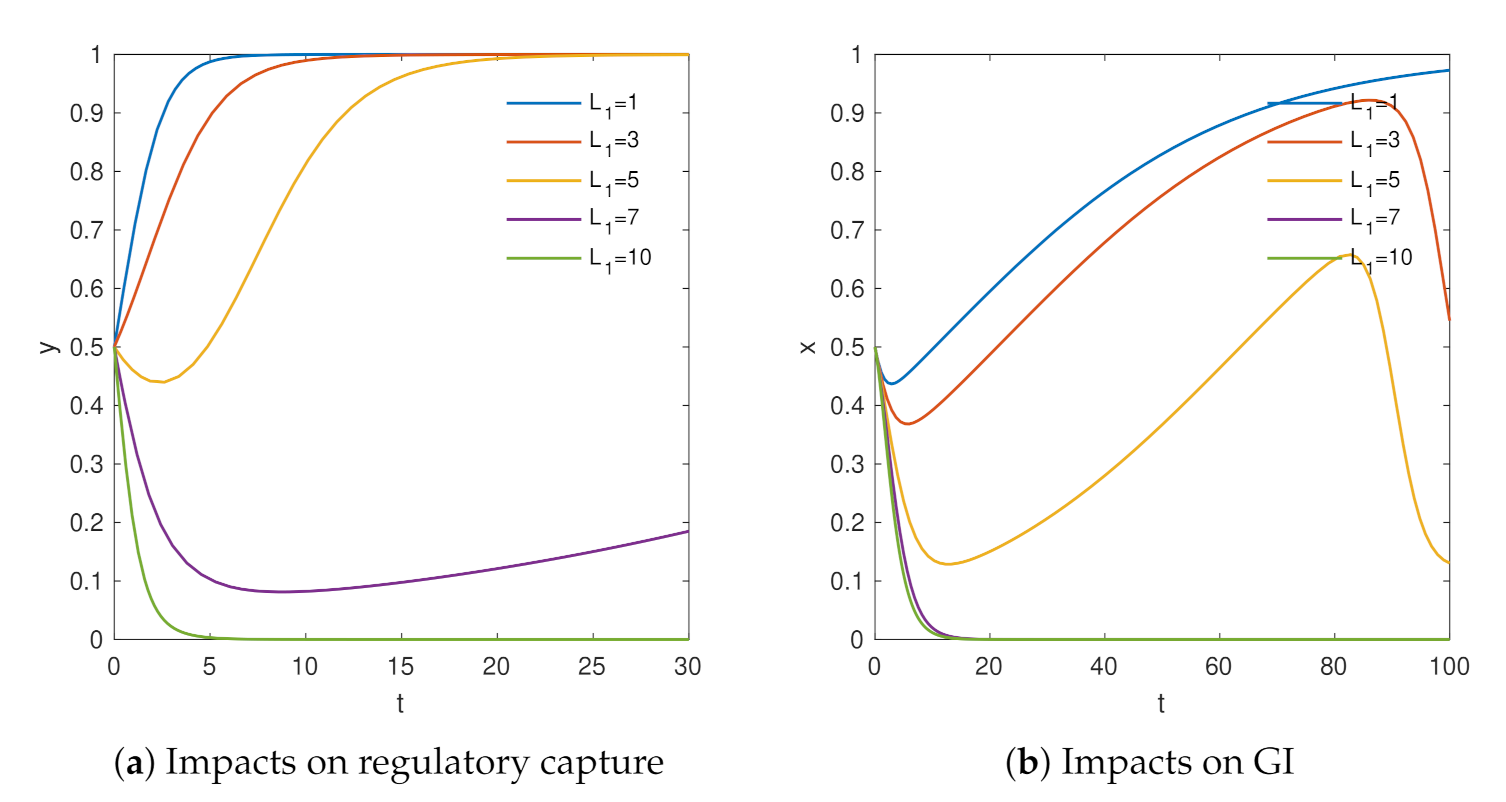
4.2. The Impacts of Policy Burdens on Environmental Governance

Policy burdens are considered as the critical factor of regulatory capture in China. Figure 3 clearly shows the estimated impacts of low [ 0 , 4 ] , middle ( 4 , 7 ] and high ( 7 , 10 ] levels for policy burdens on environmental governance. As is shown in Figure 3, when the policy burden is 1, the strategic combination of local governments and manufacturing enterprises evolve to (strict supervision, implement GI). When the policy burden is 3 or 5, local governments will still choose strict supervision. However, manufacturing enterprises will not implement GI. As policy burdens increase to a high level, the environmental governance is hindered, namely x and y gradually tend to 0. In other words, policy burdens can necessarily lead to regulatory capture and hinder the development of GI.
To sum up, when policy burdens reach a certain threshold (over 7), the phenomenon of regulatory capture will occur, and local governments will choose lax supervision. When policy burdens reach a certain threshold (over 3), the GI can be effectively hindered in manufacturing enterprises, which is consistent with the research finding of Gong et al. [11], Shen et al. [20], which point out policy burdens can cause regulatory capture and hinder green innovation.

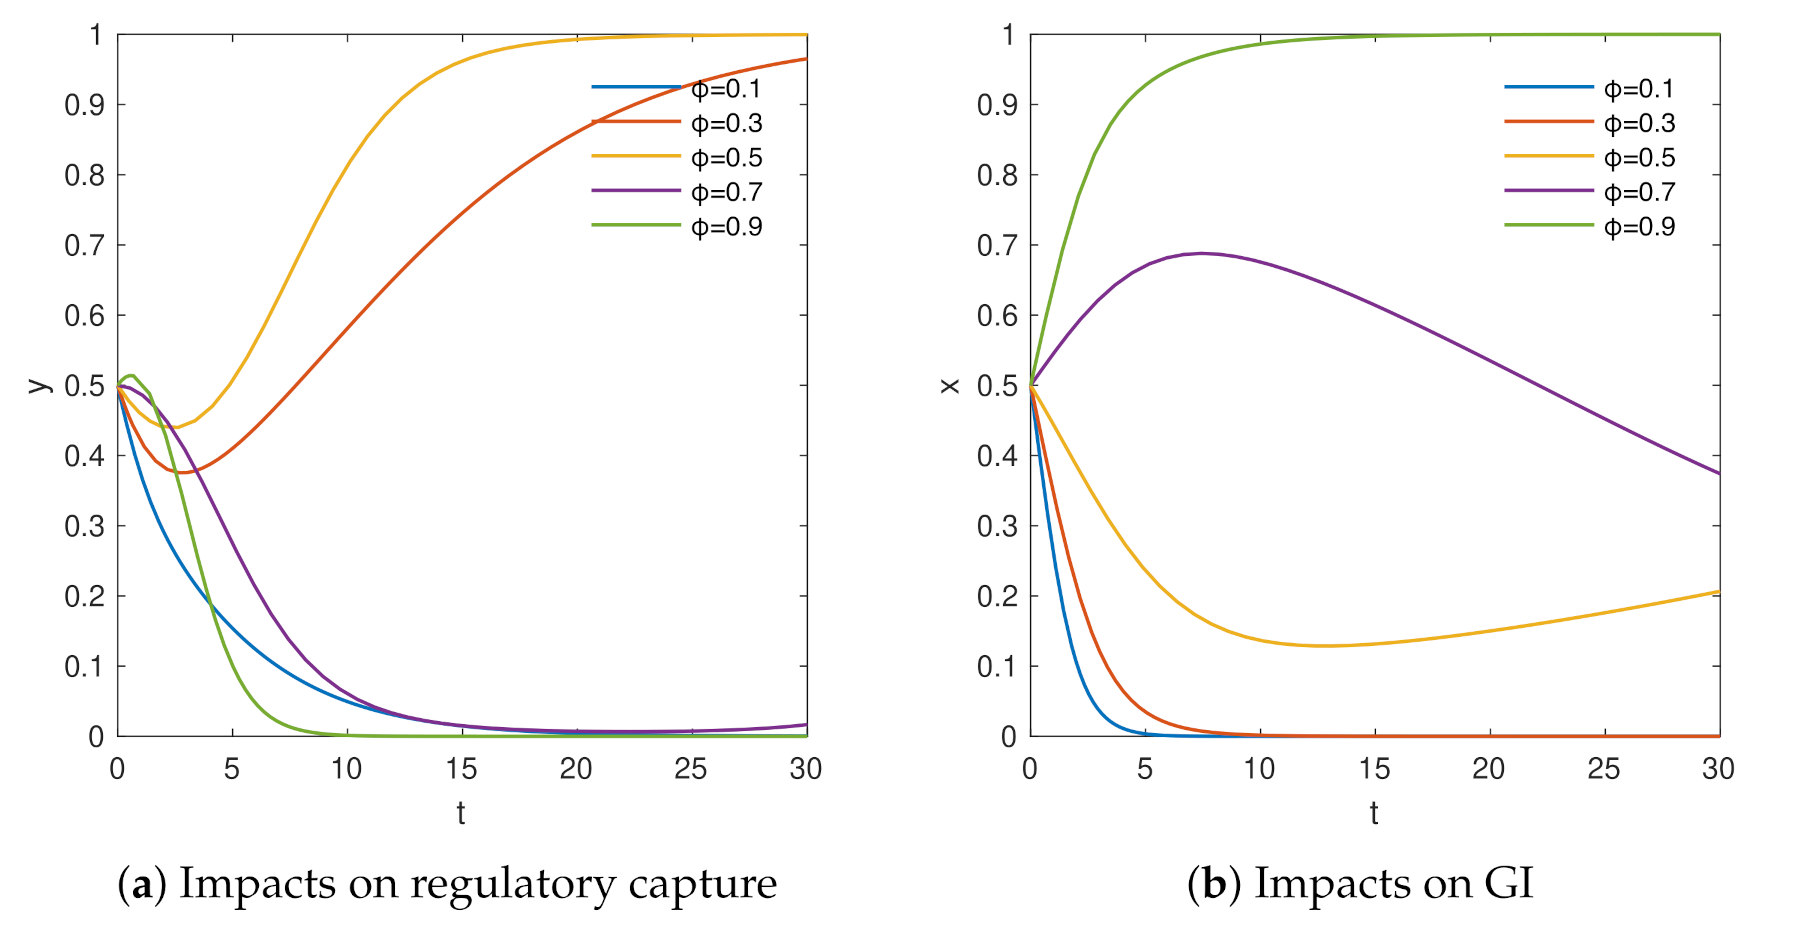
4.3. The Impacts of Media on Environmental Governance

Figure 4 clearly shows the estimated impacts of low [ 0 , 0.4 ] , middle ( 0.4 , 0.7 ] and high ( 0.7 , 1 ] levels for media on environmental governance. As is shown in Figure 4, when the media is 0.1, the strategic combination of local governments and manufacturing enterprises evolve to (Lax supervision, Not implement GI). When the capacity of media supervision increases to 0.3 or 0.5, the strategy of local governments will change to strict supervision. However, manufacturing enterprises will still choose not to implement GI. As media supervisory capacity continues to increase, the strategy of manufacturing enterprises will evolve to implement GI. However, regulatory capture occurs under this circumstance, and local governments will choose lax supervision. To sum up, when media reach a certain threshold (over 0.7), then the GI can be effectively promoted in manufacturing enterprises. This is consistent with the research finding of Li et al. [40], Xiang et al. [75], which point out media can promote GI. However, only when the capacity of media supervision is within a certain range of values can the media suppress regulatory capture. This research finding complements the research finding of Laffont and Meleu [24], Fremeth and Holburn [25].

4.4. Comparison of Media’s and Policy Burden’s Effects

Figure 5 clearly shows the estimated impacts of media on environmental governance when policy burdens are at a high level and the estimated effects of policy burdens on environmental governance when the capacity of media supervision is at a high level. As is shown in Figure 5, when policy burdens are at a high level, no matter how the capacity of media improves, the phenomenon of regulatory capture will occur, and local governments will choose lax supervision. When media reach a certain threshold (over 0.7), the GI can still be effectively promoted in manufacturing enterprises. However, when the capacity of media supervision is at a high level, the phenomenon of regulatory capture still occurs, and local governments will choose lax supervision with policy burdens increasing. To sum up, policy burdens can restrain the positive effect of media and cause regulatory capture. Media can restrain the negative effect of policy burdens and promote GI.

5. Conclusions and Implications

In this paper, the evolutionary game method is used to analyze the impact of these factors on the decision-making of manufacturing enterprises and the local government. The main goal is to investigate the impacts of policy burdens and media on environmental governance. The conclusions and implications are as follows:

5.1. Conclusions

Policy burdens affect the decision-making process mainly by involving the local government’s strategic choice. When policy burdens of the local government reach a certain threshold (over 7), the phenomenon of regulatory capture occurs, and the local government will choose lax supervision, indicating that policy burdens cause regulatory capture. When policy burdens reach a threshold (over 3), the GI can be effectively hindered in manufacturing enterprises. Besides, policy burdens restrain the positive effect of media and cause regulatory capture.
Media affect the decision-making process mainly by involving manufacturing enterprises’ strategic choices. When media reach a certain threshold (over 0.7), the GI can be effectively promoted. However, only when the capacity of media supervision is within a specific range of values can the media suppress regulatory capture. We speculate that the reason for this phenomenon is that the high capacity of media supervision can reduce the government’s supervision costs, and to a certain extent, weaken the government’s willingness to supervise, which leads to regulatory capture. Further, when the capacity of media is high enough, due to the positive role of the media in promoting GI, it will inhibit the negative effects of regulatory capture and promote GI.

5.2. Implication for Theory and Practice

This study has contributed to both the theory and practice for environmental governance. In theory, we develop a two-party evolutionary game model which puts media as an external supervisory agency into the model to study the impacts of the external supervisory on regulatory capture, and the research findings complement the research finding of Laffont and Meleu [24], Fremeth and Holburn [25]. Moreover, this study finds the interaction between policy burdens and media and identifies the key factors affecting regulatory capture and GI separately.
In practice, the year 2021 is the beginning of the 14th Five-Year Plan of China. Achieving sustainable development goals is the core requirement of China’s 14th Five-Year Plan. Thus, according to the characteristics of industry development, environmental governance suggestions in the different development stages are proposed, as shown in Figure 6.
In the initial stage of GI, the central government should start with redesigning the official promotion system, reducing the “environmentally unfriendly” policy burdens embedded in the cadre performance system, and increasing the proportion of environmental performance in the performance appraisal of local officials. Besides, the government should increase the transparency of government affairs and regularly disclose the amount of corporate environmental tax payments, penalties for enterprises that do not implement GI, and establish efficient channels to allow the media and the public to participate in the supervision of environmental governance.
In the growing stage of GI, the GI industry has gradually developed. The return of GI is increasing but lacks stability. To promote GI, the local government should optimize the development of the green market through environmental incentive policies, provide sufficient subsidies and further decrease the costs of R&D for GI by environmental tax deduction. Further, manufacturing enterprises should strengthen their ability of R&D, accelerate the process of green transformation, and regularly report the application and authorization of green innovation to the public. Besides, manufacturing enterprises can also conduct green innovation research through cooperation with scientific research institutions, thereby eliminating R&D thresholds and reducing costs.
In the mature stage of GI, given the green industry has formed scale benefits, more pressure from media is conducive to restraining regulatory capture and promoting GI. The media should enhance its social credibility and responsibility first. On this basis, the media should improve their supervisory capacities and ensure an objective and fair position in performing its supervisory function. Further, when revealing the situation of environmental governance, the media must make a comprehensive disclosure, not to avoid the good and not to miss the bad. Any judgments by media must be supplemented by solid information and documents and can withstand repeated scrutiny in logical argumentation. Only in this case can the media better exert its supervisory capacities and promote environmental governance.
However, this paper only discusses one external supervisor. In the real world, residents and some civil organizations are also dominant supervisors affecting the decision-making process of the local government and manufacturing enterprises. Therefore, further research is needed.

Funding

This research received no external funding.

Institutional Review Board Statement

Not applicable.

Informed Consent Statement

Not applicable.

Conflicts of Interest

The author declares no conflict of interest.

References

  1. Sachs, J.; Schmidt-Traub, G.; Kroll, C.; Lafortune, G.; Fuller, G.; Woelm, F. Sustainable Development Report 2020: The Sustainable Development Goals and COVID-19 Includes the SDG Index and Dashboards; Cambridge University Press: Cambridge, UK, 2021. [Google Scholar]
  2. Tang, J.; Wang, Q.; Choi, G. Efficiency assessment of industrial solid waste generation and treatment processes with carry-over in China. Sci. Total Environ. 2020, 726, 138274. [Google Scholar] [CrossRef] [PubMed]
  3. Hu, S.; Zeng, G.; Cao, X.; Yuan, H.; Chen, B. Does Technological Innovation Promote Green Development? A Case Study of the Yangtze River Economic Belt in China. Int. J. Environ. Res. Public Health 2021, 18, 6111. [Google Scholar] [CrossRef]
  4. Fischer-Kowalski, M.; Swilling, M.; Von Weizsacker, E.U.; Ren, Y.; Moriguchi, Y.; Crane, W.; Krausmann, F.K.; Eisenmenger, N.; Giljum, S.; Hennicke, P.; et al. Decoupling: Natural Resource use and Environmental Impacts from Economic Growth; Technical Report; United Nations Environment Programme: Nairobi, Kenya, 2011. [Google Scholar]
  5. Li, D.; Zeng, T. Are China’s intensive pollution industries greening? An analysis based on green innovation efficiency. J. Clean. Prod. 2020, 259, 120901. [Google Scholar] [CrossRef]
  6. Chen, X.; Yi, N.; Zhang, L.; Li, D. Does institutional pressure foster corporate green innovation? Evidence from China’s top 100 companies. J. Clean. Prod. 2018, 188, 304–311. [Google Scholar] [CrossRef]
  7. Stigler, G.J. The theory of economic regulation. Bell J. Econ. Manag. Sci. 1971, 2, 3–21. [Google Scholar] [CrossRef]
  8. Dal Bó, E. Regulatory capture: A review. Oxf. Rev. Econ. Policy 2006, 22, 203–225. [Google Scholar] [CrossRef]
  9. Sigman, H. Transboundary spillovers and decentralization of environmental policies. J. Environ. Econ. Manag. 2005, 50, 82–101. [Google Scholar] [CrossRef] [Green Version]
  10. Wu, H.; Hao, Y.; Ren, S. How do environmental regulation and environmental decentralization affect green total factor energy efficiency: Evidence from China. Energy Econ. 2020, 91, 104880. [Google Scholar] [CrossRef]
  11. Gong, Q.; Lei, L.; Yuan, Y. Policy burden, regulation capture and food safety. Econ. Res. J 2015, 8, 4–15. [Google Scholar]
  12. Zhou, L.A. Governing China’s Local Officials: An Analysis of Promotion Tournament Model. Econ. Res. J. 2007, 7, 36–50. [Google Scholar]
  13. Li, H.; Zhou, L.A. Political turnover and economic performance: The incentive role of personnel control in China. J. Public Econ. 2005, 89, 1743–1762. [Google Scholar] [CrossRef]
  14. Laffont, J.J.; Martimort, D. Transaction costs, institutional design and the separation of powers. Eur. Econ. Rev. 1998, 42, 673–684. [Google Scholar] [CrossRef]
  15. Downs, A. An economic theory of political action in a democracy. J. Political Econ. 1957, 65, 135–150. [Google Scholar] [CrossRef]
  16. Posner, R. Theories of Economic Regulation. Bell J. Econ. 1974, 5, 335–358. [Google Scholar] [CrossRef] [Green Version]
  17. Peltzman, S. Toward a more general theory of regulation. J. Law Econ. 1976, 19, 211–240. [Google Scholar] [CrossRef]
  18. Laffont, J.J.; Tirole, J. The politics of government decision-making: A theory of regulatory capture. Q. J. Econ. 1991, 106, 1089–1127. [Google Scholar] [CrossRef]
  19. Lin, J.Y.; Li, Z. Policy burden, privatization and soft budget constraint. J. Comp. Econ. 2008, 36, 90–102. [Google Scholar] [CrossRef]
  20. Shen, F.; Liu, B.; Luo, F.; Wu, C.; Chen, H.; Wei, W. The effect of economic growth target constraints on green technology innovation. J. Environ. Manag. 2021, 292, 112765. [Google Scholar] [CrossRef] [PubMed]
  21. KORNAI*, J. The soft budget constraint. Kyklos 1986, 39, 3–30. [Google Scholar] [CrossRef]
  22. Feng, Y.; Wang, X.; Hu, S. Accountability audit of natural resource, air pollution reduction and political promotion in China: Empirical evidence from a quasi-natural experiment. J. Clean. Prod. 2020, 287, 125002. [Google Scholar] [CrossRef]
  23. Wu, M.; Cao, X. Greening the career incentive structure for local officials in China: Does less pollution increase the chances of promotion for Chinese local leaders? J. Environ. Econ. Manag. 2021, 107, 102440. [Google Scholar] [CrossRef]
  24. Laffont, J.J.; Meleu, M. Reciprocal supervision, collusion and organizational design. Scand. J. Econ. 1997, 99, 519–540. [Google Scholar] [CrossRef]
  25. Fremeth, A.R.; Holburn, G.L. Information asymmetries and regulatory decision costs: An analysis of US electric utility rate changes 1980–2000. J. Law Econ. Organ. 2012, 28, 127–162. [Google Scholar] [CrossRef]
  26. Gong, Q.; Zhang, Y.; Yu, J. Incentives, information and food safety regulation. Econ. Res. J. 2013, 3, 135–147. [Google Scholar]
  27. Gao, S.; Ling, S.; Liu, W. The role of social media in promoting information disclosure on environmental incidents: An evolutionary game theory perspective. Sustainability 2018, 10, 4372. [Google Scholar] [CrossRef] [Green Version]
  28. Grafton, R.Q.; Williams, J. Rent-seeking behaviour and regulatory capture in the Murray-Darling Basin, Australia. Int. J. Water Resour. Dev. 2020, 36, 484–504. [Google Scholar] [CrossRef]
  29. Castellacci, F.; Lie, C.M. A taxonomy of green innovators: Empirical evidence from South Korea. J. Clean. Prod. 2017, 143, 1036–1047. [Google Scholar] [CrossRef] [Green Version]
  30. Luo, Q.; Miao, C.; Sun, L.; Meng, X.; Duan, M. Efficiency evaluation of green technology innovation of China’s strategic emerging industries: An empirical analysis based on Malmquist-data envelopment analysis index. J. Clean. Prod. 2019, 238, 117782. [Google Scholar] [CrossRef]
  31. Yin, S.; Zhang, N.; Li, B. Enhancing the competitiveness of multi-agent cooperation for green manufacturing in China: An empirical study of the measure of green technology innovation capabilities and their influencing factors. Sustain. Prod. Consum. 2020, 23, 63–76. [Google Scholar] [CrossRef]
  32. Wakeford, J.J.; Gebreeyesus, M.; Ginbo, T.; Yimer, K.; Manzambi, O.; Okereke, C.; Black, M.; Mulugetta, Y. Innovation for green industrialisation: An empirical assessment of innovation in Ethiopia’s cement, leather and textile sectors. J. Clean. Prod. 2017, 166, 503–511. [Google Scholar] [CrossRef]
  33. Arena, C.; Michelon, G.; Trojanowski, G. Big egos can be green: A study of CEO hubris and environmental innovation. Br. J. Manag. 2018, 29, 316–336. [Google Scholar] [CrossRef]
  34. Burki, U.; Dahlstrom, R. Mediating effects of green innovations on interfirm cooperation. Australas. Mark. J. (AMJ) 2017, 25, 149–156. [Google Scholar] [CrossRef]
  35. Ebrahimi, P.; Mirbargkar, S.M. Green entrepreneurship and green innovation for SME development in market turbulence. Eurasian Bus. Rev. 2017, 7, 203–228. [Google Scholar] [CrossRef]
  36. Dangelico, R.M. Green product innovation: Where we are and where we are going. Bus. Strategy Environ. 2016, 25, 560–576. [Google Scholar] [CrossRef]
  37. Roy, M.; Khastagir, D. Exploring role of green management in enhancing organizational efficiency in petro-chemical industry in India. J. Clean. Prod. 2016, 121, 109–115. [Google Scholar] [CrossRef]
  38. Stanovcic, T.; Pekovic, S.; Bouziri, A. The effect of knowledge management on environmental innovation: The empirical evidence from France. Balt. J. Manag. 2015, 10, 413–431. [Google Scholar] [CrossRef]
  39. Su, Y.; Yu, Y.Q. Spatial agglomeration of new energy industries on the performance of regional pollution control through spatial econometric analysis. Sci. Total Environ. 2020, 704, 135261. [Google Scholar] [CrossRef] [PubMed]
  40. Li, D.; Zheng, M.; Cao, C.; Chen, X.; Ren, S.; Huang, M. The impact of legitimacy pressure and corporate profitability on green innovation: Evidence from China top 100. J. Clean. Prod. 2017, 141, 41–49. [Google Scholar] [CrossRef] [Green Version]
  41. Martínez-Ros, E.; Kunapatarawong, R. Green innovation and knowledge: The role of size. Bus. Strategy Environ. 2019, 28, 1045–1059. [Google Scholar] [CrossRef]
  42. Wong, S.K.S. Environmental requirements, knowledge sharing and green innovation: Empirical evidence from the electronics industry in China. Bus. Strategy Environ. 2013, 22, 321–338. [Google Scholar] [CrossRef]
  43. Su, Y.; Jiang, X.; Lin, Z. Simulation and Relationship Strength: Characteristics of Knowledge Flows Among Subjects in a Regional Innovation System. Sci. Technol. Soc. 2021. [Google Scholar] [CrossRef]
  44. Braun, E.; Wield, D. Regulation as a means for the social control of technology. Technol. Anal. Strateg. Manag. 1994, 6, 259–272. [Google Scholar] [CrossRef]
  45. Lin, H.; Zeng, S.; Ma, H.; Qi, G.; Tam, V.W. Can political capital drive corporate green innovation? Lessons from China. J. Clean. Prod. 2014, 64, 63–72. [Google Scholar] [CrossRef]
  46. Chiou, T.Y.; Chan, H.K.; Lettice, F.; Chung, S.H. The influence of greening the suppliers and green innovation on environmental performance and competitive advantage in Taiwan. Transp. Res. Part E Logist. Transp. Rev. 2011, 47, 822–836. [Google Scholar] [CrossRef]
  47. Li, Z.; Liao, G.; Wang, Z.; Huang, Z. Green loan and subsidy for promoting clean production innovation. J. Clean. Prod. 2018, 187, 421–431. [Google Scholar] [CrossRef]
  48. Xu, X.; Zhang, W.; Wang, T.; Xu, Y.; Du, H. Impact of subsidies on innovations of environmental protection and circular economy in China. J. Environ. Manag. 2021, 289, 112385. [Google Scholar] [CrossRef]
  49. Porter, M.E.; Van der Linde, C. Toward a new conception of the environment-competitiveness relationship. J. Econ. Perspect. 1995, 9, 97–118. [Google Scholar] [CrossRef]
  50. Hamamoto, M. Environmental regulation and the productivity of Japanese manufacturing industries. Resour. Energy Econ. 2006, 28, 299–312. [Google Scholar] [CrossRef]
  51. Lanoie, P.; Patry, M.; Lajeunesse, R. Environmental regulation and productivity: Testing the porter hypothesis. J. Prod. Anal. 2008, 30, 121–128. [Google Scholar] [CrossRef]
  52. Rubashkina, Y.; Galeotti, M.; Verdolini, E. Environmental regulation and competitiveness: Empirical evidence on the Porter Hypothesis from European manufacturing sectors. Energy Policy 2015, 83, 288–300. [Google Scholar] [CrossRef] [Green Version]
  53. Albrizio, S.; Kozluk, T.; Zipperer, V. Environmental policies and productivity growth: Evidence across industries and firms. J. Environ. Econ. Manag. 2017, 81, 209–226. [Google Scholar] [CrossRef]
  54. Cardell, J.B.; Hitt, C.C.; Hogan, W.W. Market power and strategic interaction in electricity networks. Resour. Energy Econ. 1997, 19, 109–137. [Google Scholar] [CrossRef]
  55. Leyton-Brown, K.; Shoham, Y. Essentials of game theory: A concise multidisciplinary introduction. Synth. Lect. Artif. Intell. Mach. Learn. 2008, 2, 1–88. [Google Scholar] [CrossRef] [Green Version]
  56. Nagarajan, M.; Sošić, G. Game-theoretic analysis of cooperation among supply chain agents: Review and extensions. Eur. J. Oper. Res. 2008, 187, 719–745. [Google Scholar] [CrossRef]
  57. Taylor, P.D.; Jonker, L.B. Evolutionary stable strategies and game dynamics. Math. Biosci. 1978, 40, 145–156. [Google Scholar] [CrossRef]
  58. Smith, J.M.; Price, G.R. The logic of animal conflict. Nature 1973, 246, 15–18. [Google Scholar] [CrossRef]
  59. Wang, H.; Cai, L.; Zeng, W. Research on the evolutionary game of environmental pollution in system dynamics model. J. Exp. Theor. Artif. Intell. 2011, 23, 39–50. [Google Scholar] [CrossRef]
  60. Zhang, S.; Yu, Y.; Zhu, Q.; Qiu, C.M.; Tian, A. Green innovation mode under carbon tax and innovation subsidy: An evolutionary game analysis for portfolio policies. Sustainability 2020, 12, 1385. [Google Scholar] [CrossRef] [Green Version]
  61. Zhao, X.; Bai, X. How to motivate the producers’ green innovation in WEEE recycling in China?–An analysis based on evolutionary game theory. Waste Manag. 2021, 122, 26–35. [Google Scholar] [CrossRef]
  62. Sheng, J.; Zhou, W.; Zhu, B. The coordination of stakeholder interests in environmental regulation: Lessons from China’s environmental regulation policies from the perspective of the evolutionary game theory. J. Clean. Prod. 2020, 249, 119385. [Google Scholar] [CrossRef]
  63. Chen, Y.; Zhang, J.; Tadikamalla, P.R.; Gao, X. The relationship among government, enterprise, and public in environmental governance from the perspective of multi-player evolutionary game. Int. J. Environ. Res. Public Health 2019, 16, 3351. [Google Scholar] [CrossRef] [Green Version]
  64. Xu, R.; Wang, Y.; Wang, W.; Ding, Y. Evolutionary game analysis for third-party governance of environmental pollution. J. Ambient Intell. Humaniz. Comput. 2019, 10, 3143–3154. [Google Scholar] [CrossRef]
  65. Cherry, T.L.; Kallbekken, S.; Kroll, S. The acceptability of efficiency-enhancing environmental taxes, subsidies and regulation: An experimental investigation. Environ. Sci. Policy 2012, 16, 90–96. [Google Scholar] [CrossRef] [Green Version]
  66. Kölbel, J.F.; Busch, T.; Jancso, L.M. How media coverage of corporate social irresponsibility increases financial risk. Strateg. Manag. J. 2017, 38, 2266–2284. [Google Scholar] [CrossRef]
  67. Gsottbauer, E.; Van den Bergh, J.C. Environmental policy theory given bounded rationality and other-regarding preferences. Environ. Resour. Econ. 2011, 49, 263–304. [Google Scholar] [CrossRef] [Green Version]
  68. Zhu, Q.H.; Dou, Y.J. Evolutionary game model between governments and core enterprises in greening supply chains. Syst. Eng.-Theory Pract. 2007, 27, 85–89. [Google Scholar] [CrossRef]
  69. Chen, J.; Hua, C.; Liu, C. Considerations for better construction and demolition waste management: Identifying the decision behaviors of contractors and government departments through a game theory decision-making model. J. Clean. Prod. 2019, 212, 190–199. [Google Scholar] [CrossRef]
  70. Chen, W.; Hu, Z.H. Using evolutionary game theory to study governments and manufacturers’ behavioral strategies under various carbon taxes and subsidies. J. Clean. Prod. 2018, 201, 123–141. [Google Scholar] [CrossRef]
  71. Du, L.; Feng, Y.; Lu, W.; Kong, L.; Yang, Z. Evolutionary game analysis of stakeholders’ decision-making behaviours in construction and demolition waste management. Environ. Impact Assess. Rev. 2020, 84, 106408. [Google Scholar] [CrossRef]
  72. Friedman, D. Evolutionary games in economics. Econometrica 1991, 59, 637–666. [Google Scholar] [CrossRef] [Green Version]
  73. Audretsch, D.B.; Feldman, M.P. Innovative clusters and the industry life cycle. Rev. Ind. Organ. 1996, 11, 253–273. [Google Scholar] [CrossRef]
  74. Tavassoli, S. Innovation determinants over industry life cycle. Technol. Forecast. Soc. Chang. 2015, 91, 18–32. [Google Scholar] [CrossRef] [Green Version]
  75. Xiang, X.; Liu, C.; Yang, M.; Zhao, X. Confession or justification: The effects of environmental disclosure on corporate green innovation in China. Corp. Soc. Responsib. Environ. Manag. 2020, 27, 2735–2750. [Google Scholar] [CrossRef]
Figure 1. Analytic framework.
Sustainability 13 09752 g001
Figure 2. Game dynamic evolution paths under the initial parameters.
Sustainability 13 09752 g002
Figure 3. The impacts of policy burdens on decision-making between local governments and manufacturing enterprises.
Sustainability 13 09752 g003
Figure 4. The impacts of media on decision-making between local governments and manufacturing enterprises.
Sustainability 13 09752 g004
Figure 5. The comparison between impacts of policy burdens and media on decision-making process between local governments and manufacturing enterprises.
Sustainability 13 09752 g005
Figure 6. Environmental governance policy in the different stage.
Sustainability 13 09752 g006
Table 1. The description of the main parameters.
VariableDescriptionReferences
R 1 the revenue of maintaining original productionZhao and Bai [61]
P 1 the penalty per unit of pollutantsZHU and DOU [68]
R 2 the profit of the manufacturing enterprises’ reputationGao et al. [27]
P 2 the penalty from central governmentGao et al. [27]
C 1 the cost of government’s supervisionZHU and DOU [68]
C 2 R & D expenditures per unit of reduced pollutantsZhao and Bai [61]
C 3 the cost of government’s supervision with media participationGao et al. [27]
tthe environmental tax per unit of the pollutantsChen and Hu [70]
L 1 the lose of the local economyChen et al. [63]
β the probability for the local government of finding manufacturingDu et al. [71]
enterprises not implement green innovation(GI)
L 2 the loss of manufacturing enterprises’ reputationGao et al. [27]
γ the ratio of environmental tax reductionCherry et al. [65]
L 3 the loss of the local government’s reputationGao et al. [27]
φ the probability for media of finding regulatory captureGao et al. [27]
Table 2. The utility matrix under media participation.
Manufacturing EnterprisesThe Local Government
Strict Supervision ( y ) Lax Supervision ( 1 y )
Implement GI ( x ) Φ 1 , Φ 2 Φ 3 , Φ 4
Not Implement GI ( 1 x ) Φ 5 , Φ 6 Φ 7 , Φ 8
Table 3. Local stability analysis of Scenario 1 to Scenario 3.
( x , y ) Scenario 1 Scenario 2 Scenario 3
detJ trJ Results detJ trJ Results detJ trJ Results
(0,0)++Unstable++UnstableNSaddle point
(0,1)NSaddle pointNSaddle point++Unstable
(1,0)NSaddle point+ESS+ESS
(1,1)+ESSNSaddle pointNSaddle point
Table 4. Local stability analysis of Scenario 4 to Scenario 6.
( x , y ) Scenario 4 Scenario 5 Scenario 6
detJ trJ Results detJ trJ Results detJ trJ Results
(0,0)NSaddle pointNSaddle point+ESS
(0,1)NSaddle pointNSaddle point++Unstable
(1,0)++UnstableNSaddle pointNSaddle point
(1,1)+ESSNSaddle pointNSaddle point
Table 5. Local stability analysis of Scenario 7 to Scenario 9.
( x , y ) Scenario 7 Scenario 8 Scenario 9
detJ trJ Results detJ trJ Results detJ trJ Results
(0,0)NSaddle pointNSaddle point+ESS
(0,1)+ESS+ESSNSaddle point
(1,0)++UnstableNSaddle pointNSaddle point
(1,1)NSaddle point++Unstable++Unstable
Table 6. The values of main parameters.
Variable R 1 R 2 P 1 P 2 C 1 C 2 C 3 L 2 L 3 Qqt β γ
Value1010.1111.50.511620.60.750.1
Table 7. The value range of critical variables.
VariablesValue RangeVariablesValue Range
L 1 low level [ 0 , 4 ] φ low level [ 0 , 0.4 ]
Middle level ( 4 , 7 ] Middle level ( 0.4 , 0.7 ]
High level ( 7 , 10 ] High level ( 0.7 , 1 ]
Publisher’s Note: MDPI stays neutral with regard to jurisdictional claims in published maps and institutional affiliations.

