Abstract
Improved climate-resilient strains of indigenous sheep and goats were introduced in the Nyando basin of western Kenya in 2013. This study evaluated the performance of the breeds five years after their first introduction, and their contribution to household revenues. Red Maasai and Red Maasai x Dorper sheep and Galla goats introduced in Nyando adapted to the environment and retained performance levels exhibited in their original environments. They have been widely adopted by the farmers and are used for upgrading local breeds through crossbreeding, yielding offspring that are 50% heavier than local breeds at one year of age. Costs for producing the small ruminants tend to increase with land size owned, mainly due to higher costs for managing the health of more livestock. The costs of producing goats are significantly higher than for sheep. Revenues accrued from goat milk contribute to 10% of the revenue from goats. The introduced breeds provided a significant productivity lift in the local livestock population, resulting in higher returns to the smallholder farmers. For long-term sustainability of the productivity gains, a community-based selective mating program using reference sire flocks with an overall goal of good growth, adaptability, and milk production should be adopted.
1. Introduction
Sheep and goats in East Africa comprise an estimated 68% of the ruminant livestock population [1]. They are key resources in smallholder mixed crop–livestock production systems, enabling diversification in land use and providing an additional source of income [2,3,4]. However, their outputs in smallholder systems are low and targeted improved productivity within existing breeds is limited [5,6]. Data on performance levels in smallholder systems are also scarce, yet the indigenous small ruminants continue to be retained and contribute to the livelihood of communities [7,8,9]. A common practice in livestock improvement programs for smallholder systems of East Africa is to introduce higher yielding breed types selectively bred in more temperate environments and crossbreed these with existing indigenous genotypes [10,11,12]. Subsequent studies on impacts of interventions in smallholder systems have involved simulations assuming different environmental parameters [13,14,15]. Evidence on actual performance of small ruminants under diverse smallholder farming systems can help to address the information gap that continues to limit interventions in improving the livelihoods of rural communities through their livestock.
In 2013, the CGIAR research program on climate change, agriculture, and food security (CCAFS), in collaboration with the International Livestock Research Institute (ILRI), introduced improved strains of indigenous sheep and goats for smallholder farms grouped into “climate-smart villages” (CSVs) in the Nyando flood plain of Lake Victoria Kenya, one of the fifteen areas selected by CCAFS for the implementation of “climate-smart agricultural practices” [16]. The use of improved indigenous breeds from a different climatically challenged area within the country was deemed optimal as more temperate breeds with high meat and milk production potential are often poorly adapted for dynamisms in the smallholder production systems [5,17]. Investigations on productivity improvement using indigenous breeds in low-input systems are scarce. This study evaluated the performance of improved indigenous sheep and goat breeds five years after their initial introduction into low-input smallholder farming systems in two communities of Nyando and their contribution to household revenues, presenting tangible evidence for designing breed-based interventions for low-input smallholder farming systems.
2. Materials and Methods
2.1. Compliance with Ethical Standards
The authors declare that the study does not contain clinical studies or patient data. Informed consent was obtained from all individual participants included in the study. The study was conducted in line with the current laws of the country.
2.2. Study Area and Data Collection
Data were obtained on improved indigenous sheep and goats reared by the 162 farmers who were involved in the small ruminant improvement program implemented by CCAFS in the Nyando basin of Lake Victoria, covering Kericho and Kisumu counties of western Kenya [18]. The farmers belonging to CSVs in each community were randomly selected in 2011 from seven villages participating in testing a portfolio of climate-smart agriculture interventions over a 5 to 10 year period [16]. Alongside a community training program on livestock improvement, the performances of both local and introduced improved indigenous breeds of sheep and goats in the smallholder farms were monitored through extension personnel engaged by CCAFS between 2014 and 2019 [18]. The sheep and goats were housed in elevated wooden structures for the night, and during the day were either tethered to graze within the farmer’s premises or left to graze in open fields once crops were harvested. All offspring born within the flocks were weighed by the enumerators using a portable hanging scale within one week of birth and, subsequently, every 3 months until the age of one year. Records on the performance and healthcare of the animals were collated through tools developed by ILRI using the “Open Data Kit” (ODK https://opendatakit.org/) (accessed on 11 December 2019).
In addition to monitoring animal performance, a semi-structured household survey was implemented among the 169 households in December 2018 to determine the farmers’ perspectives on the performances of the introduced sheep and goats and their crosses with the existing local indigenous non-descript (IND) strains, the costs of inputs and resources allocated to sheep and goat production, and returns from the animals over 12 the months between December 2017 to November 2018. Information on prices of inputs and animals were based on the farmers’ recall and verified through the extension personnel and national animal health service providers. Only the farmers rearing improved goats introduced in their flocks provided information on the quantity of milk produced by the animals on a daily basis during lactation and the average price for a liter of milk. The individual animal milk production was not monitored continuously by the enumerators. The farmers indicated the quantity of milk produced by an animal each day using a metallic cup that was determined to hold an equivalent to 0.5 liters of milk. Results generated through the survey and performance monitoring were presented to the communities and reviewed in focus group discussions (FGD) involving livestock keepers, extension personnel, animal health service providers, and county livestock production personnel. Through the FGD, farmers reported that sometimes the IND goats were milked, however the quantity of milk produced by these animals was so little that they did not report it when responding to the questions on revenue streams in the farm survey.
2.3. Data Analyses
A total of 2231 individual animal records (1008 on sheep and 1223 on goats) taken over 5 years were available for analyses. Descriptive statistics were derived based on the sheep and goat flock characteristics, key resources available for sheep and goat production, and the dynamics in the flocks owned. The growth performances of the introduced breeds of sheep and goats against that of existing indigenous animals in their first year of life were evaluated separately for each species using a general linear model (GLM) procedures in GENSTAT [19] as follows:
where: Yijkl = trait of animal l (traits were birth weight, weaning weight, 6 month weight, 9 month weight, yearling weight, and average daily gain between the weights from birth to yearling), µ= overall mean for a given trait, Ci = effect of county (I = Kericho, Kisumu), Bj = effect of breed of the animal (j = sheep breeds: IND, Red Maasai, Red Maasai x Dorper, Red Maasai x IND; goat breeds: Small East African, Galla Pure, Galla x Small East African), Sk = effect of the sex of the animal (k = male, female), eijkl = residual variance. The resultant least-square mean weights at different stages of growth for the different breed groups were used to plot growth curves for the different breeds of each species.
The average daily gain in weight by the animals was calculated as:
where: ADGt1−t2 is the average daily gain in weight at different times (t2 and t1, ti−n = birth date, weaning date, 6-month date, 9-month date, and yearling date), Wt1 is the weight at age t1, Wt2 is the weight at age t2, t2 − t1 is the number of days between t1 and t2.
Costs and Revenues in Sheep and Goat Production
Costs of production and revenue streams for the farmers from their sheep and goats over 12 months were determined from the responses contained in the cross-sectional household questionnaire and based on prices for inputs supporting sheep and goat production in the years 2017–2018. Revenues comprised income from the sales of sheep and goats and their products, as well as home consumption of the same during the same timeline.
In determining costs of production, key parameters of land, feed resources, and labor, though taken into consideration, could not all be assigned a value in the farming systems of this study. The land holdings in Nyando, as reported in [18,20], were very small (0.1–3 ha) and no land was set aside specifically for sheep and goat production. During cropping seasons, the sheep and goats were tethered to graze within homesteads or beside communal infrastructure, such as schools and roads. Once crops were harvested, the animals were grazed on crop residues. The costs associated with land, depreciation of equipment, and sheep and goat housing were assumed to be negligible as they had low input demand in the traditional production systems [21]. Feed resources for the sheep and goats comprised natural grasses, crop residues and household waste of very low commercial value. No additional feeds or concentrates were provided for the animals. We thus assumed a common cost for feeding animals across the farms.
The farmers indicated that they incurred costs in provision of water for their animals, which included costs for purchase and transport of water, and costs for managing the health of their animals included costs of veterinary inputs and services provided for the sheep and goat enterprises. Newborn lambs and kids contributed to the costs of production as they were reared on the farms over the one-year period during which costs were evaluated in this study. The replacement rate was calculated as the ratio of the number of animals born in the year relative to the total flock size. The estimation of costs due to mortality of animals was based on farm gate price depending on the age of an animal that died and the mortality rate calculated for flocks in the area from previous studies. Farmers either purchased or hired male animals for mating their animals, which comprised a cost for breeding.
The sheep and goats were managed by family members, hence there was no cost for hired labor, but rather a cost in terms of family labor [22]. This was calculated based on whether the household indicated that labor was mainly provided by an adult in the household or by the children. The costs for an adult family member was valued as half of the casual wage in the area, based on the assumption that the opportunity cost of family labor is below the wage rate as outlined in other studies [23,24]. Labor from children was mainly for herding the sheep and goats and was calculated as a quarter of the waged labor as proposed for smallholder systems in other studies [25].
Revenues were mainly earned through sale of both sheep and goats, as well as milk from the goats, which was primarily consumed at the household level with small quantities sold at the farm gate. All the milk produced was valued at the farm gate price. The average prices for different categories of animals in Kericho and Kisumu counties, as reported by the farmers, are presented in Table 1.

Table 1.
Average prices given for any sheep or goat, irrespective of the breed type, segregated by age and sex categories in 2018 in Kericho and Kisumu counties.
Manure collected from the night shelters of the animals was generally used on the farms, with excess quantities measured in terms of wheelbarrow loads sold at a rate of USD 2.3/load by less than 10% of the households. A previous study on manure management and use by the farmers in Nyando [26] indicated that the existing practices do not provide the farmers with sufficient amounts of nutrients from manure for stable crop production. Income from manure from the small ruminants in this study was considered to be negligible.
Gross income from sheep and goats was calculated as the difference between total revenues and total costs. Regression analyses were used to investigate the impact of land size, flock size owned, and breed type kept by households within each county on the costs and revenues in producing sheep and goats.
3. Results and Discussion
3.1. Small Ruminant Flock Dynamics
The sheep and goat flocks reared by the farmers categorized by the size of the land holdings owned in the two counties are presented in (Table 2).
Table 2.
The average flock size for sheep and goats reared by farmers owning different sizes of land and the percentage of the households (hh) owning improved breeds in Kericho and Kisumu counties.
The average flock sizes, notably, for households owning more than 1 hectare of land were double the initial size reported for the same farms at the start of the CCAFS intervention [18] (in Kericho County, the average flock size reported for sheep and goats on farms >1 hectare in 2016 was 2.6 ± 3 and 6.9 ± 5.3 head, respectively, while that reported for Kisumu County was 5.0 ± 2.8 and 5.0 ± 2.5 head for sheep and goats, respectively), providing an indication of expansion of small ruminant production on the farms. Flock sizes were also larger for households keeping both sheep and goats than for those rearing only a single species. As noted at the inception of the interventions [18], households in Kisumu county reared more sheep than goats in line with their cultural values. Through the FGD it was verified that in Kericho county, communities preferred goats, while in Kisumu county goats were appreciated for their ability to control bush encroachment on their land and for production of milk. Goats provide both milk and meat in diverse ecosystems and sustain lactations over long periods, making them an important asset for food security [5,27].
The sheep and goat flock sizes generally expanded through births or purchase of new animals and contracted during specific periods of the year when animals were either sold or died. Lambing/kidding was not planned for specific seasons within the flocks. The data generated through monitoring flock performance reflected a higher proportion of lambing/kidding in flocks (60%) in drier months of the year (May to July and September and December), indicating that mating occurred during rainy seasons when feed resources were more abundant. In order to attain improved offspring, some farmers paid their neighbors to have their animals grazed alongside males of the new introduced breeds for mating in order to avoid the public areas and watering points where they could be mated by the local males.
The different breeds of sheep and goats reared by the farmers in Nyando are presented in Table 3. The introduced indigenous Red Maasai sheep and their crosses with Dorper sheep, as well as the Galla goats, have been widely adopted in the two counties. The farmers also had some other improved breeds of goats and their crosses, including the German Alpine, Toggenburg, and Saanen (Table 3).
Table 3.
The proportional number of households (hh) keeping different sheep and goat breeds and the average number of animals of each breed reared by the farmers.
More than 70% of all the households kept the improved indigenous breeds introduced and their crosses with the local breeds (Table 3). The results reflect an increase in improved breeds and their crosses in Nyando from 50% in flocks in 2015 [18] to 80% in 2018, with a resultant decline in unidentified and IND breeds. Through the community FGD, the improved breeds introduced were reported to have adapted well to the environment, and had desirable characteristics, such as fast growth rate, resilience, and good fertility.
3.2. Growth Performance of the Sheep and Goats
The least-square mean weights from birth to one year of age for the animals in Kericho and Kisumu counties are presented in Figure 1 (sheep) and Figure 2 (goats), while the average daily gains in weight from birth to one year of age for the different breeds are presented in Table 4.
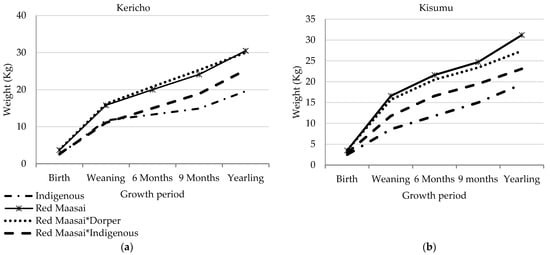
Figure 1.
Growth performance of the different sheep breeds from birth to one year of age in Kericho and Kisumu counties. (a) Growth of sheep breeds in Kericho county; (b) Growth of sheep breeds in Kisumu county.
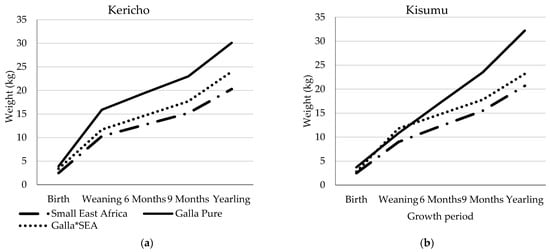
Figure 2.
Growth of the different goat breeds from birth to one year of age in Kericho and Kisumu Counties. (a) Growth of goat breeds in Kericho county; (b) Growth of goat breeds in Kisumu county.
Table 4.
Least-square mean (LSM) average daily gain from birth to one year of age (g/day) for the sheep and goat breeds introduced in Kericho and Kisumu counties.
The different breeds of both sheep and goats exhibited significantly different rates of growth. The IND breeds of both sheep and goats had lower growth rates, and, consequently, lower weights at one year of age than the introduced breeds. Differences in weights for the Red Maasai x Dorper crosses and the pure Red Maasai sheep were not significant. The introduced Red Maasai sheep had superior growth rates compared to all the other sheep breeds. At one year of age, the Red Maasai sheep were 61% heavier than the IND sheep. The growth rate of the Red Maasai and Red Maasai x Dorper crosses was not different from that reported for these animals under the semi-arid environments [12], an indication that the breeds adapted to the environment found in Nyando. Offspring of Red Maasai Sheep crossed with indigenous sheep in Kericho county had significantly higher growth rates than the indigenous sheep at all growth stages, however in Kisumu county, though the crosses were significantly larger, their rate of growth was only higher than that of indigenous animals prior to weaning. After weaning, their growth rates were not different. Among the goat breeds, the Galla goats had faster growth rates (p < 0.001) than both Galla crosses with SEA goats and the purebred SEA goats. Differences in growth across counties were not significant.
Small ruminant breeding projects implemented in tropical environments tend to emphasize crossbreeding with exotic genotypes to improve nutritional outcomes and livelihoods through milk and meat production [10,13,28,29]. However, the exotic (European) breeds that are generally introduced are reported to be more susceptible to diseases in the tropical environments [17]. In the CSV of Nyando, crossbreeding was adopted using improved indigenous breeds of sheep and goats for both meat and milk production. Productivity of the animals was dependent on naturally available resources with very limited external inputs. The improved indigenous breeds introduced have exhibited good adaptability and have provided a necessary lift to the existing local population through crossbreeding, resulting in improved growth rates. This reflects a positive genotype by environment interaction for indigenous breed types in the smallholder farming systems.
To sustainably retain and enhance the productivity gains, a practical selective mating program at the community level that is in line with the farmers goals needs to be adapted for the CSV. Due to limitations in land size within the communities, the breeding program for the area should encourage farmers with less than one hectare of land to retain flocks with female breeding animals and source males for mating their animals strategically when required.
3.3. Costs in Sheep and Goat Production
The average costs incurred in rearing sheep and goats over one year as reported by the farmers, grouped according to the size of land owned, are presented in Table 5.
Table 5.
Average costs of rearing sheep and goats on farms over one year categorized by land sizes in Kericho and Kisumu counties.
The costs of production relative to land size owned were variable across the two species and the two counties. Land size owned was positively related to the flock size and both influenced costs of production (p < 0.001). The overall costs tended to increase with land size for all the species except for sheep production in Kericho county, where the costs were higher for rearing sheep on land holdings that were less than one hectare. The highest costs in rearing animals were for treating diseases and providing labor to manage animals. The communities reported that labor for herding was mostly provided by children and adult female household members, a similar practice reported in other areas [30].
In Kisumu county, costs for providing water for animals were higher (p < 0.01) than in Kericho county. Water availability is a challenge in the Nyando area due to high incidences of drought, resulting from the changing climatic conditions [31].
Costs for mating animals were higher in Kericho. The farmers retained only a few breeding males within their flocks but tended to hire male animals for mating on an as-needed basis. The willingness of farmers in Nyando to pay for mating services for their animals reflected their willingness and ability to implement some management of breeding within their populations. Adoption of planned rotation of breeding males among farmers, as outlined in different studies [32,33], could be implemented in Nyando as a strategy for improving productivity.
3.4. Revenues from Sheep and Goat Production
Revenues were accrued through the sale of both live sheep and goats and from the sale of milk obtained from the goats. Revenues from animals sold based on the prices outlined in Table 1 are presented in Table 6. It was notable that the prices for animals were mainly determined from the size and body condition of the animals, reflecting the demand for large animals. Both sheep and goats attracted better prices compared to those reported for animals in the same region in 2016 [34]. Households owning goat flocks earned greater returns than those with sheep. Seventy percent of the animals sold were mature. Both male and female animals were sold depending on their availability and the anticipated sale price. The farmers indicated that they desired to retain the female animals, however, if there was no other animal ready for sale at the time of need, they would sell the females. The farmers in both counties reported that they sold more sheep and goats of the improved breeds than the IND breed types. In the FGD, farmers indicated that they tended to consume more of the local breeds at home as culled animals since they had lower mature weights than the introduced breeds.
Table 6.
Revenue from sheep and goats and the average number of animals contributing to income per household depending on the land size owned in Kericho and Kisumu in 2018.
Through the regression analyses, it was evident that the size of land owned influenced the revenues accrued (p < 0.001), however, it was notable that the number of animals available for sale was higher from farmers owning 1–2 acres of land. The number of animals available for sale from farms was not directly proportional to the flock size owned. The farmers reported that they sold animals to meet their household needs rather than with the aim of making a profit. This is a common practice in smallholder farming systems of Africa [9,24].
Revenue from goat milk was calculated using the average daily milk production and lactation lengths reported by the farmers keeping the improved breeds of goats and their crosses (Table 7). Information provided on milk production was from 93.5% and 25.8% of the households in Kericho and Kisumu counties, respectively, and was not disaggregated by breed type.
Table 7.
Revenue from milk produced by improved goats introduced on farms of different land size in Kericho and Kisumu counties in 2018.
Although the price for milk in Kisumu county was higher than in Kericho county, the average revenue from milk was higher in Kericho than in Kisumu county as more animals were milked (p < 0.01, Table 7). In the FGD, the farmers noted that though the average milk production per day for improved breeds was higher than that for indigenous animals (1.1 kg/day vs < 0.2 kg/day), the improved breeds tended to have a shorter length of lactation (3 months) compared to the indigenous breeds, which would continue lactating over 5–8 months. Milk production from goats was desirable on the farms and accrued attractive prices when sold, however, the quantity of milk per animal was low and more revenue (81.5% and 63.9% of the total revenues in Kericho and Kisumu) was from the sale of live animals. Investment in milk production from the goats needs to be enhanced as the current production in the traditional systems is low, yet studies from other areas indicate that milk production by goats can substantively improve incomes for smallholder households [35,36].
3.5. Gross Returns from Sheep and Goat Production
The gross returns from rearing sheep and goats calculated from the costs and revenues from each enterprise based on the size of land owned are presented in Table 8. The number of animals reared was positively correlated with the land size owned by the producers (Table 2). The farmers earned higher returns from goats than from sheep in the two counties. It was notable that both sheep and goat enterprises accrued higher returns (p < 0.01) in Kericho county than in Kisumu county.
Table 8.
Gross returns from sheep (animal sales) and goat (milk and animal sales) production on smallholder farms of different land sizes in climate-smart villages of Kericho and Kisumu in 2018.
Economic returns from the sheep and goats greatly impact the continued adoption and expanded use of improved breeds introduced in a community. It is evident that in spite of the land size owned, all the livestock keepers were able to attain a positive return from their sheep and goats, though the magnitude of returns differed across the two counties (p < 0.001) and depending on the land size owned.
4. Conclusions
The improved indigenous breeds that were introduced into the smallholder farming systems and their crosses with local animals exhibited improved growth rates, resulting in the farmers availing animals for sale for meat within 1.5 years, hence increasing their net returns from rearing sheep and goats. The prices of sheep and goats in the region have more than doubled since the inception of the CCAFS-led intervention in 2014, indicating the importance of the quality of animals availed for sale in influencing income. To sustainably retain and enhance the productivity gains in the low-input smallholder systems, focus should be on adapting a practical selection and mating program at the community level that is aligned to the farmers’ goals in relation to their land holdings.
Author Contributions
Conceptualization, W.S., C.K.G., J.M.K.O., J.W.R. and J.A.; methodology, C.K.G., J.M.K.O. and W.S.; software, W.S., J.M.K.O., C.K.G. and J.A.; validation, W.S., C.K.G., J.W.R. and J.A.; formal analysis, W.S., J.M.K.O., C.K.G., J.W.R. and J.A.; investigation, W.S., C.K.G., J.M.K.O., J.W.R. and J.A.; resources, W.S., C.K.G., J.W.R., J.A. and J.M.K.O.; data curation, J.M.K.O., W.S. and J.A.; writing—original draft preparation W.S. and J.M.K.O.; writing—review and editing, W.S., J.M.K.O., C.K.G., J.W.R. and J.A.; visualization, W.S., C.K.G. and J.M.K.O.; supervision, C.K.G., J.M.K.O. and J.W.R.; project administration, J.M.K.O. and J.W.R.; funding acquisition, J.M.K.O. and J.W.R. All authors have read and agreed to the published version of the manuscript.
Funding
This research was financially supported through CCAFS-EC, grant reference: 2000002575, for the project on Building Livelihoods and Resilience to Climate Change in East and West Africa: Agricultural Research for Development (AR4D) for Large-Scale Implementation of Climate-Smart Agriculture. The funds are administered by the International Fund for Agricultural Development (IFAD), Rome, Italy, while the project is implemented by Alliance Bioversity—CIAT. This study was also financially supported through a grant from the World Bank “Accelerating Impacts of CGIAR Climate Research for Africa (AICCRA)” ESA regional project (Grant No. D7540) signed between CIAT and the International Development Association (IDA). Additional funding was provided by the CGIAR Research Program, Climate Change, Agriculture and Food Security (CCAFS), and the Livestock Genetics Flagship of the CGIAR Research Program on Livestock, which are supported by contributors to the CGIAR Trust Fund.
Institutional Review Board Statement
Ethical review and approval were waived for this study because the study does not contain clinical studies or patient data. The sheep and goats were demanded by the local community to deal with climate related challenges, which led to collaboration between ILRI, World Neighbors, Vi Agroforestry and County Departments of Livestock Development since 2013.
Informed Consent Statement
Informed consent was obtained from all subjects involved in the study in the in the Nyando basin of Lake Victoria region, covering Kericho and Kisumu counties of western Kenya. The study was conducted in line with the current laws of the Republic of Kenya.
Data Availability Statement
Data supporting results reported are on the ILRI data platform https://data.ilri.org/portal/dataset/ccafsnyando (19 February 2020).
Acknowledgments
The Vi Agroforestry and World Neighbors are acknowledged for providing support during fieldwork in Nyando climate-smart villages. We also appreciate farmers, community-based organizations, and community volunteers in Nyando for their willingness to participate in the study.
Conflicts of Interest
The authors declare that they have no conflict of interest. The funders had no role in the design of the study; in the collection, analyses, or interpretation of data; in the writing of the manuscript; or in the decision to publish the results.
References
- FAOSTAT. FAOSTAT Database; FAO: Rome, Italy, 2020; Available online: http://www.fao.org/faostat/en/#home (accessed on 2 February 2020).
- Herrero, M.; Grace, D.; Njuki, J.; Johnson, N.; Enahoro, D.; Silvestri, S.; Rufino, M.C. The roles of livestock in developing countries. Animals 2013, 7, 3–18. [Google Scholar] [CrossRef] [Green Version]
- Alary, V.; Aboul-Naga, A.; El Shafie, M.; Abdelkrim, N.; Hamdon, H.; Metawi, H. Roles of small ruminants in rural livelihood improvement—Comparative analysis in Egypt. Rev. Elev. Med. Vet. Pays Trop. 2015, 68, 79–85. [Google Scholar] [CrossRef]
- Fantahun, T.; Alemayehu, A.; Abegaz, S. Characterization of goat production systems and trait preferences of goat keepers in Bench Maji zone, south western Ethiopia. Afr. J. Agric. Res. 2016, 11, 2768–2774. [Google Scholar] [CrossRef] [Green Version]
- Kahi, A.K.; Wasike, C.B. Dairy goat production in sub-Saharan Africa: Current status, constraints and prospects for research and development. Asian-Australas. J. Anim. Sci. 2019, 32, 1266–1274. [Google Scholar] [CrossRef] [PubMed] [Green Version]
- Monteiro, A.; Costa, J.M.; Lima, M.J. Goat System Productions: Advantages and Disadvantages to the Animal, Environment and Farmer. In Goat Science; IntechOpen: London, UK, 2017; pp. 351–366. Available online: https://www.intechopen.com/books/goat-science/goat-system-productions-advantages-and-disadvantages-to-the-animal-environment-and-farmer (accessed on 22 February 2020).
- Onzima, R.B.; Gizaw, S.; Kugonza, D.R.; van Arendonk, J.A.M.; Kanis, E. Production system and participatory identification of breeding objective traits for indigenous goat breeds of Uganda. Small Rumin. Res. 2018, 163, 51–59. [Google Scholar] [CrossRef]
- Haile, A.; Gizaw, S.; Getachew, T.; Mueller, J.P.; Amer, P.; Rekik, M.; Rischkowsky, B. Community-based breeding programmes are a viable solution for Ethiopian small ruminant genetic improvement but require public and private investments. J. Anim. Breed Gen. 2019, 136, 319–328. [Google Scholar] [CrossRef] [PubMed] [Green Version]
- Kaumbata, W.; Banda, L.; Mészáros, G.; Gondwe, T.; Woodward-Greene, M.J.; Rosen, B.D.; Van Tassell, C.P.; Sölkner, J.; Wurzinger, M. Tangible and intangible benefits of local goats rearing in smallholder farms in Malawi. Small Rumin. Res. 2020, 187, 106095. [Google Scholar] [CrossRef]
- Bett, R.C.; Kosgey, I.S.; Kahi, A.K.; Peters, K.J. Realities in breed improvement programmes for dairy goats in East and Central Africa. Small Rumin. Res. 2009, 85, 157–160. [Google Scholar] [CrossRef]
- Ogola, T.D.O.; Kosgey, I.S. Breeding and development of dairy goats: Eastern Africa experience. Livest. Res. Rural Dev. 2012, 24, 21. Available online: http://www.lrrd.org/lrrd24/1/ogol24021.htm (accessed on 17 January 2020).
- König, Z.E.; Strandberg, E.; Ojango, J.M.K.; Mirkena, T.; Okeyo, A.M.; Philipsson, J. Purebreeding of Red Maasai and crossbreeding with Dorper sheep in different environments in Kenya. J. Anim. Breed. Genet. 2017, 134, 531–544. [Google Scholar] [CrossRef] [Green Version]
- Gicheha, M.G.; Kosgey, I.S.; Bebe, B.O.; Kahi, A.K. Evaluation of the efficiency of alternative two-tier nucleus breeding systems designed to improve meat sheep in Kenya. J. Anim. Breed. Genet. 2006, 123, 247–257. [Google Scholar] [CrossRef]
- Bett, R.C.; Kosgey, I.S.; Kahi, A.K.; Peters, K.J. Definition of breeding objectives and optimum crossbreeding levels for goats in the smallholder production systems. Small Rumin. Res. 2011, 96, 16–24. [Google Scholar] [CrossRef]
- Mbuku, S.M.; Okeyo, A.M.; Kosgey, I.S.; Kahi, A.K. Optimum crossbreeding systems for goats in low-input livestock production system in Kenya. Small Rumin. Res. 2015, 123, 55–61. [Google Scholar] [CrossRef]
- Kinyangi, J.; Recha, J.; Kimeli, P.; Atakos, V. Climate-Smart Villages and the Hope of Food Secure Households. CCAFS Info Note, (Copenhagen, Denmark). 2015. CGIAR Research Program on Climate Change, Agriculture and Food Security (CCAFS). Available online: https://cgspace.cgiar.org/handle/10568/65144 (accessed on 22 February 2020).
- Bett, R.C.; Kosgey, I.S.; Kahi, A.K.; Peters, K.J. Analysis of production objectives and breeding practices of dairy goats in Kenya. Trop. Anim. Health Prod. 2009, 41, 307–320. [Google Scholar] [CrossRef]
- Ojango, J.M.K.; Audho, J.; Oyieng, E.; Recha, J.; Okeyo, A.M.; Kinyangi, J.; Muigai, A.W.T. System characteristics and management practices for small ruminant production in “Climate Smart Villages” of Kenya. Anim. Genet. Resour. 2016, 58, 101–110. [Google Scholar] [CrossRef]
- Payne, R.W.; Murray, D.A.; Harding, S.A.; Baird, D.B.; Soutar, D.M. GenStat for Windows Introduction, 18th ed.; VSN International: Hemel Hempstead, UK, 2015; Available online: http://www.vsnc.com.cn/wp-content/uploads/2016/11/Introguide_Genstat.pdf (accessed on 6 January 2020).
- Sila, W.; Gachuiri, C.K.; Recha, J.; Audho, J.; Ojango, J.M.K. Economic Performance of Small Ruminants on Smallholder Farms in Climate Smart Village of Nyando. In Proceedings of the 42nd Scientific Conference of Tanzania Society of Animal Production, Dodoma, Tanzania, 23–25 October 2019; Available online: https://cgspace.cgiar.org/handle/10568/109689 (accessed on 6 January 2020).
- Turkson, P.K.; Naandam, J. Constraints to ruminant production in East Mamprusi District of Ghana. Ghana J. Agric. Sci. 2011, 39, 155–164. [Google Scholar] [CrossRef]
- Kenya Government, National Council for Law Reporting with the Authority of the Attorney-Genera 2012. Laws of Kenya; Employment Act Chapter 226. Available online: http://kenyalaw.org/kl/fileadmin/pdfdownloads/Acts/EmploymentAct_Cap226-No11of2007_01.pdf (accessed on 24 July 2021).
- Staal, S.J.; Waithaka, M.; Njoroge, L.; Mwangi, D.M.; Njubi, D.; Wokabi, A. Costs of Milk Production in Kenya: Estimates from Kiambu, Nakuru and Nyandarua Districts. SDP Research and Development Report (Nairobi, Kenya). 2003, pp. 11–30. Available online: https://cgspace.cgiar.org/handle/10568/1923 (accessed on 24 July 2021).
- Legesse, G.; Siegmund-Schultze, M.; Abebe, G.; Zárate, A.V. Economic performance of small ruminants in mixed-farming systems of Southern Ethiopia. Trop. Anim. Health Prod. 2010, 42, 1531–1539. [Google Scholar] [CrossRef] [PubMed]
- Zegeye, T.; Ali, A.; Kebede, A.; Renström, K.; Shone, G. Estimating Costs and Benefits on Crop Production: A Simplified Guide for Smallholder Farmers in Ethiopia; Colourprint Limited: Nairobi, Kenya, 2000. [Google Scholar]
- Casu, F.A.M. Manure Management and Nutrient Cycling in Smallholder Crop-Livestock Systems in Nyando, Kenya MSc (Animal Production Systems). Ph.D. Thesis, Wageningen University, Wageningen, The Netherlands, 2017. [Google Scholar]
- Wodajo, H.D.; Gemeda, B.A.; Kinati, W.; Mulem, A.A.; van Eerdewijk, A.; Wieland, B. Contribution of small ruminants to food security for Ethiopian smallholder farmers. Small Rumin. Res. 2020, 184, 106064. [Google Scholar] [CrossRef]
- Ayalew, W.; Rischkowsky, B.; King, J.M.; Bruns, E. Crossbreds did not generate more net benefits than indigenous goats in Ethiopian smallholdings. Agric. Syst. 2003, 76, 1137–1156. [Google Scholar] [CrossRef]
- Peacock, C.; Ahuya, C.O.; Ojango, J.M.K.; Okeyo, A.M. Practical crossbreeding for improved livelihoods in developing countries: The FARM Africa goat project. Livest. Sci. 2011, 136, 38–44. [Google Scholar] [CrossRef]
- Oluwatayo, I.B.; Oluwatayo, T.B. Small Ruminants as a Source of Financial Security: A Case Study of Women in Rural Southwest Nigeria. 2012. Working Paper 1. Available online: https://www.imtfi.uci.edu/index.php (accessed on 27 January 2020).
- Masese, F.O.; Raburu, P.O.; Kwena, F. Threats to the Nyando Wetland. Community Based Approach to the Management of Nyando Wetland, Lake Victoria Basin, Kenya. In Kenya Disaster Concern & VIRED International & UNDP, 2012; McPowl Media Limited: Nairobi, Kenya, 2012; pp. 68–80. [Google Scholar]
- Braga Lobo, R.N. Opportunities for investment into small ruminant breeding programmes in Brazil. J. Anim. Breed. Genet. 2019, 136, 313–318. Available online: https://onlinelibrary.wiley.com/doi/full/10.1111/jbg.12396 (accessed on 19 February 2020). [CrossRef] [PubMed] [Green Version]
- Kosgey, I.S.; Baker, R.L.; Udo, H.M.J.; Van Arendonk, J.A.M. Successes and failures of small ruminant breeding programmes in the tropics: A review. Small Rumin. Res. 2006, 61, 13–28. [Google Scholar] [CrossRef]
- Ojango, J.M.K.; Audho, J.; Oyieng, E.; Radeny, M.; Kimeli, P.; Recha, J.; Muigai, A.W.T. Assessing actors in rural markets of sheep and goats in the Nyando Basin of Western Kenya: A key to improving productivity from smallholder farms. Trop. Anim. Health Prod. 2018, 50, 1871–1879. [Google Scholar] [CrossRef] [PubMed]
- Ahuya, C.O.; Ojango, J.M.K.; Mosi, R.O.; Peacock, C.P.; Okeyo, A.M. Performance of Toggenburg dairy goats in smallholder production systems of the eastern highlands of Kenya. Small Rumin. Res. 2009, 83, 7–13. [Google Scholar] [CrossRef]
- Kumar, S.; Roy, M.M. Small Ruminant’s Role in Sustaining Rural Livelihoods in Arid and Semiarid Regions and their Potential for Commercialization. In New Paradigms in Livestock Production from Traditional to Commercial and Beyond; Agrotech Publishing Academy: Udaipur, India, 2013; pp. 57–80. [Google Scholar]
Publisher’s Note: MDPI stays neutral with regard to jurisdictional claims in published maps and institutional affiliations. |
© 2021 by the authors. Licensee MDPI, Basel, Switzerland. This article is an open access article distributed under the terms and conditions of the Creative Commons Attribution (CC BY) license (https://creativecommons.org/licenses/by/4.0/).