Case Report

From Buildings’ End of Life to Aggregate Recycling under a Circular Economic Perspective: A Comparative Life Cycle Assessment Case Study

by
Ambroise Lachat
1,*,
Konstantinos Mantalovas
2,
Tiffany Desbois
3,
Oumaya Yazoghli-Marzouk
4,
Anne-Sophie Colas
5,
Gaetano Di Mino
2 and
Adélaïde Feraille
1
1
Lab Navier, Ecole des Ponts, University Gustave Eiffel, CNRS, 6-8 Av. B. Pascal, MLV CEDEX 2, F-77455 Champs-sur-Marne, France
2
Dipartimento di Ingegneria, Università degli Studi di Palermo, 90128 Palermo, Italy
3
Cerema, Direction Ouest, 5 Rue Jules Vallès, F-22000 Saint-Brieuc, France
4
Cerema, Direction Centre Est, Agence Autun, Boulevard Giberstein, BP 141, F-71405 Autun, France
5
GERS-RRO, University Gustave Eiffel, IFSTTAR, University Lyon, F-69675 Lyon, France
*
Author to whom correspondence should be addressed.
Sustainability 2021, 13(17), 9625; https://doi.org/10.3390/su13179625
Submission received: 17 July 2021 / Revised: 20 August 2021 / Accepted: 23 August 2021 / Published: 26 August 2021
(This article belongs to the Special Issue Sustainable Concrete Materials for a Clean Energy Management)

Abstract

:
The demolition of buildings, apart from being energy intensive and disruptive, inevitably produces construction and demolition waste (C&Dw). Unfortunately, even today, the majority of this waste ends up underexploited and not considered as valuable resources to be re-circulated into a closed/open loop process under the umbrella of circular economy (CE). Considering the amount of virgin aggregates needed in civil engineering applications, C&Dw can act as sustainable catalyst towards the preservation of natural resources and the shift towards a CE. This study completes current research by presenting a life cycle inventory compilation and life cycle assessment case study of two buildings in France. The quantification of the end-of-life environmental impacts of the two buildings and subsequently the environmental impacts of recycled aggregates production from C&Dw was realized using the framework of life cycle assessment (LCA). The results indicate that the transport of waste, its treatment, and especially asbestos’ treatment are the most impactful phases. For example, in the case study of the first building, transport and treatment of waste reached 35% of the total impact for global warming. Careful, proactive, and strategic treatment, geolocation, and transport planning is recommended for the involved stakeholders and decision makers in order to ensure minimal sustainability implications during the implementation of CE approaches for C&Dw.

1. Introduction

During the latest years, a trend towards the development and implementation of decision-making support tools and guidelines in the sector of solid waste management has been detectable under the umbrella of the European Parliament’s directive on waste and the European Commission’s Circular Economy Action Plan [1,2,3,4,5]. They vary from European directives and recommendations to scientific publications [6,7]. This can be observed in local, regional, and ultimately in national levels and varying magnitudes. In an international level, a general hierarchical order—defined as waste hierarchy- is followed in order to define alternative waste management processes. They can vary between prevention, preparing for re-use, recycling, and other types of waste recovery and disposal. The European Directive 2008/98/EC 2008 on waste has also been a steppingstone towards this direction [5,8,9]. However, having established the aforementioned order of priorities via the published decisions of the European Commission, a further issue arises. The directives cannot fully ensure that the environmental impacts of the solid waste management will be brought down to a minimum and cannot strictly provide an optimal guideline on the possible combination of management alternatives to also ensure the minimization of its environmental impacts [5]. For this very reason, the European Commission issued the European Commission Communication (COM 666 2005) that supports the implementation of the life cycle assessment framework and methodology along with the waste hierarchy [5,10,11]. It is consolidated by the European Commission communication (COM (2020) 652) [12] for the 8th Environmental Action program where a major objective is living “within the planet’s ecological limits. […] circular economy where nothing is wasted and natural resources are managed sustainably” [12] (p. 22). This communication follows the European Green Deal (COM (2019) 640) [13]. Moreover, the European commission recently adopted the Circular Economy Action Plan for a Clean and Competitive Europe (COM (2020) 98) [12] (p. 1), [14]. Now, it is widely acknowledged that the construction industry can play an essential role for every society. However, within the term “construction industry”, the aspect of waste production through the construction, demolition, and renovation of buildings is profoundly established. The processes of urban expansion or connection between cities demand the construction of buildings, residences, paving and urban maintenance, roads, and train lines, among others. The execution of engineering works requires the use of natural resources, such as coarse aggregates [5]. French aggregate production accounted for an average of 367 Mt/year from 2010 to 2017 while in 2018, a significant spike can be detected, where 429 Mt of aggregates were produced, compared to the 331 Mt that were produced in 2016 [15]. This undoubtedly proves that large amounts of resources are being extracted and exploited to comply with the needs of the construction industry. Furthermore, severe environmental impacts are also occurring during the whole process of extracting resources and producing aggregates, either virgin or recycled aggregates originating from the construction, demolition, or renovation of buildings.
A standardized and well-established methodology that can support the decision-making processes and assessment of the environmental viability of virgin and/or recycled aggregates for this sector is the life cycle assessment (LCA) [7,11,16,17,18]. There are already existing records of the application of LCA methodology within the international literature when it comes to the environmental impact assessment of the construction and demolition waste management chain [19,20,21]. There are studies that utilize the LCA methodology and framework in order to analyze alternative end of life strategies and/or scenarios of the buildings [18]. Other studies report the environmental impacts and the waste produced via alternative scenarios for the construction of new buildings [22], while both primary and secondary data from varying databases were used [23,24]. Moreover, the reuse and/or recycling of reclaimed materials such as the construction and demolition waste has also, lately, been gaining momentum in the road engineering industry [25,26]. The process of utilizing reclaimed materials that otherwise could be perceived as waste in the road engineering industry is a commonly applied approach, especially when it comes to reclaimed asphalt. It is a process that is aligned with the principles of circular economy (CE) and can have significant potential economic and environmental benefits [4,27,28,29]. CE is an economic approach that can allow the replacement of “end of life” with an approach that can offer the recovery, reuse, recycling, or even the upcycling of reclaimed materials, which, according to the well-established linear economic approach would be considered waste. This approach can lead to reduced overall waste produced and discarded during resource extraction and processing, manufacturing and/or production of materials, and end of life [30,31]. Researchers, however, suggest that when a circular approach is to be adopted, a quantitative analysis of its environmental impacts should be performed in order to ensure that this approach, apart from being circular, is also environmentally viable.

2. Scope and Objectives

Despite the above, there is a lack of studies dedicated to the quantitative environmental assessment of recycled aggregates production from construction and demolition waste with averagely small nominal size grain. This study focuses on compiling a life cycle inventory along with a data collection methodology, predominantly constituted by primary data that have been collected on two different sites. This is a case study that has been structured and undertaken in a French context. The first site is a demolition site in the south of France (Building A) and the second in the northwest of France (Building B). Both demolished buildings were residential ones. The objectives of this study are:
  • The development of a composite life cycle inventory of primary and secondary data for the demolition of these two buildings.
  • The quantification of the potential environmental impacts originating from their end of life.
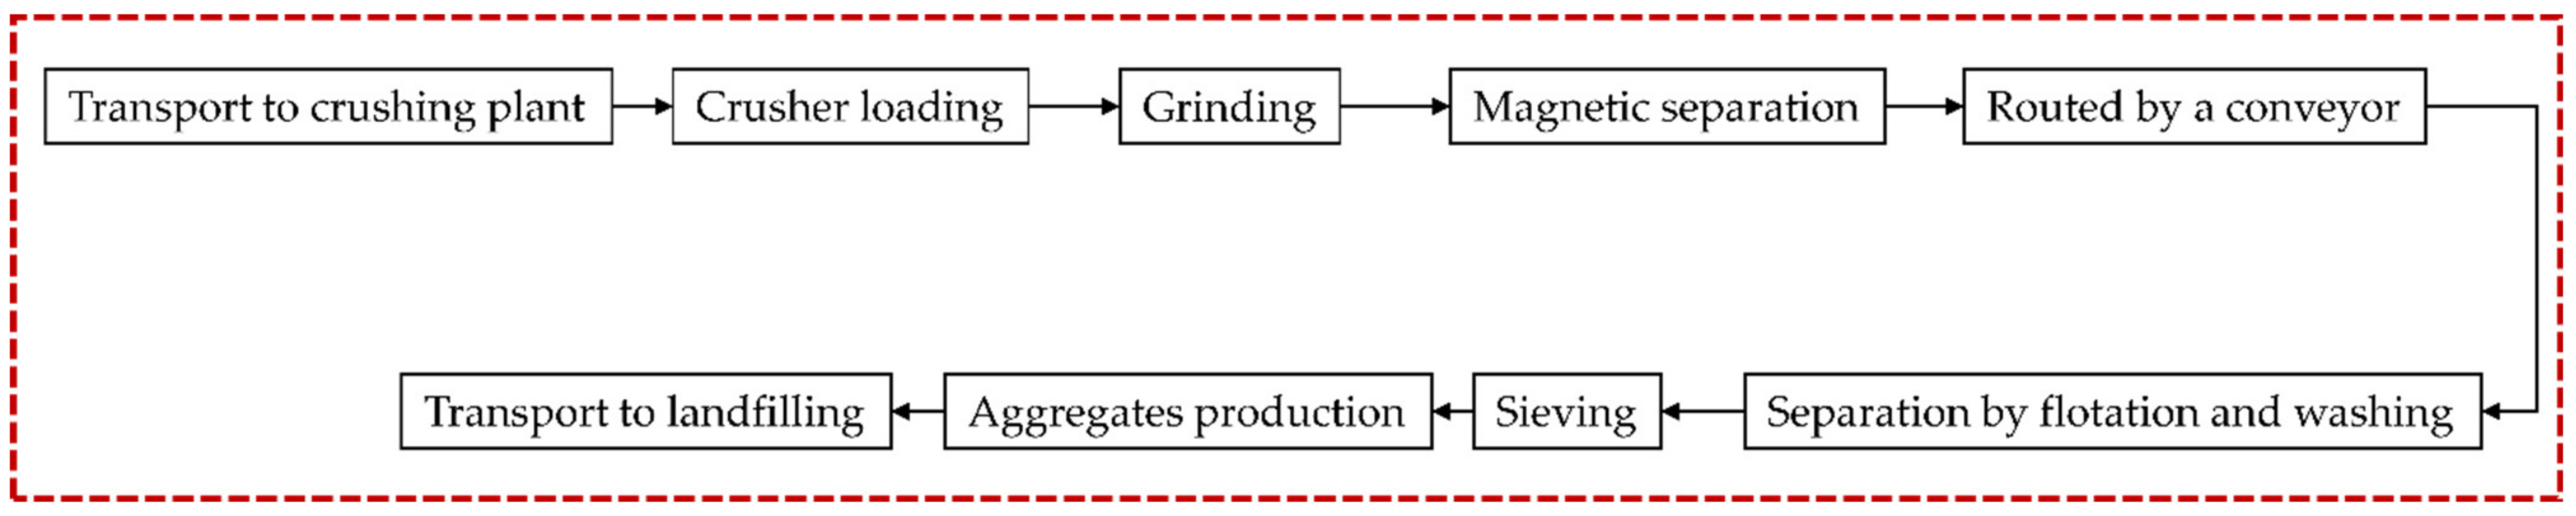
  • The quantification of the potential environmental impacts originating from the production of recycled aggregates when using construction and demolition waste as a resource.
  • The comparison of the environmental impacts due to the production of virgin aggregates with those due to the production of recycled aggregates through the treatment of construction and demolition wastes.
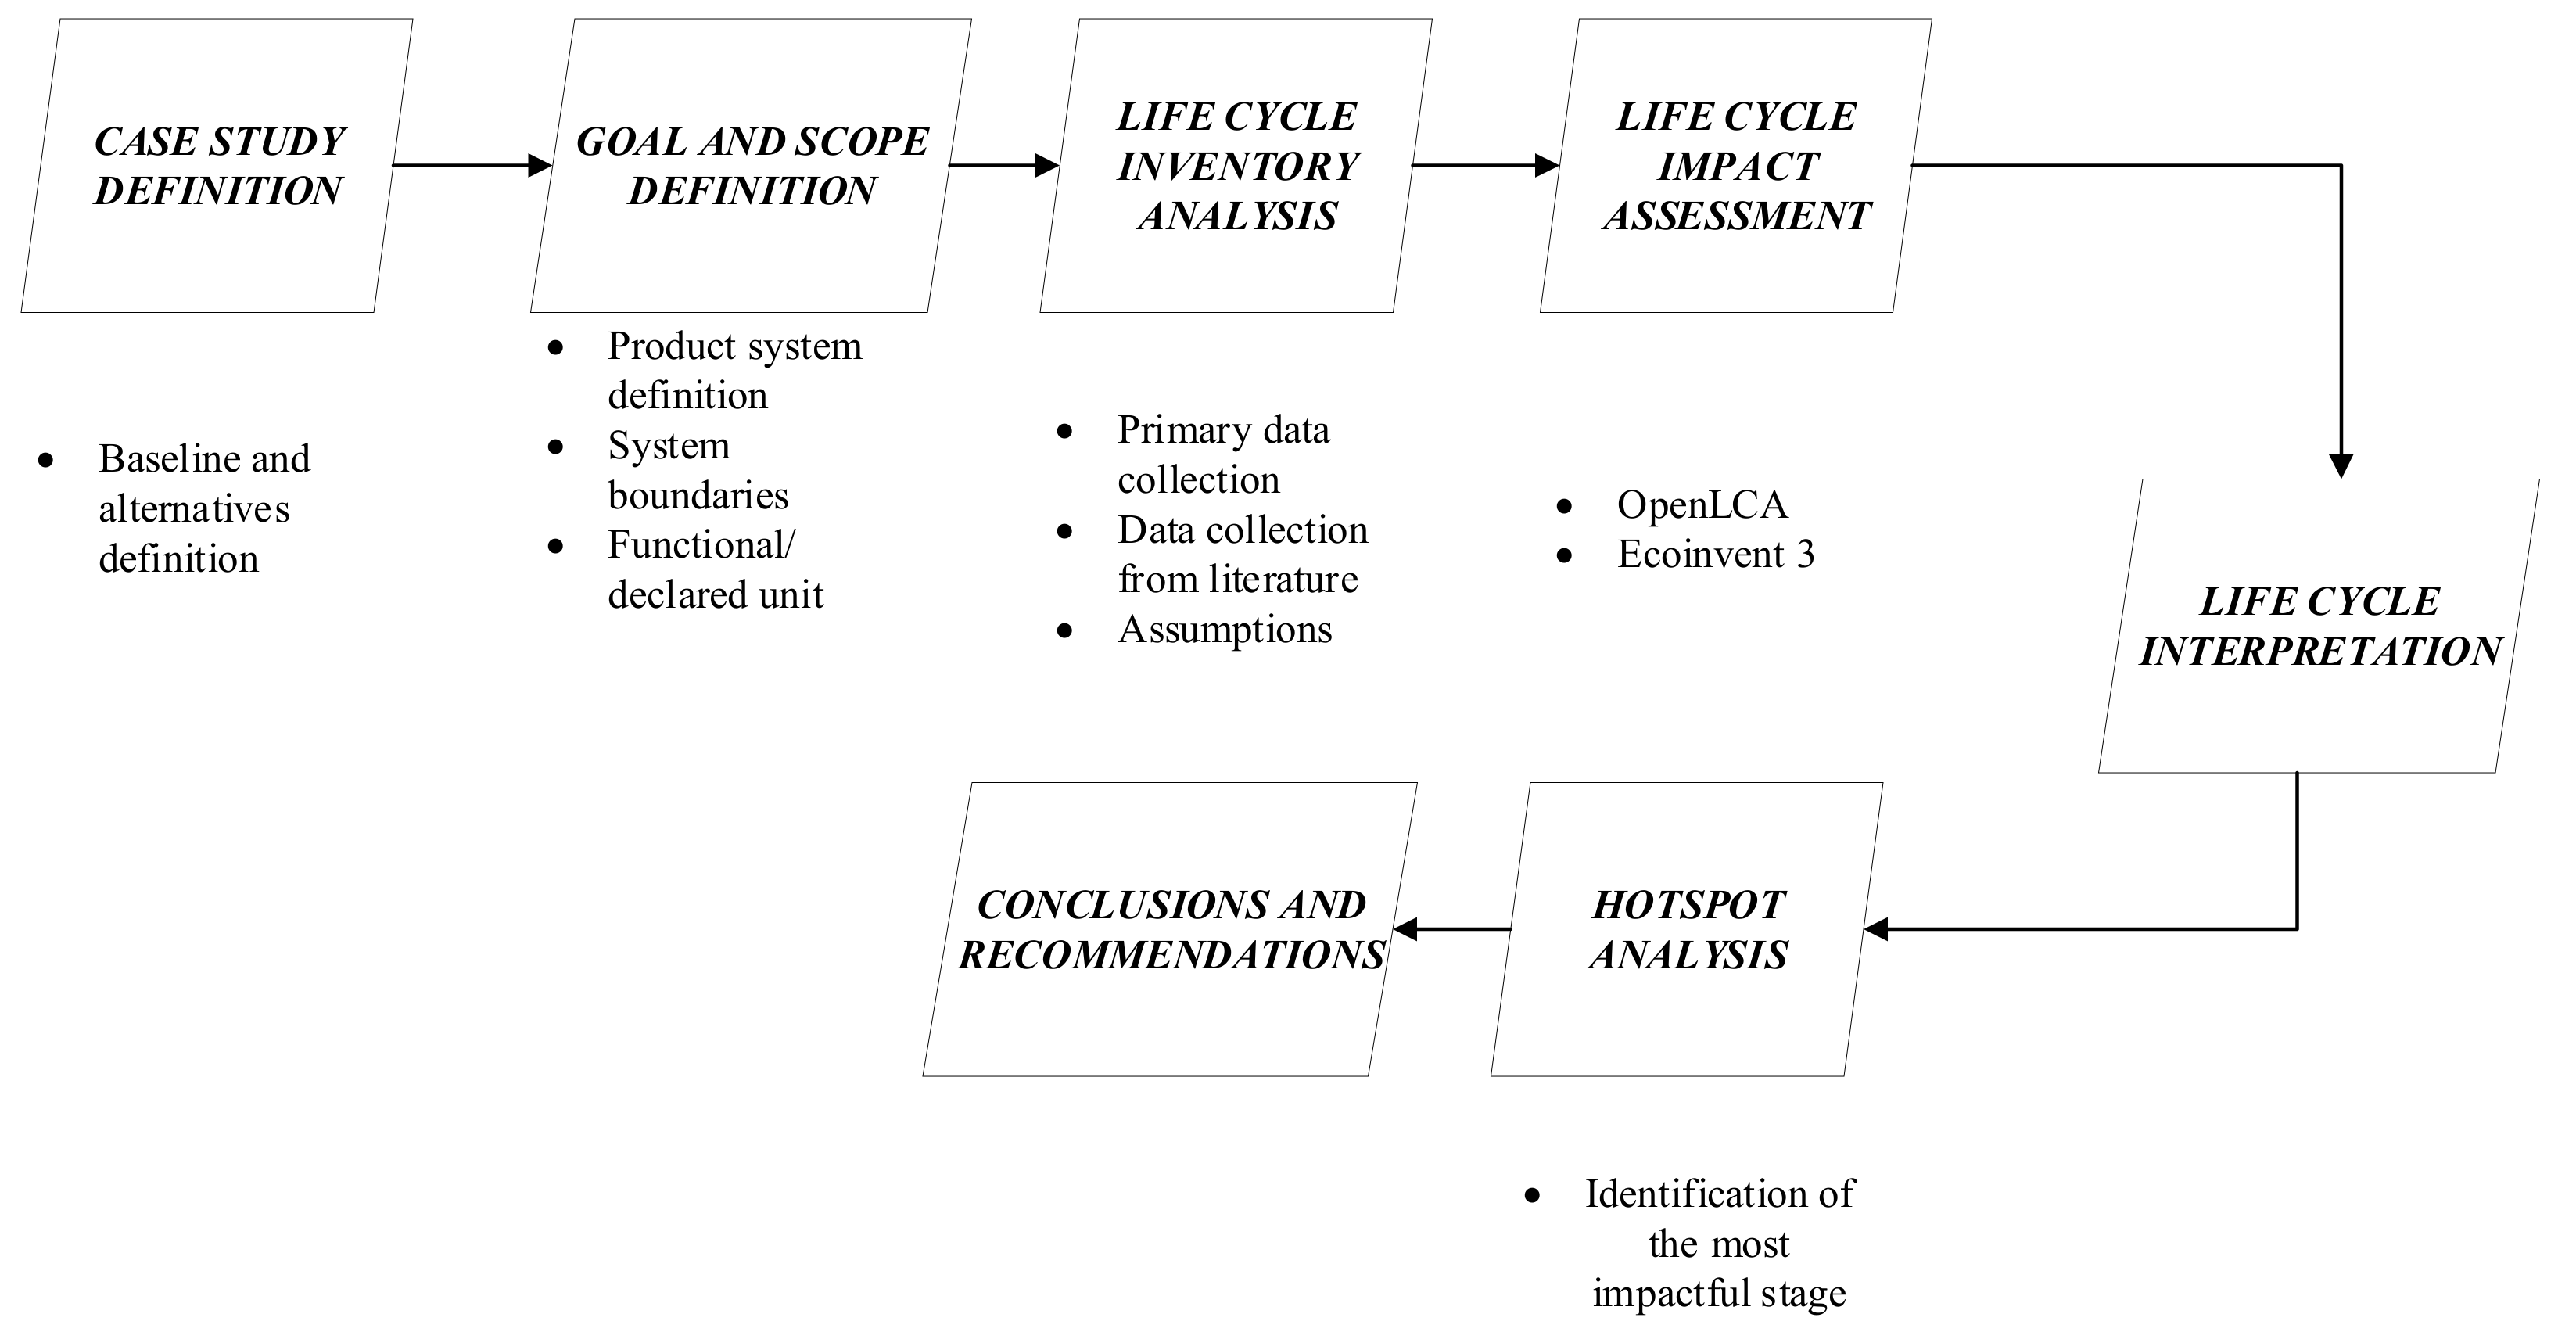
More analytically, the process followed for the study along with the objectives can be seen in Figure 1.

3. Methods

To conduct this life cycle assessment (LCA) study, the freeware used was the OpenLCA v.1.10 developed in 2006 by GreenDelta. For the flows and processes, Ecoinvent® database version 3.5 was used. It is an international Swiss database, one of the most used in Europe. The impact method from the standard EN 15804 + A1 was used. This impact method includes impact indicators and flows indicators. No cut=off rule was used. Nevertheless, some consumables were not modeled due to some lack of data. All elements taken into account can be found in the system boundaries in Section 4.2.3.

3.1. Life Cycle Assessment

Life cycle assessment (LCA) is a widely utilized tool, able to quantify the environmental impacts of a product, service, or process during its life cycle [27,29,32,33,34]. It is usually used as a decision-making support tool and it is able to provide a comparative ranking between different designs, processes, or even alternative process scenarios. It is a framework that has been standardized with ISO standards ISO 14040 and ISO 14044 [7,16] with specific standards dedicated to buildings with EN 15804 and EN 15643-2 [35,36]. In this study, the approach adopted for the LCA exercise included the end of life of two buildings, their deconstruction, the transportation of the materials that were acquired through it, the treatment of the different construction and demolition waste produced, its disposal and/or recycling, and the production of recycled aggregates.

3.2. Life Cycle Impact Assessment Methodology

The standard NF EN 15804 + A1 is composed of nine impact indicators listed below:
  • Acidification of soil and water (kg SO2 eq.),
  • Ozone depletion (kg CFC-11 eq.),
  • Eutrophication (kg PO43− eq.),
  • Photochemical ozone creation (kg ethylene eq.),
  • Air pollution (m3),
  • Water pollution (m3),
  • Global warming (kg CO2 eq.),
  • Depletion of abiotic resources (fossil) (MJ, net calorific value), and
  • Depletion of abiotic resources (elements) (kg Sb eq.).
Midpoint impact indicators were calculated according to the equivalence method. This consists in converting impacting substances flows to a reference that is substance-specific to each indicator.
Seventeen flows indicators complete impact indicators. For the conciseness of the study, six of them were selected:
  • Consumption of renewable energy resources (MJ),
  • Consumption of non-renewable energy resources (MJ),
  • Radioactive waste (kg),
  • Hazardous waste (kg),
  • Non-hazardous waste (kg), and
  • Fresh water (m3).
The compatibility with the software OpenLCA was established by Tiffany Desbois (Method created by Tiffany Desbois—Cerema/DTerOuest/Laboratoire of Saint-Brieuc, September 2016 for impacts categories and January 2017 for flows indicators. Details are mentioned in the Cerema report in French entitled “Environmental assessment method under OpenLCA according to the NF standard EN 15804 + A1 and the complementary standard NF EN 15804/CN”, dated 4 December 2017).

3.3. Data Collection

All data were collected from in-situ measurements, staff interviews, and reports of a “data collection form” completed by companies in charge of demolitions. Data collected were reported on internal documents from Cerema (the center for studies and expertise on risks, the environment, mobility, and planning, a French public establishment under the supervision of the Ministry of Ecological and Inclusive Transition and the Ministry of Territorial Cohesion). Data collected were verified and validated by companies involved in all stages as well as by Cerema’s expert [37,38]. Therefore, these data are considered reliable and precise. Data are specific to each demolition work. An example of the collection data document is presented in Appendix A.

4. Case Study and Results

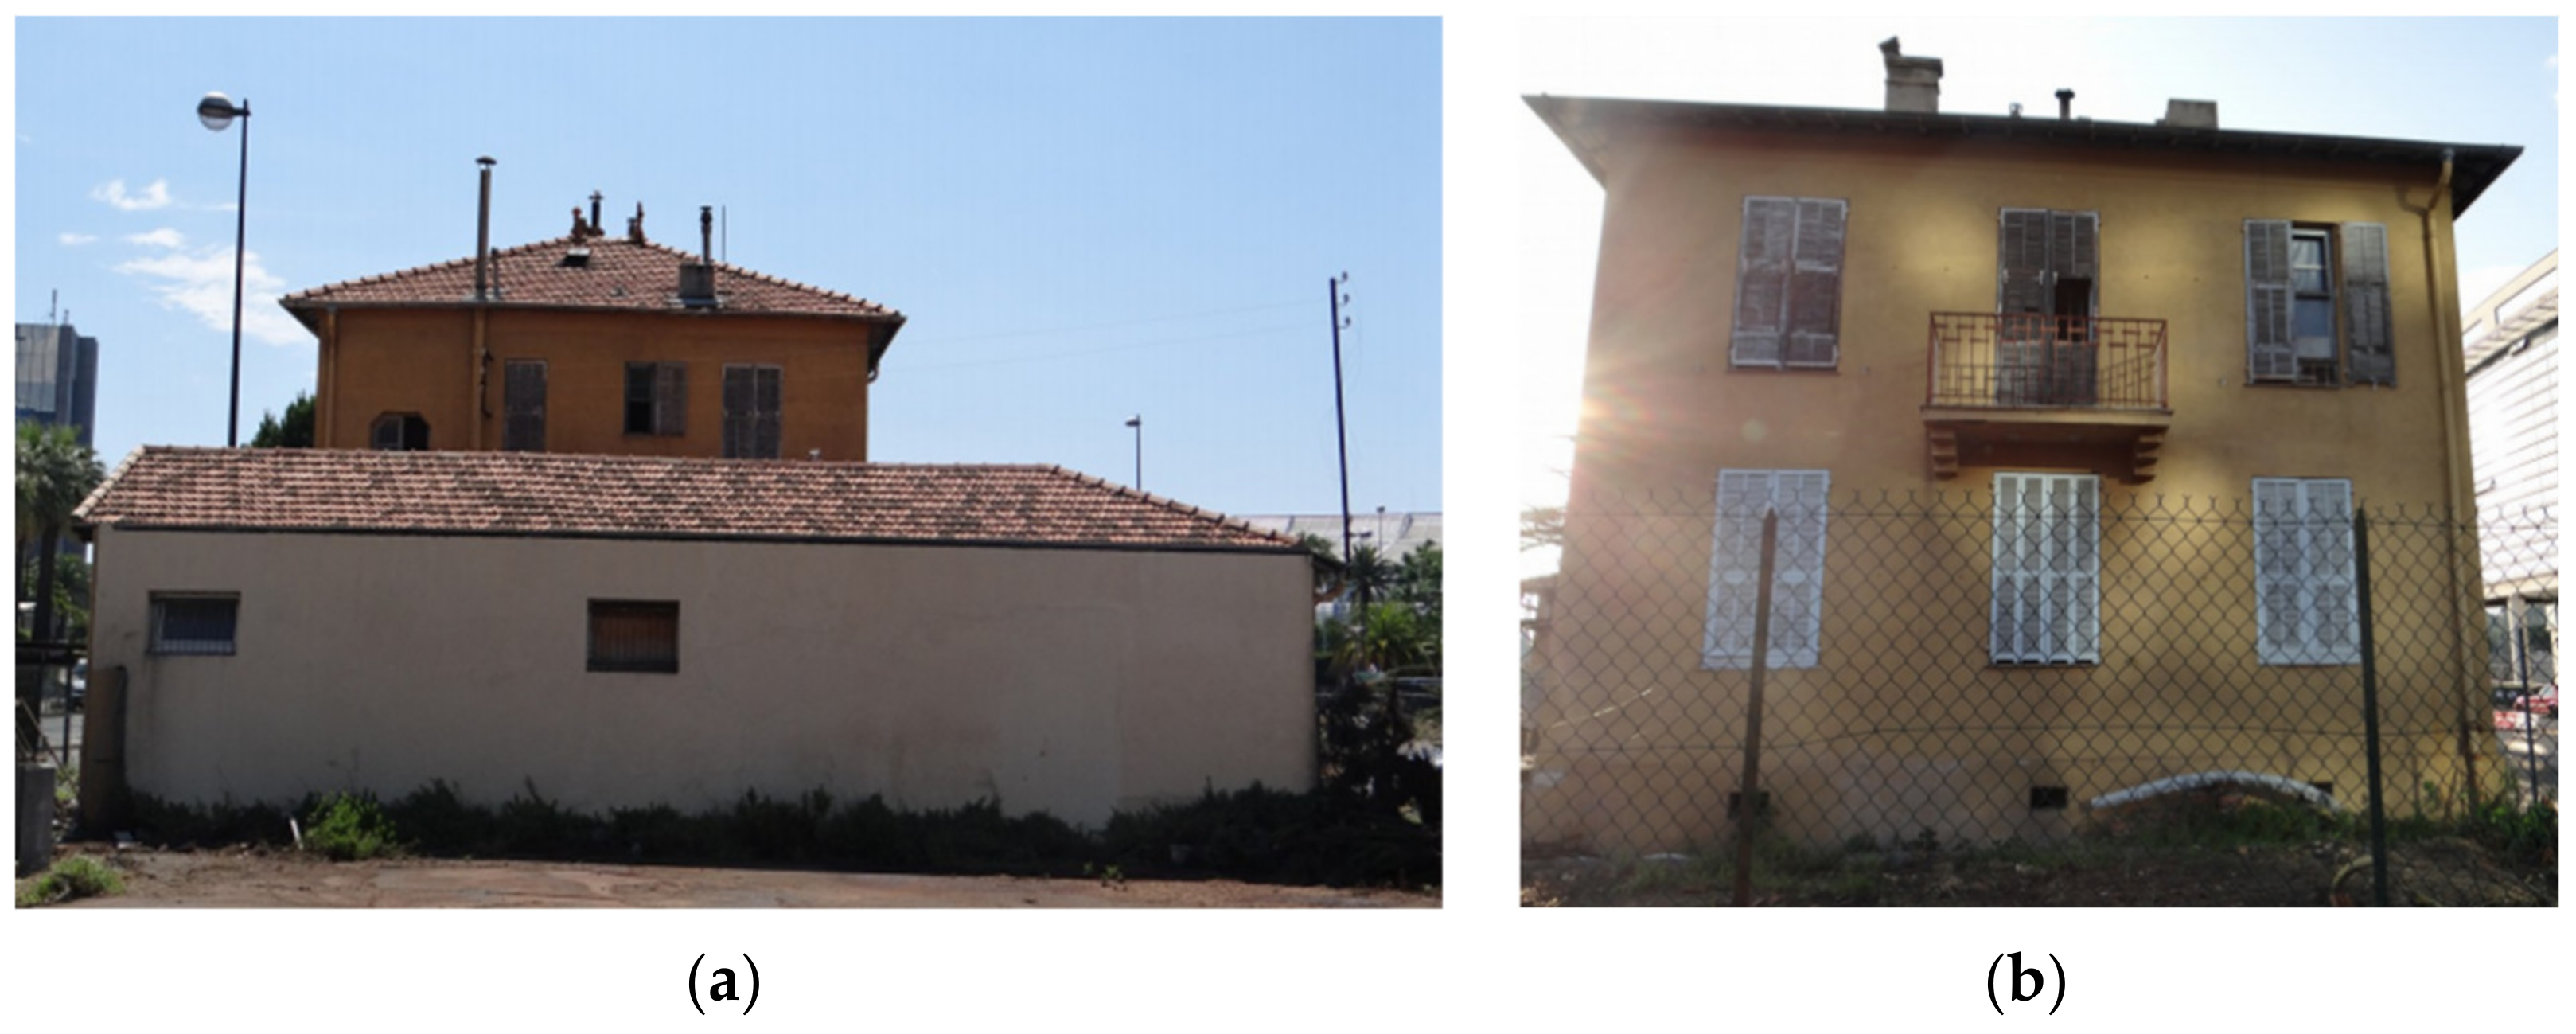
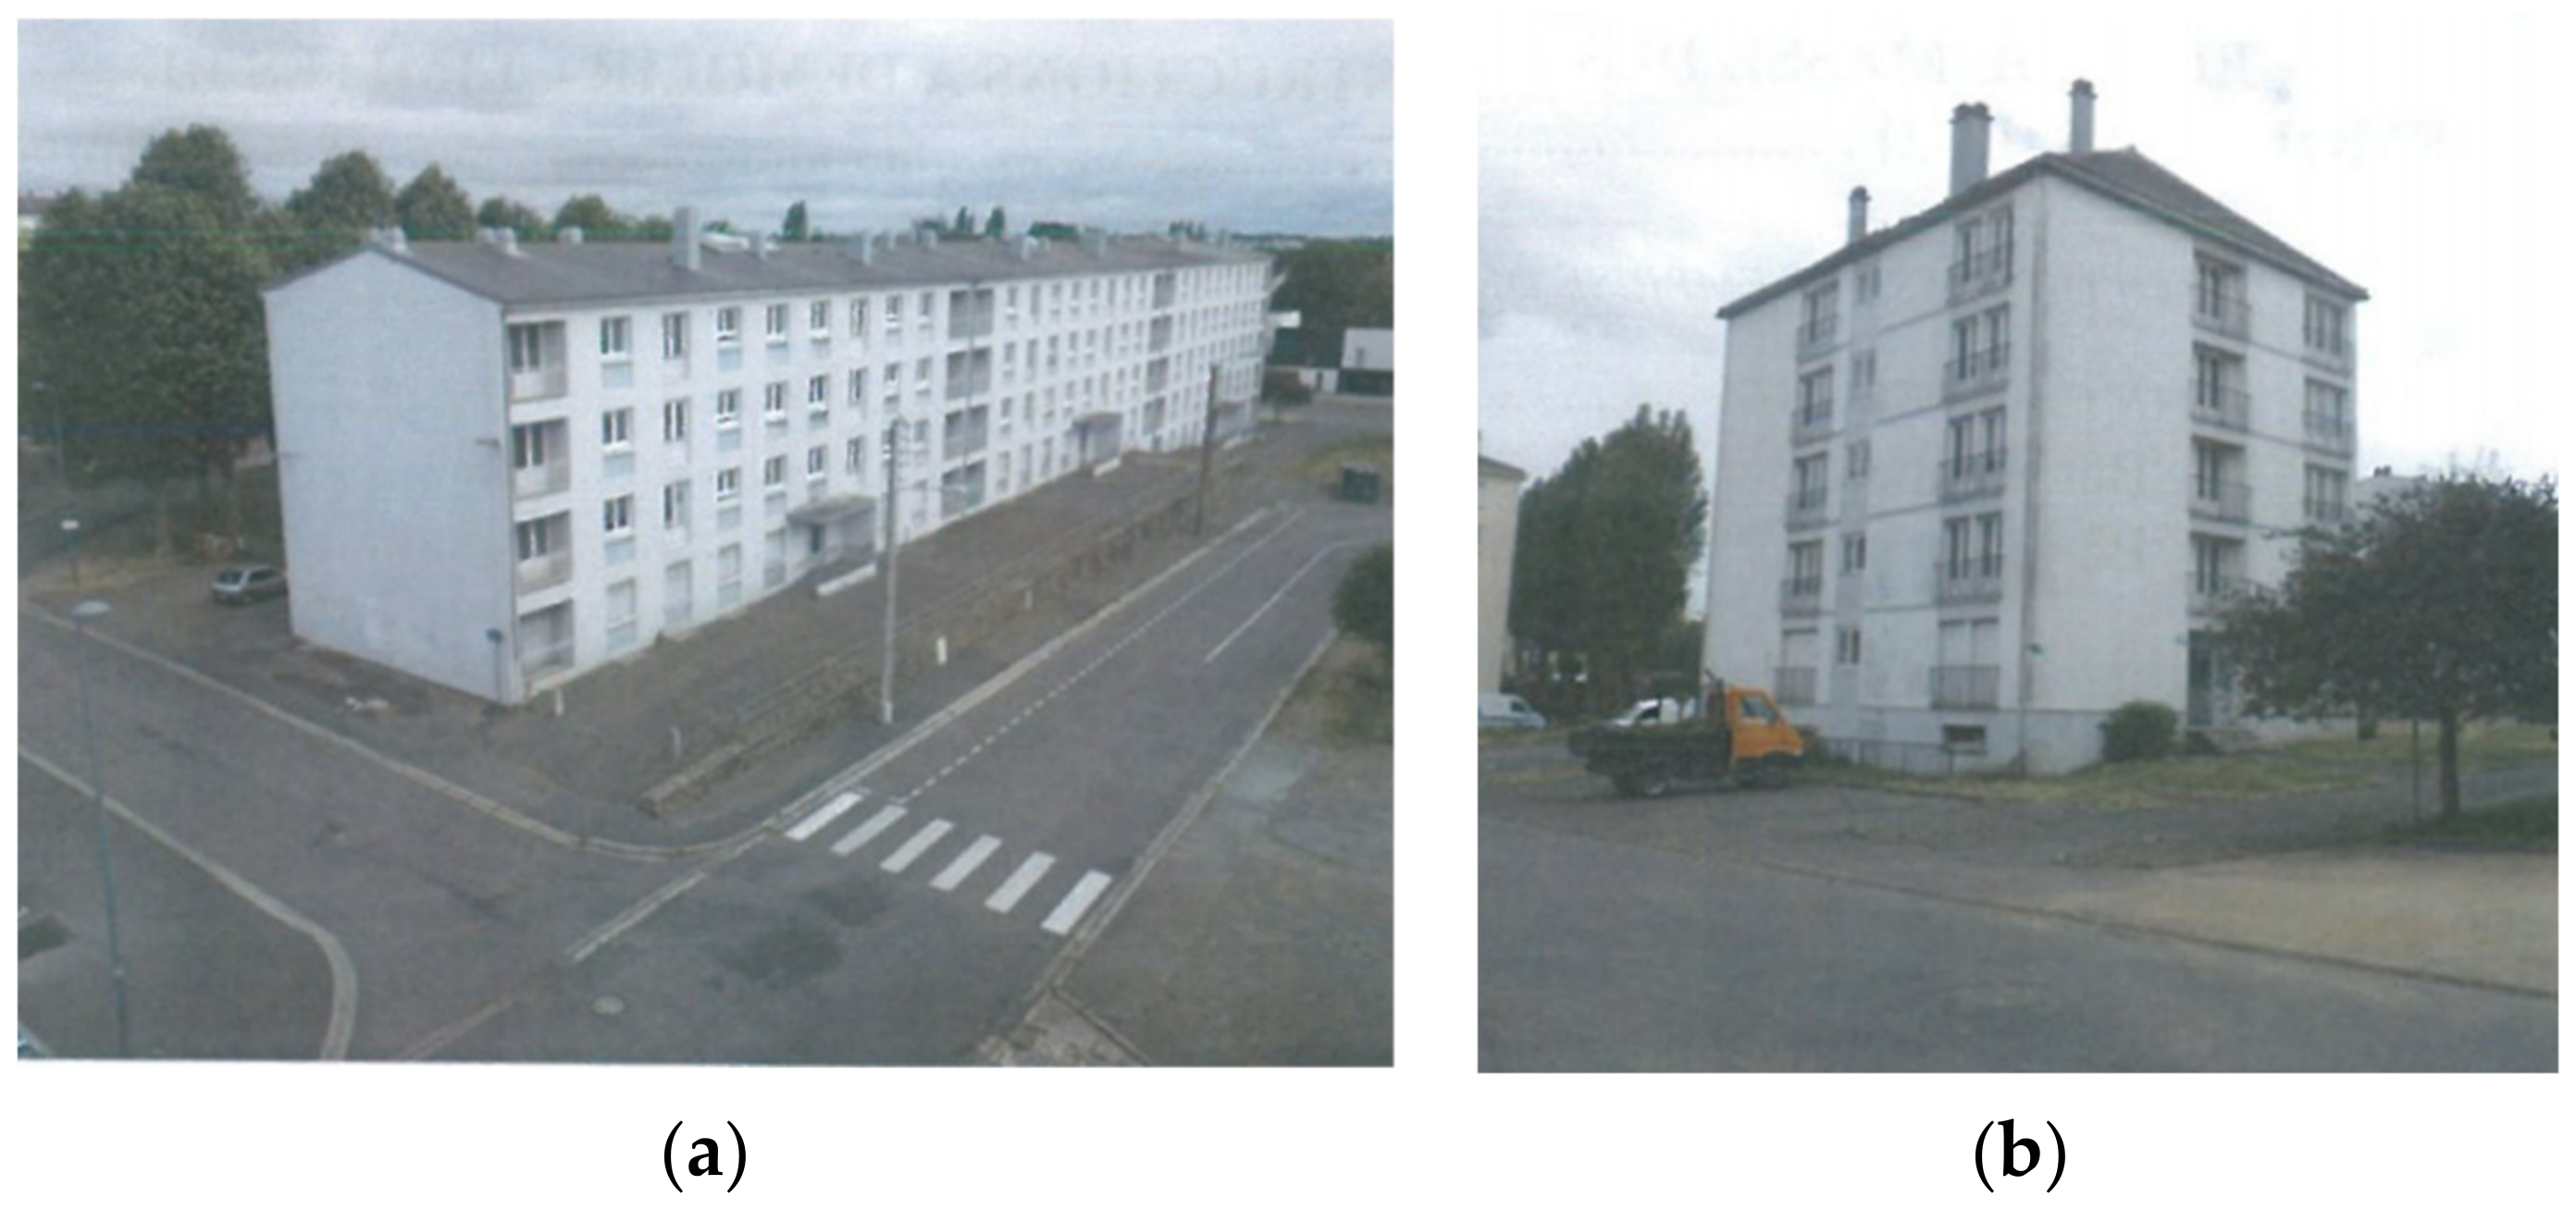
4.1. Definition of the Case Study

Two demolition sites were selected because of the amount of data collected for the completion of the life cycle assessment exercise. The buildings demolished were both residential buildings located in France. In order to simplify the denomination of these demolition sites (and buildings), the first will be hereon called “A” and the second one “B”.

4.1.1. Demolition Site of Building A

The first building was located on a future multimodal hub which will serve as an exhibition center. Consequently, access was easy because large roads and parking lots allow for an acceptable machinery transport and circulation around the building.
This demolition site included three constructions: the first one was a two-story residential building of about 10 m by 10 m (Figure 2a,b). The roof was made of tile timber frame. The second structure was a house annex of about 5.5 m by 18 m (Figure 2a) with a tile timber frame. The total surface of the floor was 300 m2. The last one was a bike shelter, which was not included in the life cycle assessment due to its specificity. [37]
The demolition work took place in 2016. The demolition of the finishing work was done by hand and the demolishing of structural work was done by an excavator. This demolition site produced 388 tons of construction and demolition waste, including 273 tons of rubble used for the production of recycled aggregates.
Waste produced during this demolition was asbestos waste, wood, household waste, metal, inert material as stone, roof tiles, and structural concrete. For the study, it was considered that inert waste (rubble including stone, concrete, and brick) was recycled for the production of recycled aggregates.

4.1.2. Demolition Site of Building B

This second building was located at a suburban area and thus, the access was easy. The demolition site consisted of two social-housing buildings (about 5487 m2 of floor area and 3 or 4 levels depending on the building) (cf. Figure 3a,b).
Both buildings were made from precast concrete elements and had a roof made of tile timber frame. The demolition took place in 2017. The total quantity of demolition waste produced was 7115 tons such as asbestos waste (such as plinths, floor tiles, glue, flange gaskets, and asphalt), wood, inert waste, shear iron and cast iron, and ordinary industrial waste. This included 6738 tons (about 95% of the waste amount) of rubble potentially used for the production of recycled aggregates.

4.2. Quantifying the Environmental Impacts of the Buildings’ Demolition and the Production of Recycled and Virgin Aggregates

Based on the life cycle assessment, this study aimed to quantify and compare the environmental impacts of the end-of-life phase of the two buildings. Moreover, the quantification and comparison of the environmental impacts arising from the recycling of the acquired wastes for the production of recycled aggregates was the focal point of the study.

4.2.1. Goal and Scope

The objectives of this study were twofold. The first objective of the study was the quantification of the environmental impacts of the end of life of the two buildings and the performance of a hotspot analysis in order to identify which stage in the end-of-life phase of the buildings was the most impactful. The second one, by expanding the scale of the study, was the quantification of the environmental impacts coming from the production of recycled aggregates when end-of-life construction and demolition waste was considered as a resource. In addition, a sensitivity analysis on the part of end-of-life phase allocated to the production of recycled aggregates was carried out.

4.2.2. Assumptions Made for the Study

For this study, no cut-off rules were used. Nevertheless, some consumables were not modeled due to a lack of data (cf. Section 4.2.3 about system boundaries).
For the production of recycled aggregate, it was considered that 1 ton of rubble (inert waste to produce recycled aggregates) produces 1 ton of recycled aggregate. This was provided from [34] and the FDES (French environmental information module) from the UNPG (Union Nationale des Producteurs de Granulats/French National Union of Aggregate Producers) [39].
The recycling process was common to both building case studies. This process was extracted from [40]. The system of this process is presented in Figure 4. Flows are listed in Table A1 in Appendix B for 1 kg of inert waste.

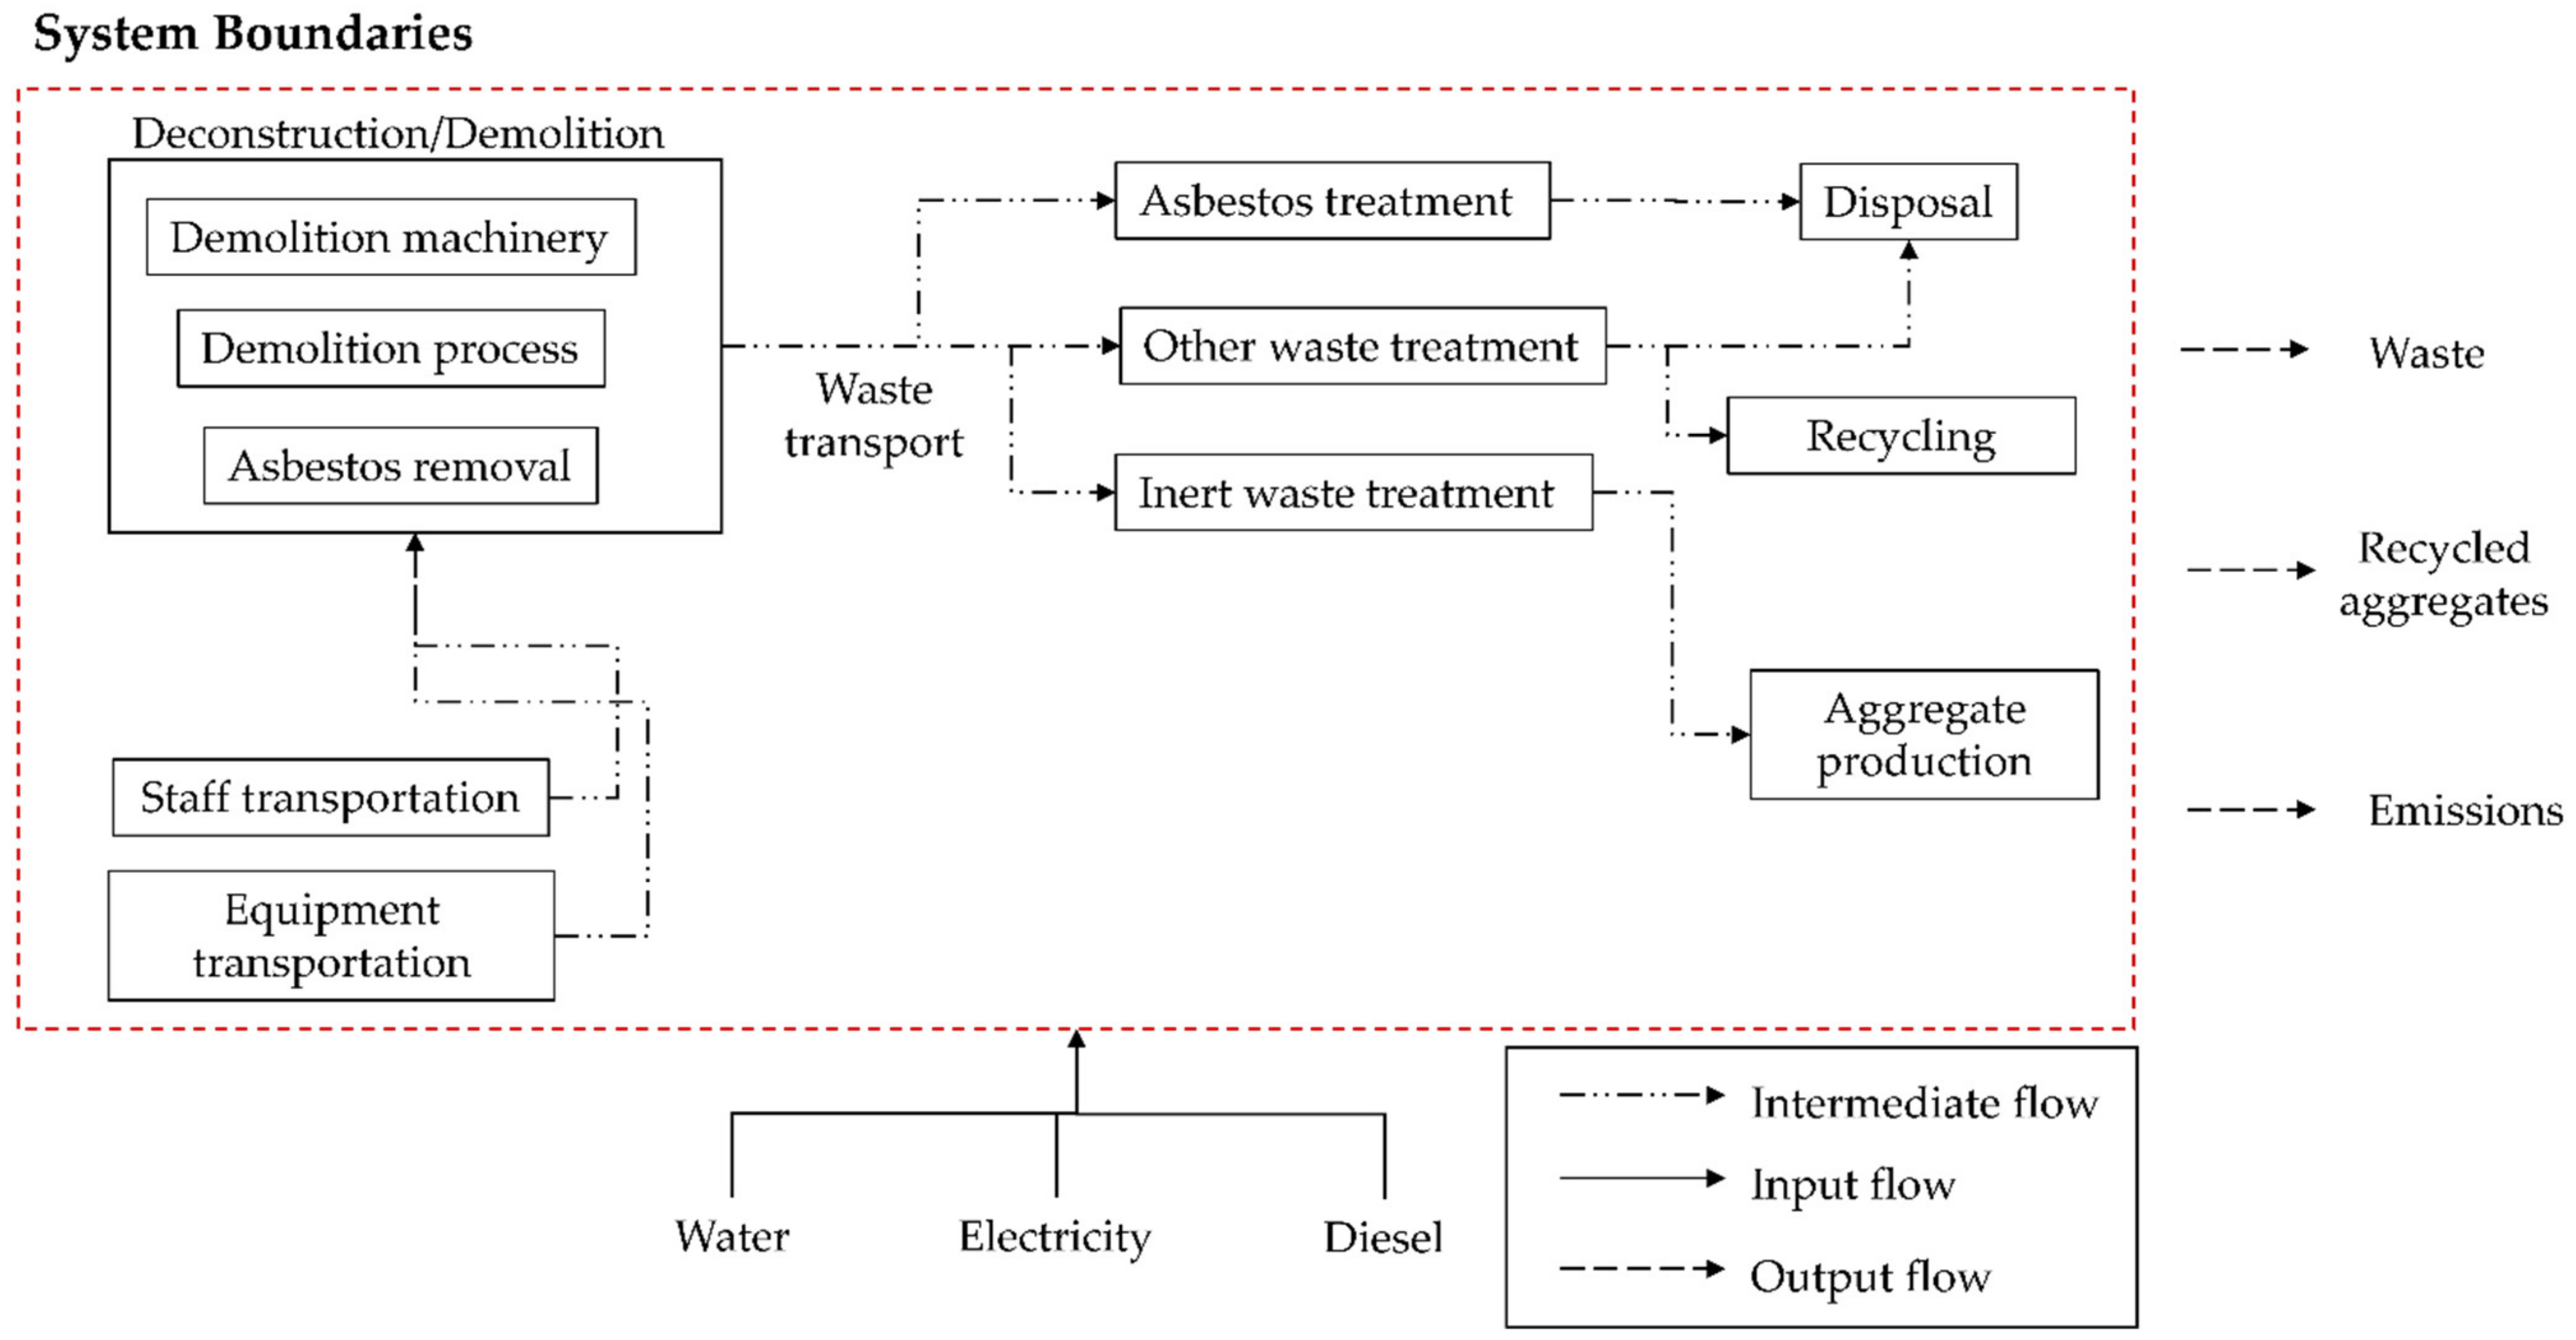
4.2.3. System Boundaries and Functional Unit

The system boundaries of this study are represented in Figure 5. This study was about the end of life and Module D, i.e., phase C1 to C4, and D according to the standard NF EN 15804 + A1. Consequently, the flows taken into account were:
  • Transport and production of materials used on site (embankments),
  • Transport and production of consumables,
  • Transport and production of limited use supplies,
  • Transport on site and consumption of machinery,
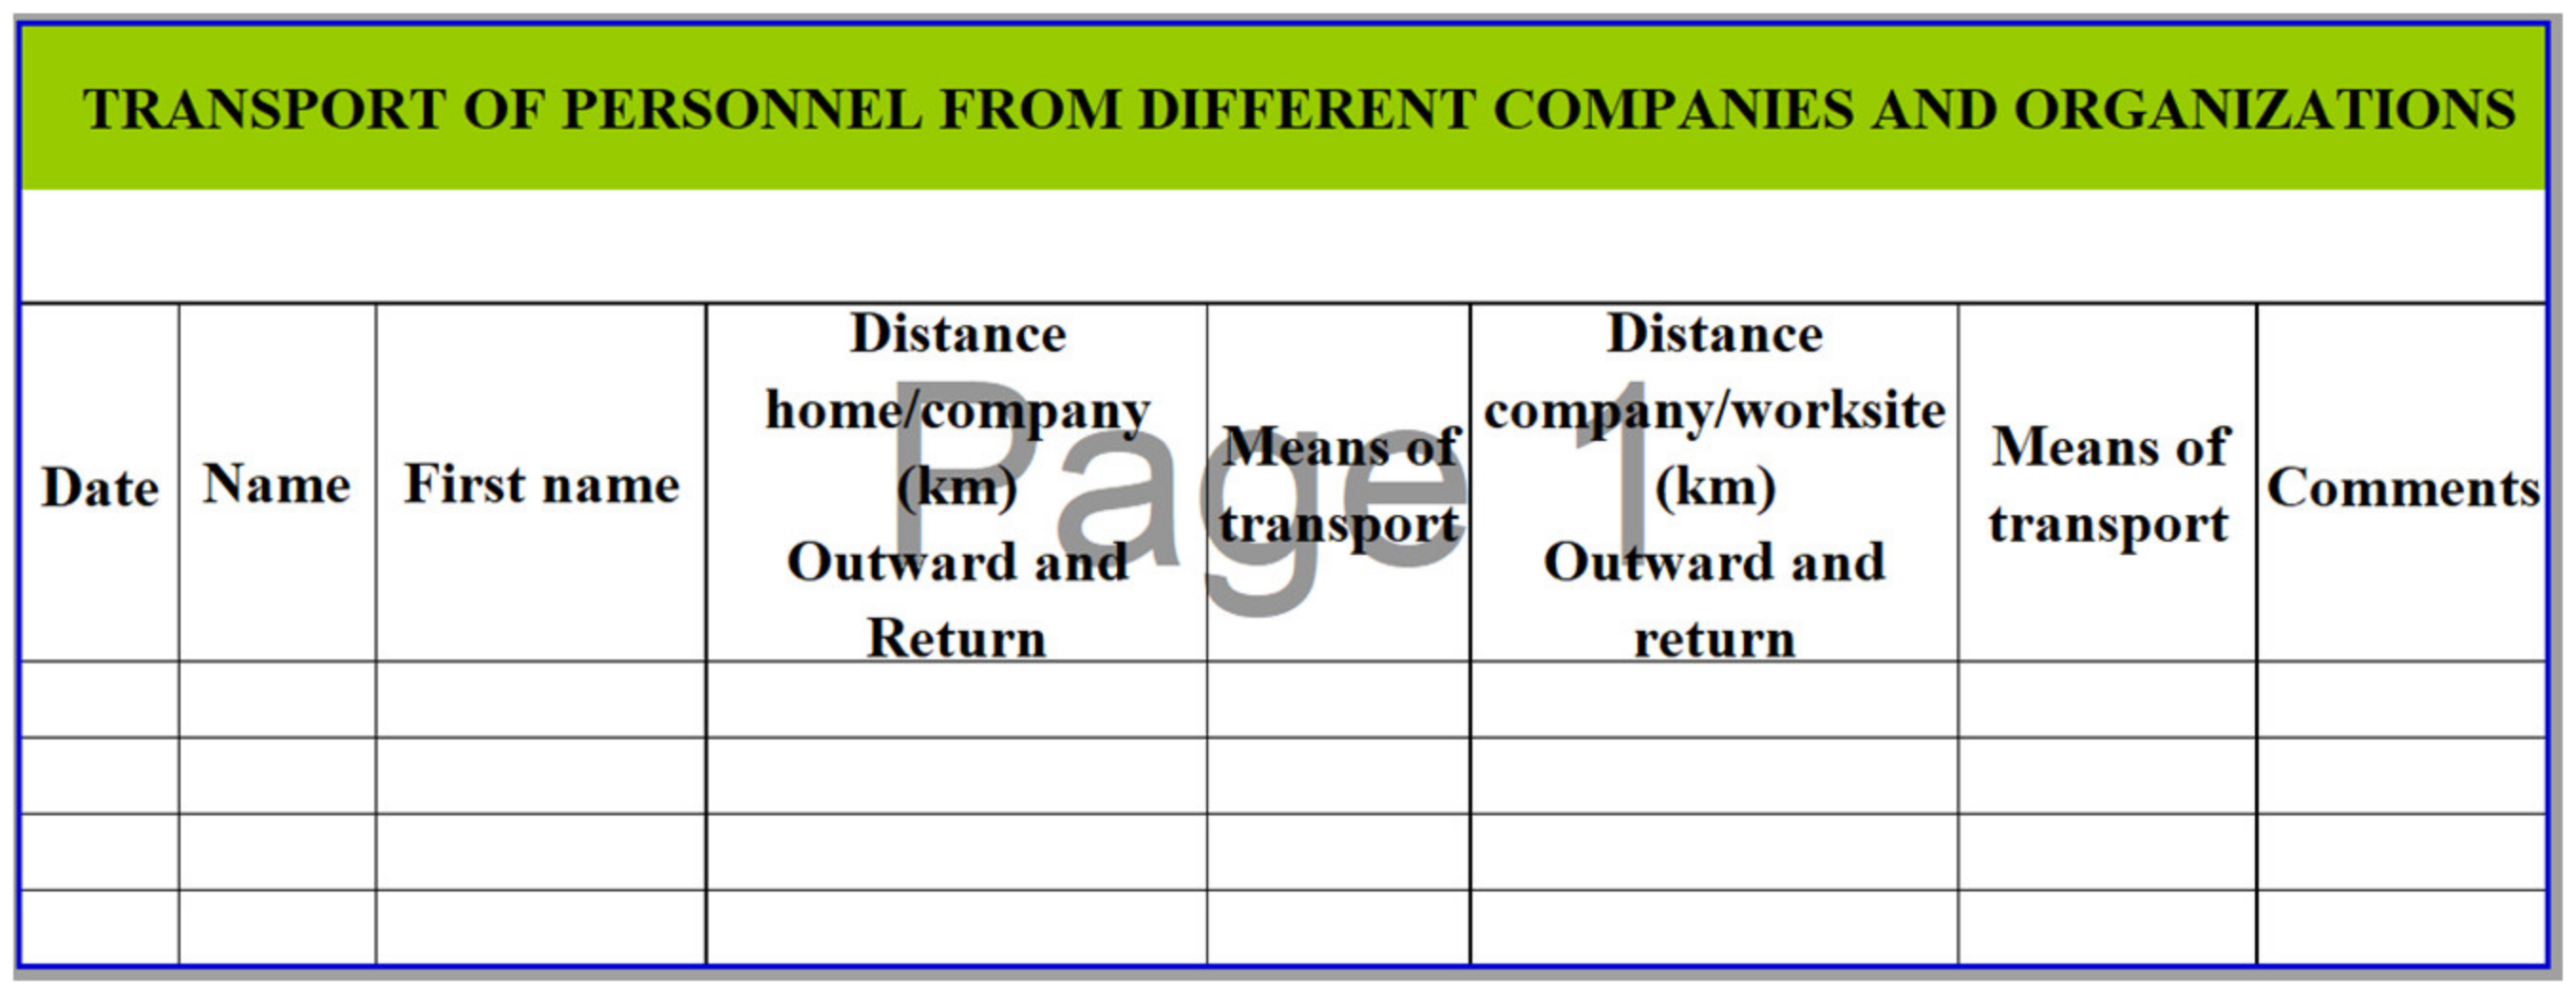
  • Transport of staff,
  • Transport and treatment of materials from demolition,
  • Transport of site installation (site life base for workers),
  • Electricity consumption, and
  • Water consumption.
However, the following flows were not taken into account:
  • Production of limited use supplies and consumables,
  • Construction machinery production,
  • The administrative department,
  • Production of site installation (site life base for workers), and
  • Production of consumables for recycling aggregates process.
For this study, two functional units depending on the scale were studied:
(1) 
“to demolish 1 m2 of floor area of an asbestos building”
(2) 
“to produce 1 t of aggregate”
The functional unit (1) was used to analyze results at the scale of the building’s end of life. This unit enabled us to study the environmental impacts of the end-of-life phase of a building and to compare the two different buildings. Due to the complexity of separating data from asbestos removal (consumption, transport of staff…) from other stages, data from asbestos were included in our study. The unit “square meter of floor area” is the most widely used reference metric for residential buildings.
The functional unit (2) can provide insights into the impact of the production of recycled aggregates from an asbestos-containing-and-demolished building and allow to compare the production of recycled aggregate with the production of virgin aggregates. Thus, it highlighted the importance of the end of life of the building in which the aggregate is produced.
To express results with the functional units, the global impact result for all the systems (i.e., building’s end of life) was computed and then divided by the floor surface for the functional unit (1) and by the quantity of aggregates produced for the functional unit (2). Consequently, there is a relationship between the two functional units for the same building. The relationship can be found below (Equation (1)):
F U 2 X = F U 1 X * S X M X
X: Studied building
FU1(X): Value of building X for functional unit (1)
FU2(X): Value of building X for functional unit (2)
S(X): Floor surface of building X
M(X): Mass of aggregate produce by building X
Nevertheless, the ratio surface over mass varies from one building to another. Hence, results of impacts for both buildings were different for the two functional units.

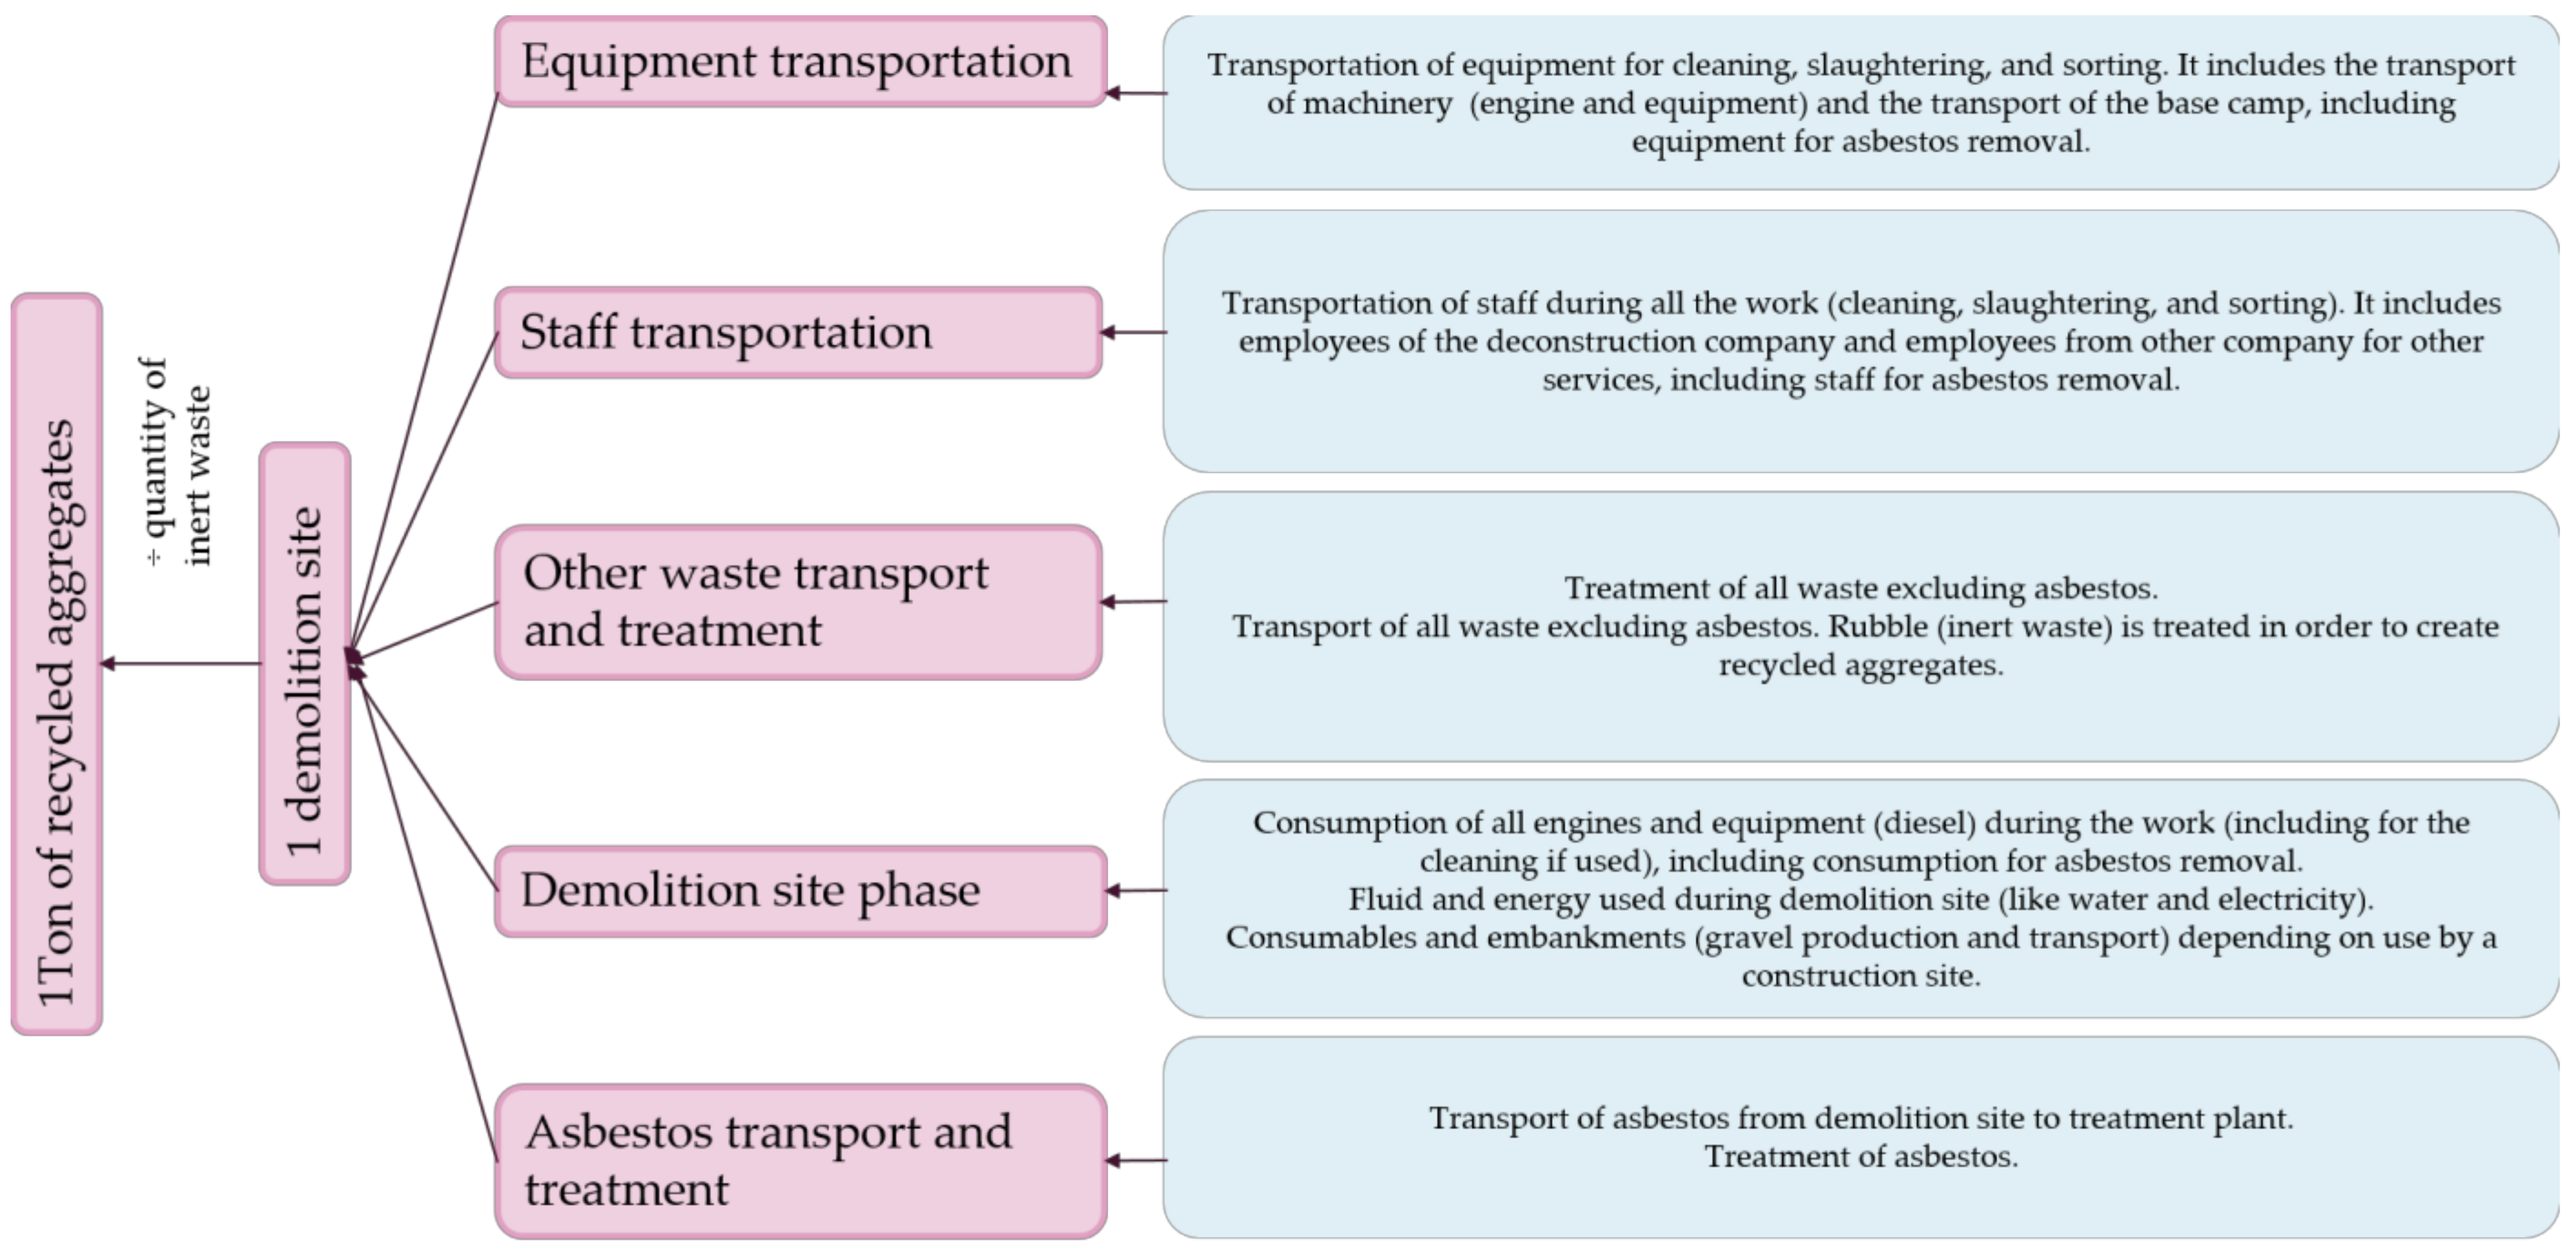
4.2.4. Data and Life Cycle Inventory

Life cycle inventory is divided into five categories:
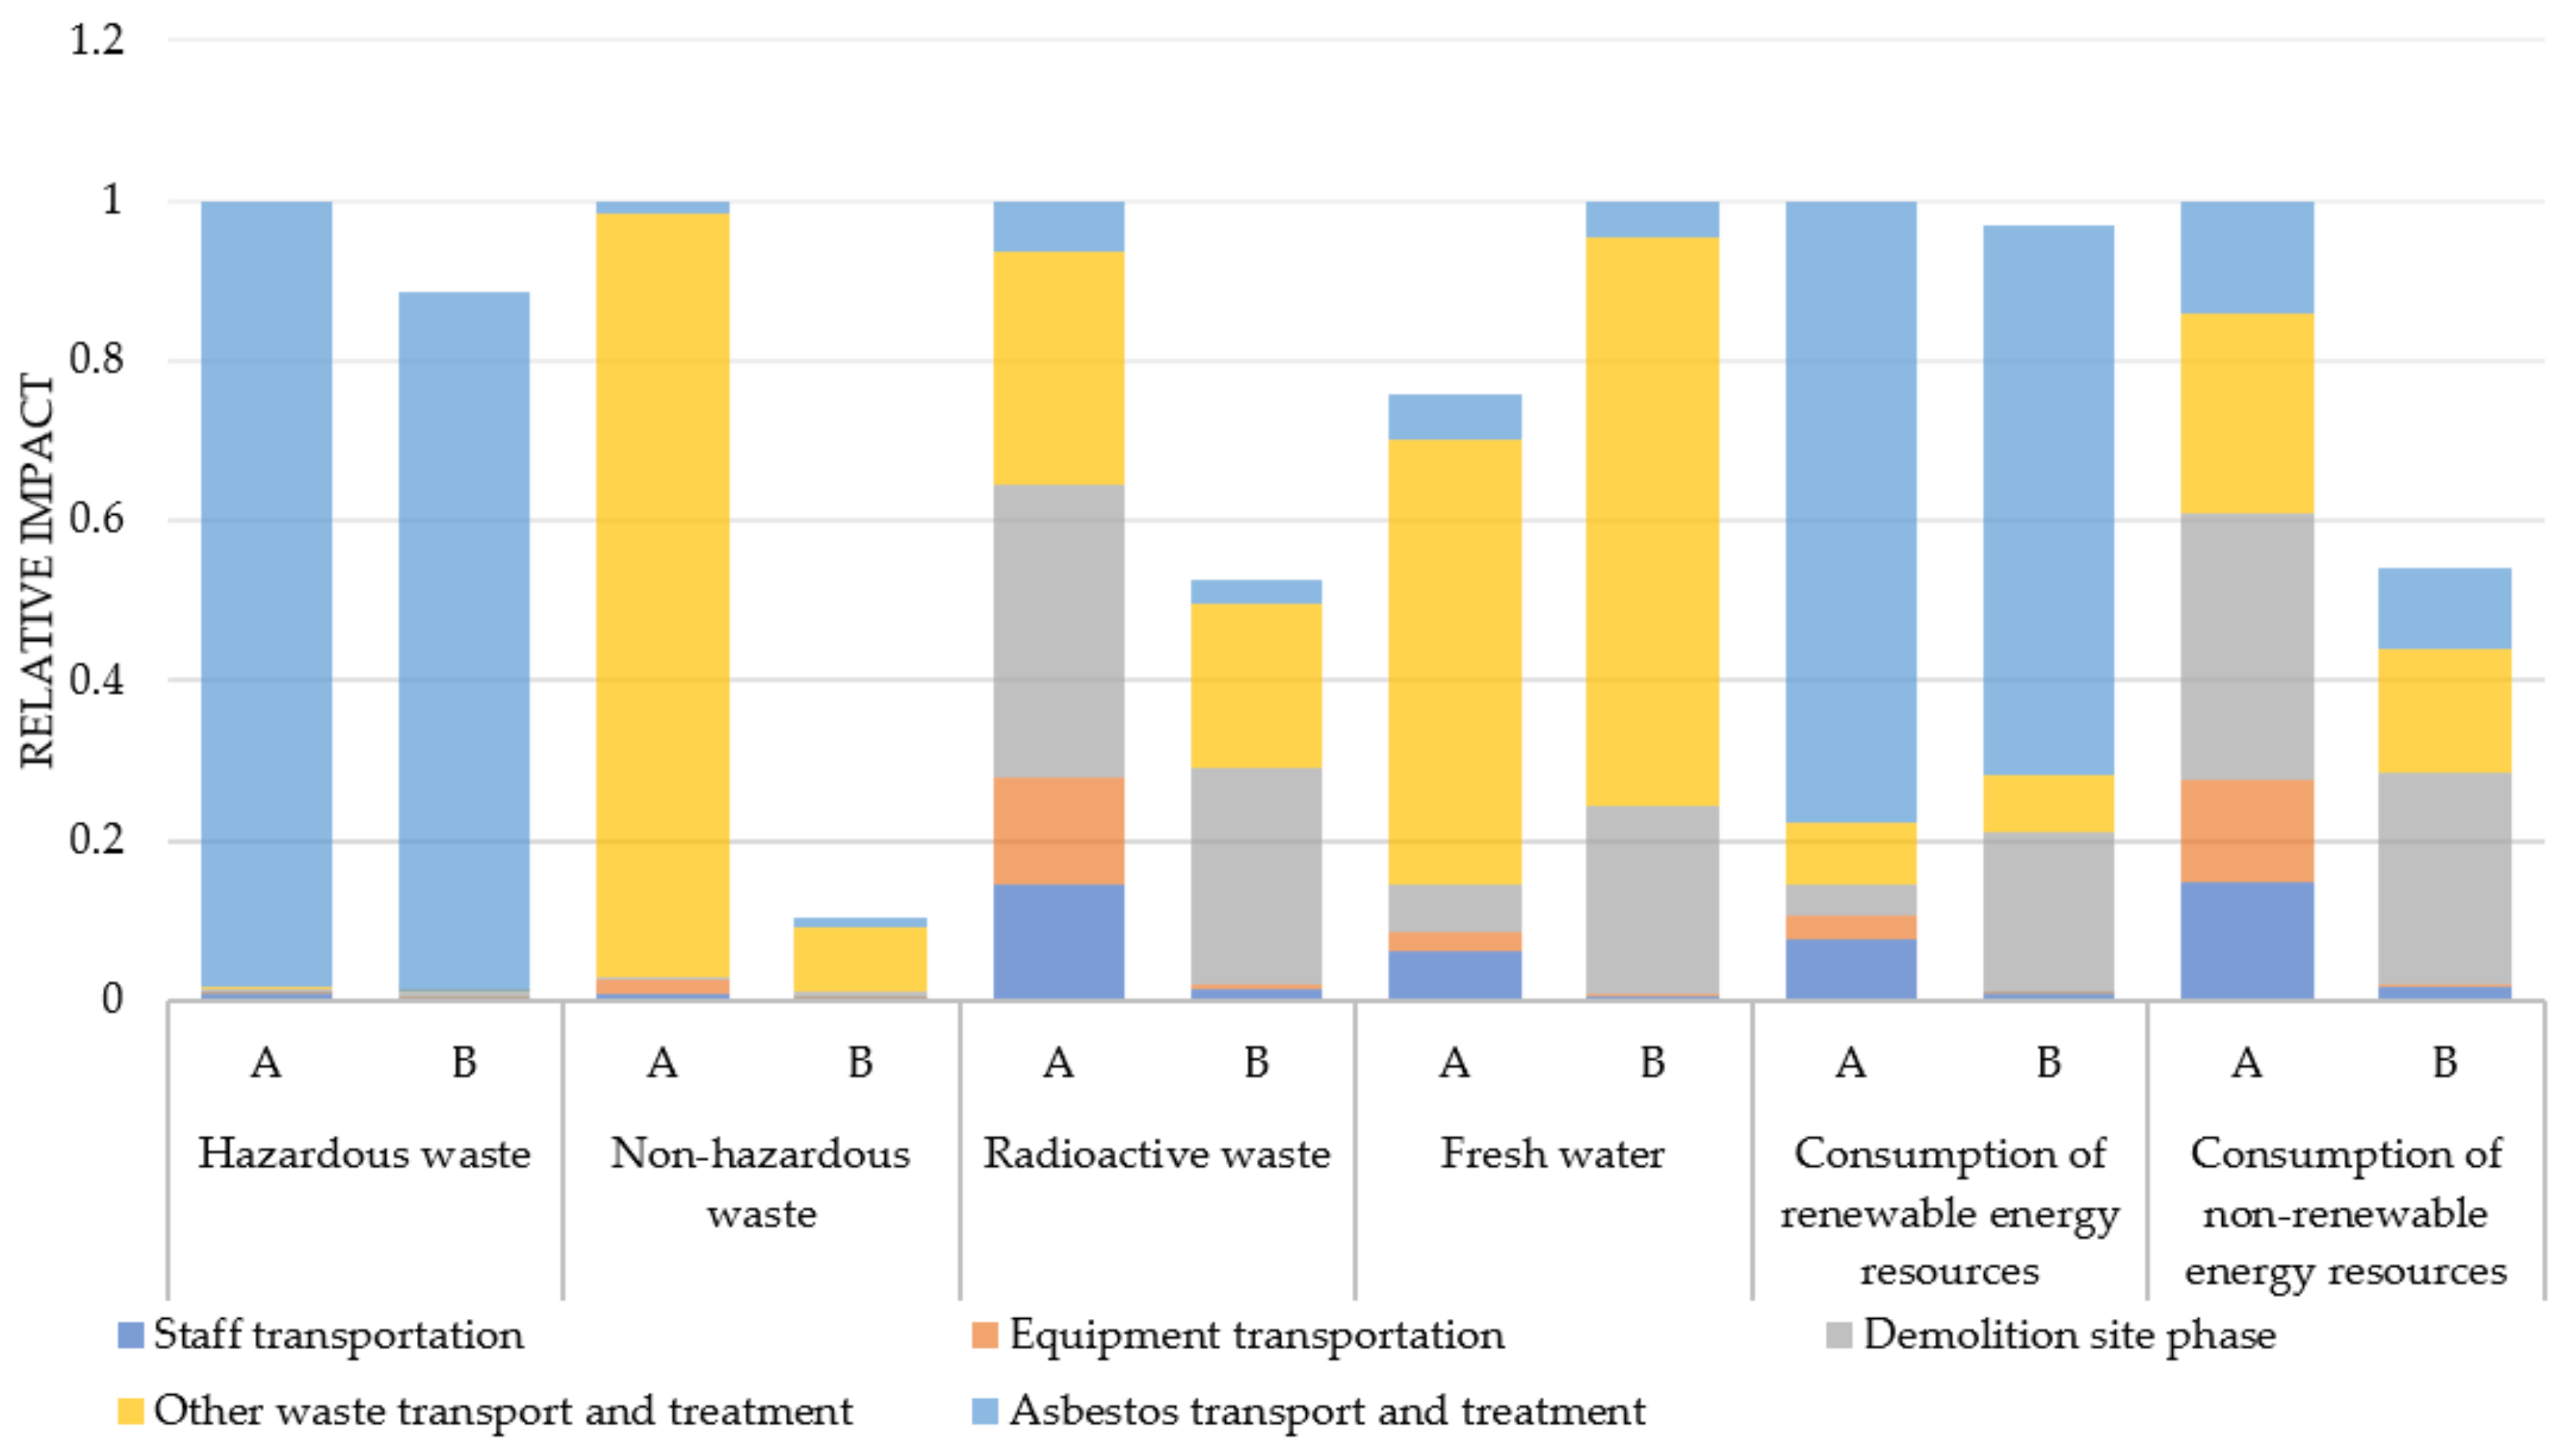
  • Staff transportation,
  • Equipment transportation,
  • Asbestos transport and treatment,
  • Other waste transport and treatment, and
  • Demolition phase.
The demolition phase included the use of demolition machinery, fluids, electricity, consumables, and embankments used during the demolition. Figure 6 sums up the elements included in each category. As mentioned previously (Section 4.2.2), data were specific to demolition site except for the treatment of rubble into recycled aggregates. Nonetheless, processes were based on Ecoinvent® database and were not necessarily elementary flows.
Before presenting the life cycle inventory of buildings A and B, it should be remembered that the inventory of the process of the treatment into recycled aggregates mentioned in Section 4.2.2 [37] is presented in Table A1 of Appendix B. This process was applied to both buildings.

4.2.5. Life Cycle inventory of Building A

The processes and quantities used for the entire building can be found in Appendix B, Table A2. To align the life cycle inventory with the functional units, the total building inventory was divided by the surface of floor (300 m2) for functional unit 1 or divided by quantity of inert waste produced (276 t) for functional unit 2.
Asbestos waste was transported by trailer over 255 km to be landfilled in a hazardous waste plant. The process for the treatment consisted of the transport to a landfill in a German old salt mine due to a lack of other data. To transport this waste, trailers of 17 t to 25 t were used. It was noticed that demolition site A produced 276 t of inert waste. There were no consumables and no need of embankments. The use of construction machinery included energy for asbestos removal. On the category of equipment transportation, the transport of the worker base life installation and the transport of demolition machinery were taken into account. As a reminder, depreciation of equipment was not taken into account. Data included asbestos removal. For staff transportation, all travels of staff (workers and various services, including asbestos removal) were gathered. For this demolition site, three transportation means were used: train, small car, and medium car.

4.2.6. Life Cycle Inventory of Building B

For building B, the processes and quantities used can be found in Appendix B, Table A3. To compile the life cycle inventory for the functional units, the total building inventory was divided by the surface of floor (5487 m2) for functional unit 1 or divided by quantity of inert waste produced (6738 t) for functional unit 2. Asbestos waste from the building were transported by semi-trailers over 670 km in order to be vitrified. However, this treatment was not considered in the study due to significant lack of data. Asbestos asphalt was transported by trailer over 8 km to be landfilled. The process for the treatment was a landfill in a German old salt mine as for building A. Regarding the demolition of building B, due to lack of precise data, shear iron and cast iron were considered as reinforcement steel. For the specific study, inert waste was recycled. In order to avoid a bias on the distance between the deconstruction site and the treatment and aggregate production plant, an average distance based on the case study of building A was used. It was noticed that the demolition site produced 6738 tons of inert waste. It is worth mentioning that the production of specific consumables was not taken into account. That was the case for consumables that are not gravel such as wood, saw blade, concrete, air filter, and self-locking strap. Nevertheless, their transport (by a minivan considered as a large size passenger car) was taken into account. Energy for asbestos removal was included in the use of demolition machinery.
Considering equipment transportation, the transport of the base life for workers and the demolition machinery were taken into account. Nonetheless, depreciation was not taken into account as for building A. The total mass of the site installation was estimated by expert opinion. The transport of the machinery was also estimated and classified into three categories: light, medium, or heavy. These data also include asbestos removal. For staff transportation as for building A, all in-site movements were considered. Two types of data were provided by the demolition company: travel from company staff and travel from service providers. There were three types of transportation means: large-sized car, small-sized car, and trailer.

4.2.7. Data Quality Assessment

All the data required for the study were collected as primary data on site and as secondary data from official producers of the materials under study, reputable online sources, or the literature. Following the recommendations of ISO 14044 [7], information about the source and the quality of the data of each stage and material is shown in Table 1. Moreover, following the EU commissions guidelines [41] about the assessment of the data quality, Table 1 was generated. Data were assessed in terms of type and source and the quality requirements that were taken under consideration were quality level and rating, representativeness, completeness, methodological appropriateness and consistency, and finally, uncertainty [7,16,41]. In terms of data quality, according to JRC, the data quality was satisfactory, as the overall score was 2.62, corresponding to data quality levels between “good” and “fair”.

4.3. Results Obtained and Discussion

Results will be presented under a two-scale approach: the building’s end of life and the production of recycled aggregates. First, the results for environment impact indicators are presented and then those for the flow indicators.

4.3.1. Scale of the Demolition Site

For the building’s end-of-life scale, the reference was the functional unit of 1 m2 of demolished building containing asbestos waste. Table 2 presents values for the impact category indicators of the building’s end of life. Figure 7 shows the distribution of the relative impacts according to the different categories detailed previously in Section 4.2.4.
In Table 2, impacts of the two case studies are very different. Demolition site A appears to be almost twice impactful as demolition site B. Figure 7 confirms this observation. All impact indicators for building B were indeed between 43% and 49% of those of building A, except for the “depletion of abiotic resources (elements)” where the situation was reversed. However, it was due to the embankments added on demolition site B (and not A). Its impact for this indicator was indeed 3.94 × 10⁻⁵ kg Sb eq. for the entire site, so it corresponds to 80% of the total “depletion of abiotic resources (elements)” impact (4.89 × 10−55 kg Sb eq. for the total impact of the demolition site).
Moreover, Figure 7 shows that all the building’s end of life categories had a significant overall impact for each impact indicator. Nonetheless, three categories were predominant: asbestos removal (asbestos transport and treatment) up to 38% for building A and photochemical ozone creation; other waste treatment and transport (structural work and finishing work) up to 26% for building A and ozone depletion; and demolition site phase up to 58% for building A and eutrophication. Equipment and staff transportation were very low for building B, which could be explained by a scale economy due to the much larger floor area and compactness of building B. Impact distribution for categories were similar between buildings A and B. For example, for global warming, in both case studies’ “demolition site phase” impact (36% for A, 27% for B) was higher than “asbestos transport and treatment” (18% and 13%) or “other waste transport and treatment” impact (19% and 12%) and those were higher than “staff transportation” impact (16% for A, 2% for B) followed by “equipment transportation” impact (12% for A, <1% for B).
A similar analysis pattern could be observed for the flow indicators. Table 3 presents the value of flow impact indicators for both buildings A and B. Figure 8 shows the comparison and distribution of categories (life cycle stage) for each flow indicator.
In contrast to the impact category indicators, flow indicators applied to both case studies were not as uniform. Effectively, some indicators were very similar for both buildings, such as the consumption of renewable energy resources with 32.04 MJ and 31.03 MJ (respectively for building A and Building B) or hazardous waste with 31.05 kg and 27.48 kg. However, some indicators had a relevant difference, such as “consumption of non-renewable energy” and “non-hazardous waste”. To understand those differences, it is possible to study the distribution of impacts in the same figure.
About the distribution of categories, there was a significant disparity between the indicators for the two buildings. As it might be expected, asbestos contributed the most to hazardous waste and conversely, other waste contributed to non-hazardous waste. The lower value for building B in comparison to building A for those two flow indicators confirmed the better compactness of B (optimization of floor surface for a same volume of building construction). Transport and treatment of other waste contributed a lot to the indicator of fresh water (56% for building A and 71% for building B)
For the scale of the demolition site, it can be concluded that the impact of a demolition site can vary a lot depending on each case. This major difference could be linked mainly to compactness of the building or the functionality efficiency. Nevertheless, for the environmental impact indicators, the distribution was similar between the two case studies. The most impacting elements were the treatment of waste produced by the buildings (including asbestos), followed in parallel by the use of energy for the construction machinery and, to a lesser extent, the transport of staff and equipment.

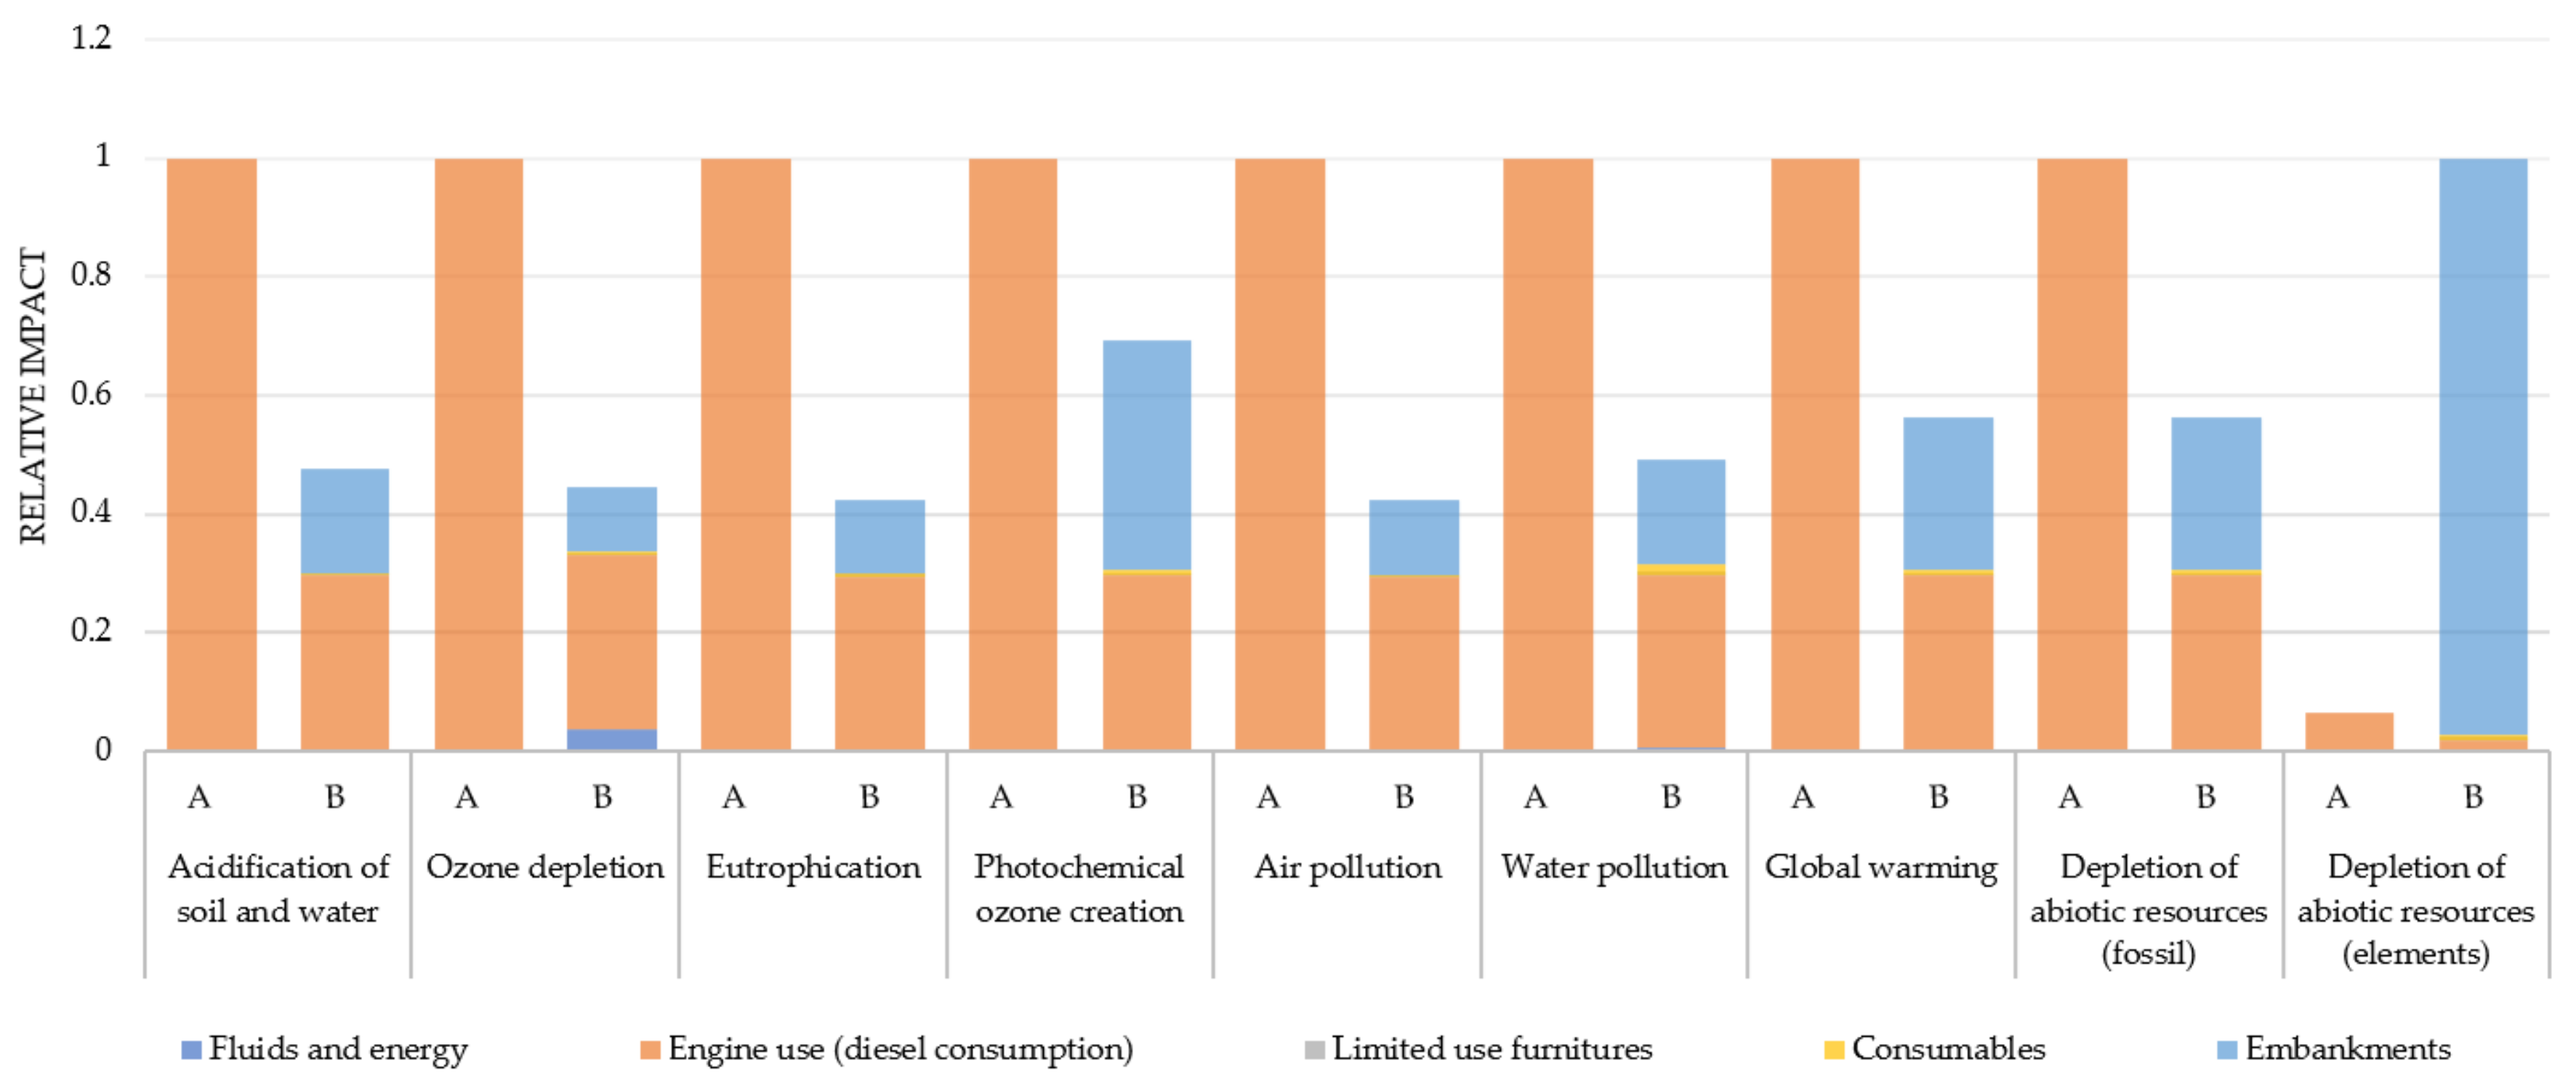
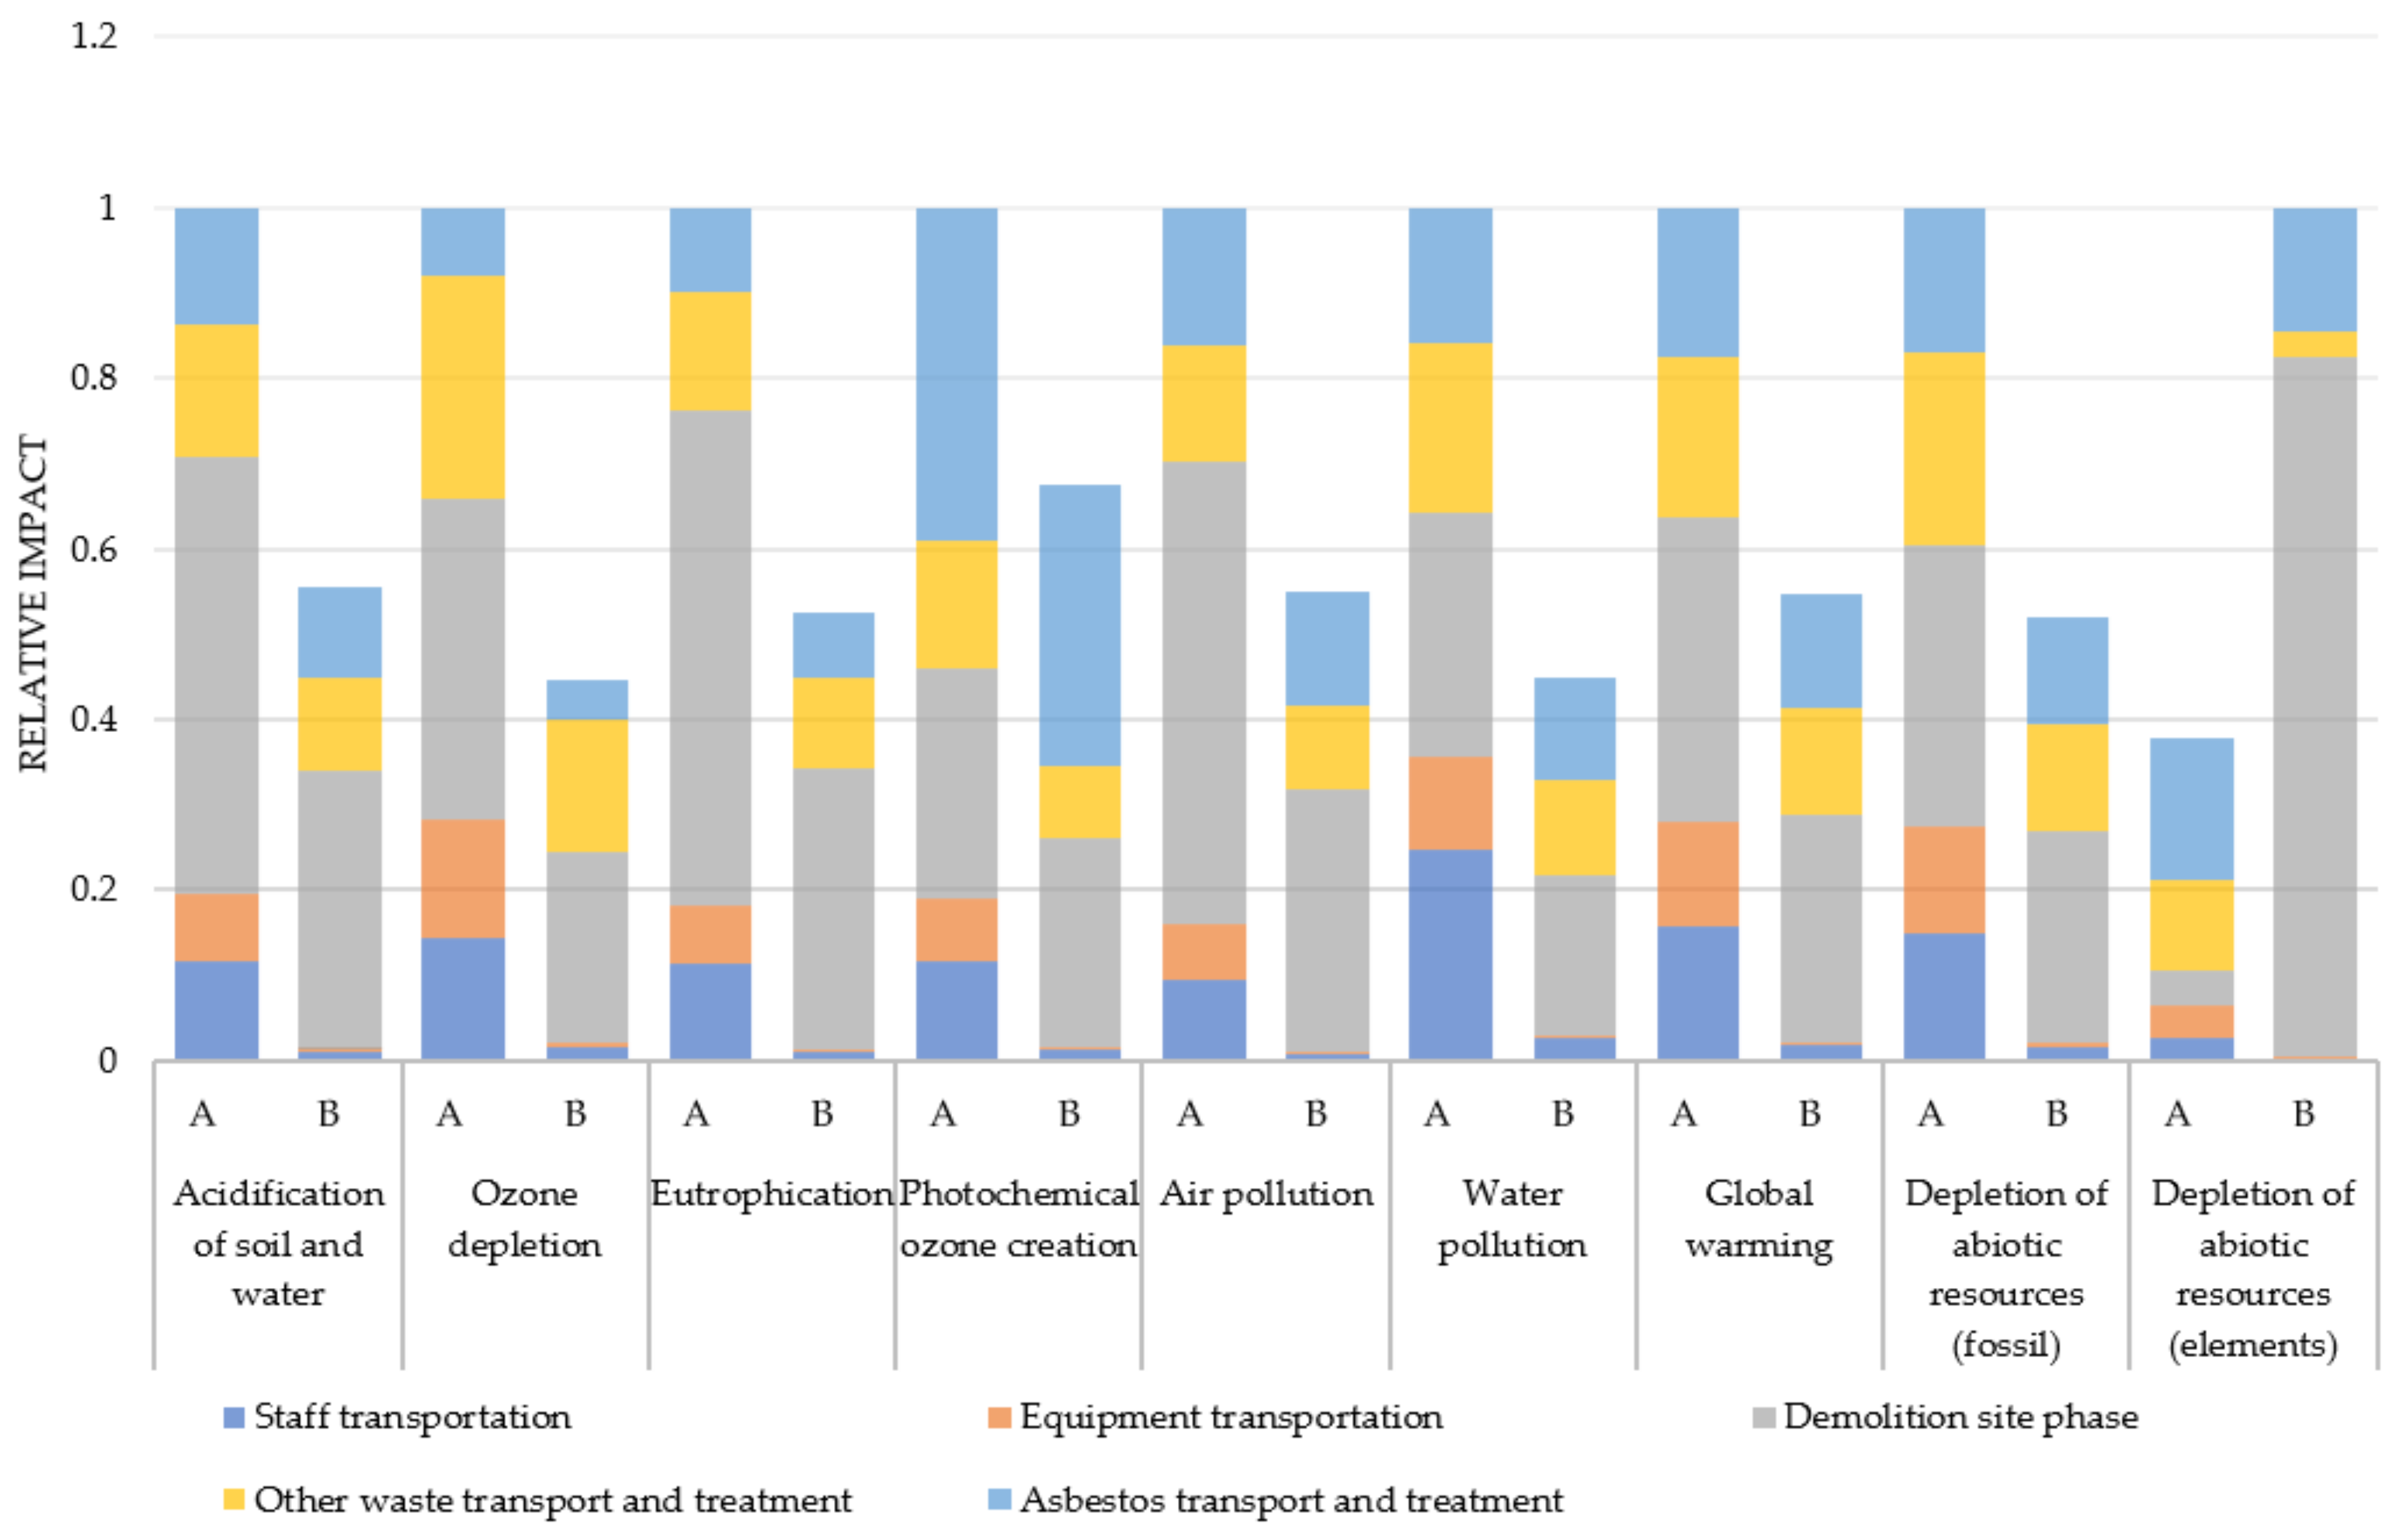
4.3.2. Scale of the Aggregate and Hotspot Analysis and Identification of the Most Relevant Life Cycle Stages

In this part, from the perspective of the aggregate scale, the impact was expressed for 1 ton of produced aggregate, i.e., the functional unit “to produce 1 ton of aggregate” was used (Section 4.2.3).
Observation on the distribution of the impact between the different categories were the same as the end-of-life scale because it is question of ratio (surface of building divided by mass of rubble (inert waste which is recycled for aggregate)). Nonetheless, we saw previously (at the scale of building’s end of life) that two categories (without counting asbestos) had a major impact: “demolition site phase” and “transport and treatment of other waste”. To better understand the reason for this, only for impact indicators, the category of “demolition site phase” is detailed in Figure 9 as well as the “transport and treatment of other waste”, which is detailed in Figure 10. First of all, for the demolition site phase, the main contributor was the consumption of diesel by demolition machinery for all impact indicators except for the depletion of abiotic resources (elements). For building B, embankment had rather a big impact up to 97% (the depletion of abiotic resources (elements) and at least 24% for ozone depletion. Thus, embankment was not negligible and should be counted and precise.
For “transport and treatment of other waste”, the transport and treatment of rubble (inert waste which was recycled for aggregate) were the same for both building (on all indicators). Nevertheless, there was some variation due to transportation but that did not exceed 5% between the two buildings. It is due to the way our model was constructed (cf. Section 4.2.4). However, transportation had a non-negligible impact. Furthermore, transport and treatment of other waste varies a lot from one building to another.
Finally, the impact of aggregates that can be obtained by recycling rubble was compared by focusing on the total impact of aggregates. As a reminder, in a first approach, the building end-of-life impact was allocated to the creation of recycled aggregate. The impact of the process for the manufacturing of virgin aggregates (this process was provided by the UNPG (Union Nationale des Producteurs de Granulats/French National Union of Aggregate Producers)) was added to the comparison as well. Table 4 presents impact indicators for aggregates produce thanks to inert waste from building A and inert waste from building B.
Note that for the ozone depletion impact indicator, virgin aggregate from UNPG had no result due to the fact that it was not calculated for virgin aggregate by UNPG; consequently, we cannot compare this process with others only for this indicator. This indicator was maintained in the study in order to compare recycled aggregates between them.
Figure 11 illustrates the relative impact of these aggregates. Therefore, aggregates had a big difference in impact. Aggregate from building A had the bigger impact in all impacts indicators (except for the last indicator: depletion of abiotic resources (elements)). Aggregate from building B was approximately 70% less impacting (min 60% for the photochemical ozone creation impact indicator; max 75% for ozone depletion impact indicator). However, these two processes for the production of recycled aggregates are much more impactful than the process of producing natural/virgin aggregates according to UNPG. Indeed, virgin aggregate was at most at 23% of aggregate from building A (Eutrophication impact indicator) and almost 0% (0.004%) for depletion of abiotic resources (fossil). The only indicator where virgin aggregate was preponderant was the depletion of abiotic resources (elements). This may be due to the consumption of raw material.
Observations concerning flow indicators were different. Table 5 presents the value of flow indicators and Figure 12 shows the relative value for flow indicators of the three aggregates. Results were more clear-cut; for all indicators, 1 ton of aggregate from building B was less impacting than 1 ton of aggregate produced from building A (from 27% improvement for consumption of renewable energy to 93% of improvement for non-hazardous waste, except for fresh water where the value was roughly equivalent). Virgin aggregate appears to have a better result except for fresh water where it is much more impacting. However, it is important to keep in mind that the impact of the production of recycled aggregates is highly influenced by the end of life of a building. A sensitivity analysis will be conducted in Section 4.3.3 for impact indicators.
To sum up the observations and the analysis about the scale of aggregate, results reinforce the difference and the environmental interest of building B compared to building A for all indicators, especially if there are no embankments involved in the demolition site. The difference of the impact is mainly due to the relative quantity of other waste (compared to the quantity of rubble) and the use of fuel for demolition equipment. When virgin aggregate is added to the comparison, we observe that benefit of recycling is not obvious because virgin aggregate has the lowest result for the main indicators except for depletion of abiotic resources (elements) and fresh water. One main benefit of recycling seems to be the preservation of resources. However, until now, all buildings’ end of life impact is allocated to the production of recycled aggregates but this choice has a consequence on the total impact of a building during all the life cycle. Indeed, that is to say that impact of the previous building is reduced.
In view of these results, some remarks and discussions should be considered. First of all, this study presents interesting facts about the end of life of buildings. It is possible to say, especially, that environmental impact varies a lot in function of the building. This can be due to the construction and demolition method, the typology of the building, building size, etc. Hence, in a circular economy perspective where the end of the service life of a structure/infrastructure is not the end of matter life, to know the impact of demolition is essential. Based mostly on primary data, this study gives precise data about demolishing for a specific site. Nonetheless, the LCA (life cycle assessment) could be improved and updated by using and creating more specific Ecoinvent® processes in order to have even more thrust in environmental results.
Another aspect of the study was to have a complementary vision of building waste and more exactly of inert waste from a concrete structure. Articulation between the present cycle and the following cycle during a recycling operation was approached. It is a key point of circular economy. Indeed, in the circular economy paradigm, the waste of some objects makes the resources of others. Consequently, some impact of the previous cycle should be taken into account. A sensitivity analysis is carried out in Section 4.3.3 in order to better understand allocation approaches. Furthermore, in the study, to simplify, inert waste is the only material considered produced from the demolition of those buildings, but other waste can be recycled so further study needs to take into account allocation between co-products.
To complete, this work is a basis for decision makers and researchers who work on circular economy and recycling. It adds clues to make the decision of demolishing or to compare with the rehabilitation and renovation. Future research could be conducted to compare with rehabilitation or other valuation methods like reusing. Future research can be also done to optimize the impact of end of life by improving the more impacting categories shown during this study (such as transport, engine use, etc.).

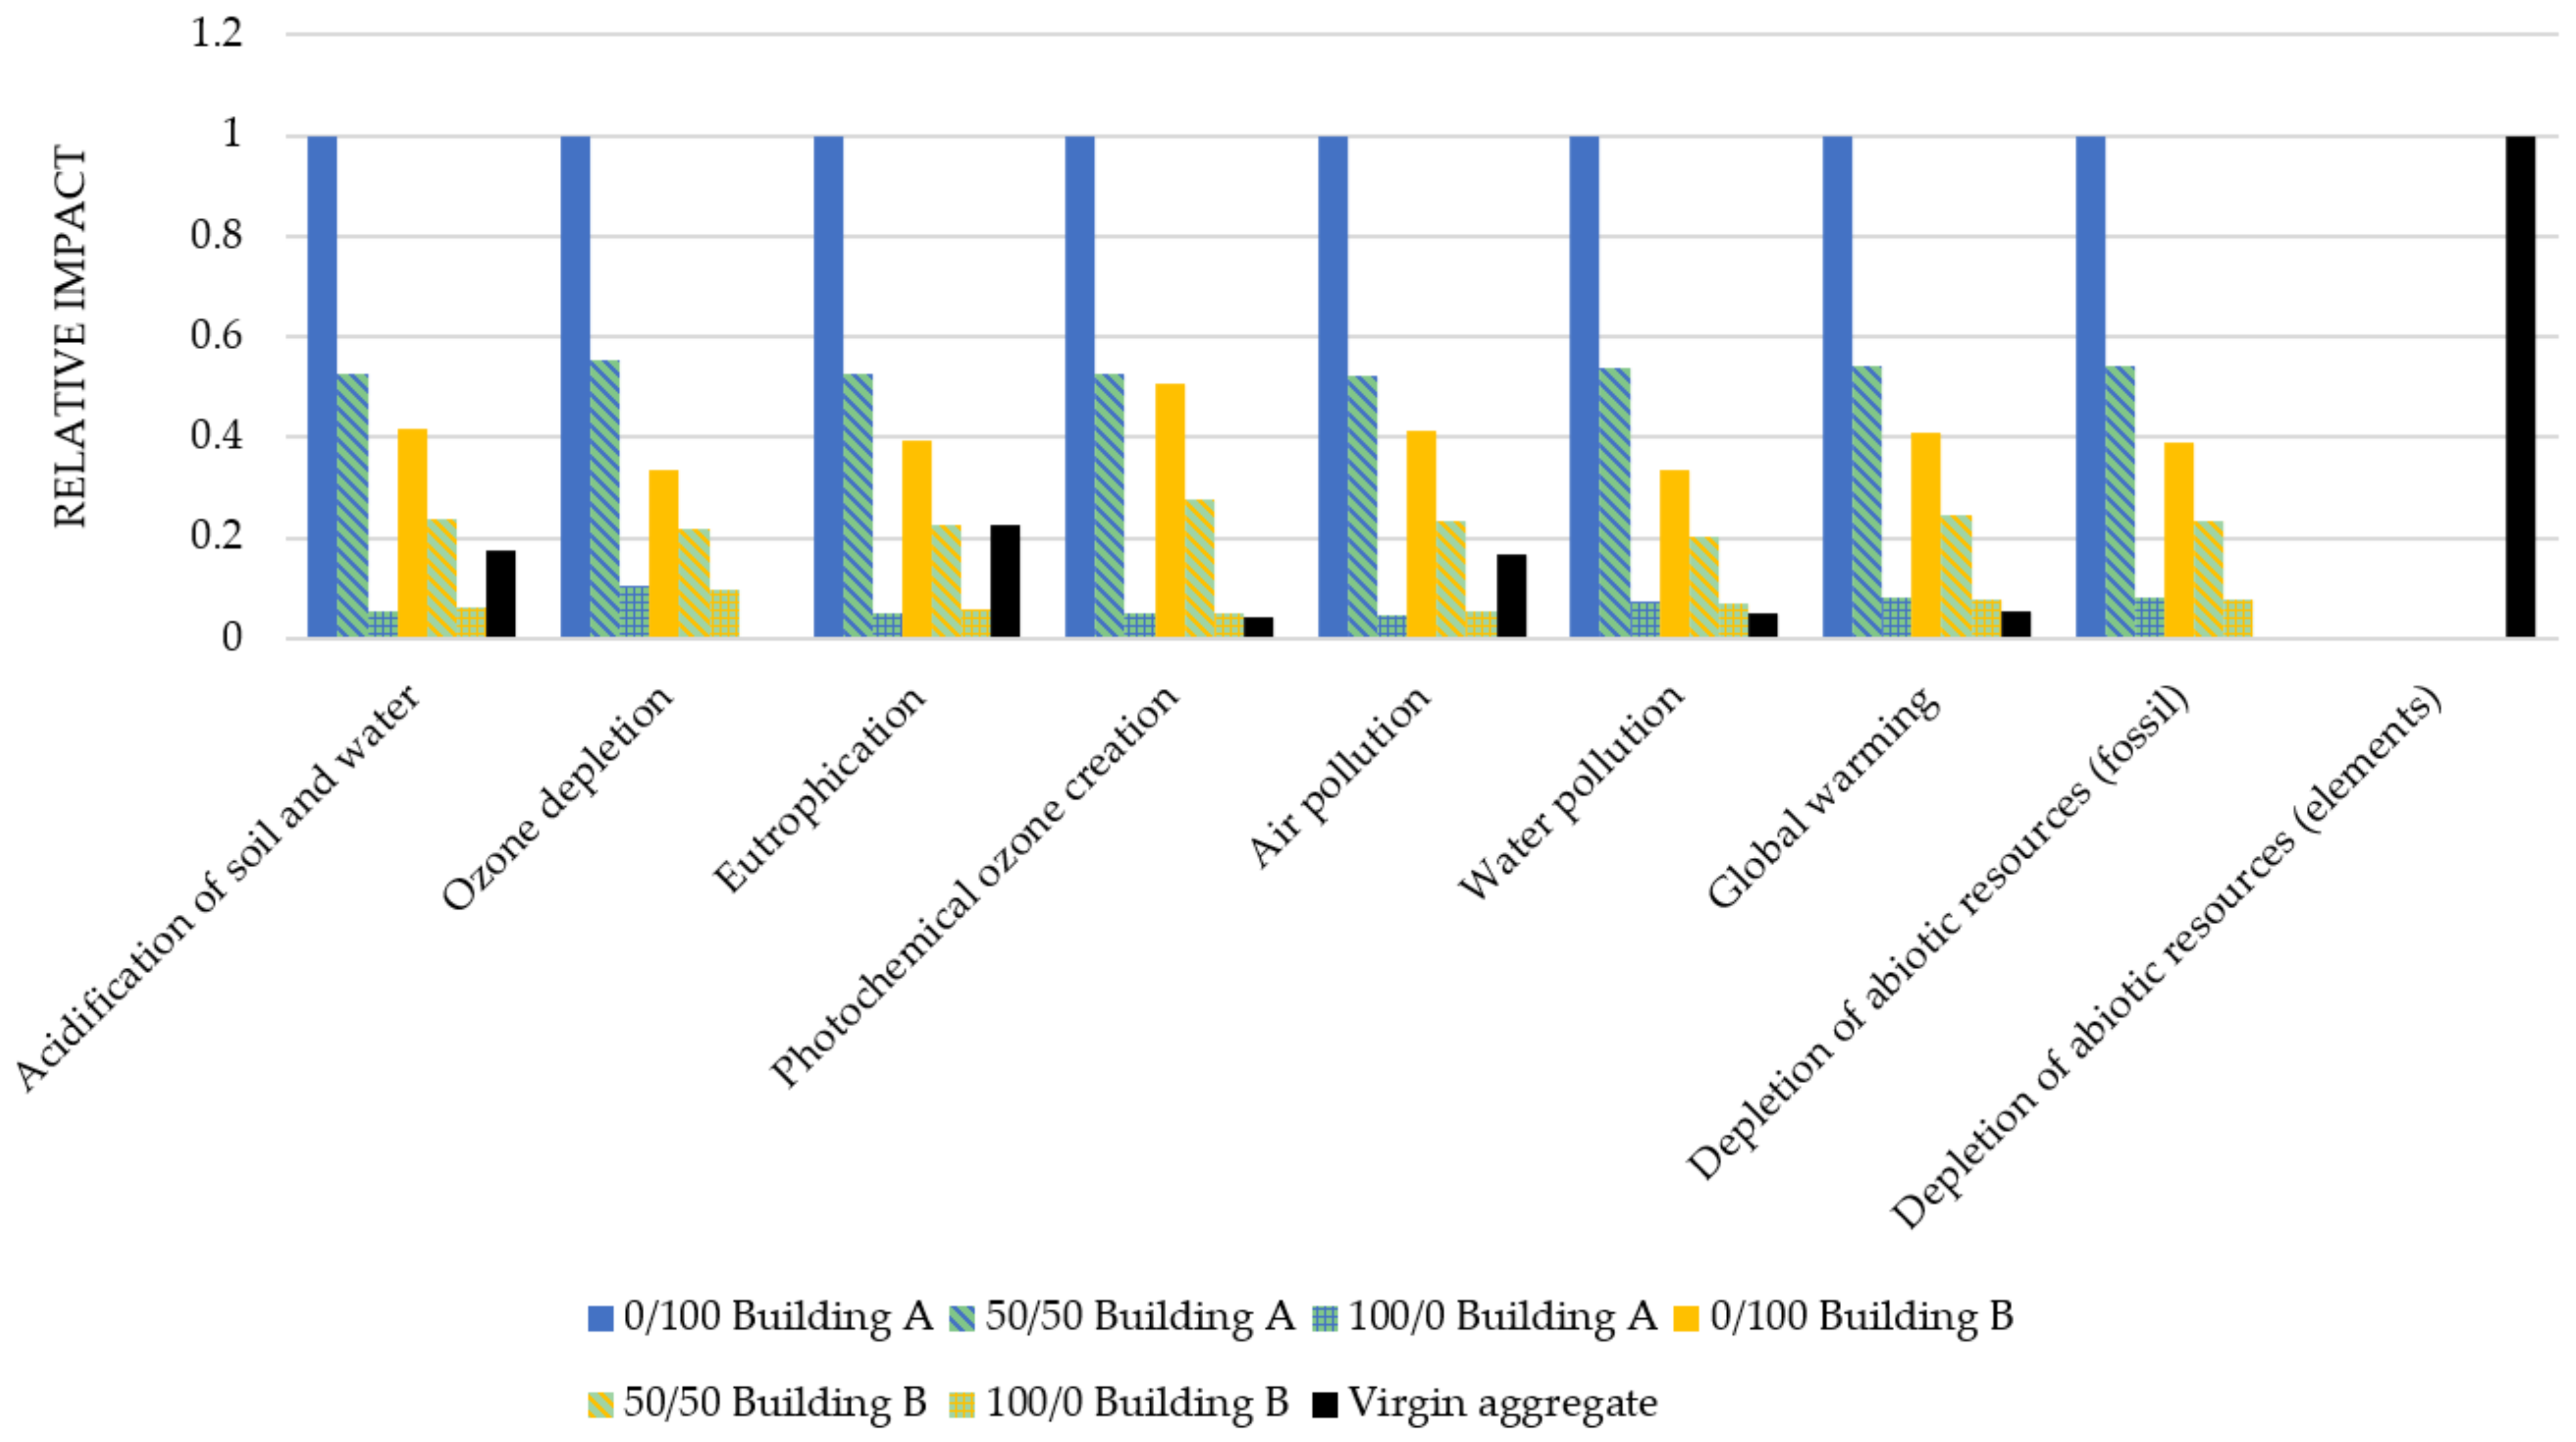
4.3.3. Sensitivity Analysis on Different Allocation Approaches

In Section 4.3, recycled aggregate seems to be more impacting than virgin aggregate for almost all indicators. This could be linked to the allocation of the impact of the end of life. Consequently, to understand this phenomenon, a sensitivity analysis on allocation approaches was conducted. Three scenarios of allocation are presented in Table 6. For all scenarios, the transport and treatment of rubble (inert wastes which permits to make aggregates) was allocated to recycled aggregate because it is directly attributable to it. Nonetheless, it could be discussed. Consequently, the impact of other elements was shared. Elements were staff transportation, equipment transportation, asbestos treatment and transport, demolition site phase, and transport and treatment of other waste (without rubble).
Impact indicators for all scenarios were computed. Flow indicators were not measured. Effectively, previously, we observed that the virgin aggregates had a zero value for a lot of flow indicators. Consequently, virgin aggregates are not competitive for recycled aggregates when flows indicators are analyzed. Normalized results are presented in Figure 13. On this graph, 0/100 scenarios are in plain color, 50/50 scenarios are hatched, and 100/0 are cross-hatched. Virgin aggregate is in black if available.
Different observations occur. First of all, as highlighted in a previous part (Figure 9 and Figure 10, concerning detailed impact), all elements cannot easily be allocated to account for the main impact for all indicators. Hence, transport and treatment of rubble only accounted for 4% to 10% of total impact for building A (more exactly, 4.22% for photochemical ozone creation and 10.3% for ozone depletion). Moreover, as this part is specific to the functional unit (to produce 1 ton of recycled aggregate, 1 ton of rubble is needed), for building B, as the total impact was less than building A, the proportion was higher (9.7% for photochemical ozone creation and 29.85% for ozone depletion) except for the last indicator “depletion of abiotic resources (elements)” where the order was reversed between building A and B. To sum up, the more impacting the building’s end of life, the more interesting the approach of 100/0 is for the creation of aggregate.
A second observation is that the production of recycled aggregates became competitive for some indicators with the 50/50 (only building B) and 100/0 (both building) allocation approach. For example, for eutrophication, the impact of recycled aggregate from building B was the same as virgin aggregate i.e., 22.6% (of building A aggregate which is the max impact). For scenario 50/50 of building B, 1 out of 8 indicators (ozone depletion was excluded) was lower than virgin aggregate (the depletion of abiotic resources (elements)) and 3 out of 8 indicators had less than 10% (of the max impact) difference. For scenario 100/0 of building A or B, 4 out of 8 indicators were lower (more than 10% of difference) than virgin aggregate and 4 out of 8 were quite similar (less than 10% of difference). Consequently, the aggregate with scenario 100/0 seems to be very competitive to virgin aggregate. Nonetheless, for the indicator of global warming, virgin aggregate is still less impacting than recycled aggregate (5.3% of max impact for virgin aggregate and 7.7% for building B with allocation 100/0). Therefore, the interest of the multicriteria aspect of life cycle assessment is highlighted.
Concerning those observations, in terms of LCA, the allocation approach has no real influence on the impact of the entire life cycle as long as the same allocation for constructing and demolishing the building is used for the same hypothesis. Indeed, impact is just postponed to cycle “n + 1” or applied to cycle “n”. The multistage aspect of LCA should be kept in mind. However, allocation approaches are not useless from a political or decision-making perspective because they will make it possible to put processes in competition and thus see the development of new and perhaps more environmentally virtuous processes. For the recycled aggregates production, several points of view can be mentioned to justify the different allocation methods (as a reminder, all allocation approach consider rubble as the only product of demolition):
  • 0/100 approach: With this kind of method, demolishing buildings is prompted (only by integrating avoided impacts) in order to produce recycled aggregates. However, the big impact of the recycled aggregate is not encouraging the use. Thus, this approach could be relevant to limit the act of demolishing and limit new constructions as it is joined with regulation of the extraction of virgin aggregates.
  • 50/50 approach: This method is a compromise between the previous and the following approaches. It fairly distributes the impact of demolishing on the old building and the recycled aggregate. This method does not currently permit the promotion of the use of recycled aggregate because the impact is still more severe than one for virgin aggregate in some demolition site. Nonetheless, it could permit selecting only more efficient demolishing.
  • 100/0 approach: This approach is the method where recycled aggregate is the most competitive. It incites the use of recycled aggregates under the condition that global warming is not the only indicator focused on. Nevertheless, it does not limit demolishing.
Currently, the classical approach is the 100/0. It makes it possible to easily understand the environmental conclusion for recycled aggregate in front of virgin aggregate as long as there is no incentive to demolish building. Furthermore, with the emerging context of circular economy, recycling preserves material resources.

5. Summary and Conclusions

This study aimed to give a quantitative evaluation of the environmental impacts of recycled aggregate obtained from the construction and demolition waste of a building at the end of its life. The analysis was based on two case studies of building demolitions. Both case studies involved residential buildings; one small residential building (Building A) of 300 m2 of floor surface located in the south of France and a bigger residential (Building B) of 5487 m2 of floor surface located in the west of France. Life cycle Assessment of the two demolition sites was carried out according to primary and secondary data availability. Building A produced 273 tons and building B produced 6738 tons of rubble that can be used to produce recycled aggregates. As rubble constitutes the major proportion (in mass) of waste, it was decided to study the production of recycled aggregate from construction and demolition waste. Hence, two different analyses were performed corresponding to two different functional units, one measuring the impact of the deconstruction of 1 m2 of building and the other for the production of 1 ton of recycled aggregates. For this study, the software OpenLCA 1.10 and database Ecoinvent® 3.5 were used.
A comparison was made between the flow indicators and the impact indicators from NF EN 15804 + A1. The impacts of the production of recycled aggregates when as resource construction and demolition waste are used as resource were compared to the equivalent ones of virgin aggregate production, using data collected from UNPG (French National Union of Aggregate Producers). The main conclusions are listed below:
The environmental impacts of the buildings’ end of life vary a lot from one building to another with, for example, 23.1 kg CO2 eq. for building B and 42.2 kg CO2 eq for building A for 1 m2 of floor surface of demolished building, i.e., the value almost doubles for A compared to B on the global warming indicator. This seems to be dependent upon the typologies of the building, such as the size of the building and other parameters which are to be determined. It could suppose an economy of scale.
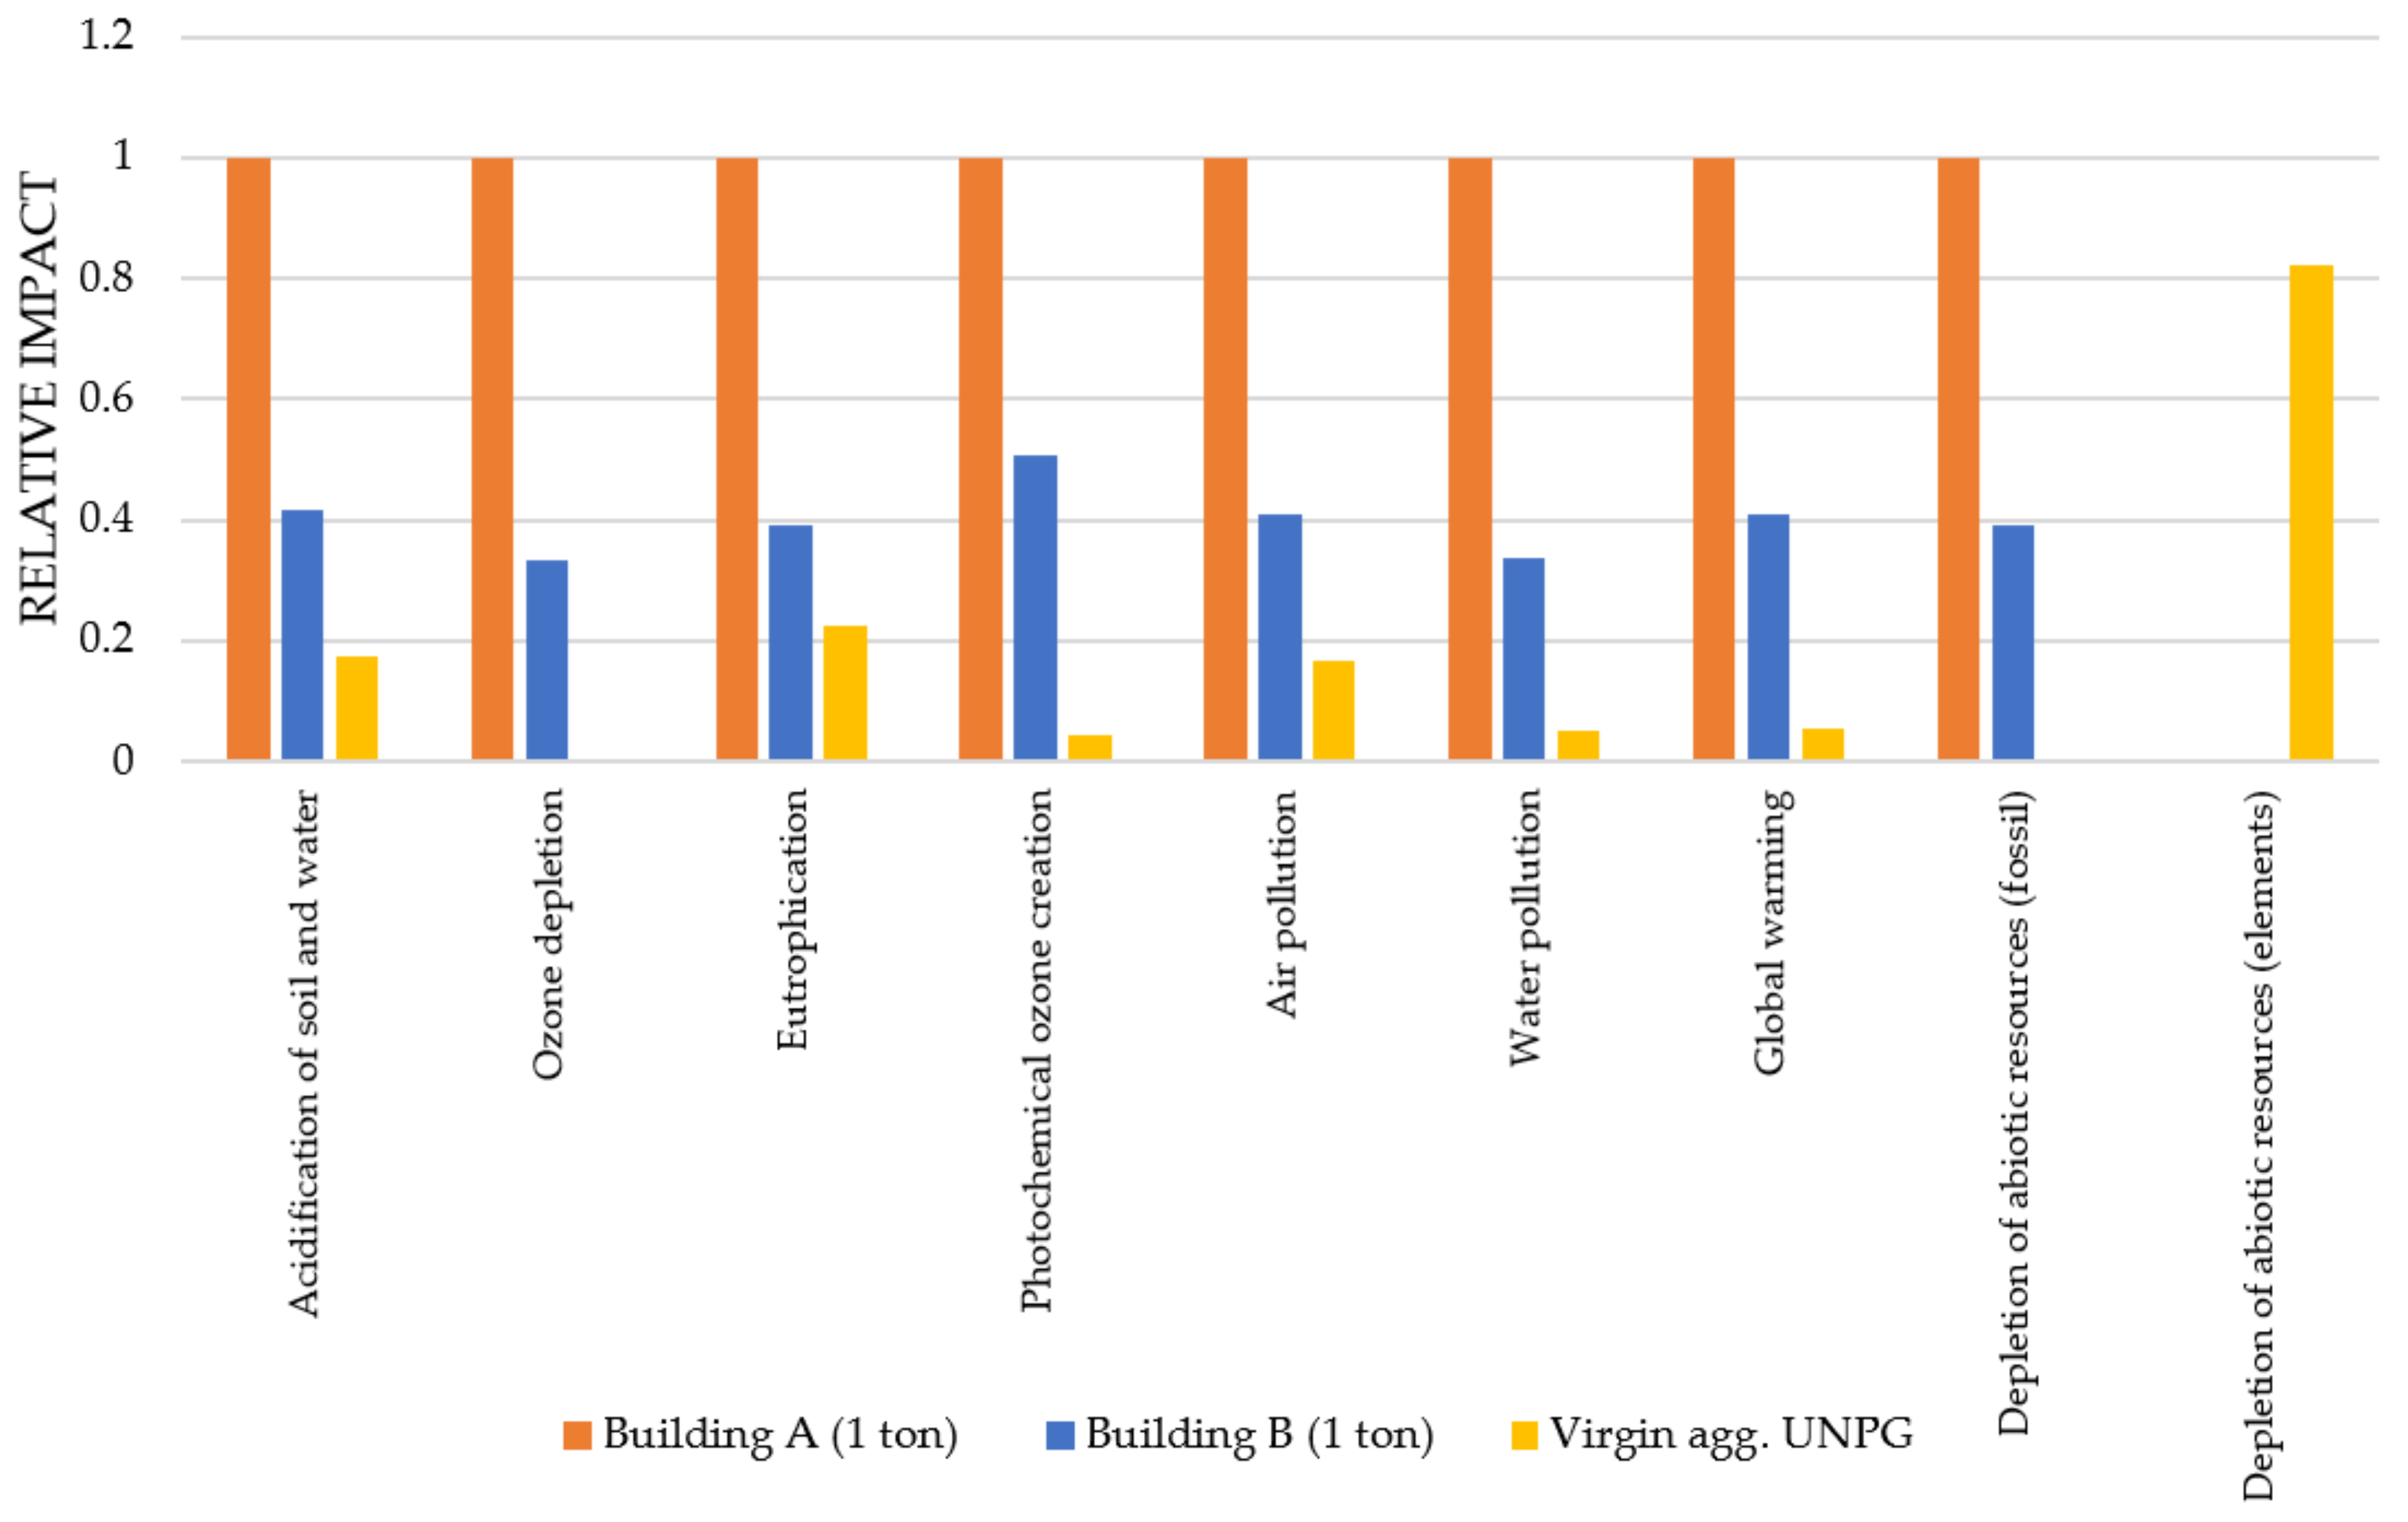
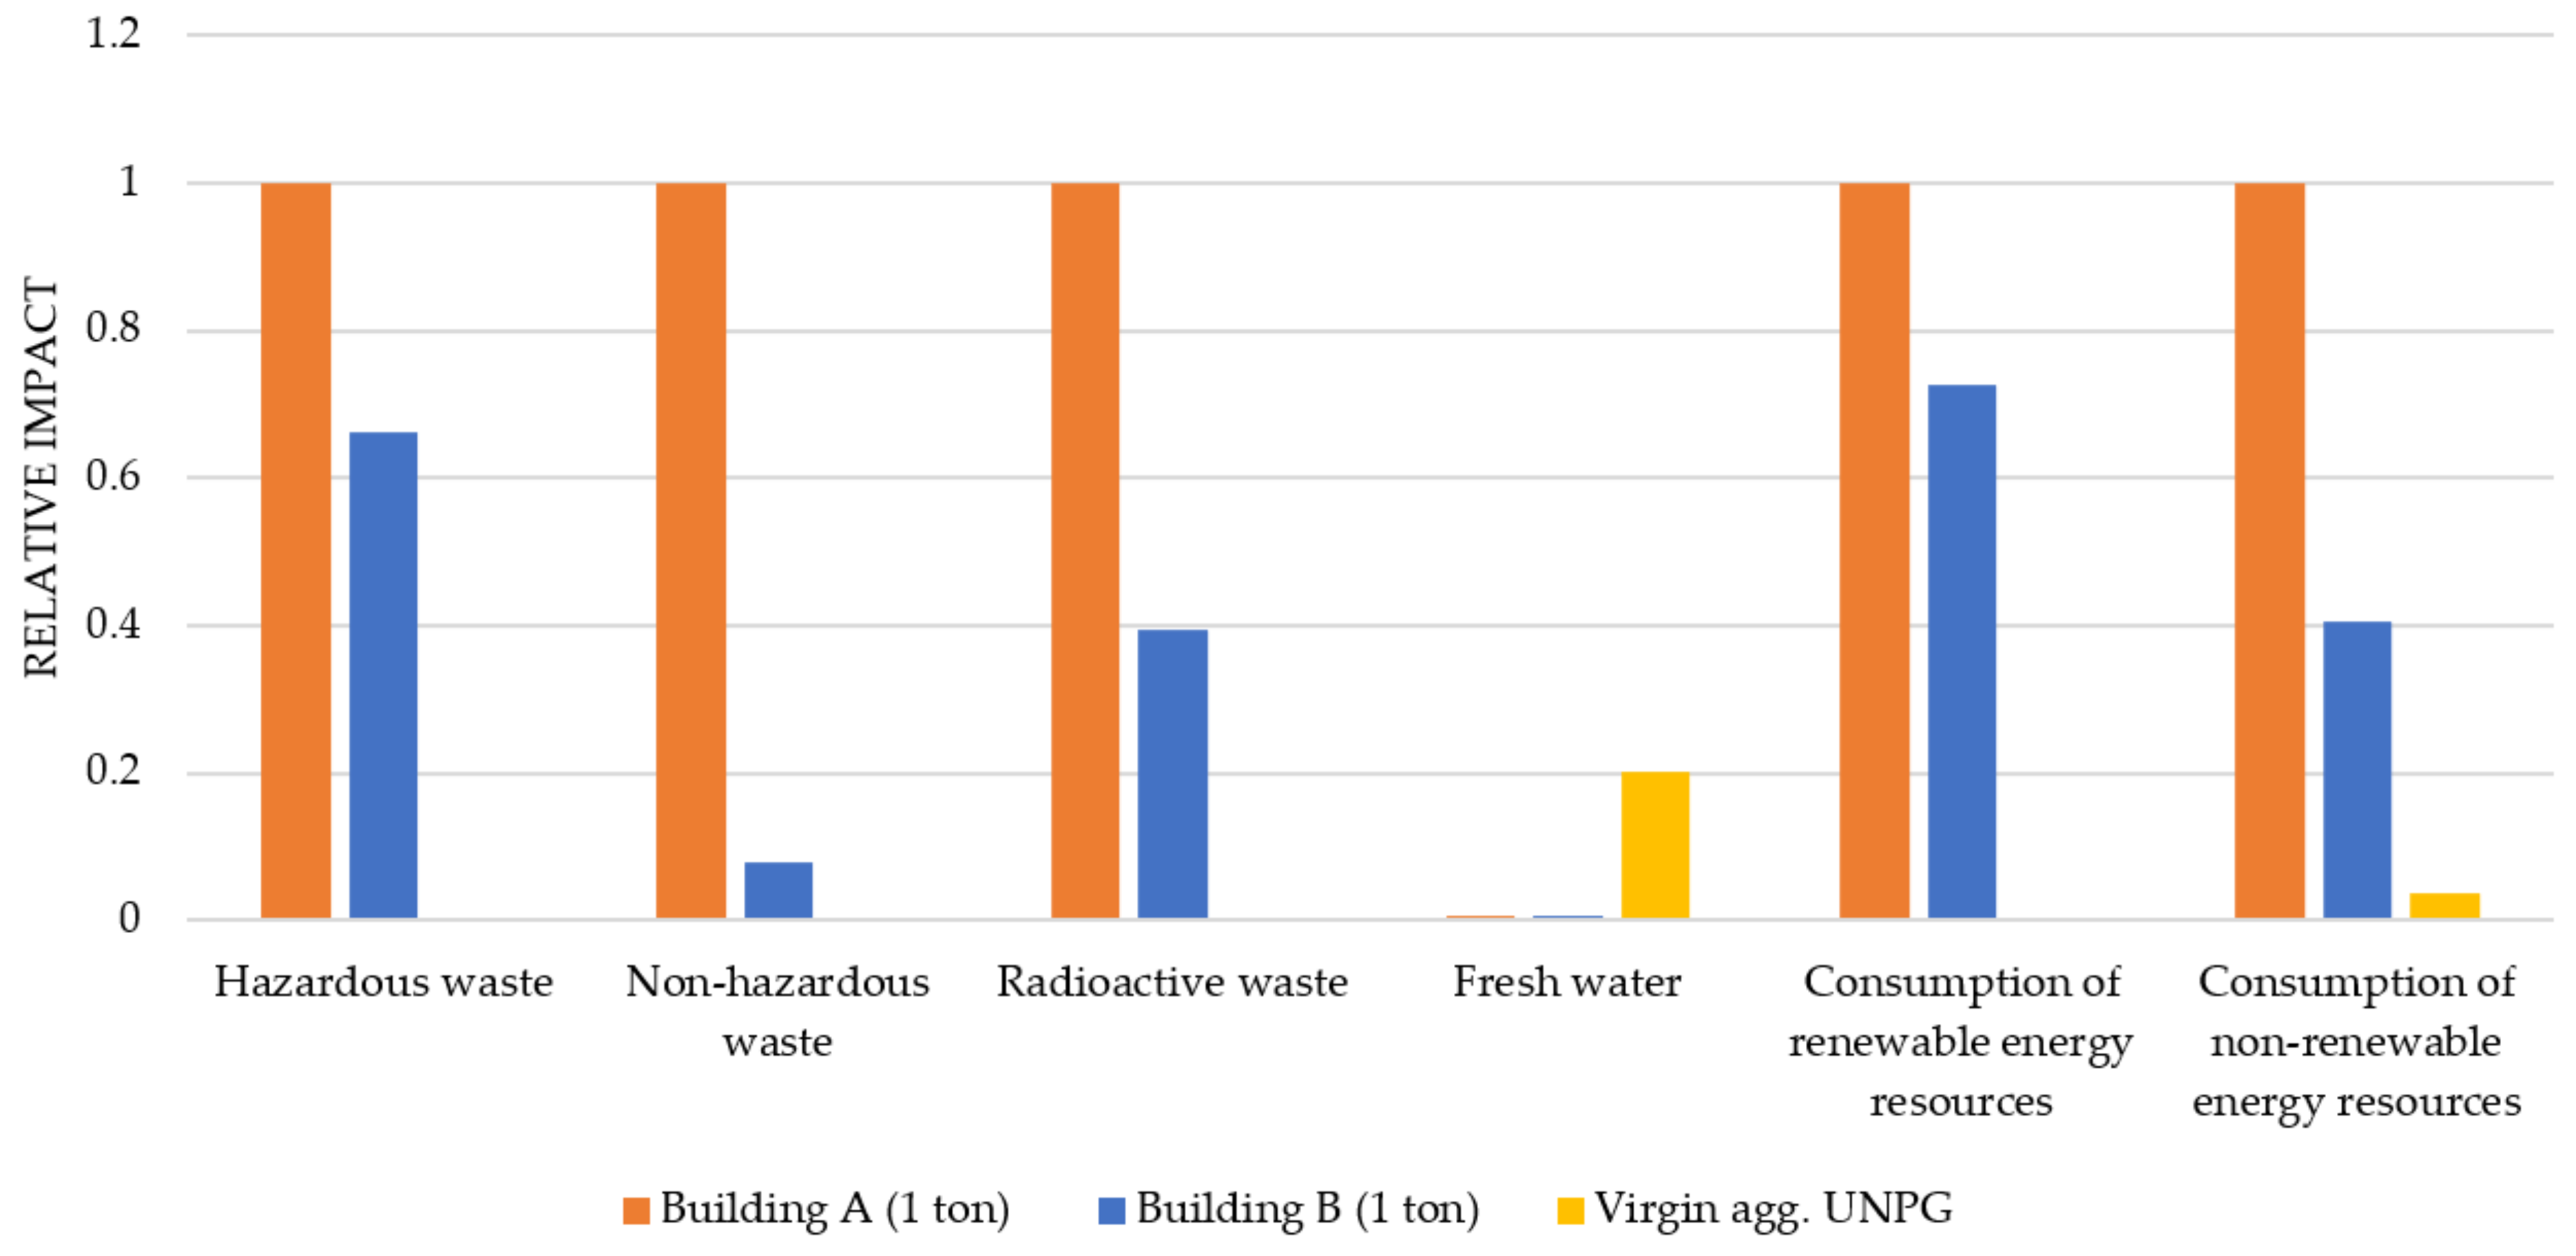
  • Concerning recycled aggregate production, the maximum impact was measured by allocating all the impacts of the end of life of the building. Comparison between building A and building B was similar as for the end-of-life scale (i.e., building B was less impacting than building A). For flow indicators, observations were almost the same. Impacts of recycled aggregates were higher than those of virgin aggregates for all indicators except for depletion of abiotic resources (elements) and ozone depletion (this one was not computed for virgin aggregate). Consequently, recycled aggregates are not competitive with this allocation method.
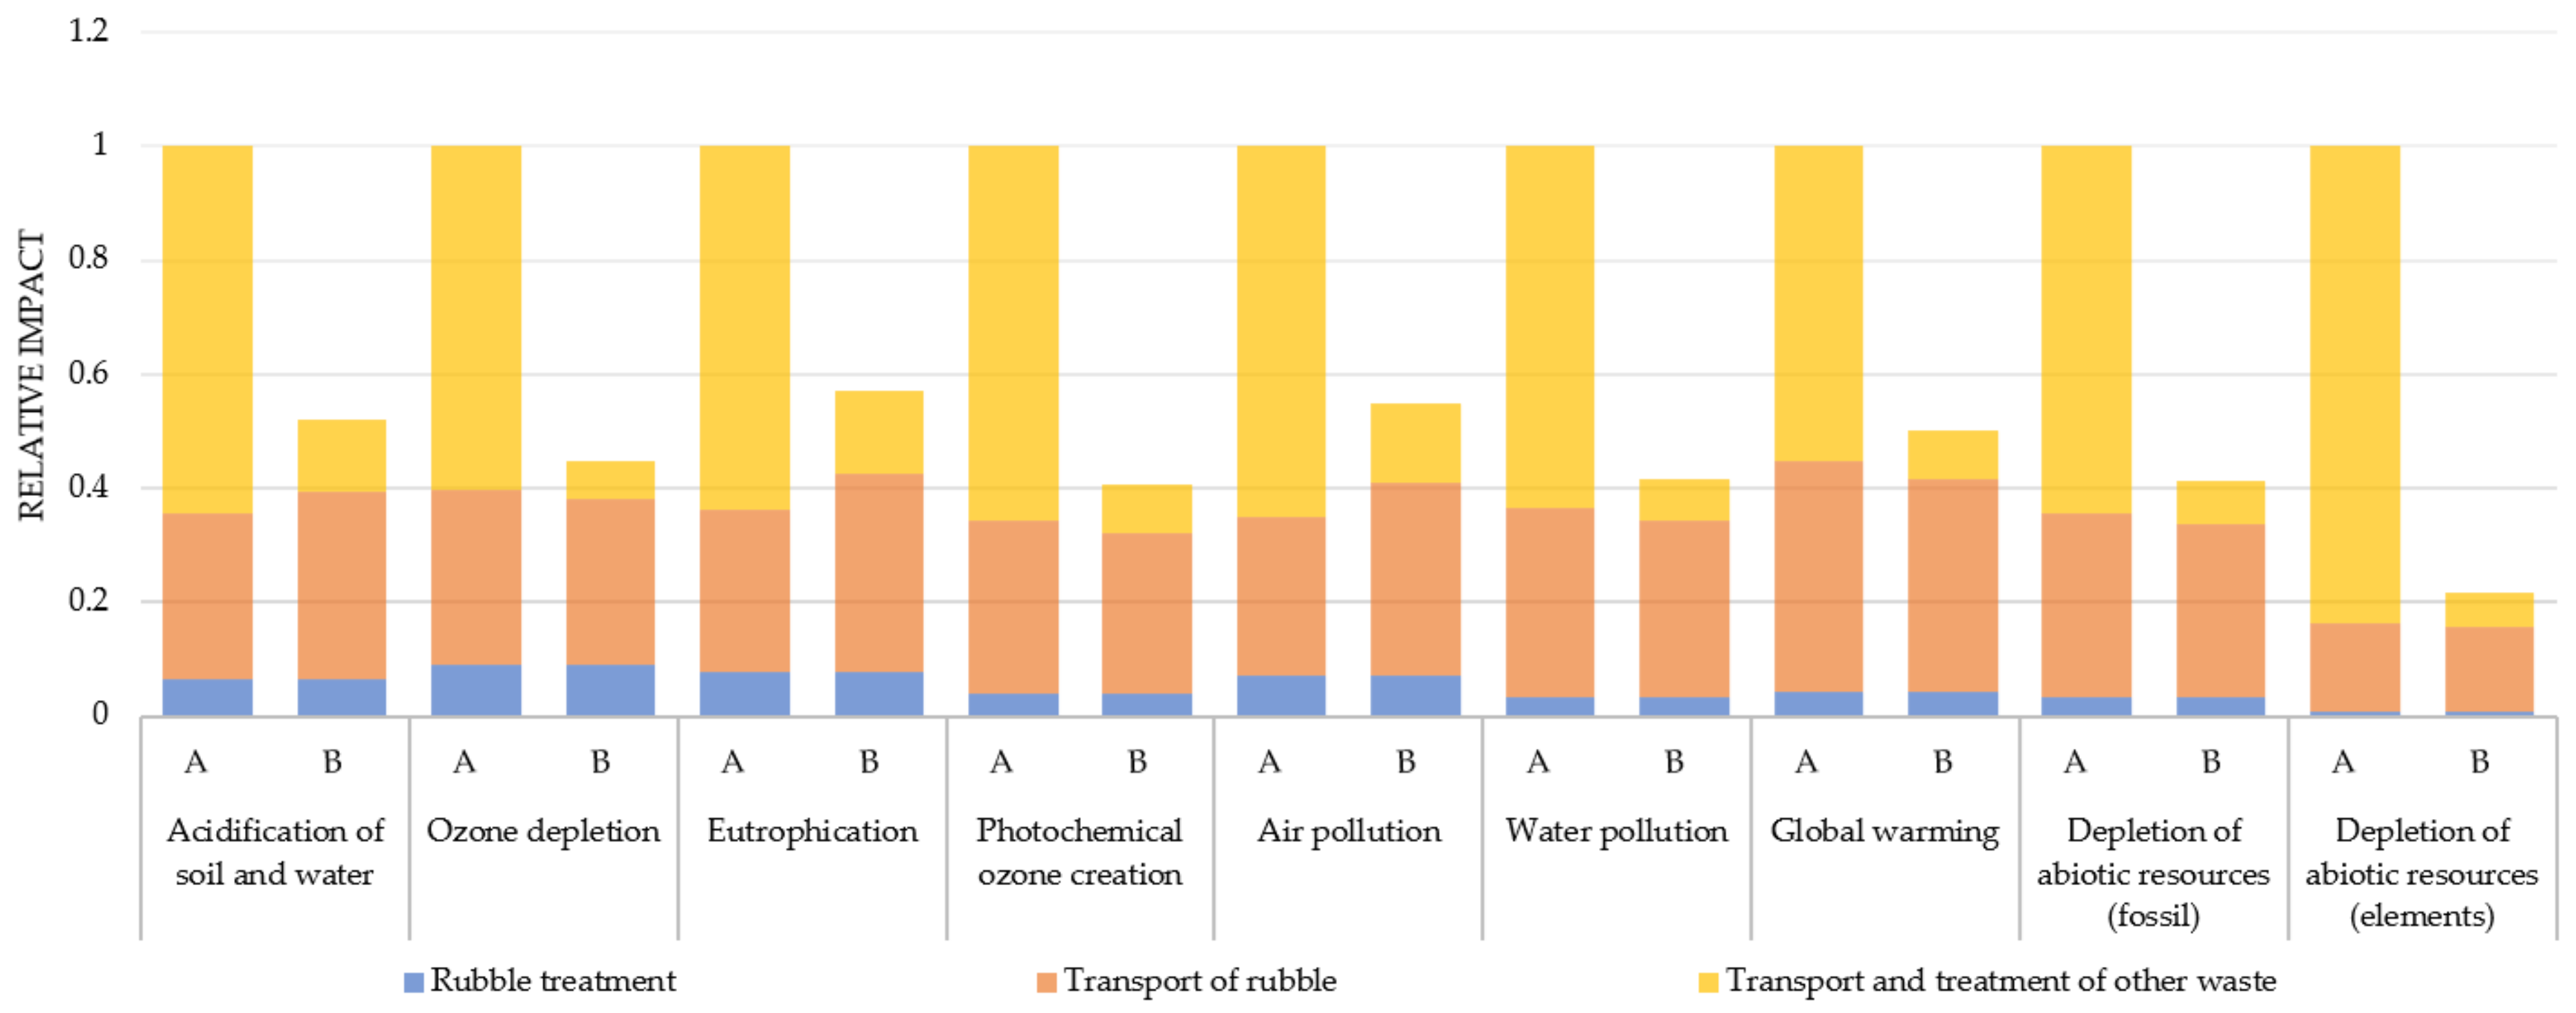
  • On both scales, hotspot analysis highlighted that all parts of the end of life were impacting but demolition phase and transport and treatment of waste were predominant. For example, demolition site phase and transport and treatment of waste both corresponded to about 35% for building A and the global warming indicator. This is mainly due to fuel consumption of building machinery and transport of waste. Moreover, the big variation of impact between both buildings was due to the quantity of other waste (without rubble) produced by demolition. Hence, it reinforces the aspect of the typology of the building and economy of scale.
  • Previously, we observed that recycled aggregates are not competitive with virgin aggregates when all impacts of the building’s end of life are allocated to the production of recycled aggregates. In order to know at which level of allocation becomes competitive, a sensitivity analysis with different allocation approaches was carried out. Conclusions were quite mixed because with the most favorable allocation (which consisted of taking into account only transport and treatment of inert waste for impact of recycled aggregate), recycled aggregate was not significantly the least impacting for all indicators, especially global warming. Those observations highlight the interest of the multicriteria aspect of life cycle assessment.
  • The optimization of the treatment processes of the C&Dw is a crucial activity within an advanced waste management since it was seen that the asbestos treatment is very impactful in the hotspot analysis.
  • The optimization of the geolocation of the demolition sites and the treatment plant is essential as well. Therefore, the transport stage was also significantly impactful and thus, careful planning of the transport routes has to be undertaken before the demolition of any building.
  • It was also shown that the sustainability implications of the demolition of buildings and the subsequent production of recycled aggregates using C&Dw under the umbrella of circular economy is an aspect that is highly location-, context-, and case-sensitive.
To conclude, a recommendation to the involved stakeholders and decision-makers may be to act on three points. First, before deciding to demolish a building, thought should be given to the environmental impact of the demolishing because impact is not negligible and it can be even more important depending on the building. Nevertheless, other criteria may weigh in the balance. Second, if demolition is not avoidable, it is necessary to act on the organization of the site and the optimization of transport and consumption of building machinery. Finally, using recycled aggregates is not necessarily the best solution depending on the indicators (especially global warming). However, it could have significant advantages on some indicators depending on the allocation method.
As a future perspective, this study is a base on which further reflection about other ways of recovering waste, such as reusing, can be developed. The study gives clues about allocation approaches from one cycle to another and warrants deepening the reflections when there are co-products.

Author Contributions

Conceptualization: A.L., T.D., O.Y.-M. and K.M.; methodology, A.L., T.D., A.-S.C., K.M., G.D.M. and A.F.; software, A.L., T.D. and O.Y.-M.; validation, all authors; data curation, T.D. and O.Y.-M.; writing—original draft preparation and editing, A.L. and K.M.; writing—review, all authors; visualization, A.L. and K.M.; supervision, T.D., G.D.M., K.M., A.-S.C. and A.F. All authors have read and agreed to the published version of the manuscript.

Funding

This research was funded by lab Recherche Environnement https://www.lab-recherche-environnement.org/en/ (accessed on 20 August 2021). The APC was funded by Ecole de Ponts ParisTech. This research was performed as part of the employment of the authors.

Institutional Review Board Statement

Not applicable.

Informed Consent Statement

Not applicable.

Data Availability Statement

All data publicly available are present in this article. Other data are not publicly available due to privacy issues.

Acknowledgments

Authors would like to thanks Fabrice Getas and Alexandre Robino, interns at Cerema who worked on this subject as well as the instigator of these studies Yannick Tardivel. The employment frame of Ambroise Lachat was supported by the Lab Recherche Environnement (formerly chair in the Eco-design of Built Sets and Infrastructures) sponsored by the VINCI Group.

Conflicts of Interest

The authors declare no conflict of interest. The funders had no role in the design of the study; in the collection, analyses, or interpretation of data; in the writing of the manuscript, or in the decision to publish the results.

Appendix A. Life Cycle Inventory of Process of Recycling Aggregate, of Building A and Building B

Collection of data was realized thanks to an Excel document. This document contained multiple tabs: generalities about worksite, worksite construction, wastes, materials, building machinery, equipment, persons transport, and site facilities. All tabs were composed with a table regrouping the data needed. Figure A1 present an example of this table for a person’s transport. The Excel document was completed by demolition companies.
Figure A1. Screenshot of the Excel document for collection of data. This picture presents data needed for a person’s transport.
Sustainability 13 09625 g0a1

Appendix B. Information about Collection of Data

Table A1. Inventory for the process of transformation of one ton of rubble into recycled aggregates.
Ecoinvent®-Flow NameQuantityInformationProvider
diesel, burned in building machine2.75 MJLoading into crusherCutoff, U—GLO
tap water67.7 kgFlotation separation and washingMarket, Cutoff, U—Europe without Switzerland
transport, freight, lorry > 32 metric ton, EURO40.1 t.kmInternal transportCutoff, U—RER
electricity, medium voltage1.5 kWhFor all stage needing electricityMarket, Cutoff, U—FR
Table A2. Life cycle inventory for all categories of the end of life of building A. Quantities are for a whole building.
Asbestos, Transportation and Treatment
Ecoinvent®-Flow NameQuantityInformationProvider
hazardous waste, for underground deposit9 tTreatment of asbestos wasteCutoff, U—RoW
transport, freight, lorry 16–32 metric ton, EURO52295 t.kmTransport of asbestos wasteCutoff, U—RER
Waste, Transportation and Disposal
Ecoinvent®-Flow NameQuantityInformationProvider
inert waste, for final disposal112 tTreatment of all waste except inert waste which could be recycledCutoff, U—RoW
process of treatment (Table A1)276 tRecycling treatment for Inert waste
transport, freight, lorry 16–32 metric ton, EURO54125 t.kmTransport of waste to treatment plantsCutoff, U—RER
transport, freight, lorry 7.5–16 metric ton, EURO54635 t.kmTransport of waste to treatment plantsCutoff, U—RER
Demolition Site Phase
Ecoinvent®-flow NameQuantityInformationProvider
diesel, burned in building machine49,466.3 MJUse of construction machineryCutoff, U—GLO
tap water500 kgWater consumption during demolition siteMarket, Cutoff, U—Europe without Switzerland
Equipment Transportation
Ecoinvent®-Flow NameQuantityInformationProvider
transport, freight, lorry > 32 metric ton, EURO514,792 t.kmTransport of heavy machineryCutoff, U—RER
transport, freight, lorry 16–32 metric ton, EURO51514.088 t.kmTransport of machinery and installation siteCutoff, U—RER
Staff Transportation
Ecoinvent®-Flow NameQuantityInformationProvider
transport, passenger car, medium size, diesel, EURO 52580 kmTransport of staff including staff for asbestos removalCutoff, U—RER
transport, passenger car, small size, diesel, EURO 51332 kmTransport of staffCutoff, U—RER
transport, passenger train720 p.kmTransport of staffCutoff, U—FR
Table A3. Life cycle inventory for all categories of the end of life of building B. Quantities are for a whole building.
Asbestos, Transportation and Treatment
Ecoinvent®-Flow NameQuantityInformationProvider
hazardous waste, for underground deposit146.08 tTreatment of asbestos wasteCutoff, U—RoW
transport, freight, lorry 16–32 metric ton, EURO43229.4 t.kmTransport of asbestos from buildingCutoff, U—RER
transport, freight, lorry 16–32 metric ton, EURO41130.08 t.kmTransport of asbestos from asphaltCutoff, U—RER
Waste, Transportation and Disposal
Ecoinvent®-Flow NameQuantityInformationProvider
inert waste, for final disposal155.92 tOrdinary industrial waste which is landfilledCutoff, U—RoW
transport, freight, lorry 7.5–16 metric ton, EURO41247.2 t.kmTransport of ordinary industrial waste to treatment plantCutoff, U—RER
wood chips, from post-consumer wood, measured as dry mass51.04 tTreatment of woodtreatment, sorting and shredding Cutoff, U—RoW
transport, freight, lorry 16–32 metric ton, EURO4468.07 t.kmTransport of wood to the treatment plantCutoff, U—RER
waste reinforcement steel45.84 tTreatment of shear iron and cast iron, they are recycledTreatment, recycling Cutoff, U—RoW
transport, freight, lorry 16–32 metric ton, EURO4435.48 t.kmTransport of shear iron and cast ironCutoff, U—RER
process of treatment (Table A1)6738 tRecycling treatment for Inert waste
transport, freight, lorry 16–32 metric ton, EURO4/6000131,795.28 t.kmTransport of inert waste to recycling plantCutoff, U—RER
Demolition Site Phase
Ecoinvent®-Flow NameQuantityInformationProvider
diesel, burned in building machine353,398 MJUse of construction machineryCutoff, U—GLO
gravel, crushed20.89274 tConsumableGravel production Cutoff, U—RoW
transport, passenger car, large size, diesel, EURO 42164 kmTransport of consumable (other than gravel)Cutoff, U—RER
transport, freight, lorry 16–32 metric ton, EURO4115.417 t.kmTransport of consumableCutoff, U—RER
electricity, medium voltage29,639 MJElectricity used during demolition siteMarket, Cutoff, U—FR
tap water37,000 kgWater consumption during demolition siteMarket, Cutoff, U—Europe without Switzerland
gravel, crushed2522.22 tFor embankmentsGravel production Cutoff, U—RoW
transport, freight, lorry > 32 metric ton, EURO427,514.4 tTransport of gravel for embankmentsCutoff, U—RER
transport, passenger car, large size, diesel, EURO 457 kmTransport of other elementsCutoff, U—RER
Equipment Transportation
Ecoinvent®-Flow NameQuantityInformationProvider
transport, freight, lorry > 32 metric ton, EURO4840 t.kmTransport of heavy machineryCutoff, U—RER
transport, freight, lorry 7.5–16 metric ton, EURO467.8 t.kmTransport of medium machineryCutoff, U—RER
transport, freight, lorry 3.5–7.5 metric ton, EURO453.6556 t.kmTransport of light machineryCutoff, U—RER
transport, freight, lorry 16–32 metric ton, EURO44415.77 t.kmTransport of heavy machineryCutoff, U—RER
transport, freight, lorry 16–32 metric ton, EURO4188.6 t.kmTransport of installation siteCutoff, U—RER
Staff Transportation
Ecoinvent®-Flow NameQuantityInformationProvider
transport, passenger car, large size, diesel, EURO 46268 kmTransport of staff for various servicesCutoff, U—RER
transport, freight, lorry 16–32 metric ton, EURO445.475 t.kmTransport of staff for various servicesCutoff, U—RER
transport, freight, lorry 7.5–16 metric ton, EURO447.6 t.kmTransport of staff from enterprise to siteCutoff, U—RER
transport, passenger car, large size, diesel, EURO 43934 kmTransport of staff from enterprise to siteCutoff, U—RER
transport, passenger car, small size, diesel, EURO 4812 kmTransport of staff from enterprise to siteCutoff, U—RER

References

  1. LWARB. London’s Circular Economy Route Map; London Waste and Recycling Board: London, UK, 2017. [Google Scholar]
  2. Republica Portuguesa. Leading the Transition—Action Plan for Circular Economy in Portugal: 2017–2020; Portuguese Council of Ministers: Lisbon, Portugal, 2017; pp. 1–62. [Google Scholar]
  3. Circular Flanders (Vlaanderen Circulair). CIRCULAR FLANDERS Together towards a Circular Economy; Circular Flanders: Mechelen, Belgium, 2017. [Google Scholar]
  4. Mantalovas, K.; di Mino, G.; Carrion, A.J.D.B.; Keijzer, E.; Kalman, B.; Parry, T.; Presti, D.L. European National Road Authorities and Circular Economy: An Insight into Their Approaches. Sustainability 2020, 12, 7160. [Google Scholar] [CrossRef]
  5. Mercante, I.T.; Bovea, M.D.; Ibáñez-Forés, V.; Arena, A.P. Life cycle assessment of construction and demolition waste management systems: A Spanish case study. Int. J. Life Cycle Assess. 2011, 17, 232–241. [Google Scholar] [CrossRef]
  6. Sala, S.; Farioli, F.; Zamagni, A. Life cycle sustainability assessment in the context of sustainability science progress (part 2). Int. J. Life Cycle Assess. 2012, 18, 1686–1697. [Google Scholar] [CrossRef]
  7. ISO 14044. Environmental Management—Life Cycle Assessment—Requirements and Guidelines; ISO: Geneva, Switzerland, 2006; Volume 2006, pp. 652–668. [Google Scholar]
  8. Council of the European Union. Council decision of 19 December 2002 establishing criteria and procedures for the acceptance of waste at landfills pursuant to Article 16 of and Annex II to Directive 1999/31/EC. Off. J. Eur. Communities 2003, 4646, 27–49. [Google Scholar]
  9. The European Parliament. Regulation (EC) No 2150/2002 of the European Parliament and of the Council on Waste Statistics. Off. J. Eur. Communities 2002, 2150, 1–36. [Google Scholar]
  10. European Commission. Taking Sustainable Use of Resources Forward: A Thematic Strategy on the Prevention and Recycling of Waste; COM 666 Final; European Commission: Brussel, Belgium, 2005. [Google Scholar]
  11. Butera, S.; Christensen, T.H.; Astrup, T.F. Life cycle assessment of construction and demolition waste management. Waste Manag. 2015, 44, 196–205. [Google Scholar] [CrossRef] [PubMed] [Green Version]
  12. European Commission. Decision of the European Parliament and of the Council on a General Union Environment Action Programme to 2030; COM(2020) 652 Final; European Commission: Brussel, Belgium, 2020. [Google Scholar]
  13. European Commission. Communication from the Commission to the European Parliament, the European Council, the Council, the European Economic and Social Committee and the Committee of the Regions—The Green Deal; COM(2019) 640 Final; European Commission: Brussell, Belgium, 2019. [Google Scholar]
  14. European Commision. Communication from the Commission to the European Parliament, the Council, the European Economic and Social Committee and the Committee of the Regions—A New Circular Economy Action Plan for a Cleaner and More Competitive Europe; COM(2020) 98 Final; European Commission: Brussel, Belgium, 2020. [Google Scholar]
  15. Deloitte and Bre. Construction and Demolition Waste Management in France. 2015. Available online: https://ec.europa.eu/environment/pdf/waste/studies/deliverables/CDW_France_Factsheet_Final.pdf (accessed on 8 May 2021).
  16. International Organization for Standardization. EN ISO 14040:2006: Environmental Management—Life Cycle Assessment—Principles and Framework; Elsevier Ltd.: Amsterdam, The Netherlands, 2006. [Google Scholar]
  17. Leite, F.D.C.; Motta, R.D.S.; Vasconcelos, K.L.; Bernucci, L. Laboratory evaluation of recycled construction and demolition waste for pavements. Constr. Build. Mater. 2011, 25, 2972–2979. [Google Scholar] [CrossRef]
  18. Hackenhaar, I.C.; Waskow, R.P.; Tubino, R.; Passuello, A. Life Cycle Assessment applied to construction and demolition waste treatment: Proposal of a Brazilian scenario. IOP Conf. Ser. Earth Environ. Sci. 2019, 323, 012054. [Google Scholar] [CrossRef]
  19. Blengini, G.A.; di Carlo, T. The changing role of life cycle phases, subsystems and materials in the LCA of low energy buildings. Energy Build. 2010, 42, 869–880. [Google Scholar] [CrossRef]
  20. Blengini, G.A.; Garbarino, E. Resources and waste management in Turin (Italy): The role of recycled aggregates in the sustainable supply mix. J. Clean. Prod. 2010, 18, 1021–1030. [Google Scholar] [CrossRef]
  21. Blengini, G.A. Life cycle of buildings, demolition and recycling potential: A case study in Turin, Italy. Build. Environ. 2009, 44, 319–330. [Google Scholar] [CrossRef]
  22. Ortiz, O.; Pasqualino, J.; Castells, F. Environmental performance of construction waste: Comparing three scenarios from a case study in Catalonia, Spain. Waste Manag. 2010, 30, 646–654. [Google Scholar] [CrossRef] [PubMed]
  23. Kulik, M. A visual Life Cycle Analysis for architects and policymakers: Comparing standard building structure materials with bamboo for China’s plan to house 400 million people in cities in 20 years. Creat. Commons 2013, 2, 87. [Google Scholar]
  24. Teng, Y.; Pan, W.; Li, K. Comparing Life Cycle Assessment Databases for Estimating Carbon Emissions of Prefabricated Buildings. In Construction Research Congress (CRC) 2018; American Society of Civil Engineers (ASCE): Reston, VA, USA, 2018. [Google Scholar] [CrossRef]
  25. Pourkhorshidi, S.; Sangiorgi, C.; Torreggiani, D.; Tassinari, P. Using Recycled Aggregates from Construction and Demolition Waste in Unbound Layers of Pavements. Sustainability 2020, 12, 9386. [Google Scholar] [CrossRef]
  26. Lancieri, F.; Marradi, A.; Mannucci, S. C&D waste for road construction: Long time performance of roads constructed using recycled aggregate for unbound pavement layers. WIT Trans. Ecol. Environ. 2006, 92, 559–569. [Google Scholar] [CrossRef] [Green Version]
  27. Mantalovas, K.; di Mino, G. Integrating Circularity in the Sustainability Assessment of Asphalt Mixtures. Sustainability 2020, 12, 594. [Google Scholar] [CrossRef] [Green Version]
  28. Mantalovas, K.; di Mino, G. The Sustainability of Reclaimed Asphalt as a Resource for Road Pavement Management through a Circular Economic Model. Sustainability 2019, 11, 2234. [Google Scholar] [CrossRef] [Green Version]
  29. Mantalovas, K.; di Mino, G.; Inzerillo, L.; Roberts, R. Exploiting 3D Modelling and Life Cycle Assessment to Improve the Sustainability of Pavement Management; Springer International Publishing: Cham, Switzerland, 2021; Volume 178. [Google Scholar] [CrossRef]
  30. Ginga, C.P.; Ongpeng, J.M.C.; Daly, M.K.M. Circular Economy on Construction and Demolition Waste: A Literature Review on Material Recovery and Production. Materials 2020, 13, 2970. [Google Scholar] [CrossRef] [PubMed]
  31. EM Foundation. Towards a Circular Economy: Business Rationale for an Accelerated Transition. Available online: https://ellenmacarthurfoundation.org/towards-a-circular-economy-business-rationale-for-an-accelerated-transition, (accessed on 20 August 2021).
  32. Manosalvas-Paredes, M.; Roberts, R.; Barriera, M.; Mantalovas, K. Towards More Sustainable Pavement Management Practices Using Embedded Sensor Technologies. Infrastructures 2019, 5, 4. [Google Scholar] [CrossRef] [Green Version]
  33. Mantalovas, K.; Carrión, A.J.D.B.; Planche, J.P.; Porot, L.; Pouget, S.; Williams, C.; Presti, D.L. Interpreting Life Cycle Assessment results of bio-asphalt pavements for more informed decision-making. In Pavement, Roadway, and Bridge Life Cycle Assessment 2020, Proceedings of the International Symposium on Pavement. Roadway, and Bridge Life Cycle Assessment 2020 LCA 2020, Sacramento, CA, USA, 3–6 June 2020; LCA 2020: Sacramento, CA, USA, 2020. [Google Scholar]
  34. Mantalovas, K. Increasing the Circularity of Asphalt Mixtures: Integrated Sustainability and Circularity Assessment as a Progress Monitoring Tool towards More Circular and Sustainable Asphalt Pavements Increasing the Circularity of Asphalt Mixtures: Integrated Sustain. Ph.D. Thesis, University of Palermo, Palermo, Italy, 2021. [Google Scholar]
  35. AFNOR. EN 15804:2012—Standards Publication Sustainability of construction works—Environmental Product Declarations—Core Rules for the Product Category of Construction Products; AFNOR: Paris, France, 2012. [Google Scholar]
  36. AFNOR. EN 15643-2:2011—Sustainability of Construction Works—Assessment of Buildings—Part 2: Framework for the Assessment of Environmental Performance; AFNOR: Paris, France, 2011; pp. 1–36. [Google Scholar]
  37. Getas, F. Recommandations sur la Mise en Place d’une Economie Circulaire Autour des Chantiers de Déconstruction par une Approche d’Analyse de Cycle de Vie. Master’s Thesis, Université de Technologie de Troyes, Troyes, France, 2016. [Google Scholar]
  38. Desbois, T.; Yazoghli-Marzouk, O.; Feraille, A. LCA of construction and demolition waste recycling: Case study of production phase. In Proceedings of the International Symposium on Pavement, Roadway, and Bridge Life Cycle Assessment 2020, Online, 12–15 January 2021. [Google Scholar]
  39. UNPG. Module D’information Environnemental de la Production de Granulat Recycle, mai 2011. Available online: https://www.unpg.fr/accueil/dossiers/environnement/analyse-de-cycle-de-vie-des-granulats/ (accessed on 2 July 2021).
  40. Ben Fraj, A.; Idir, R. Concrete based on recycled aggregates—Recycling and environmental analysis: A case study of Paris’ region. Constr. Build. Mater. 2017, 157, 952–964. [Google Scholar] [CrossRef]
  41. Zampori, L.; Saouter, E.; Castellani, V.; Schau, E.; Cristobal, J.; Sala, S. Guide Forinterpreting Life Cycle Assessment Result; Publications Office of the European Union: Luxembourg, 2016; p. 60. [Google Scholar] [CrossRef]
Figure 1. Flowchart with the processes followed for the completion of the study.
Sustainability 13 09625 g001
Figure 2. Building A [38]: (a) house annex, (b) main house.
Sustainability 13 09625 g002
Figure 3. Building B: (a) building bar of four floors, (b) tower block of five floors.
Sustainability 13 09625 g003
Figure 4. System of the process sequence followed for the treatment and recycling of construction and demolition wastes (after Ben Amor 2017) [40].
Sustainability 13 09625 g004
Figure 5. System boundaries of the product system under study.
Sustainability 13 09625 g005
Figure 6. Diagram presenting elements included in the modeling of a demolition site.
Sustainability 13 09625 g006
Figure 7. Relative impacts and distribution among categories of building A and B for the different impact indicators.
Sustainability 13 09625 g007
Figure 8. Relative impacts and distribution among categories of building A and B for flow indicators for buildings A and B.
Sustainability 13 09625 g008
Figure 9. Graph presenting details of the relative impact of the demolition site phase for building A and B for impact indicators.
Sustainability 13 09625 g009
Figure 10. Graph presenting details of the relative impact of waste treatment and transport phase impact (not including asbestos) for building A and B for impact indicators.
Sustainability 13 09625 g010
Figure 11. Graph presenting the relative impact of 1 ton of aggregate for three type of aggregates: the first one is recycled aggregate from building A, the second is recycled aggregate from building B, and the third is virgin aggregate (data from UNPG).
Sustainability 13 09625 g011
Figure 12. Relative flow indicator impact of 1 ton of three types of aggregates: recycled aggregates from building A, recycled aggregates from building B, and virgin aggregate.
Sustainability 13 09625 g012
Figure 13. Relative impacts of recycled aggregate production for three allocation scenarios (0/100, 50/50, 100/0) and impact of virgin aggregate. For ozone depletion, the impact of virgin aggregate was not measured. For the depletion of abiotic resources (elements), the values of recycled aggregates were too low to be compared to virgin aggregate.
Sustainability 13 09625 g013
Table 1. Data quality assessment.
Data Quality Requirements
DataTypeSourceTechnologicalGeographicalTime-RelatedCompletenessMethodological Appropriateness and ConsistencyParameter UncertaintyResulting Data Quality Rating (DQR)
Fuel consumption (demolition phase)PrimaryReported data and ecoinvent®1443222.67
Water consumption (demolition phase)PrimaryReported data and ecoinvent®3332212.33
Electricity consumption (demolition phase)PrimaryReported data and ecoinvent®3232212.17
Consumables (gravel)PrimaryReported data and ecoinvent®4442313.00
Means of transport and distances (staff, materials)PrimaryReported data and ecoinvent®2342212.33
Disposal and other waste processingSecondaryReported quantity, assumption for the treatment4441243.17
Internal transport (production plant)SecondaryAmor Ben Fraj, Rachida Idir 2017, and ecoinvent®2343132.67
Water consumption (production plant)SecondaryAmor Ben Fraj, Rachida Idir 2017, and ecoinvent®3333132.67
Fuel consumption (production plant)SecondaryAmor Ben Fraj, Rachida Idir 2017, and ecoinvent®1443132.67
Electricity consumption (production plant)SecondaryAmor Ben Fraj, Rachida Idir 2017, and ecoinvent®3233132.50
TOTAL AVERAGE 2.62
Technological: specific technology or technology mix; geographical: geographical area from which data for unit processes should be collected to satisfy the goal of the study; time-related: age of data and the minimum length of time over which data should be collected; completeness: percentage of flow that is measured or estimated; methodological appropriateness and consistency: qualitative assessment of whether the study methodology is applied uniformly to the various components of the analysis; parameter uncertainty: uncertainty of the information (e.g., data, models, and assumptions). Scoring: 1 = very good, 2 = good, 3 = fair, 4 = poor, 5 = very poor.
Table 2. Values of the environmental impact category indicators for the end of life of buildings A and B.
Impact CategoryReference UnitBuilding A (for 1 m2)Building B (for 1 m2)
Acidification of soil and waterkg SO2 eq2.24 × 10−11.24 × 10⁻¹
Ozone depletionkg CFC-11 eq.7.28 × 10−63.25 × 10⁻⁶
Eutrophicationkg PO43− eq.4.28 × 10−22.25 × 10⁻²
Photochemical ozone creationkg ethylene eq.1.13 × 10−27.61 × 10⁻³
Air pollutionm31.96 × 1021.07 × 102
Water pollutionm32.75 × 1041.24 × 104
Global warmingkg CO2 eq.4.22 × 1012.31 × 101
Depletion of abiotic resources (fossil)MJ, net calorific value6.59 × 1023.44 × 102
Depletion of abiotic resources (elements)kg Sb eq.3.38 × 10−98.91 × 10⁻⁹
Table 3. This table presents flow indicator values for building A and B.
Flow CategoryReference UnitBuilding A (for 1 m2)Building B (for 1 m2)
Consumption of renewable energy resourcesMJ3.20 × 1013.10 × 101
Consumption of non-renewable energy resourcesMJ7.01 × 1023.79 × 102
Radioactive wastekg4.19 × 10−32.21 × 10⁻³
Hazardous wastekg3.11 × 1012.75 × 101
Non-hazardous wastekg3.95 × 1024.11 × 101
Fresh waterm39.33 × 10−21.23 × 10⁻¹
Table 4. This table presents the environmental impact of 1 ton of recycled aggregate made from building A or building B and 1 ton of virgin aggregate (ozone depletion for virgin aggregate was not computed in the data).
Impact CategoryReference UnitBuilding A (for 1 ton)Building B (for 1 ton)Virgin Aggregate UNPG
Acidification of soil and waterkg SO2 eq.2.43 × 10−11.01 × 10−14.23 × 10−2
Ozone depletionkg CFC-11 eq.7.91 × 10−62.64 × 10⁻⁶////
Eutrophicationkg PO43− eq.4.66 × 10−21.83 × 10−21.05 × 10−2
Photochemical ozone creationkg ethylene eq.1.22 × 10−26.20 × 10−35.17 × 10−4
Air pollutionm32.13 × 1028.75 × 1013.54 × 101
Water pollutionm32.99 × 1041.01 × 1041.48 × 103
Global warmingkg CO2 eq.4.59 × 1011.88 × 1012.42 × 100
Depletion of abiotic resources (fossil)MJ, net calorific value7.17 × 1022.80 × 1023.16 × 100
Depletion of abiotic resources (elements)kg Sb eq.3.67 × 10−97.25 × 10−95.69 × 10−6
Table 5. This table presents flow impact indicators of 1 ton of recycled aggregate made from building A or building B and 1 ton of virgin aggregate.
Flow CategoryReference UnitResult Building AResult Building BVirgin Aggregate
Consumption of renewable energy resourcesMJ3.48 × 1012.53 × 1010.00 × 100
Consumption of non-renewable energy resourcesMJ7.62 × 1023.09 × 1022.89 × 101
Radioactive wastekg4.56 × 10−31.80 × 10−30.00 × 100
Hazardous wastekg3.38 × 1012.24 × 1010.00 × 100
Non-hazardous wastekg4.29 × 1023.35 × 1010.00 × 100
Fresh waterm31.01 × 10−11.00 × 10−12.91 × 100
Table 6. Table presenting share of impact allocated to the building deconstructed and to the recycled aggregate for three allocation scenarios. * Impact of end of life of building without transport and treatment of rubble.
Allocation ApproachPart of the Impact Allocated to the Building DeconstructedPart of the Impact Allocated to the Recycled Aggregate
Transport of Rubble to Treatment PlantTreatment of RubbleOther Impacts *Transport of Rubble to Treatment PlantTreatment of RubbleOther Impacts *
0/1000%0%0%100%100%100%
50/500%0%50%100%100%50%
100/00%0%100%100%100%0%
Publisher’s Note: MDPI stays neutral with regard to jurisdictional claims in published maps and institutional affiliations.

