Article

Application of Fuzzy Logic to Evaluate the Economic Impact of COVID-19: Case Study of a Project-Oriented Travel Agency

1
Department of Financial Management and Control, Institute of Business Regulation and Information Management, Hungarian University of Agriculture and Life Sciences, Páter Károly str. 1, H-2100 Gödöllő, Hungary
2
Department of Economics and Methodology, Institute of Economics, Hungarian University of Agriculture and Life Sciences, Páter Károly str. 1, H-2100 Gödöllő, Hungary
*
Author to whom correspondence should be addressed.
Sustainability 2021, 13(17), 9602; https://doi.org/10.3390/su13179602
Submission received: 30 June 2021 / Revised: 14 August 2021 / Accepted: 23 August 2021 / Published: 26 August 2021
(This article belongs to the Collection Tourism Research and Regional Sciences)

Abstract

:
The aim of the study is to create a performance evaluation controlling model to evaluate the performance of tourism enterprises as a function of the economic effects of COVID-19. As a result of the significant change in demand resulting from the economic environment, expectations and cyclicality caused by the pandemic, the assessment of organization performance has become subjective. Under these changed environmental conditions, most of the methods used by tourism companies to evaluate performance are not effective enough. In our research, we illustrated a controlling model based on fuzzy logic through a case study. By applying the model, it becomes possible to evaluate project-oriented tourism organizations according to different standardized norms. Our model considers the subjectivity derived from measurability and goal setting. We point out that the performance of organizations operating in the tourism industry significantly influenced by COVID-19 can be subjectively assessed during the pandemic period and thus depends on the analytical context. By evaluating the performance of tourism organizations along internal organizational goals, more relevant information content and more informed managerial decision support can be achieved.

1. Introduction

The tourism supply chain is a network that spans continents [1]. For businesses in these networks, adaptation to ever-changing global conditions can be described as a fundamental competitive criterion. The most significant negative global macro condition in recent decades has been the COVID-19 pandemic crisis. The pandemic has caused significant devastation in almost every industry worldwide [2]. Among the most severely affected industries are the tourism and hospitality sectors, which have almost completely ceased to function as a result of the epidemic [3]. As a result of the epidemic and defense strategies, international tourism and cross-border tourism have also been drastically reduced or eliminated. As a result, tourism and hospitality organization have had significant losses [4,5].
The pandemic has repeatedly highlighted the fact that the tourism sector is a highly exposed industry to external conditions [6]. This exposure was manifested not only in the almost complete halt in global tourism during the pandemic but also in the growth seen in the summer of 2020 [7]. This exposure is also supported by the studies by Ramelli and Wagner (2020) and Song et al. (2021), which draw attention to the fact that pre-epidemic fundamentals and strategies of tourism enterprises also influence the successful adaptation of organizations to the COVID-19 epidemic period to changed economic conditions [4,8].
As a result of COVID-19, significant changes in the tourism industry will lead to inequalities in both space and time. Various government measures and industry advocacy organizations can make a significant contribution to reconstructing inequalities and successfully recovering. Furthermore, as the recovery process and consumer demands change, there will be a greater emphasis on sustainable and rural tourism, as well as domestic tourism, in the planning of rethinking strategies [9]. Based on Rastegar et al.’s (2021) study, it is important to take into account that in recovering the tourism sector, it is important not to return to the previous system but to create a new system that changes ecological, social and economic processes [10]. At the same time, regardless of whether the recovery is based on government interventions or based on rethought strategies, the tourism industry is undergoing significant changes [11,12]. As a result of these significant changes and adaptation to the environment, organizations in the tourism sector also need to rethink their strategies.
It is inevitable for management to develop an effective planning and controlling system to support the development and implementation of an appropriate strategy. Controlling can be a key area that provides information to help business make the right decisions at every level. This helps one to adapt to a dynamically changing environment [13].
The tourism sector is characterized by external exposure in addition to being a competitive and dynamically expanding industry. Many innovations have contributed to the development of the sector in recent years, and many areas of activity have been transformed. This includes the operating model of travel agencies and the nature of the products they offer [14,15,16,17].
During travels organized by travel agencies, there is a strong trend of declining demand for standard travels. This can be attributed to the proliferation of various innovative accommodation platforms and the rapid and universally accessible content of information on the Internet [18,19]. Due to these negative changes, various tour operators have responded with new business models, reaching new target audiences and creating innovative products [20,21]. One such new product range is the organization of travel that is specifically customer oriented. Both supply and demand for these product categories are growing dynamically [22]. Organizing and selling these new products require a fundamentally different business model. As each travel is unique and customer oriented, they can be considered as different projects. Although unique and customer-oriented travel projects may have common features, they can be considered unique in each case. For companies that offer these unique customer-oriented products, the project-oriented organizational form can be a highly efficient structure.
Evaluating the success of individual projects and evaluating project-oriented organizations raise a number of issues due to their unique nature [23,24]. Performance evaluation is basically a sub-area of controlling that includes a number of methods. However, the controlling systems may not be able to accurately monitor and evaluate non-standardized processes and sub-areas [25,26]. Consequently, project-oriented organizations need a controlling method that is not only suitable for evaluating projects but also for evaluating related sub-areas [27]. Such a controlling model makes it possible to explore the points of intervention at both the functional and strategic levels, and in addition to the unique nature, organizational performance can also be assessed [28]. Nowadays, such a project-oriented controlling system can now be effectively developed and implemented in organization operations by the level of development of IT and mathematical-statistical methods [29]. Using the innovations created by IT development and digitalization, databases and data-processing capabilities are available that will fundamentally change controlling and ERP systems regardless of industry [30]. This innovation development has created the opportunity for the various reports to be able to illustrate the effectiveness of an entire area or organizational unit in a single indicator. The basic criteria for such aggregated indicators are the appropriate and efficient infrastructure and the use of professional and mathematical methods [31]. Different evaluation algorithms and standardization norms are required in each case to interpret the indicators and make the resulting decisions [32].

2. Materials and Methods

Through an extended case study [33] in our research, we develop a controlling aspect-based model for evaluating strategic effectiveness based on plan–fact analysis. The company included in our extended case study is an organization based in Hungary. The main activity of the company is the organization of individual-customer-oriented trips. The main destinations of travel are Central and Eastern European countries. In the present study, we analyze the results of the organization’s 113 unique travel projects in 2019 and 120 in 2020. The organization considers these travels to be separate projects due to their unique nature. Our research purpose is to develop a complex and general performance evaluation model that is suitable for organizations operating in a project organization structure. Using our model, we point out that the performance of organizations operating in the tourism industry significantly influenced by COVID-19 can be subjectively assessed during the pandemic period.
The company evaluates its performance based on plan–fact analysis ratios, which it calculates at several hierarchical levels. These ratios are stored in the corporate governance system for several years. The calculation basis of our model is the ratios calculated from the plan–fact analysis at different hierarchical levels. The unit of measurement for these ratios is in all cases given as percentages. (Data on ratios from plan–fact analysis in Table 1, Table 2, Table 3 and Table 4 are also given as a percentage.)
Our model development is based on data collected in the organization’s ERP system. From the KPIs measured by the organization, we selected twenty-five indicators that were included in the analysis. In selecting KPIs, the criterion was contribution to strategic effectiveness. The formulation of this criterion is necessary because the aim of our research is to create a strategic performance index. The weights of the project portfolios, key performance indicators (KPI), and balanced scorecard (BSC) perspectives were determined based on the opinions of the managers of the organization. Weight values were measured using a questionnaire method. The time of the survey was from 21 October 2020 to 4 November 2020. The questionnaire was completed by nine top managers. The nine fillers are all employees in managers positions in the company who are involved in strategy development and decision makers. The nine managers are leaders in various functional and strategic areas. By completing the questionnaire with all managers, determining the weights of KPIs that affect strategic effectiveness has become more relevant. To determine the weights, we added the scores of the managers evaluations. The results were categorized into predefined categories that we created. The reason for this is the treatment of subjectivity and fuzzy nature from the questionnaire method. Based on these, we defined five different fuzzy categories. The categories were defined based on the results of the questionnaires. This is how the following five fuzzy categories were created, which also represent weight values. For KPIs: 1.00 (score: 41–45); 0.80 (score 36–40); 0.70 (score: 31–35); 0.65 (score: 28–30); 0.60 (score 22–27). For BSC perspectives: 1.00 (score: 42–45); 0.90 (score 38–41); 0.85 (score 34–37); 0.80 (score: 30–34). For project portfolios: 1.00 (score: 41–45); 0.85 (score 34–40); 0.70 (score: 27–34). Due to the distribution of the results of the questionnaire, it was not necessary to define additional weights in either case.
The plan values for KPIs are defined by the organization. In addition to the KPIs belonging to the projects, we also include in the analysis indicators that cannot be interpreted in the case of travel projects but in relation to a given project portfolio as a whole. Projects have equal weight in relation to each other, within a given project portfolio. KPIs also have equal weight in different project portfolios. At the level of project portfolios and BSC, different aggregates have different weights. The strategic level consists of four perspectives with different weights defined at the BSC level (Figure 1).
After organizing these data into a logical structure, we build a BSC-based performance evaluation model of the examined organization. In order to incorporate high subjectivity into our controlling model, we use fuzzy methodology. Before applying the fuzzy-logic methodology to measure performance, the following is an overview of the fuzzy-set concept.

2.1. Basic Concepts of Fuzzy Logic

In the field of artificial intelligence research, various expert systems have been developed since the 1950s that draw inferences based on data and knowledge base and Boolean algebraic logic [34]. Boolean algebra is based on binary values: true–false. However, in the natural sciences and social sciences, in many cases, phenomena occur that can be poorly or subjectively defined. Modeling these phenomena with exact methods is not possible at all. In response to this problem, Zadeh developed the fuzzy logic method of the continuum with infinite set of values in 1965 [35].
The meaning of fuzzy is vague; hence, the classification into a given set in these systems is determined by membership functions. Membership functions illustrate the value of a particular language variable [36]; for example, the evaluation of a particular organization can be the values of a linguistic terms: ineffective, moderately effective, and very effective. Belonging to a given set can be determined using the function. This operation is called fuzzification [37]. It is then necessary to develop a set of rules that perform operations and draw conclusions using each linguistic term. As a result of this process, an aggregate of member functions can be created, which is an essential element of defuzzification. Defuzzification results in an actual value that can be considered the end result of fuzzy analysis [35,37].
Within project evaluation, fuzzy-logic-based methods are common among the methodologies used to evaluate project success [38,39,40,41,42]. The success of projects significantly determines the overall organizational effectiveness [43]. The fuzzy concept of project success is since that the word “success” is an indicator that has no sharp boundaries on the basis of which general categories could be created [44]. “Indicator A, B and C did not meet the plan value” and “Indicator A value is unacceptable”, but “Indicator A value is acceptable compared to indicator B value”. These examples illustrate the fuzzy set theory developed by Zadeh in judging the performance of indicators [45].
In our research, we define the classification of the strategic effectiveness index as a fuzzy subset. For a model based on fuzzy logic, it is necessary to define the universe (U), the elements (xi) U, where U = {x1 + x2 + … xn}, and the fuzzy subset A is included U, where
A = x μ A x | x U
The membership function of a fuzzy subset A is most commonly expressed by:
μA: U → [0,1], which assigns to each element xU the membership degree of (x) μx in A: μA(x) = μx.
The most commonly used fuzzy logic operations are intersection, union, and complement [35]:
-
Intersection of two fuzzy subsets A and B: μA∩μB = minimum {μA(x), μB(x)}
-
Merge of two fuzzy subsets A and B: μA∪μB = maximum {μA(x), μB(x)}
-
The complement of A: μA’(x) = 1 − μA(x)

2.2. Steps of Modeling

Step 1: Selection of KPIs measured by the organizational controlling system that are KPIs influencing strategic performance. Determining plan–fact analysis ratios for these KPI. Further analysis is based on the plan–fact analysis ratios of these KPIs.
Step 2: Weighting of aggregates created based on subjective expert opinion. Choice of different standardization norms to evaluate ratios from plan–fact analysis for the KPIs.
Step 3: Evaluate aggregates, created based on subjective expert opinion, based on selected standardized norms.
Step 4: Evaluate the aggregated results of the selected KPIs based on the selected standardized norms.
Step 5: Define and evaluate aggregates for balanced-scorecard perspectives based on different standardization norms.
Step 6: Define and evaluate a strategic performance index based on different standardization norms.

3. Results

The model we have built evaluates the effectiveness of a travel-organizing company operating in a project-oriented organizational structure. The project-oriented structure of the examined organization stems from the unique nature of travel organization. The unique nature of the travels means that they are not standardized; therefore, it is not pre-assembled travel packages that are sold, but small-group packages tailored to individual customer needs. Thus, organizational effectiveness is significantly influenced by the success of projects. The primary internal organizational structure is subordinate to project management. Some project activities are planned and implemented centrally. Centralized background functions provide the basic operating conditions for the execution of individual projects [46]. At the same time, the operational project manager is responsible for the functional processes of the projects [47]. Implementing an organizational structure requires a project-based organizational strategy and the application of management methods [23].
The hierarchical controlling system we built consists of five (Figure 1) levels. The lowest level is made up of the values of the KPIs for the different projects. The values of KPIs are determined by the company using different metrics. For each project in the organization, KPIs created by the same measuring points are evaluated. In order to be able to evaluate projects effectively, it is necessary to aggregate projects according to a certain aspect. The aggregation of travel projects can also be performed along several expert opinions and using different mathematical-statistical methods. The organization uses grouping by price category as an aggregation method. Based on this, three groups were created, which are located on the second level in our model. The third level is the aggregate values of the KPIs included in the analysis. At the fourth level, the values of already-grouped KPIs are aggregated along the perspectives of the balanced scorecard. The controlling system used by the company does not systematize the data in this structure. The need to use the BSC was caused by the more systematic structure of the controlling system and the more efficient analysis of the data arranged in the structure. Furthermore, the application of the BSC provides an opportunity to assess the economic impacts of the pandemic and the resulting planning and delivery effectiveness through different strategic perspectives. The top level is the strategic level, for which we create a strategic performance index. Using this index, we evaluate organizational strategic effectiveness in an aggregate indicator.
Plan–fact analysis ratios are used to evaluate the lowest level travel projects. The KPIs for these projects include plan–fact analysis ratios and plan–fact analysis ratios for KPIs that can only be interpreted at the project portfolio level. The average of these indicators represents the result of the examined project portfolio. Aggregate KPIs at the third level are the weighted average of specific indicators (e.g., ROE, ROA, CSR, etc.) related to the projects in the project portfolios. The value of the four different aspects of the balanced scorecard at the fourth level is the weighted average of the aggregated KPIs for those perspectives. The strategic performance index can be calculated as a weighted average of the values of the BSC perspectives (Figure 1).

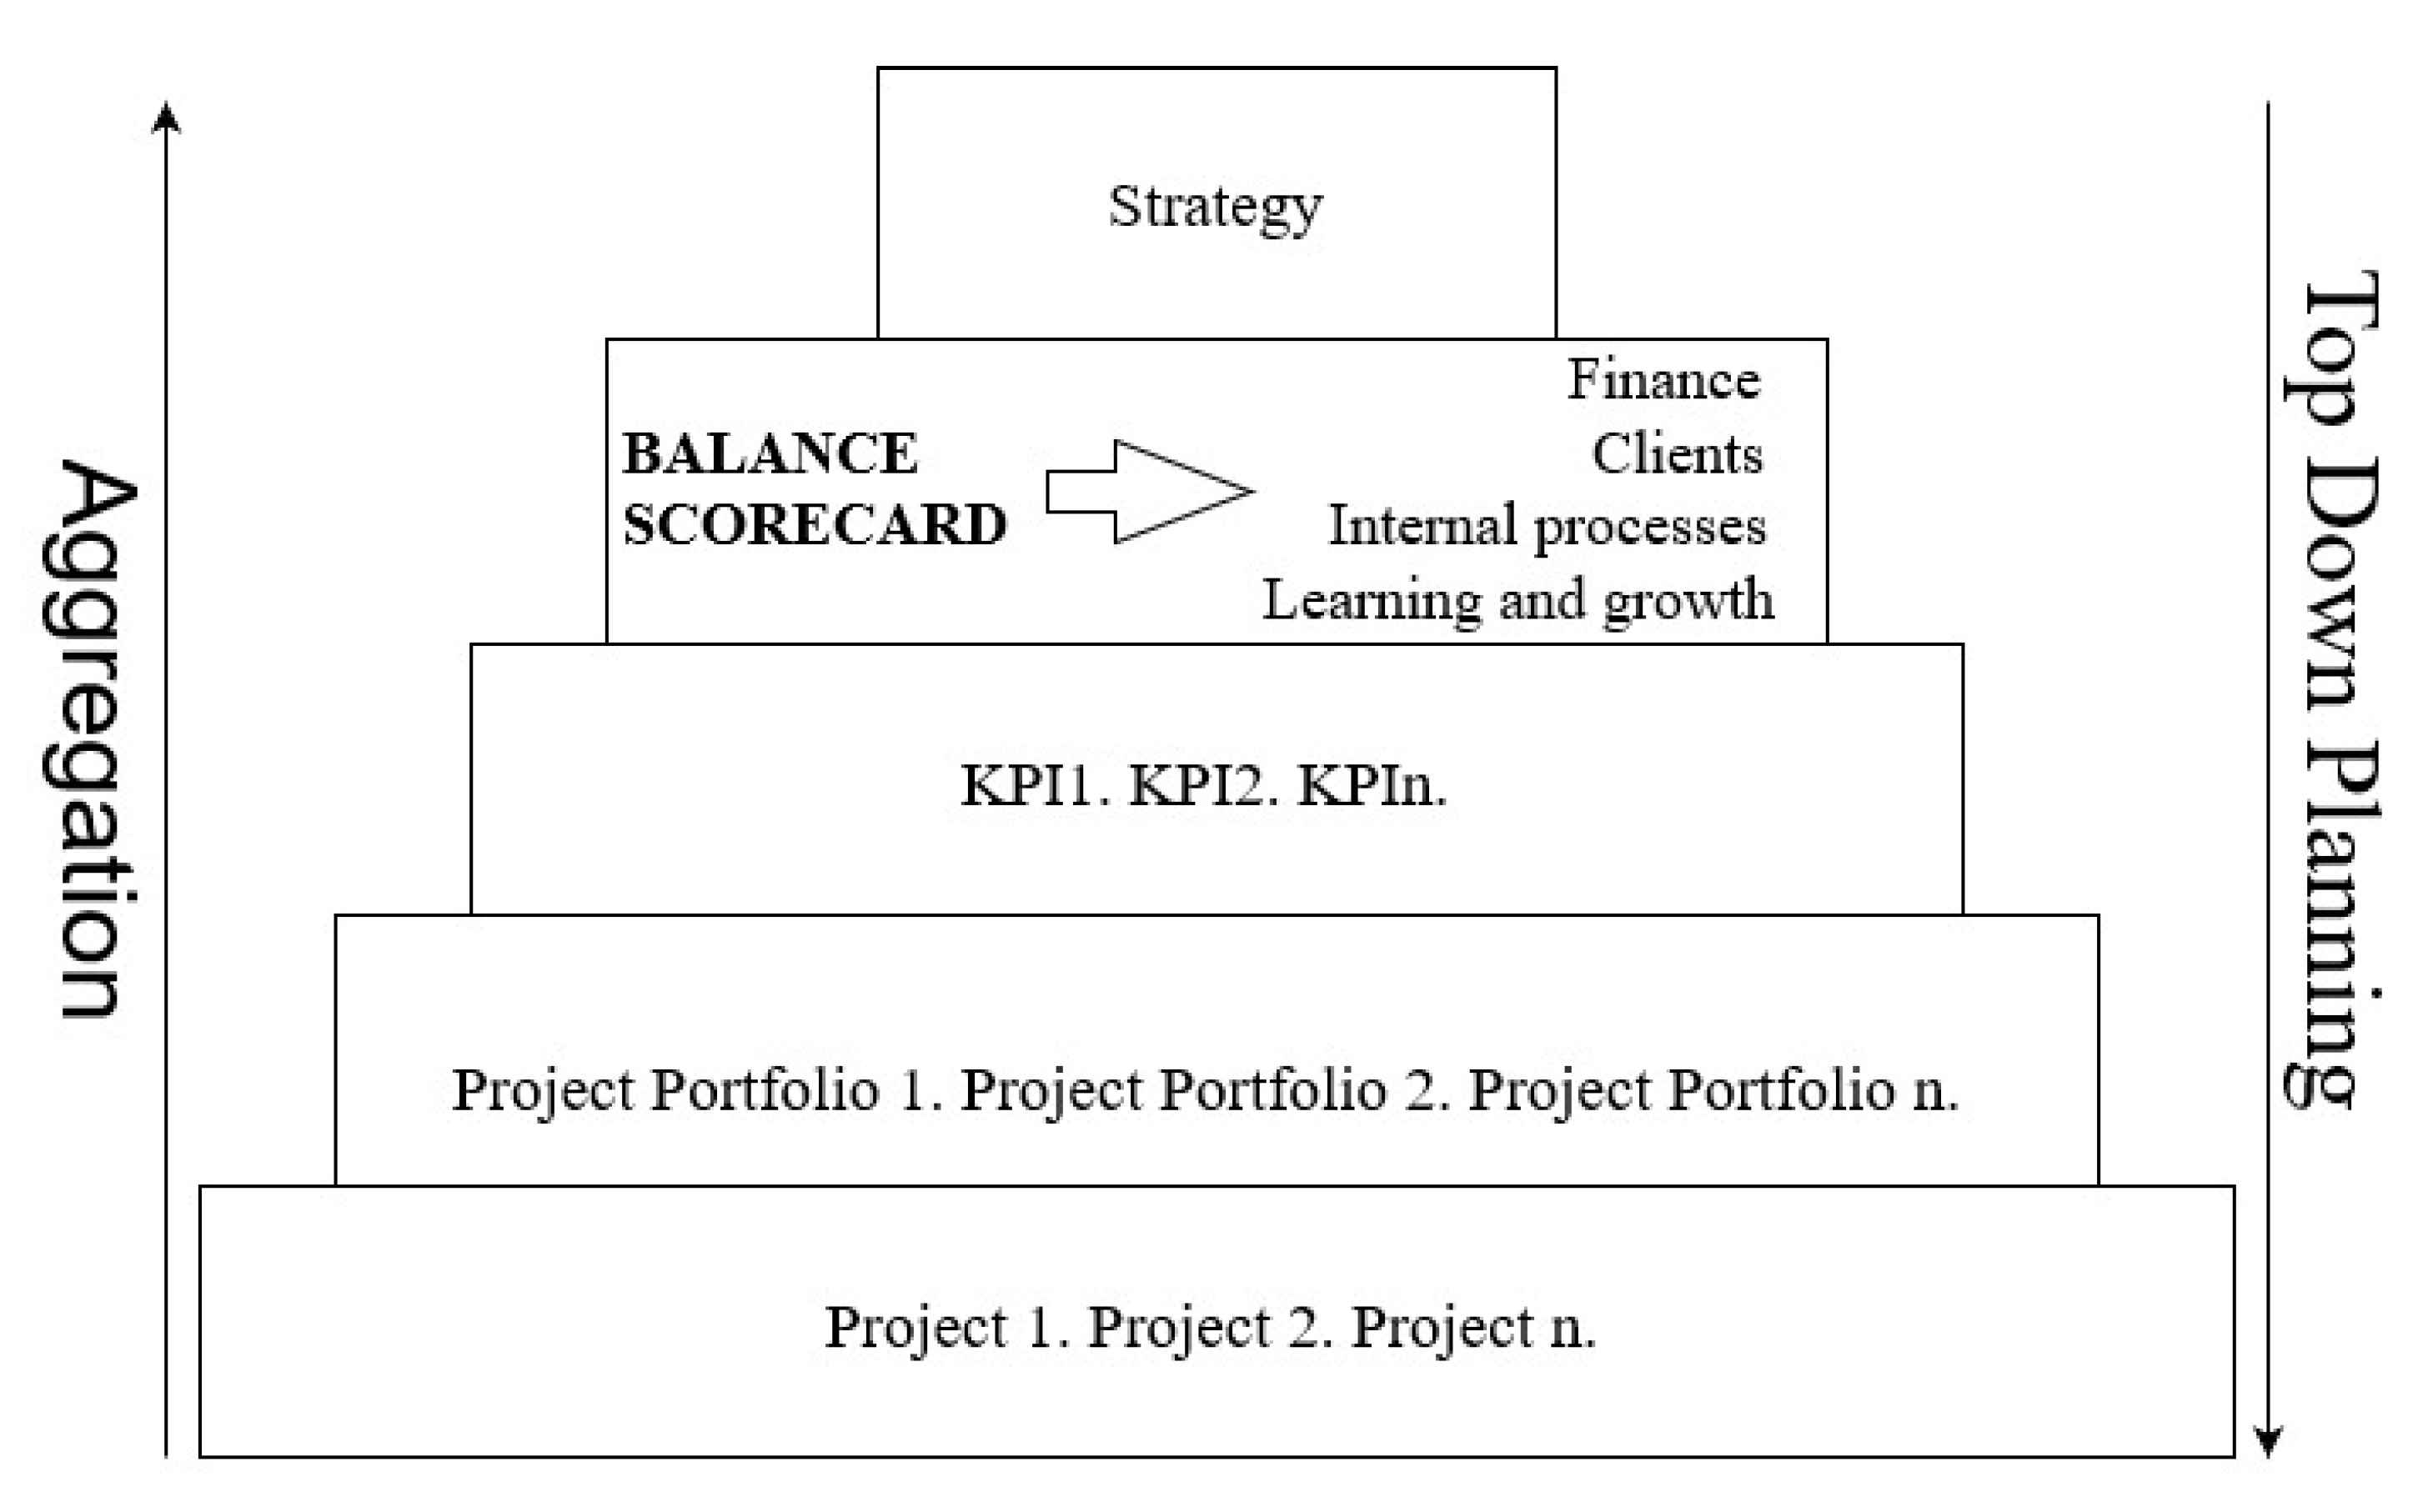
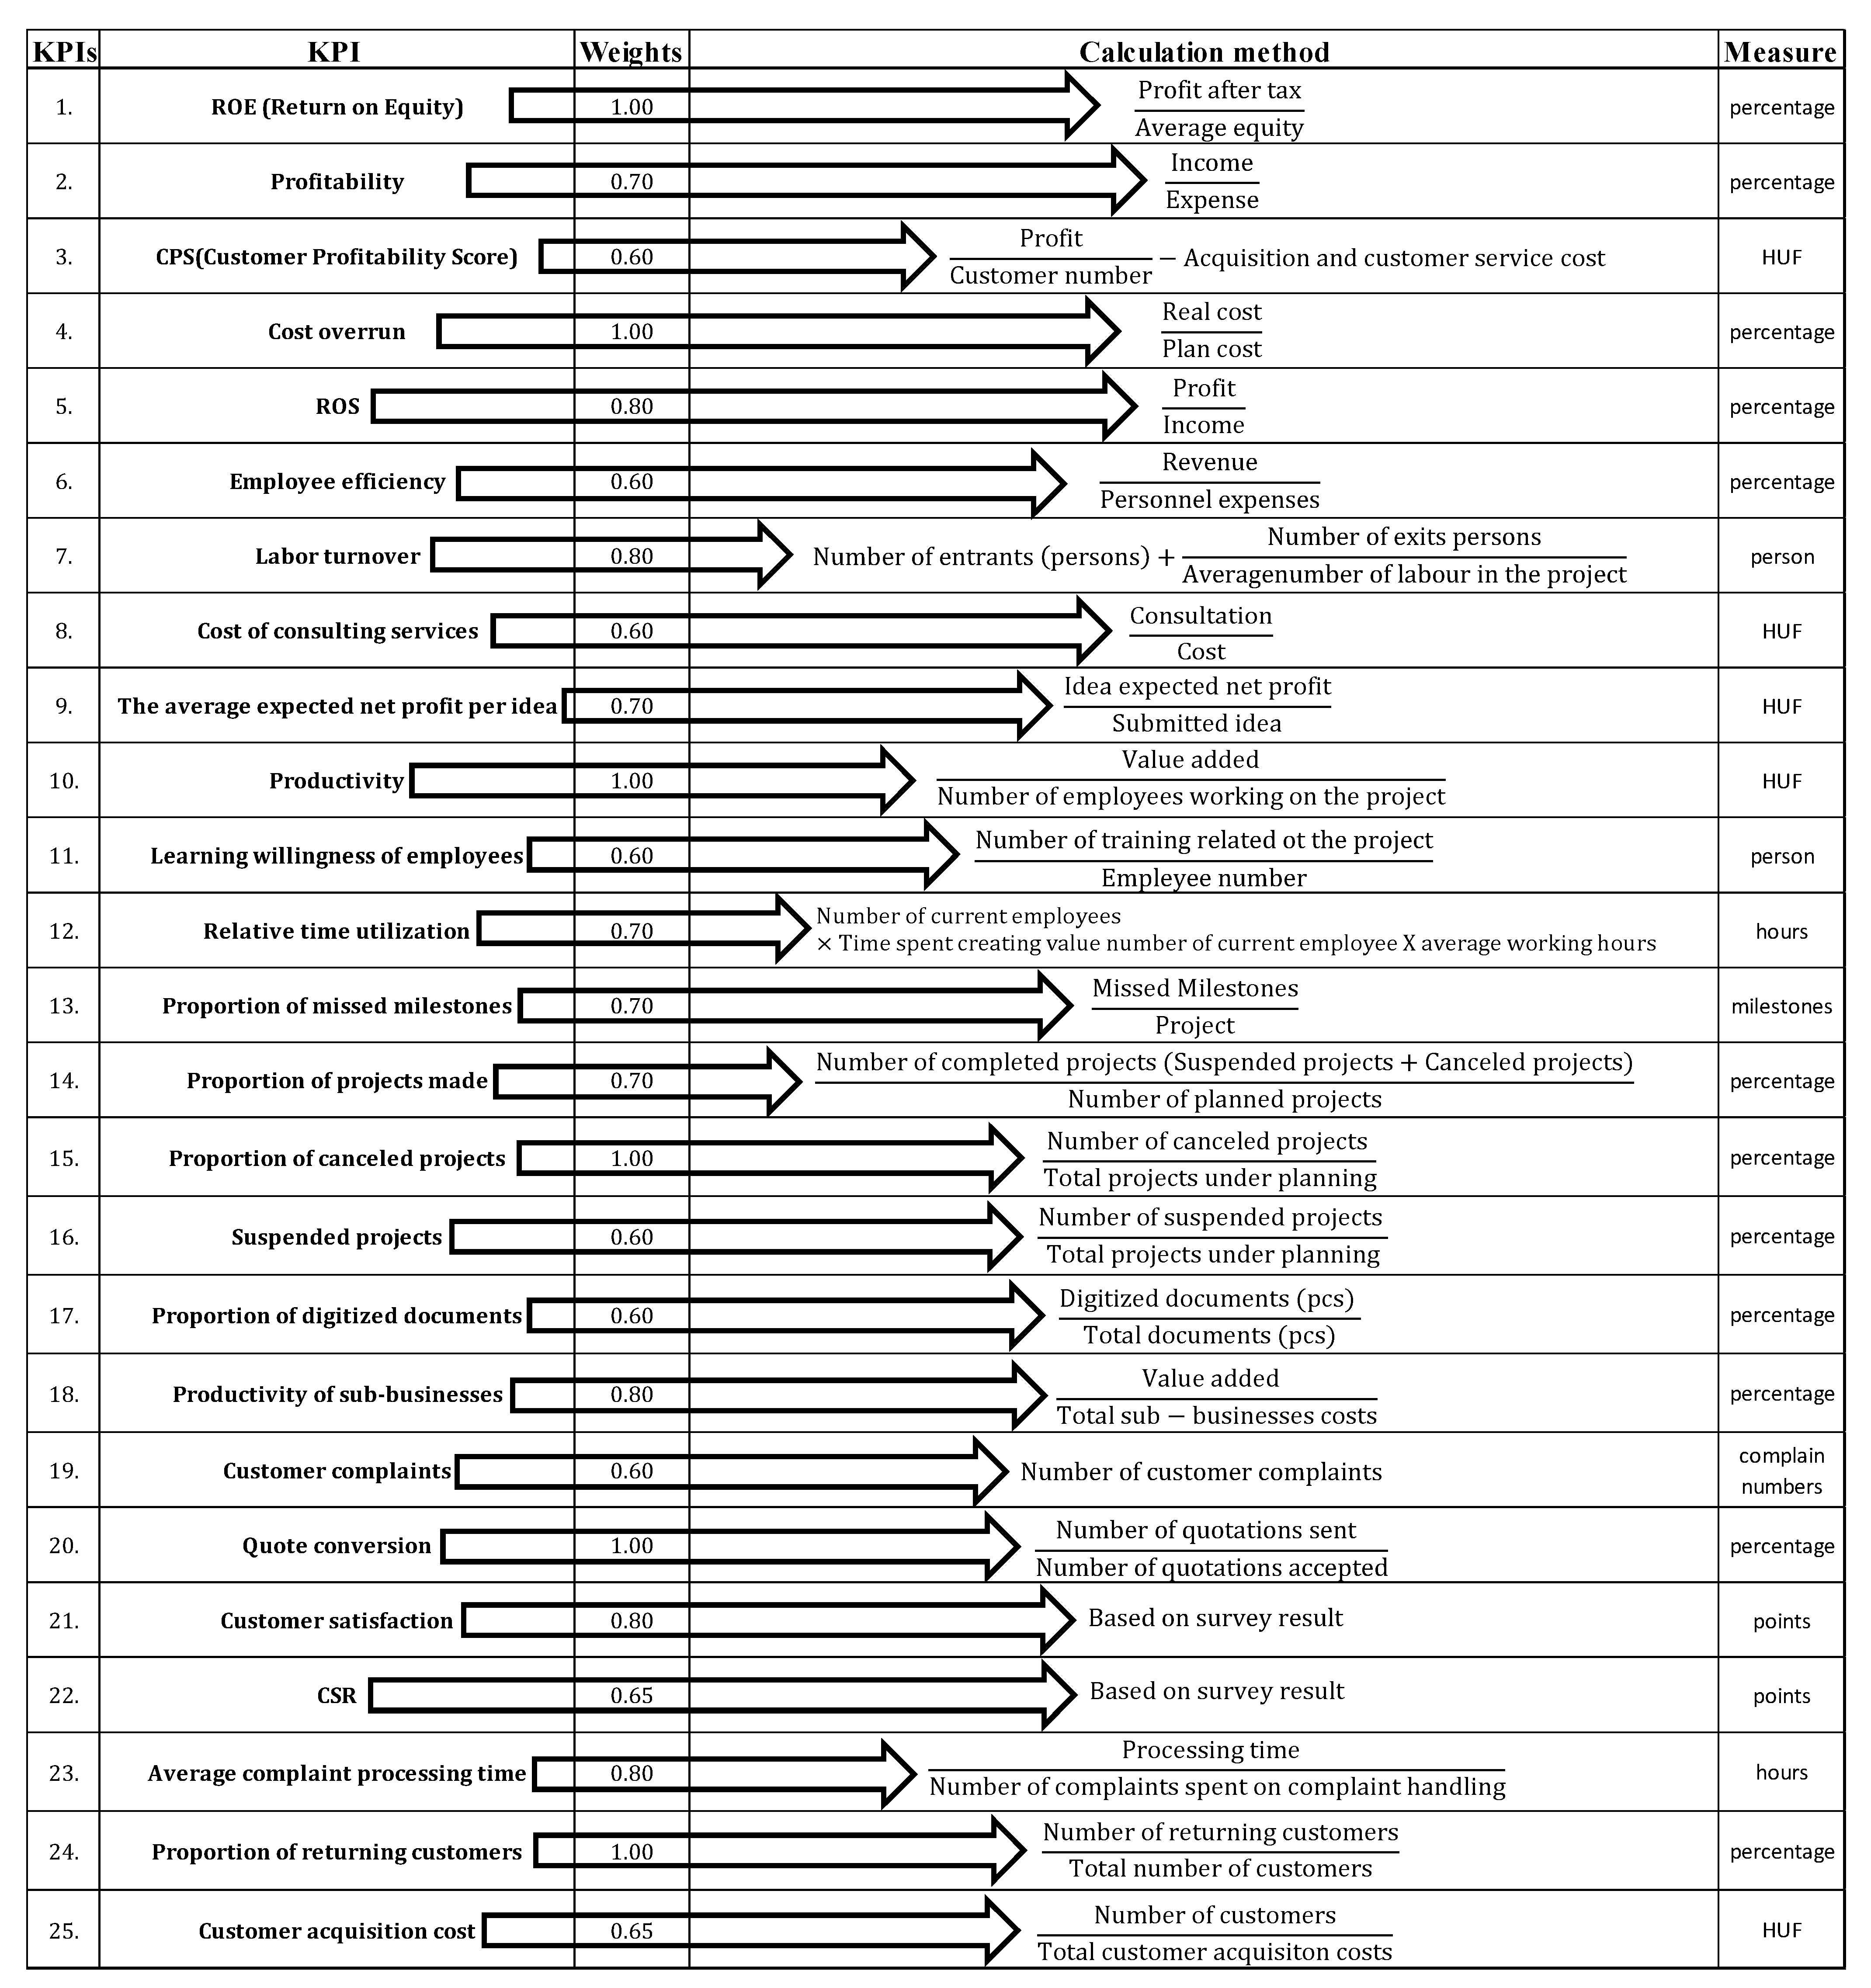
3.1. Step 1. Selection of the KPIs that Affect Strategic Effectiveness and Determining Plan–Fact Analysis Ratios for the KPIs

The organization uses a number of KPIs to measure performance and functional areas (Figure 2). From the KPIs measured by the organization, we selected twenty-five different KPIs influencing strategic performance. They can be calculated from the data of the selected KPIs and measuring points. These KPIs are measured during each travel project. This allows the company to have standardized monitoring of unique projects. Furthermore, during monitoring, a plan value is predefined for each KPI to which the actual fact value is compared. The application of plan–fact analysis provides an opportunity to standardize KPIs as a percentage. Plan values are predefined by the company’s strategic decision makers and controllers. In most cases, the plan values formed in this way are determined based on the company’s past period, capacity, internal organizational data, industry forecasts, macro-environmental factors and consumer surveys.
In our analysis, the actual value is the current value at the same time as the plan date. In each case, the ratio resulting from the plan–fact analysis is an indicator of past and current performances for a predefined given planning period. The definition of planning periods and plans for them is thus a key factor. The planning periods are industry specific, with the period from May to September being the most prominent of these planning periods for the organization under study. In our research, we use the exam ratios of the plan–fact analyses for the period from May to September of 2019 and 2020.
The company subjectively evaluates the extent of deviation from the value of the predefined plan in order to process the information content and make effective decisions. The ratio from the plan–fact analysis is crisp in nature, as the plan value appears as a threshold in the analysis, but the subjective definition of the thresholds raises the possibility of applying fuzzy logic. The crisp-like classification does not have enough information content to evaluate KPIs and make effective decisions. Based on the value of the plan–fact analysis ratio, the effectiveness of the KPI is only an indicator that does not have sharp boundaries by which a general classification could be established [44].

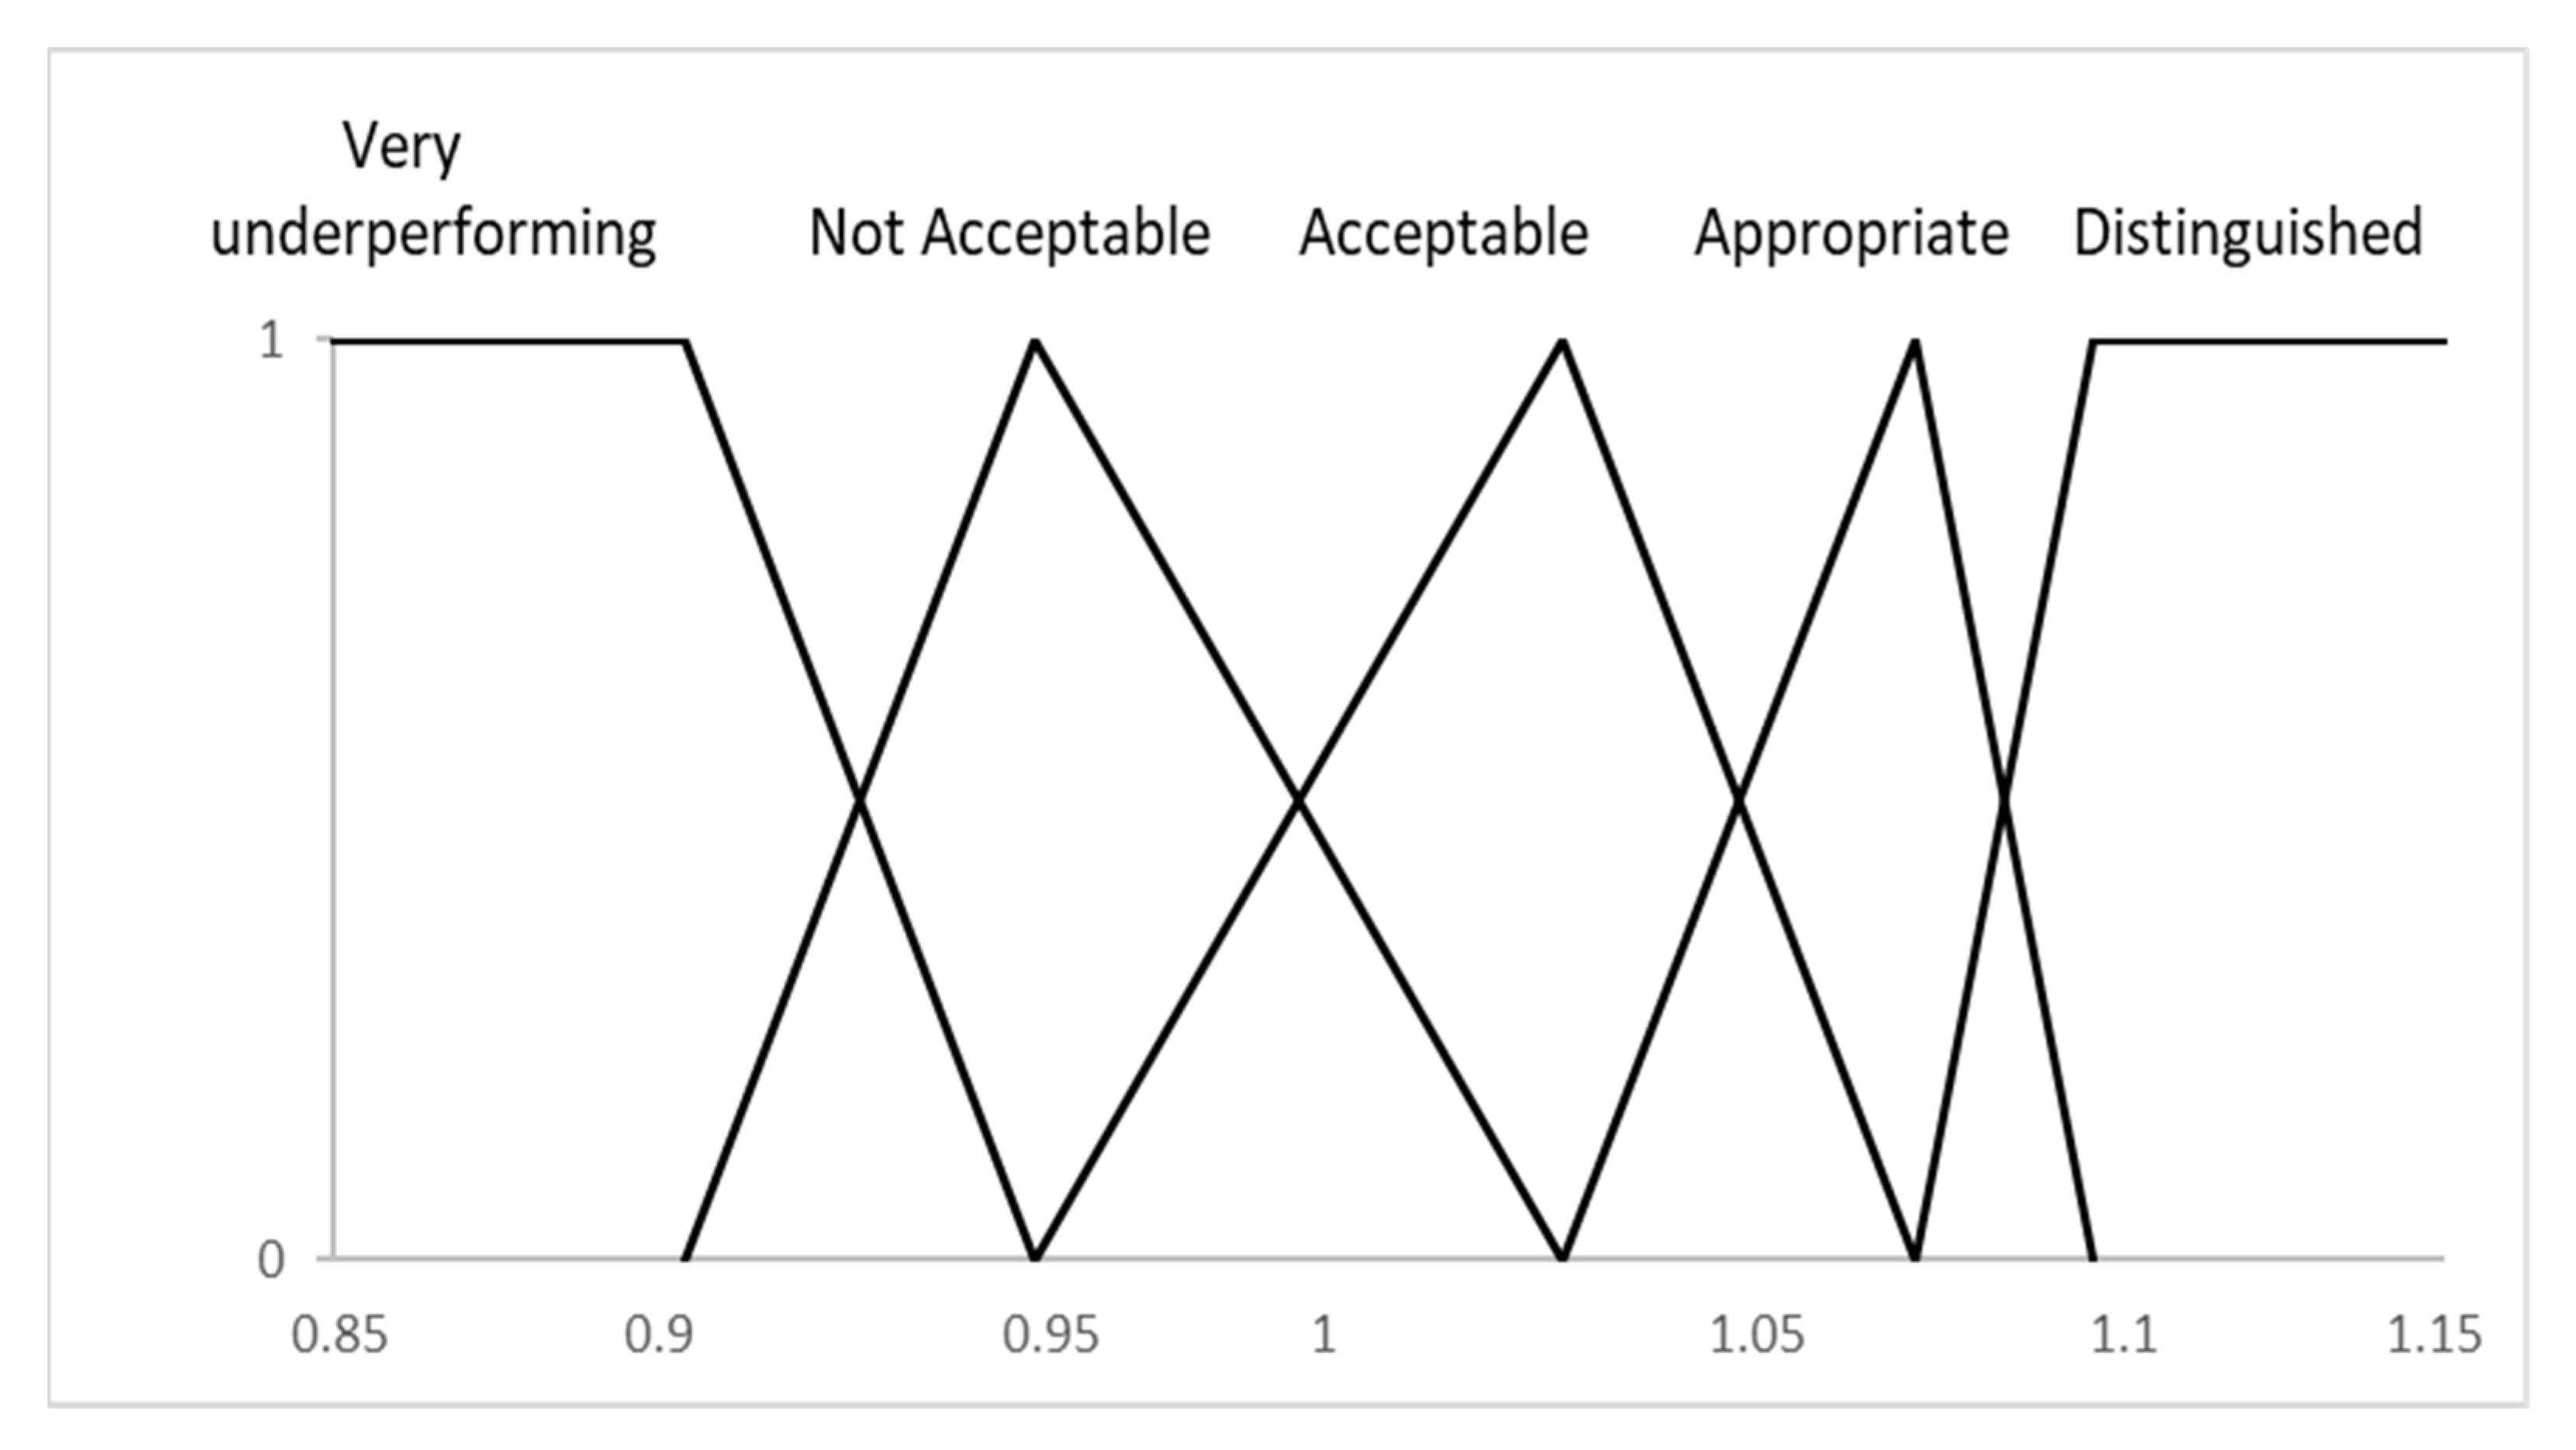
3.2. Step 2: Weighting of Aggregates Created Based on Subjective Expert Opinion. Choice of Different Standardization Norms to Evaluate Ratios from Plan–Fact Analysis for the KPIs

The second level of our model consists of aggregates of different unique travel projects. In our research, travel projects were aggregated along KPI and price category. The need to aggregate projects was caused by the quantitative reduction of data and the more efficient analysis of data. Aggregation by the price category used allows for more efficient exploration of intervention points. The company groups the grouping of projects solely according to this subjective aspect. Based on the applied subjective professional aspect, three project portfolios can be created. The first portfolio includes “P1-Basic”, unique travels that can be considered average or below average compared to the average price of all travels organized by the company. The second portfolio, in the case of grouping by price category, is the “P2-Luxury” category. This portfolio includes above average, but not above 20% above average, price categories. The third portfolio is the “P3-Extra Luxury” category, which includes travels with a price of more than 20% above average. These three project portfolios have different weights in achieving the strategic goal of the company ((P1 0.70); (P2 0.85); and (P3 1.00)). We determined the weights of the project portfolios based on a questionnaire method. The results of the questionnaire are in line with the guidelines in the corporate strategy that the “P3-Extra Luxury” travel category takes priority over the other categories.
The performance of the project portfolios and the organization is classified according to the standardized norm defined by the company and two other possible standardized norms chosen by us to support our research goal.
The standardized norm (ST 1) applied by the organization is based on the subjective classification of plan–fact differences for a given planning period defined by the organization. According to the thresholds set by the organization, the ratios can be divided into five classes. The limits of classification are based on subjective choice and can therefore be interpreted as fuzzy logic. The KPI is classified into one of the five predefined classes based on the value of the plan–fact analysis ratio.
The second of the standardized norms (ST 2) was formulated by us. This standardized norm is also classified into five classes based on the value of the plan–fact analysis ratio. In the analysis, the five classes and their thresholds do not change compared to ST 1. In this case, however, the factual data are the results of the period under review, while the plan data are the plan data of the previous period. In the present case, the factual data are the values for the period from 1 May to 30 September 2020. The plan data are the values for the period from 1 May to 30 September 2019.
Using the third standardized norm (ST 3), we point out that indicators classified according to ST 1 can be assigned to a different evaluation class by changing the standardized norms, with the same threshold values and plan–fact analysis ratios. Thus, it can be stated that the assessment of ratios is not necessarily clear.
We chose the ratio to the weighted average as ST 3. At the second level, the aggregate value of the KPI of the given project portfolio is the fact data, which is equal to the weighted average of the given KPIs of the projects in the project portfolio (first level). The plan value is the weighted average of the values of the analyzed KPIs for all project portfolios. Determining the weights of KPIs makes it possible to evaluate the effectiveness of KPIs within the project portfolio and the aggregated KPI. The weightings of KPIs are determined based on the subjective opinion of the strategic and functional managers of the project-oriented organization. We measured the values of KPI weights using a questionnaire method. The KPI weights thus developed are the same for each project. At the third level, similarly to the previous level, the weighted average of the values of the analyzed aggregate indicator and aspects represents the plan value. This plan value is compared to the weighted average per project portfolio for the KPI analyzed, which in this case is the actual value. At the fourth level, the aggregate values for the different BSC perspectives represent the actual value, which is the weighted average of the corresponding KPIs. The plan value is the value of the strategy index at the fourth level, which is the weighted average of the results of the four different BSC perspectives. At the fourth level, due to the structure of the analysis and the model, the results cannot be evaluated according to this standard norm.
The classification of KPIs along different standardization norms indicates that the indicator may be assigned to a different assessment class with the same plan–fact analysis ratio value (ST 1, ST 3) and threshold values (ST 1, ST 2, ST 3). (Table 1).
The function used to classify:
σ j = A j i Ν j × ξ i K
where A: the actual value of the KPI, N: the predefined plan value, ji: the serial number of the examined element, K: the number of examined elements belonging to the KPI/BSC aspect, and ξi: derived value of weight.
The organization defines five different classes to evaluate the effectiveness of its indicators.
Τ j Very   underperforming Not   acceptable Acceptable Appropriate Distinguished if   σ j < α if   σ j   α ; 1 ) if   σ j   1 ; α if   σ j   α ; β if   σ j > β
Τ j Very   underperforming Not   acceptable Acceptable Appropriate Distinguished if   σ j < 0 , 95 if   σ j   0 , 95 ; 1 , 0 ) if   σ j   1 , 0 ; 1 , 05 if   σ j   1 , 05 ; 1 , 1 if   σ j > 1 , 1
Using the fuzzy function (Figure 3), the firm can evaluate its effectiveness using the five classification categories. The function allows the controlling system to serve as an indicated feedback function for the business.
The function is used as a computational methodology to evaluate and classify different project portfolios, KPIs, BSC perspectives, and the strategic performance index. The classification is performed along linguistics terms; these linguistic terms were defined by the managers of the project-oriented organization; and in the present research, we use these classes and the thresholds belonging to the classes. When applying the linguistics terms of the classes, it is not the value taken on the scale but the threshold values and standardized norms that determine them.

3.3. Step 3: Evaluate Aggregates, Created Based on Subjective Expert Opinion, Based on Selected Standardized Norms

Table 1 lists the projects as aggregates of three different project portfolios. Based on the analysis of the project portfolios, it can be stated that a significant part of the projects belonging to the given project portfolios were assigned to different evaluation classes with the same thresholds and ratios based on different standardization norms. This result demonstrates that the evaluation of results is not clear, subjective, and benchmark dependent. In the case of organizational project portfolios, in 2019 and 2020, they do not show an important difference in the fulfillment of the examined KPIs. Overall, extreme classes (Very underperforming, Distinguished) can also be interpreted as intervention points. The plan values for these KPIs need to be reviewed. During the review, we may receive feedback on the unreality of the plan or on the actual extreme performance of the KPI fact value. During the evaluations according to ST 1 (2019) and ST 3 (2019), it can be stated that the values of the plan–fact analysis ratio of the KPIs within the given project portfolio have almost the same classification. This means that KPIs performed similarly relative to their own plan values (ST 1 2019) and also to average performance (ST 3 2019). In the case of Project Portfolio 3, a significant difference can be observed in the analysis of ST 3 (2019–2020) compared to ST 2 (2019–2020). This means that the majority of the KPI performances of 2020 P3 (KPI 3-CPS, KPI 8-Cost of consulting services, KPI 13-Proportion of missed milestones, KPI 17-Proportion of digitized documents, and KPI 23-Average complaint processing time) show a positive change in the contribution to the average target values of P3 in 2019. Based on this, it can be stated that the results of 2020 would have resulted in a different level of contribution to the 2019 P3 objectives in many cases.

3.4. Step 4: Evaluate the Aggregated Results of the Selected KPIs Based on the Selected Standardized Norms

The KPI results included in the analysis (Table 2) are the average of the project portfolios, which have already been corrected by the weight values of the project portfolios. Table 2 shows the aggregated value of KPIs for all projects. In the analysis of these aggregate values, it can be stated that the values of KPIs are assigned to different valuation classes for different standardized norms, with the same thresholds. In the case of the ST 1 (2019) and ST 1 (2020) analyses, it can be seen that the actual value of a KPI does not have a negative (very underperforming) classification compared to the pre-defined plan values. Thus, the processes and areas measured by the KPIs did not show a markedly negative performance over the period under review based on ST 1 analyses. In the ST 1 (2019) analysis, KPI 24 (Proportion of returning customers) has a positive extreme class. Based on this, it can be concluded that the company significantly exceeded its objectives associated with the KPI. In the case of the ST 1 (2020) analysis, several KPIs (KPI 2-Profitability, KPI 14-Proportion of projects made, KPI 15-Proportion of canceled projects, KPI 16-Suspended projects, KPI 20-Quote conversion, and KPI 25-Customer acquisition cost) falls into this class. Based on these indicators, it can also be assumed that the performance in 2020 would be more effective compared to the results of the previous year. This assumes more efficient performance in 2020 compared to 2019. However, based on the results of the ST 2 (2019–2020) analysis, the actual values for 2020 did not perform outstandingly compared to the plan values for 2019. Thus, these data adequately illustrate that the assessment of 2020 performance was influenced by expectations of the negative economic impact of COVID-19. The values of the KPIs in the ST 3 analyses are the value adjusted for the weightings of the project portfolios and the given KPI. No significant difference is observed in these analyses; therefore, the evaluation according to this standardized norm does not change the assessment of performance compared to other standardized norms.
The analysis confirms that as a result of the pandemic, the organization significantly reduced its targets in its 2020 planning. The 2020 actual data thus performed similarly to the 2019 plan values. Based on this, it can be concluded that the effect of COVID-19 on the functioning of the organization is not clear.

3.5. Step 5: Define and Evaluate Aggregates for Balanced-Scorecard Perspectives Based on Different Standardization Norms

The BSC perspectives (Table 3) used to analyze an organization’s strategic effectiveness have detailed information content to assess organizational performance. After analyzing the four perspectives, the indicators that fall into one of the extreme (Very underperforming, Distinguished) classes based on the classification of each standardized norm can be explored. Furthermore, exploring the reasons for changes in class-changing indicators based on the results of the analysis can also provide relevant information.
In the analysis of the financial perspective, a change of class can be observed in the case of ST 1 (2020) compared to ST 1 (2019). Among the KPIs that make up the finance perspectives, KPI 1 (ROE), KPI 2 (Profitability), KPI 5 (ROS) and KPI 6 (Employee efficiency) should be highlighted in the more detailed analysis. The change in these indicators (Table 2) resulting from a positive plan–fact analysis significantly influenced the change in the financial aspects class. Among the listed indicators, KPI 2 (Profitability) should be highlighted, which is also the most significant (distinguished) contribution to the average performance of the 2020 financial perspectives during the ST 3 (2020) analysis. The improvement in the performance of the financial aspects, however, is not clear as the analysis in (Table 3) ST 2 (2019–2020) shows that the actual value for 2020 met the plan values for 2019 in an “Acceptable” manner. This illustrates that as a result of COVID-19, the company reduced its expectations, which it exceeded despite predestined negative macro conditions. Thus, judging a firm’s financial performance during a 2020 pandemic period depends on the analytical context.
Dependence on the same analytical context can also be observed for customer perspectives. There was a class change similar to the financial aspect for ST 1 (2020) compared to ST 1 (2019). Among the KPIs, KPI 20 (Quote conversion), KPI 24 (Proportion of returning customers) and KPI 25 (Customer acquisition cost) have the most significant influence on the class change of the indicator. These indicators also show a reduction in expectations as a result of the pandemic. This effect is most noticeable in the case of the quote conversion. However, the 2020 “Appropriate” performance can only be categorized as “Acceptable” compared to the 2019 plan values.
In the case of internal business perspective, the change of class is different from the previous two perspectives. In ST 1 (2019), aspects are classified as “Not Acceptable”, while in ST 1 (2020), they are classified as “Appropriate”. This significant class change is due to the influence of the change resulting from the positive plan–fact analysis of KPI 14 (Proportion of projects made), KPI 15 (Proportion of canceled projects), KPI 16 (Suspended projects) and KPI 17 (Proportion of digitized documents). Among the indicators, KPI 14 (Proportion of projects made) and KPI 15 (Proportion of canceled projects) should be highlighted. The values of plan–fact analysis ratios for these indicators were also influenced by the effect of COVID-19. The implementation of unique and customer-oriented travels and the cancellation of travels significantly exceeded the plans. This perspective (Table 3) also changed class compared to 2019, which means that the actual value in 2020 exceeded the plan value in 2019.
Learning and growth perspective are an exception to the other perspectives because there is no class change for any of these standardized norms. Among the KPIs that make up the aspects, KPI 7 (Labor turnover) should be highlighted. The value of this indicator decreased less than expected due to external environmental factors. The company’s workforce retention capacity in 2020 compared to its 2019 plan values is “Acceptable”.

3.6. Step 6: Define and Evaluate a Strategic Performance Index Based on Different Standardization Norms

The strategic performance indicator created (Table 4) expresses how the company meets its strategic goals. The index expresses strategic performance in an indicator. The actual value of the indicator is the sum of the ratio to the average performance of the BSC perspectives (ST 3). We classify the actual value calculated in this way based on ST 1 and ST 2. Classifications based on ST 3 are not covered in our research, as in this case the industry average or several years of internal company data would be required. These analyses are inconsistent with our current research goal.
Based on the analysis of ST 1 (2019), the strategic performance of the company is classified into the “Acceptable” class. In 2020, on the other hand (ST 2 2020), the indicator changed class and placed in the “Appropriate” category. This means that the company will perform well in 2020, depending on the strategic goals. Among the BSC perspectives (Table 3), the indicators Financial, Internal business and Customer contributed significantly to this organizational effectiveness.
The company’s performance in 2020 exceeded its plans, but the assessment of the period can only be considered “Acceptable” based on the analysis of ST 2 (2019–2020) (Table 4). The assessment of how well a company has performed in the period under review in 2020 varies along the standardized norms examined. The results achieved along different norms express the evaluation of organization performance with the same realistic approach. In this model, we do not use fuzzy logic to form an accurate classification with real content. The purpose of fuzzy in the model is not to establish this exact classification either. The aim is to show that judging the effectiveness of a business depends on the context.
Overall, our model points out that the presupposed negative effect of COVID-19 on the performance of the organization appeared during planning. However, during the actual performance evaluation, these expectations were significantly exceeded by the examined company; therefore, depending on this context, the company may use its “Appropriate” indicator as an indicator of its effectiveness. However, compared to the 2019 plans, it is only “Acceptable”. Assessing company performance in 2020, so based on these, is a subjective judgment of company managers.

4. Discussion

The differences in the measurement of organizational performance and their criteria raise the question of what effectiveness does the evaluation by a given performance appraisal system actually assume. This issue is the subject of many studies on measuring the performance of tourism businesses [48]. Although travel agents play an important role in the sale of tourism products, it should be emphasized that only a few studies focus on assessing their effectiveness and performance [49]. In recent years, the efficiency of travel agencies has been most often evaluated using nonparametric DEA techniques [50,51,52]. In their study, Barros and Matias (2006) examine the efficiency of 25 Portuguese travel agencies using a cost-boundary model. In their model, relative efficiency is determined based on several input and output indicators. Based on the results of their analysis, it can be stated that capital, labor, sales and marketing activities are the ones that determine efficiency in the sector [53]. In addition to evaluating the efficiency of travel agents, there is no generally accepted method for analyzing performance evaluation. Sainaghi et al. (2013) in their studies suggest an alternative approach to performance evaluation. This alternative approach focuses primarily on qualitative performance evaluation methods, as opposed to the financial aspect [54]. Another category of organizational performance assessment is analysis based on financial and accounting indicators [55]. These traditional financial and accounting analyses focus only on the analysis of financial indicators. However, this approach does not express either organizational strategic or complex effectiveness. Furthermore, it does not consider social, cultural and sustainability perspectives [56]. The BSC model developed by Kaplan-Norton (1992) provides an opportunity to evaluate the tourism sector from a controlling perspective through different perspectives [57]. The model constructed in our research therefore implements the BSC perspectives. This approach is consistent with Atkinson and Brown’s (2001) study examining performance appraisal in the UK hotel industry. Based on the results of their research, it can be stated that within this sector, most of organizations operating in the industry evaluate performance on the basis of financial aspects. However, in their study, the authors emphasize the importance of other aspects of BSC in performance evaluation [58]. In our research, as well as with their study, the financial point of view is formulated as the most emphasized aspects. However, based on Assaf and Josiassen (2012), it can be stated that the exact definition of the performance of tourism enterprises and the relative importance of the factors influencing performance are not clear [59]. Based on these findings, the determination of the relative importance of KPIs and BSC perspectives used to evaluate performance in our research was determined based on the subjective opinion of the managers of the examined enterprise.
Fuzzy logic is a widely used method in organizational performance evaluation. Its application can be observed in many fields [25,60,61,62]. However, it is not a common method for measuring the performance of tourism organizations. Its application occurs in the selection of different criteria in the sector. This was described and confirmed by Lin et al.’s (2009) study. According to the authors, fuzzy AHP is a suitable method for determining the relative importance of factors involved in evaluating the performance of a travel intermediary service. In their study, the various indicators are weighted and ranked based on the opinions of 36 tour top managers and 56 operational managers [63]. In our study, fuzzy logic appears in several aspects: on the one hand, in defining the weights of project portfolios and KPIs, and on the other hand, in defining classification thresholds. It also appears for setting reference values. The organization included in our case study operates as a project-oriented organization, treating the organization of unique-customer-oriented travels as independent projects. The fuzzy methodology is also widely used in the performance evaluation and controlling activities of projects and project portfolios. Its most common occurrence in the literature can be observed during the risk assessment of constructions projects, the selection of project portfolios and the evaluation of project performance [40,64,65,66]. The logic of the project controlling activity based on this fuzzy logic is the same as the controlling model we created. However, due to the fuzzy logic, the disadvantage of our model is that it does not define exact values but gives the values and classes of indicators as fuzzy numbers. Therefore, in terms of formalizing inferential processes, the model provides only approximate answers in the analyses [34]. In order to overcome the disadvantage of the model, neural network and Bayesian-logic-based models are also used in the analyses, performance evaluation and controlling systems of the tourism sector [67,68,69,70,71].

5. Conclusions

In our research, we illustrate a fuzzy-logic-based model through an extended case study that enables project-oriented organizations to effectively monitor their performance. Our case study analyzes the operation of a company that organizes unique and customer-oriented travels. Using the data of the examined company in 2019–2020, we illustrated the operation of the controlling model created by us. In our research, we structured the KPI already used by the company along the BSC perspectives. Based on these findings, we created a hierarchical model, with the help of which it became possible to detect the evaluation of the operation of the organization along different standardized norms.
Unlike performance evaluation models, this controlling model is based on non-benchmark analyses and takes into account the subjectivity derived from measurability and goal setting. Subjectivity from measurability and goal formulation is treated by the model by evaluating along different internal standardized norms. This allows for analysis that takes into account different contexts relative to organizational goals. Using the model, it may be possible to evaluate unique projects according to different standardized norms. The thresholds of the three standardized norms we use do not change, but the reference values are different in each case. By applying the plan–fact analysis ratios used in the research, it becomes possible to standardize the results of the KPIs related to the projects.
Our results indicate the impact of COVID-19 on performance for the organization under study. Our research revealed that the pandemic fundamentally changed the company’s planning for the period under review compared to its plan values for the same period in 2019. Using KPI groupings according to different BSC perspectives, we illustrate that the financial perspective, which is the most emphatic for the company, had its results ranked better in 2020 compared to 2019. Based on the ST 3 analysis, however, the classification of the same 2020 fact data highlights that although the company has an “Appropriate” classification in the pandemic year (2020), this can only be assessed with an “Acceptable” classification compared to the 2019 plan data. This means that the company under investigation rates its performance better during the 2020 pandemic situation, along similar financial results. From an internal business perspective, it can be seen that the company performed better in 2020, regardless of planning. Based on these findings, the question arises whether the more efficient operation of the organization was caused by the company’s internal decisions or the positive macro-environmental changes. Examining the effectiveness of the organizational performance of the strategy, the outstanding “Appropriate” result in 2020 did not achieve an outstanding result compared to the 2019 plan data. Further research would be needed to explore which standardized norm classification is more relevant for managers. As a result of this research, the performance classification ability of the model can be made more accurate.
Based on our results, it can be stated that in a deconjunctural economic environment, the assessment of the performance of companies always depends on the research context. COVID-19 has had a significant negative impact on the tourism industry, which has also significantly affected the real performance appraisal of companies. Therefore, by evaluating the performance of tourism organizations along internal organization goals, more relevant information content and more informed management decision support can be achieved. In our model, negative expectations are incorporated into the goals when evaluating as a function of internal companies goals. Thus, the result of the model evaluates the real performance across different contexts compared to the expectations of the macro conditions resulting from COVID-19.
One of the most significant limitations of the model is that, due to fuzzy logic, the model cannot be applied with extreme values. Based on fuzzy logic, no clear answers can be given, only approximate results can be achieved. Due to internal standardized norms, an additional limitation is that the model is not suitable for industry comparative analysis. The lack of exploration of causal relationships between the applied KPIs and functional areas can be mentioned as a limiting factor. The disadvantage of setting target and weight values in a subjective way appears in the model. These values have a significant impact on the assessment of an organization’s performance in the model. Thus, reducing subjectivity increases the accuracy of model evaluation.
The model does not provide a clear answer to the fact that the changes in organization profitability during the pandemic period under study occurred only due to the effect of COVID-19. On the other hand, in our model, the appearance of the effect of COVID-19 can be clearly observed during the formulation of goals and expectations related to organization performance. By incorporating expectations into the performance assessment, the expected economic changes influenced by COVID-19 are also reflected in the model. However, a number of other influencing factors may have had an impact on the changes examined. The model can be further developed with performance indicators for other strategic and functional areas. This is supported by a study by Yeon et al. (2021), which draws attention to the need to pay attention to the influencing effect of other factors in the performance evaluation of a company during the COVID-19 period [5]. These influencing factors and different company characteristics need to be considered in order to effectively explore the effect of COVID-19. By examining the indicators for these functional areas and their causal analysis, the influencing factors that influence the studied changes in addition to the effect of COVID-19 can be explored. Among these factors, it may be worthwhile to include in a more detailed analysis the changes in communication, marketing channels and organizational management strategies. Another research opportunity is the implementation of the model we have developed for the operational processes of other project-oriented organizations and to expand the model by taking into account the specifications of regional and enterprise development projects. We also recommend the use of data from the tourism sector and unique travel companies as a benchmark of a new standardized norm. It can also be an appropriate way to monitor the sustainability of tourism organizations by involving different sustainability indicators.

6. Implications of the Study

Our study can serve as a standard model for tourism organizations operating in a project-oriented structure that can be used to evaluate effective organizational performance. The created controlling model is able to reveal the intervention points at different hierarchical levels. Classifications according to different standardized norms may indicate different interpretations of the results of the same indicators. This difference in interpretation is also illustrated by the results of our study, in that the assessment of the economic impact of COVID-19 on the performance of the studied organization is not clear.
The model also makes it possible to compare the results of different periods. It supports more accurate, appropriate decision making for the managers of the organization at all strategic, operational and functional levels. In our research, we recommend the use of three generally applicable standardized norms. Along these norms, the results of the examined indicators can be evaluated in different contexts. This provides a significant amount of information for travel agencies to make their decisions. Not only short-term but also long-term strategic decisions are supported by the model, as it standardizes project performance using plan–fact analysis. In this way, it is able to express organizational strategic performance in one indicator.

Author Contributions

Conceptualization, G.T. and S.G.; methodology, Á.B. and G.T.; validation, Z.Z.; investigation, G.T. and Z.Z.; resources, S.G.; writing—original draft preparation, G.T., S.G., Á.B. and Z.Z.; writing—review and editing, Z.Z. and S.G.; supervision, Z.Z. All authors have read and agreed to the published version of the manuscript.

Funding

This research received no external funding.

Institutional Review Board Statement

Not applicable.

Informed Consent Statement

Informed consent was obtained from all subjects involved in the study.

Data Availability Statement

The data presented in this study are available on request from the corresponding author.

Conflicts of Interest

There is no conflict of interests related to this research.

References

  1. Lew, A.A. Why travel?–travel, tourism and global consciousness. Tour. Geogr. 2018, 20, 742–749. [Google Scholar] [CrossRef] [Green Version]
  2. Gössling, S.; Scott, D.; Hall, C.M. Pandemics, tourism and global change: A rapid assessment. J. Sustain. Tour. 2020, 29, 1–20. [Google Scholar] [CrossRef]
  3. Gursoy, D.; Chi, C.G. Effects of COVID-19 pandemic on hospitality industry: Review of the current situations and a research agenda. J. Hosp. Mark. Manag. 2020, 29, 527–529. [Google Scholar] [CrossRef]
  4. Song, H.J.; Yeon, J.; Lee, S. Impact of the COVID-19 pandemic: Evidence from the U.S. restaurant industry. Int. J. Hosp. Manag. 2021, 92, 102702. [Google Scholar] [CrossRef]
  5. Yeon, J.; Song, H.J.; Yu, H.C.; Vaughan, Y.; Lee, S. Are socially responsible firms in the U.S. tourism and hospitality industry better off during COVID-19? Tour. Manag. 2021, 85, 104321. [Google Scholar] [CrossRef]
  6. Aliperti, G.; Sandholz, S.; Hagenlocher, M.; Rizzi, F.; Frey, M.; Garschagen, M. Tourism, crisis, disaster: An interdisciplinary approach. Ann. Tour. Res. 2019, 79, 102808. [Google Scholar] [CrossRef]
  7. Vaishar, A.; Štastná, M. Impact of the COVID-19 pandemic on rural tourism in Czechia preliminary considerations. Curr. Issues Tour. 2020, 1–5. [Google Scholar] [CrossRef]
  8. Ramelli, S.; Wagner, A.F. Feverish stock price reactions to COVID-19. Rev. Corp. Financ. Stud. 2020, 9, 622–655. [Google Scholar] [CrossRef]
  9. Hall, C.M.; Scott, D.; Gössling, S. Pandemics, transformations and tourism: Be careful what you wish for. Tour. Geogr. 2020, 22, 577–598. [Google Scholar] [CrossRef]
  10. Rastegar, R.; Higgins-Desbiolles, F.; Ruhanen, L. COVID-19 and a justice framework to guide tourism recovery. Ann. Tour. Res. 2021, 103161. [Google Scholar] [CrossRef] [PubMed]
  11. Lew, A.A.; Cheer, J.M.; Haywood, M.; Brouder, P.; Salazar, N.B. Visions of travel and tourism after the global COVID-19 transformation of 2020. Tour. Geogr. 2020, 22, 455–466. [Google Scholar] [CrossRef]
  12. Nepal, S.K. Adventure travel and tourism after COVID-19–business as usual or opportunity to reset? Tour. Geogr. 2020, 22, 646–650. [Google Scholar] [CrossRef]
  13. Horváth, P. Der koordinationsorientierte Ansatz. In Controlling als Akademische Disziplin. Schriften des Center for Controlling & Management (CCM), 11th ed.; Weber, J., Hirsch, B., Eds.; Deutscher Universitätsverlag: Wiesbaden, Germany, 2002; Volume 7. [Google Scholar]
  14. Cohen, E. The changing faces of contemporary tourism. Society 2008, 45, 330–333. [Google Scholar] [CrossRef]
  15. Bowen, J.; Whalen, E. Trends that are changing travel and tourism. Worldw. Hosp. Tour. Themes 2017, 9, 592–602. [Google Scholar] [CrossRef]
  16. Hall, C.M. Changing paradigms and global change: From sustainable to steady-state tourism. Tour. Recreat. Res. 2010, 35, 131–143. [Google Scholar] [CrossRef]
  17. Capriello, A.; Riboldazzi, S. How can a travel agency network survive in the wake of digitalization? Evidence from the robintur case study. Curr. Issues Tour. 2019, 1–4. [Google Scholar] [CrossRef]
  18. Palos-Sanchez, P.R.; Correia, M.B. The collaborative economy based analysis of demand: Study of airbnb case in Spain and Portugal. J. Theor. Appl. Electron. Commer. Res. 2018, 13, 85–98. [Google Scholar] [CrossRef] [Green Version]
  19. Xiang, Z.; Wang, D.; O’Leary, J.T.; Fesenmaier, D.R. Adapting to the internet. J. Travel Res. 2014, 54, 511–527. [Google Scholar] [CrossRef]
  20. Kim, H.; Xiang, Z.; Fesenmaier, D.R. Use of the internet for trip planning: A generational analysis. J. Travel Tour. Mark. 2015, 32, 276–289. [Google Scholar] [CrossRef]
  21. Chiappa, G.D. Internet versus travel agencies. J. Vacat. Mark. 2013, 19, 55–66. [Google Scholar] [CrossRef]
  22. Chang, Y. Identifiying positions and roles of travel agencies based on relationship redundancy in a package tour network. Heliyon 2020, 6. [Google Scholar] [CrossRef] [Green Version]
  23. Müller, R.; Turner, R.J. The influence of project managers on project success criteria and project success by type of project. Eur. Manag. J. 2007, 25, 298–309. [Google Scholar] [CrossRef]
  24. Miterev, M.; Mancini, M.; Turner, R. Towards a design for the project-based organization. Int. J. Proj. Manag. 2016, 35, 479–491. [Google Scholar] [CrossRef]
  25. Bayou, M.E.; Korvin, A. Measuring the leanness of manufacturing systems-a case study of ford motor company and general motors. J. Eng. Technol. Manag. 2008, 25, 287–304. [Google Scholar] [CrossRef]
  26. Yang, C.C.; Chen, B.S. Key quality performance evaluation using fuzzy AHP. J. Chin. Inst. Ind. Eng. 2004, 21, 543–550. [Google Scholar] [CrossRef]
  27. Gareis, R. Management by projects: The new management strategy of the project-oriented company. Int. J. Proj. Manag. 1991, 9, 71–76. [Google Scholar] [CrossRef]
  28. Günther, E. Ökologieorientiertes Management, 1st ed.; Lucius&Lucius: Stuttgart, Germany, 2008; pp. 40–42. [Google Scholar]
  29. Gemünden, H.G.; Lehner, P.; Kock, A. The project-oriented organization and its contribution to innovation. Int. J. Proj. Manag. 2018, 36, 147–160. [Google Scholar] [CrossRef]
  30. Hazen, B.T.; Boone, C.A.; Ezel, J.D.; Jones-Farmer, L.A. Data quality for data science, predictive analytics and big data in supply chain management: An introduction to the problem and suggestions for research and applications. Int. J. Prod. Econ. 2014, 154, 72–80. [Google Scholar] [CrossRef]
  31. Otley, D. Performance management: A framework for management control systems research. Manag. Account. Res. 1999, 10, 363–382. [Google Scholar] [CrossRef] [Green Version]
  32. Anthony, R.; Govindarajan, V. Management Control Systems, 12th ed.; McGraw-Hill Education: New York, NY, USA, 2006; pp. 135–144. [Google Scholar]
  33. Babbie, E. The Practice of Social Research, 13th ed.; Wadsworth Publishing: Belmont, MA, USA, 2013; pp. 27–30. [Google Scholar]
  34. Giangiacomo, G. Vagueness and formal fuzzy logic: Some criticisms. Log. Log. Philos. 2017, 26, 431–460. [Google Scholar] [CrossRef]
  35. Zadeh, L.A. Fuzzy sets. Inf. Control 1965, 8, 338–353. [Google Scholar] [CrossRef] [Green Version]
  36. Zadeh, L.A. PRUF—A meaning representation language for natural languages. Int. J. Man-Mach. Stud. 1978, 10, 395–460. [Google Scholar] [CrossRef]
  37. Havasi, I.; Benő, D. Comparison of traditional and fuzzy unsupervised classification on the basis of vegetation index. J. Landsc. Ecol. 2012, 10, 115–123. [Google Scholar]
  38. Asadabadi, M.R.; Chang, E.; Zwikael, O.; Saberi, M.; Sharpe, K. Hidden fuzzy information: Requirement specification and measurement of project provider performance using the best worst method. Fuzzy Sets Syst. 2020, 383, 127–145. [Google Scholar] [CrossRef]
  39. Ammar, M.A.; Abd-ElKhalek, S.I. Criticality measurement in fuzzy project scheduling. Int. J. Constr. Manag. 2019, 1–10. [Google Scholar] [CrossRef]
  40. Nieto-Morote, A.; Ruz-Vila, F. A fuzzy approach to construction project risk assessment. Int. J. Proj. Manag. 2009, 29, 220–231. [Google Scholar] [CrossRef] [Green Version]
  41. Maghsoodi, A.I.; Khalilzadeh, M. Identification and evaluation of construction projects’ critical success factors employing fuzzy-topsis approach. KSCE J. Civ. Eng. 2018, 22, 1593–1605. [Google Scholar] [CrossRef]
  42. Khan, A.A.; Shameem, M.; Kumar, R.R.; Hussain, S.; Yan, X. Fuzzy AHP based prioritization and taxonomy of software process improvement success factors in global software development. Appl. Soft Comput. 2019, 83, 105648. [Google Scholar] [CrossRef]
  43. Baccarini, D. The logical framework method for defining project success. Proj. Manag. J. 1999, 30, 25–32. [Google Scholar] [CrossRef]
  44. Piller, I.; Kovács, S. Fuzzy behavior description language: A declarative language for interpolative behavior modeling. Acta Polytech. Hung. 2019, 16, 47–72. [Google Scholar]
  45. Zadeh, L.A. Is there a need for fuzzy logic? Inf. Sci. 2008, 178, 2751–2779. [Google Scholar] [CrossRef]
  46. Turner, J.R.; Müller, R. On the nature of the project as a temporary organization. Int. J. Proj. Manag. 2003, 21, 1–8. [Google Scholar] [CrossRef]
  47. Lindkvist, L. Project organization: Exploring its adaptation properties. Int. J. Proj. Manag. 2008, 26, 13–20. [Google Scholar] [CrossRef]
  48. Sainaghi, R.; Phillips, P.; Zavarrone, E. Performance measurement in tourism firms: A content analytical meta-approach. Tour. Manag. 2017, 59, 36–56. [Google Scholar] [CrossRef]
  49. Quintana, T.A.; Gil, S.M.; Peral, P.P. How could traditional travel agencies improve their competitiveness and survive? A qualitative study in Spain. Tour. Manag. Perspect. 2016, 20, 98–108. [Google Scholar] [CrossRef]
  50. Bell, R.A.; Morrey, R.C. Increasing the efficiency of corporate travel management through macro benchmarking. J. Travel Res. 1995, 33, 11–20. [Google Scholar] [CrossRef]
  51. Köksal, C.D.; Aksu, A.A. Efficiency evaluation of a-group travel agencies with data envelopment analysis (DEA). A case study in the Antalya region, Turkey. Tour. Manag. 2007, 28, 830–834. [Google Scholar] [CrossRef]
  52. González-Rodriguez, M.R.; Sámper, R.M. An analysis of the efficiency of Spanish travel agencies. Electron. J. Appl. Stat. Anal. 2012, 5, 60–73. [Google Scholar]
  53. Barros, C.P.; Matias, A. Assessing the efficiency of travel agencies with a stochastic cost frontier: A Portuguese case study. Int. J. Tour. Res. 2006, 8, 367–379. [Google Scholar] [CrossRef]
  54. Sainaghi, R.; Phillips, P.; Corti, V. Measuring hotel performance: Using a balanced scorecard perspectives’ approach. Int. J. Hosp. Manag. 2013, 34, 150–159. [Google Scholar] [CrossRef]
  55. Dutescu, A.; Popa, A.F.; Ponorîca, A.G. Sustainability of the tourism industry, based on financial key performance indicators. Amfiteatru Econ. J. 2014, 16, 1048–1062. [Google Scholar]
  56. Phillips, P.A.; Louvieris, P. Performance measurement in the SME UK hospitality, tourism and leisure industry: A balanced scorecard perspective. J. Travel Res. 2005, 44, 201–211. [Google Scholar] [CrossRef]
  57. Kaplan, R.S.; Norton, D.P. The balanced scorecard: Measures that drive performance. Harv. Bus. Rev. 1992, 33, 72–79. [Google Scholar]
  58. Atkinson, H.; Brown, J.B. Rethinking performance measures: Assessing progress in UK hotels. Int. J. Contemp. Hosp. Manag. 2001, 13, 128–136. [Google Scholar] [CrossRef]
  59. Assaf, A.G.; Josiassen, A. Identifying and ranking determinants of tourism performance. A global investigation. J. Travel Res. 2012, 51, 388–399. [Google Scholar] [CrossRef]
  60. Zeydan, M.; Çolpan, C. A new decision support system for performance measurement using combined fuzzy TOPSIS/DEA approach. Int. J. Prod. Res. 2009, 47, 4327–4349. [Google Scholar] [CrossRef]
  61. Sofiyabadi, J.; Kolahi, B.; Valmohammadi, C. Key performance indicators measurement in service business: A fuzzy VIKOR approach. Total Qual. Manag. Bus. Excell. 2015, 27, 1028–1042. [Google Scholar] [CrossRef]
  62. Grigoroudis, E.; Orfanoudaki, E.; Zopounidis, C. Strategic performance measurement in a healthcare organisation: A multiple criteria approach based on balanced scorecard. Omega 2012, 40, 104–119. [Google Scholar] [CrossRef]
  63. Lin, C.T.; Lee, C.; Chen, W.Y. Using fuzzy analytic hierarchy process to evaluate service performance of a travel intermediary. Serv. Ind. J. 2009, 29, 281–296. [Google Scholar] [CrossRef]
  64. Dweiri, F.T.; Kablan, M.M. Using fuzzy decision making for the evaluation of the project management internal efficiency. Decis. Support Syst. 2006, 42, 712–726. [Google Scholar] [CrossRef]
  65. Carlsson, C.; Fullér, R.; Heikkilä, M.; Majlender, P. A fuzzy approach to R&D project portfolio selection. Int. J. Approx. Reason. 2007, 44, 93–105. [Google Scholar] [CrossRef] [Green Version]
  66. Pérez, F.; Gómez, T.; Caballero, R.; Liern, V. Project portfolio selection and planning with fuzzy constraints. Technol. Forecast. Soc. Chang. 2018, 131, 117–129. [Google Scholar] [CrossRef]
  67. Yao, Y.; Cao, Y. A neural network enhanced hidden Markov model for tourism demand forecasting. Appl. Soft Comput. 2020, 94, 106465. [Google Scholar] [CrossRef]
  68. Anasari, R. Expectation of tourism demand in iraq by using artificial neural network. Int. J. Soc. Sci. Res. Rev. 2019, 2, 1–7. [Google Scholar] [CrossRef]
  69. Kulshrestha, A.; Krishnaswamy, V.; Sharma, M. Bayesian BILSTM approach for tourism demand forecasting. Ann. Tour. Res. 2020, 83, 102925. [Google Scholar] [CrossRef]
  70. Phillips, P.; Zigan, K.; Silva, M.M.S.; Schegg, R. The interactive effects of online reviews on the determinants of Swiss hotel performance: A neural network analysis. Tour. Manag. 2015, 50, 130–141. [Google Scholar] [CrossRef]
  71. Assaf, A.; Tsionas, M.G.; Gillen, D. Measuring firm performance: Differentiating between uncontrollable and controllable bad outputs. Tour. Manag. 2020, 80, 104107. [Google Scholar] [CrossRef]
Figure 1. Controlling system.
Sustainability 13 09602 g001
Figure 2. Applied KPIs.
Sustainability 13 09602 g002
Figure 3. Fuzzy function.
Sustainability 13 09602 g003
Table 1. Data table of KPIs of project portfolios.
Project Portfolio 1.Project Portfolio 2.
KPIsST1.AST1.BST2.ST3.AST3.BST3.CST1.AST1.BST2.ST3.AST3.BST3.C
1.4.629.771.304.629.770.754.139.511.344.139.511.01
2.5.0317.312.043.5212.120.674.7317.252.093.3112.081.47
3.−1.876.16−2.21−1.123.70−0.67−1.515.59−1.38−0.913.35−1.05
4.−2.67−3.39−2.92−2.67−3.39−1.15−5.73−2.41−2.64−5.73−2.41−1.34
5.1.9211.790.921.549.430.053.6112.220.452.899.780.46
6.8.3611.651.085.026.990.306.4911.412.273.896.850.24
7.12.268.080.209.816.460.138.939.070.757.147.260.23
8.4.855.13−5.002.913.08−2.498.035.19−2.364.823.11−3.69
9.−3.584.380.45−2.513.070.24−1.564.800.66−1.093.360.45
10.−1.77−0.950.61−1.77−0.951.37−0.78−0.960.48−0.78−0.961.45
11.6.678.501.024.005.104.195.028.411.323.015.056.13
12.1.565.52−1.001.093.86−0.122.615.97−0.221.834.18−0.24
13.−0.70−3.68−10.30−0.49−2.580.32−0.26−4.11−9.21−0.18−2.880.33
14.−0.4825.074.104.1017.550.26−3.7618.776.14−2.6313.140.89
15.0.3420.493.490.3420.49−2.45−0.5719.728.20−0.5719.72−1.64
16.−5.7822.738.84−3.4713.643.00−3.4221.8810.24−2.0513.134.03
17.2.6410.09−3.591.586.05−0.793.2610.52−3.471.966.31−1.18
18.−1.764.91−3.95−1.413.93−0.82−0.135.42−1.42−0.104.34−1.28
19.−4.74−1.94−3.57−2.84−1.16−0.72−3.31−1.22−1.78−1.99−0.73−1.04
20.4.9329.282.074.9329.282.415.6629.101.905.6629.103.40
21.−4.90−4.21−1.66−3.92−3.37−0.29−2.10−4.05−3.42−1.68−3.24−0.28
22.5.474.910.143.563.190.753.375.710.172.193.711.10
23.0.196.15−2.740.154.92−0.632.425.74−2.511.944.59−1.18
24.13.247.005.9813.247.004.2014.7212.096.3114.7212.095.19
25.0.0014.701.210.009.560.83−1.0914.631.21−0.719.511.14
Project Portfolio 3.
KPIsST1.AST1.BST2.ST3.AST3.BST3.C
1.5.849.911.085.849.910.98
2.6.3318.251.104.4312.781.04
3.1.415.59−5.610.853.35−0.88
4.−4.65−3.26−1.22−4.65−3.26−1.04
5.3.6611.771.422.939.420.31
6.7.6212.002.064.577.200.10
7.10.759.721.088.607.780.22Very underperforming:
8.3.645.75−6.532.183.45−2.43Not acceptable:
9.−0.505.122.36−0.353.580.28Acceptable:
10.−0.06−0.980.75−0.06−0.980.96Appropriate:
11.5.859.177.843.515.504.19Distinguished:
12.2.246.08−1.001.574.26−0.28
13.−2.51−3.48−7.59−1.76−2.440.12
14.−1.0623.722.63−0.7416.60−0.12
15.−3.2620.315.63−3.2620.31−2.79
16.−4.1714.479.75−2.508.684.58
17.1.9510.45−5.321.176.27−0.62
18.−1.545.16−4.75−1.234.13−0.69ST1.A = ST1. 2019 (%)
19.−2.93−1.45−3.57−1.76−0.87−0.71ST1.B = ST1. 2020 (%)
20.4.5728.824.314.5728.822.32ST2. = ST2. 2019–2020 (%)
21.−5.87−4.58−4.69−4.70−3.66−0.53ST3.A = ST3. 2019 (%)
22.6.055.760.413.933.740.88ST3.B = ST3. 2020 (%)
23.1.526.01−6.681.224.81−0.69ST3.C = ST3. 2019–2020 (%)
24.12.2511.731.9612.2511.734.65
25.−1.6915.591.36−1.1010.130.73
Table 2. Data table of KPIs.
Aggregated Key Performance Indicators
KPIsST1.AST1.BST2.ST3.AST3.BST3.C
1.3.978.091.073.978.091.07
2.4.4014.641.523.0810.251.07
3.−0.654.80−2.59−0.392.88−1.56
4.−3.78−2.46−1.86−3.78−2.46−1.86
5.2.629.970.832.097.980.66
6.6.139.721.473.685.830.88Very underperforming:      
7.8.697.480.586.955.980.47Not acceptable:
8.4.884.45−3.852.932.67−2.31Acceptable:
9.−1.533.980.97−1.072.780.68Appropriate:
10.−0.72−0.800.44−0.72−0.800.44Distinguished:
11.4.797.212.842.874.331.70
12.1.844.90−0.651.293.43−0.45
13.−0.86−3.17−7.57−0.60−2.22−5.30
14.−1.5319.083.57−1.0713.352.50
15.−1.1717.145.01−1.1717.145.01
16.−3.7116.338.21−2.239.804.93
17.2.268.65−3.421.355.19−2.05ST1.A = ST1. 2019 (%)
18.−0.844.33−2.79−0.673.46−2.24ST1.B = ST1. 2020 (%)
19.−3.02−1.25−2.48−1.81−0.75−1.49ST2. = ST2. 2019–2020 (%)
20.4.2824.242.294.2824.242.29ST3.A = ST3. 2019 (%)
21.−3.33−3.55−2.76−2.66−2.84−2.21ST3.B = ST3. 2020 (%)
22.3.964.580.222.572.980.14ST3.C = ST3. 2019–2020 (%)
23.1.264.95−3.331.013.96−2.67
24.11.348.973.8411.348.973.84
25.−0.7912.451.03−0.518.090.67
Table 3. Data table of BSC.
Balanced Scorecard Perspectives
Weights
(points)
ST1.AST1.BST2.ST3.AST3.BST3.C
Financial1.001.445.430.261.445.430.26
Learning and growth0.802.043.060.521.632.450.42
Internal business0.90−0.737.792.86−0.667.012.58
Customer0.852.036.380.591.735.420.50
 
Very underperforming:
Not acceptable:
Acceptable:
Appropriate:
Distinguished:
 
ST1.A = ST1. 2019 (%)
ST1.B = ST1. 2020 (%)
ST2. = ST2. 2019–2020 (%)
ST3.A = ST3. 2019 (%)
ST3.B = ST3. 2020 (%)
ST3.C = ST3. 2019–2020 (%)
Table 4. Strategic performance index.
Strategy
ST1A.ST1.BST2.
Strategy index1.045.080.94
 
Very underperforming:
Not acceptable:
Acceptable:
Appropriate:
Distinguished:
 
ST1.A = ST1. 2019 (%)
ST1.B = ST1. 2020 (%)
ST2. = ST2. 2019–2020 (%)
Publisher’s Note: MDPI stays neutral with regard to jurisdictional claims in published maps and institutional affiliations.

