Abstract
Users’ payment behaviors have changed. The diffusion of mobile devices makes people suitable for proximity mobile payment (PMP) services without traditional payment. Existing mobile payment literature mainly focuses on the adoption and continuous usage behavior. Nevertheless, switching behavior on payment has received little attention, especially on why people switch from traditional payment to PMP. Thus, the purpose of this study is to investigate factors influencing users’ traditional payment–PMP switching to comprehend how these factors shape switching intention. To that end, we developed a traditional payment–PMP transition model based on the push–pull–mooring framework derived from migration theory. This study conducted a structural equation modeling analysis on 311 valid data. The findings indicated that a push factor drives users away from traditional payment in terms of dissatisfaction. The pull factors, including perceived substitutability and perceived usefulness, attract users to PMP. Furthermore, a positive mooring factor facilitates users’ switching intention to PMP in terms of perceived technical compatibility. The negative mooring factor, in terms of perceived risk, hinders users’ switching intention. However, another pull factor—perceived ease of use—failed to influence switching intention significantly. This study found some distinctions between mobile payment switching and mobile payment adoption. These findings provide pivotal insights for mobile payment service providers.
1. Introduction
Coronavirus disease 2019 (COVID-19) broke out in December 2019 and has since spread worldwide, leading to an ongoing pandemic. Globally, as of August 2021, there have been 203,295,170 confirmed cases of COVID-19, including 4,303,515 deaths, reported by the World Health Organization (WHO) [1]. Since COVID-19 spreads mainly between people in close contact with each other, reducing contact among people and maintain a physical distance of at least 1 m from others was highly recommended by the WHO [2]. In this sense, COVID-19 has accelerated the shift from traditional payment to proximity mobile payments (PMP) with contactless features. Traditional payment refers to payments for products, services, and bills via cash, credit cards, debit cards, or cheques. PMP means “mobile payments in which the payer and the payee are in the same location and where the communication between their devices takes place through a proximity technology, such as Near Field Communication, Quick Response codes, Bluetooth technology, etc.” [3]. Compared with traditional payment, the primary superiority of PMP is ubiquity. In other words, an individual can complete the payment at anytime and anywhere through mobile networks. The convenience and transaction speed have guaranteed both merchants and individual users benefit from considerable time decrease, with obvious productivity gains [4].
The usage of traditional payment has significantly decreased, and PMP usage has increased considerably during the COVID-19 pandemic. According to McKinsey & Company [5], the shifts towards electronic commerce, digital payments (including contactless), instant payments, and cash displacement were all significantly boosted in the first half of 2020 [5]. The number of PMP users was 0.95 billion worldwide in 2019 and is estimated to exceed 1 billion in 2020 [6]. In South Korea, about 37% of smartphone users have made a PMP transaction in the previous six months [7], up from 31% in 2018 [8]. In terms of total transactions by volume, cash usage in South Korea has declined from 66% in 2010 to 34% in 2020 [5]. The rapid development of PMP, on the other hand, makes the competition fiercer, as more and more businesses such as telecom operators, banks, smartphone manufacturers, and social media platforms are involved in the financial ecosystems [9]. Users tend to adopt a PMP platform with many existing users, making the larger platform larger and the smaller one smaller. It is necessary to implement comprehensive plans from a PMP sustainability perspective to facilitate the healthy and sustainable development of PMP during the COVID-19 pandemic.
In the previous mobile payment literature, researchers mainly focused on users’ adoption intention [4,10,11] and continuous usage intention [12,13,14]. Nevertheless, switching behavior on payment received little attention, especially on why people switch from traditional payment to PMP. The switching phase is different from the adoption phase. Generally, users stop using or reduce the incumbent product or service usage significantly in the switching phase and potentially migrate to an alternative. It is not reasonable to discuss switching behavior from a continuous versus discontinuous perspective because these two behaviors may exist in parallel [15]. Switching is usually considered post-adoption behavior [15], involving continuous usage and switching behavior. Individual users’ switching is a complex decision. Users’ decision to switch from the incumbent (traditional payment, in this study) to an alternative service (PMP) involves the evaluation of both services [16]. From a single mobile payment perspective, prior studies have consistently employed variables to explain mobile payment’s adoption intention and continuous usage intention. However, why some people terminate or reduce the use of traditional payment and switch to PMP in a certain period is still unknown. Therefore, the purpose of this study is to investigate factors that influence users’ intention to switch from traditional payment to PMP and comprehend how these factors shape their switching intention during the COVID-19 pandemic.
This study develops a traditional payment–PMP transition model based on the migration theory [17] and the push–pull–mooring (PPM) framework [18] to serve the research purpose. Migration theory was introduced to understand users’ movement from an originating place to a destination during a particular time [17]. Theoretically, it emphasizes the need to look beyond a single product or service perspective when conducting a study. The findings could help further understand the implications of mobile payment beyond this optimistic situation. A comprehensive understanding of switching is necessary to notify mobile payment service providers of users’ attitudes towards traditional payment and PMP and optimize strategies for making the business more successful.
2. Theoretical Background
2.1. Switching Research
According to Bansal et al. [18], the switch should have some permanence or a particular time to distinguish it from spatial mobiles, such as business trips or holidays. In other words, business trips or holidays cannot be considered a switching behavior. However, the specific time for a move to be considered switching is hard to define [18]. Nevertheless, switching is classified as complete switching and partial switching [16]. Complete switching means the abandonment of an incumbent product or service [19]. Partial switching implies that individuals use an alternative product or service without terminating the old one [20]. Ye et al. [15] argued that although the term “switching” may indicate completely abandoning the incumbent product or service usage, concurrent usage of both incumbent and alternative products or services is often possible, and sometimes it is necessary. Accordingly, we defined “switching intention” as users’ willingness to switch to PMP with or without completely terminating traditional payment in a certain period [20].
Switching has been examined in personal technology products, social networking sites, offline and online services, healthcare services, and mobile services. Table 1 gives factors of switching and specific context. Through the table, three key patterns can be concluded. First, users’ switching intention is relevant to their perceptions of the incumbent product or service (push factor), such as dissatisfaction with its usage. It is also relevant to the alternative product or service (pull factor), such as alternative attractiveness. Second, security and privacy issues related to innovation may also influence switching. Third, factors influencing switching differ across research contexts. This study seeks to examine users’ traditional payment–PMP transition using the PPM framework.

Table 1.
Factors of switching.
2.2. PPM Framework and the Migration Theory
Migration theory is derived from “Laws of Migration” [28]. Migration means a human being’s movement between two places at a certain time. Migration may occur within the country (internal migration) or across countries (international migration) [17]. Jackson [29] distinguished between temporary and permanent migration, as well as voluntary and involuntary migration. Temporary migrants return to the originating place after migrating. However, permanent migrants do not. Voluntary migrants determine when to migrate without external constraints. Involuntary migrants have to migrate due to war and persecution constraints. For the case of this research, investigating factors influencing voluntary migration has theoretical and practical implications.
Migration and switching can be used interchangeably. According to migration theory, switching is influenced by negative factors at the originating location, positive factors at the destination [17], and intervening factors that may facilitate or inhibit such switching [29]. A unifying PPM framework was built based on migration theory by Bansal et al. [18] for understanding individual users’ service switching behavior. Push factors mean that negative effects at the originating location discourage people from staying. Pull factors mean that there are positive destination effects that act to attract people to the destination. Mooring factors are situational and personal effects that act to either promote or inhibit such switching behavior.
Generally, push and pull effects are symmetrical [30]. The fundamental differences between push and pull effects depend on their properties or characteristics of the incumbent and alternative products or services [31]. The PPM framework derived from migration theory has been verified to be a dominant theoretical reference for switching research and has been applied to several contexts [24,31]. The advantages of considering both incumbent and alternative services and capturing distinct characteristics of the research context have made it a useful theory to further understand users’ switching behavior.
2.3. Mobile Payment Research
As Lee [17] stated, specific factors that drive switching have hardly been identified because countless factors attract or hamper people. These factors are barely understood accurately by the social scientist or by the migrants themselves. Thus, Lee [17] suggested researchers set forth a few important factors and note a large group’s average reaction.
Bhattacherjee and Park [24] complimented migration theory and described it as a “theoretic bridge.” This bridge connects post-adoption and IT adoption research, rather than studying them separately in the literature. To the best of our knowledge, there is still a lack of research on mobile payment switching behavior in the existing literature. Thus, this study identifies essential factors from post-adoption and mobile payment adoption literature.
Prior research on mobile payment has applied innovation acceptance theories heavily. For example, the Technology Acceptance Model (TAM) [32], the Theory of Reasoned Action [33], the Diffusion of Innovations model [34], and their extensions have been applied so far. TAM holds that individuals’ attitudes towards accepting an innovation are perceived usefulness (PUF) and ease of use (PEU). The theory of Reasoned Action argues that individuals’ subjective norms and attitudes towards innovation determine adoption intention. Rogers [34] incorporated five variables into the Diffusion of Innovations model to explain individuals’ innovation adoption intention. Complexity, compatibility, and relative advantage were significant to individuals’ acceptance decisions among these five factors.
Tan et al. [35] added four additional constructs to TAM—social influence, perceived financial cost, perceived risk, and personal innovativeness—to examine mobile credit cards as another form of mobile payment in Malaysia. Hassan et al. [36] extended TAM with two additional variables—perceived compatibility and social norm to examine the factors influencing mobile payment adoption in Nigeria. In addition, de Luna et al. [9] established a TAM-based model and compared three innovative mobile payment systems in Spain. Kim et al. [37] also developed a mobile payment research model based on TAM. They argued that individual users’ mobile payment adoption decisions are influenced by factors other than mobile payment characteristics. As a result, for the first time, they carefully explored the effects of individual differences.
Yang et al. [11] reviewed the literature to determine the factors influencing mobile payment adoption using the valence framework and Diffusion of Innovations model. They found that compatibility exerted a more substantial influence on adoption intention in the positive valence than a relative advantage. In the negative valence, perceived risk negatively influenced adoption intention. They also compared pre-adoption and post-adoption and found that the effects on adoption intention differ across different stages. Lu et al. [38] built a mobile payment decision-making model based on the valence framework. They found that the Diffusion of Innovations model factor of compatibility exerted the most significant impact on behavioral intention in the positive valence. In the negative valence, perceived risk was the most critical factor. Oliveira et al. [4] created a research model to explore users’ mobile payment adoption intention. Among nine drivers, compatibility exerted the most considerable influence.
Given the importance of post-adoption usage to innovation service providers’ success, numerous studies have focused on determining continuous usage behavior factors. The expectation–confirmation model was introduced by Bhattacherjee to understand individuals’ continuous or discontinuous usage intention of innovation [39]. He found that satisfaction and PUF are the determinants of continuous usage intention, and satisfaction is affected by confirmation and PUF. The model is widely employed in mobile services [40,41,42] and mobile payment context [14]. Nowadays, it has become a practical theory for post-adoption research [40,41].
Overall, the studies mentioned above have provided valuable insights into factors influencing acceptance and continuous usage of mobile payment. PUF, PEU, compatibility, and perceived risk are the most significant variables for mobile payment adoption intention. However, most prior research considered mobile payment from an adoption or continued usage intention perspective but neglected users’ switching intention. Sustainability can be achieved based on innovation [43]. However, in mobile payment context, sustainability and competitiveness depend on users’ needs and wants, and ultimately depend on users’ selection. Therefore, there is a need to better understand users’ traditional payment–PMP switching mechanism to provide a reference for formulating a sustainable development strategy of mobile payment. Given the comprehensiveness of the migration theory, this study adopts migration theory to explore factors impacting users’ switching intention.
3. Hypothesis Development
Figure 1 displays the research model. First of all, dissatisfaction, a primary factor in post-adoption research, was selected as a push factor. Second, pull factors included PUF and PEU. In addition, perceived substitutability was also included as a pull factor in this study. Perceived substitutability was introduced in the mass communication area to explore whether a new medium can substitute for the old one [44]. Whenever a new media has appeared in the market, the latest market has coexisted with the traditional market [45]. This also holds in the payment market. The PMP market coexists with the traditional payment market. The first step in determining how a new product or service affects the use of an existing one is to determine whether users consider the new one to be interchangeable with the existing one [46]. Lastly, the mooring factors were perceived technical compatibility and perceived risk. These factors either facilitate or hinder users’ switching intention. This study also incorporated the control variables of self-efficacy, gender, age, length of use, and occupation into the research model. Such an understanding is expected to enhance payment service providers’ knowledge of users’ payment switching behavior, hence helping them develop their businesses sustainably.
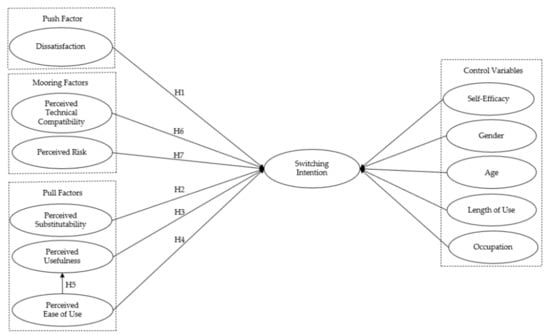
Figure 1.
Research model.
3.1. Push Factor
Push factors are traditional payment factors that discourage a user from using traditional payment [18]. In the post-adoption phase, the discontinuous intention of the incumbent product or service is primarily relevant to users’ dissatisfaction with the product or service [39,47]. This study defined dissatisfaction as reflecting users’ overall evaluation of their prior experience using the traditional payment.
McKinsey & Company [5] reported that COVID-19 has accelerated the displacement of cash payments and estimated that COVID-19 would likely lead to a further decline of cash usage. According to Wolman [48], cash has several drawbacks. First of all, numerous microorganisms exist on cash, such as bacteria, viruses, parasites, etc., which are the main approaches to disseminating disease. Second, there is a security problem for cash, such as robbery and cheating issues. Third, the social cost of cash is too much because the average lifetime is short, and the administrative expense is high. Users need to make a change when using cash, and it takes much more time than PMP transactions. People who require real-time action and prompt transactions [49] will not be satisfied with cash payments. In terms of bank cards, users need to carry all the cards with them if any card could be useful, and they need to manage the security of the cards. The constraints of cash and bank cards lead to low confirmation among users, which causes dissatisfaction and discontinuous usage intention. Users are likely to be dissatisfied and switch to a PMP service if they have a poor experience using traditional payment.
Dissatisfaction plays a pivotal role in service switching research. Bansal et al. [18] recognized that dissatisfaction was a primary push factor for users switching to another service provider. Chang et al. [23] empirically verified that dissatisfaction with a current service positively influenced users’ switching intention to another service. Ye et al. [15] examined factors influencing users’ post-adoption switching behavior between IT products in the technology switching context. They found that satisfaction of the incumbent IT negatively related to switching behavior. The results of Bhattacherjee and Park [24] demonstrated that dissatisfaction with incumbent technology was a determinant for end-users to discontinue using the technology. Therefore, following a similar vein, we hypothesized that:
Hypothesis 1.
Dissatisfaction positively influences switching intention.
3.2. Pull Factors
Pull factors refer to PMP effects that attract a user to using PMP [18]. Perceived substitutability means that users adopt a new medium over a traditional one. The new medium has functional similarity and functional desirability over the traditional one to satisfy users’ specific needs [50,51]. Functional desirability is associated with characteristics that emphasize desirable features and premium contents [44]. Though widely used in the mass communication context, perceived substitutability offers valuable insights into the payment context because of users’ congruence facing electronic commerce systems [52] and mobile commerce systems. Perceived substitutability is thus defined as to what extent users perceived that PMP is more functionally desirable than traditional payment in satisfying their specific needs [44].
PMP has a fundamental functional similarity with traditional payment in that both enable users to make an in-store transaction. PMP, in many cases, has desirable functions or features over traditional payment. PMP’s fast speed and convenient usage allow people to save transaction time [53]. Users can access the PMP platform anytime and anywhere [3]. Some functions may gratify users’ economic benefit needs. For instance, Kakaopay from KakaoTalk, a leader in Korea’s mobile instant messaging application market, enables users to scan barcodes and earn points from various brands [54]. Samsung Pay offers a cashback feature, including bonus Samsung account points and vouchers with many participating retailers [55]. As users get access to and become familiar with the multi-functions and advantages of PMP relative to traditional payment, they may perceive that PMP can gratify their specific needs, such as transaction convenience, mobility and ubiquity, and economic benefits. These, in turn, will increase their intention to switch to PMP.
Prior studies have adopted perceived substitutability as the primary driver of switching intention. Li [56] examined individuals’ switching intention antecedents between in-store membership cards and mobile branded apps. The results indicated that perceived substitutability is a vital determinant of switching intention. Potential adopters are more likely to perceive a superiority of innovation if they obtain the efficiency, convenience, economic benefits, or even image enhancement benefits [34]. Individuals’ willingness to substitute is positively correlated with the benefits they expect from the alternative services. Alternatively, in the marketing context, Childers et al. [57] and Dennism et al. [58] consistently found that substitutability influenced purchase intention. Based on prior literature, it is reasonable to hypothesize that perceived substitutability may enhance users’ intention to switch to PMP.
Distinguishing push and pull effects depend on their properties and pertinence to the incumbent or alternative product or service [30,31]. Perceived substitutability emphasizes the functional desirability of PMP over traditional payment. Hence, this construct is a positive pull factor to attract users to use PMP. Notably, this study aims not to investigate whether PMP can substitute for traditional payment, but rather to identify the extent to which users perceive substitutability between two payment services. This may provide insights into the importance of PMP functions in gratifying users’ needs:
Hypothesis 2.
Perceived substitutability positively influences switching intention.
By examining mobile payment adoption intention research, the most consistent predictors of mobile payment adoption intention are PUF and PEU [9,11,35]. In this study, PUF means the degree to which prospective users believe that their transaction performance would be improved by using PMP [32]. The feature of a contactless payment system such as PMP justifies utilitarian value and usefulness benefits [59]. Such benefits include combining bank cards and loyalty cards with mobile devices, shopping without physical wallets, tracking expenses, and increasing transaction convenience. PEU means the degree to which prospective users believe that PMP is easy to use [32]. Under users’ context, the willingness to accept an innovation is highly correlated to its complexity [60]—the more complex, the lower the willingness to adopt the innovation. The characteristic of ease to use can dramatically increase users’ switching intention to the innovation.
Both PUF and PEU have been regarded as antecedents of adoption intention under a mobile payment context. Karjaluoto et al. [59] explored predictors impacting users’ usage intention toward contactless payment systems. They found that performance expectancy (PUF) and effort expectancy (PEU) positively and significantly influence use intention. Khalilzadeh et al. [61] investigated the factors of NFC payment acceptance intention in the restaurant industry. They found that performance expectancy (PUF) exerted a stronger impact on use intention than effort expectancy (PEU). PEU has been proved to affect PUF significantly [36,62,63]
In addition, both constructs have been verified as influential pull factors on users’ switching intention. Ye and Potter [16] found that PUF, PEU, and perceived relative security served as the main pull factors of users’ switching intention between two substitute IT products. The study conducted by Hsieh et al. [21] confirmed that usefulness significantly affected bloggers’ switching intention among online services. Cheng et al. [64] also found the predictive ability of usefulness to be the main pull factor on users’ switching intention. Accordingly:
Hypothesis 3.
PUF positively influences switching intention.
Hypothesis 4.
PEU positively influences switching intention.
Hypothesis 5.
PEU positively influences PUF.
3.3. Mooring Factors
Mooring factors are situational and personal effects that may promote or hinder users’ switching intention to PMP [65]. Mobile payment adoption intention literature has confirmed perceived compatibility and perceived risk as important determinants of users’ adoption intention. The operationalization of compatibility has a much broader connotation, and the construct is inconsistent across studies [66]. Table 2 presents the dimensions and conceptual and operational definitions of compatibility. Researchers consistently capture two motivations through different dimensions and operations: intrinsic motivations by compatibility [67] and extrinsic motivations by compatibility [66]. Intrinsic motivations are derived from compatibility with users’ value and style, whereas extrinsic motivations are derived from compatibility with existing work practices, prior experience, or optimal functionalities. According to Table 2, there are perceived lifestyle compatibility and perceived technical compatibility dimensions [64]. However, prior studies have focused on compatibility from a lifestyle perspective in the mobile services context [4,11,68], whereas they have overlooked perceived technical compatibility. Perceived technical compatibility refers to the degree of compatibility of the PMP with users’ mobile devices, apps, and operating systems (OSs) [64].
Table 2.
Summary of prior studies on compatibility: Dimensions, and conceptual and operational definitions.
To complete a satisfactory transaction, users’ mobile devices, OSs, and apps should be integrated with PMP services. For example, NFC payment service providers need to ensure users’ transaction information is sent out through NFC technology to the server, bank card company, POS machine, and value-added network. Code scanning service providers need to ensure the payment apps are available to users’ mobile device OSs. Simultaneously, they need to make sure there are no compatibility problems, such as problems with the payment app crashing or halting when using, or problems with jumping between the payment app and other apps. Thus, perceived compatibility is considered the main factor of switching intention in this study.
Prior studies have confirmed the positive effect on behavioral intention [4,11,38]. In addition, Cheng et al. [64] examined antecedents that could influence users’ intention to switch to mobile personal cloud storage services. Their research indicated that perceived technical compatibility served as a significant factor in switching intention. The more comfortable an innovation integrates with existing innovation, the greater the possibilities of recognizing the benefits [69].
Perceived technical compatibility is regarded as an extrinsic motivation by compatibility in this study. It refers to PMP service providers’ ability to ensure the compatibility of their services. Service providers’ abilities are usually considered as a situational factor [24]. Hence, this construct should represent a positive mooring factor to facilitate users to switch to PMP:
Hypothesis 6.
Perceived technical compatibility positively influences switching intention.
Perceived risk theory [72] holds that users may generate risk beliefs about innovation-based service when using it. Perceived risk means the degree of possible loss of money and private information when pursuing a satisfying outcome of using PMP [72]. Risk beliefs about mobile payment services include loss of funds belief and personal information leakage belief [73]. Users’ risk beliefs towards mobile payment are expected to be high because they cannot evaluate the services due to the intangibility features [74]. Therefore, perceived risk is considered the most considerable inhibitor for using this service [75].
Personal information leakage includes name, phone number, home address, and resident registration number. It also involves detailed information, including income, payment account, car ownership, and financial information (e.g., payment data, credit rating) [76]. Financial and privacy risks can occur either by payment POS or outsourcing companies, hacking, and internal employees [76]. Privacy issues are significant barriers for Korean users to accept mobile payment services [76]. If the service providers cannot operate a secure system and protect users’ financial and private information from leaking, their intention to adopt PMP will decrease. Many prior studies have validated this assumption. For example, Koenig-Lewis et al. [77] examined mobile payment adoption and indicated that perceived risk negatively affects usage intention. Consistent with Koenig-Lewis et al. [77], Karjaluoto et al. [59] also confirmed that perceived risk was the main barrier toward adopting contactless payment systems.
Notably, perceived risk in this study emphasizes mobile payment service providers’ ability to decrease users’ risk concerns rather than mobile payment characteristics. Similarly, service providers’ abilities are usually regarded as situational factors [24]. Thus, this construct is a negative mooring factor that prevents users from switching to PMP:
Hypothesis 7.
Perceived risk negatively influences switching intention.
3.4. Control Variable: Self-Efficacy, Gender, Age, Length of Use, and Occupation
In the innovation literature, other predictors may also influence users’ switching intention. For example, perceived behavioral control is proven to impact users’ intention [78]. It reflects the degree of perceived ease or complexity to perform a target behavior. Perceived behavioral control includes internal control and external control [79]. The former is alternatively regarded as self-efficacy, meaning how well a person can perform various actions required to manage prospective situations [80]. Ajzen [79] stated that internal control mainly influences intention. Therefore, this study included self-efficacy as a control variable. Demographic variables, including gender, age, length of use, and occupation that may affect switching intention, were also involved in the research model.
4. Research Methodology
4.1. Measurements of Constructs
In a pilot test, 54 university students were invited through the Internet to acquire feedback on the instruments’ validity and reliability. According to their feedback on the instruments, some instruments were modified. For instance, one of the instruments of switching intention was changed from “I am willing to switch from traditional payment to PMP in a physical store in the near future” to “Rate the possibility of you switching from traditional payment to proximity mobile payment in a physical store in the near future.” Four items were eliminated after the pilot test because of low factor loadings. Finally, 32 items were retained and were measured using a seven-point Likert scale, with 1 representing “Strongly disagree” and 7 representing “Strongly agree.” All measurement instruments for the constructs were adopted and adapted from prior studies. The measurement items and sources are shown in Appendix A in detail.
4.2. Data Collection and Descriptive Analysis
This study mainly focused on the case of South Korea, and the reasons are twofold: (1) The usage ratio of bank cards was high (66.2%) in South Korea’s offline payment market [81]. However, PMP usage was facilitated largely after the outbreak of COVID-19, indicating that South Korea is in the switching period; (2) South Korea did not adopt lockdown prevention measures, and PMP is always available in the offline market. According to Kim et al. [82], South Korea avoided severe long-term restrictions, such as lockdowns and business closures. South Korea prevented the spread of COVID-19 by developing clear guidelines for the public, conducting comprehensive testing and contact tracing [82]. Indeed, even after the outbreak of COVID-19, South Koreans still can go shopping, purchase products, and make a transaction in a physical store.
The analysis unit of this study was users who have used traditional payment and PMP in a physical store. To restrict the data to analysis respondents, only people with PMP usage experience in the past six months in a physical store were selected. According to Statista [83], in South Korea, 95.9% of mobile payment users are aged between 20 and 29 years old. Therefore, universities are the appropriate place. An online questionnaire was distributed to universities in Gyeongsangbuk-do, Korea, in April 2020. A total of 372 people participated in the survey, and 61 were removed due to (1) the respondents having no experience using PMP or having no experience using PMP in the past six months; (2) the answers given by the respondents being the same; (3) some of them being foreigners. This resulted in 311 usable questionnaires. The descriptive statistics of the respondents are presented in Table 3. A total of 59.2% were male, and approximately 89% had less than three years of experience using PMP.
Table 3.
Descriptive statistics of respondents.
A t-test verified that non-response bias was not a threat to our data. Following Armstrong et al. [84] and Xu et al. [85], this study compared the first 25% and the final 25% of responses and valid and invalid data to detect non-response bias. Table 4 shows the comparison t-test results.
Table 4.
Non-response bias analysis.
5. Results
5.1. Measurement Model
This study employed the covariance-based structural equation modeling (CB-SEM) method for the analysis. CB-SEM was deemed suitable for this research for three reasons: (1) Unlike variance-based path analytic techniques, CB-SEM provides multiple goodness-of-fit indices to assess whether the observed empirical data fit for a theoretical model [24]; (2) CB-SEM is available to assess the direct effects of independent variables on switching intention while simultaneously measuring the indirect effect of PEU on switching intention; and (3) unlike PLS-SEM, CB-SEM is more suitable for analyzing data with a large sample. Before analyzing, measurement items for dissatisfaction and perceived substitutability were reversed. Exploratory factor analysis (EFA), whose goal is to guarantee high loadings on respective constructs and low loadings on cross-loadings, was conducted. Factor loadings higher than 0.50 were obtained, and they loaded on separate constructs. Significant components that had eigenvalues over 1.0 were obtained.
Confirmatory factor analysis was conducted for the analysis of measurement model. As shown in Table 5, the normalized chi-square (χ2/df) was 1.696, the incremental fit index (IFI) was 0.962, the goodness-of-fit index (GFI) was 0.878, the comparative fit index (CFI) was 0.961, the normed fit index (NFI) was 0.911, and the root mean square error of approximation (RMSEA) was 0.047. Each value was within the threshold, thus suggesting a good model fit.
Table 5.
Results of model fit.
A good convergent validity should satisfy three conditions: First, factor loadings should surpass 0.50; second, composite reliability (C.R.) should exceed 0.70; and third, the average variance extracted (AVE) should surpass 0.50 [86]. Table 6 indicates that all three conditions were verified, and Cronbach’s alpha exceeded 0.70. Afterward, we tested the discriminant validity (see Table 7). The square root of the AVEs were higher than the correlation coefficients of the inter-construct, suggesting satisfactory discriminant validity.
Table 6.
Results of confirmatory factor analysis.
Table 7.
Inter-construct correlation coefficients.
Since this research was collected from a single source and used the self-report method, common method bias (CMB) could have become a potential issue. This study adopted four methods to assess whether CMB significantly attributed to the variance among the survey items. First, following Podsakoff et al. [87], this paper identified CMB using the common latent factor (CLF) method to ensure that the data did not have any multicollinearity issue. As shown in Table 8, the differences across all items’ standardized loadings were less than 0.2 for the sample, indicating that CMB was not likely to be at a significant level in our data. Second, Harman’s single-factor [87] was adopted. Our analysis generated eight factors and the largest factor captured 33% of the variance. Third, common method variable (CMV) method [88] was used.
Table 8.
Common latent factor test for common method bias.
Table 9 shows that the average substantive factor loadings were 0.774, whereas the average method-based factor loadings were 0.003. Finally, the correlational marker variable method recommended by Lindell and Whitney [89] was adopted. There should be no theoretical relationship with other scales for a marker variable. A proxy for method variance for a marker variable was also available. Therefore, age, a demographic variable in this study, was selected as a marker variable. This study adopted age to partial out the correlations caused by CMB.
Table 9.
Common method bias test.
Table 10 indicates that before adjustment, the correlation between the marker and dependent variables was not significant (0.011, p > 0.05), and all independent variables were highly correlated with the dependent variable. All significant correlations were still significant, and no significant differences were found between adjusted and unadjusted correlations. These analyses suggested that CMB was not a concern to our data.
Table 10.
Correlation coefficients between marker variable and main factors.
5.2. Structural Assessment
After establishing an eligible measurement model, we assessed a structural model. As shown in Table 5, the χ2/df was 1.714. The structural model (CFI was 0.952, IFI was 0.953, NFI was 0.894, GFI was 0.868, RMSEA was 0.048) fitted well with the data. Figure 2 and Table 11 summarize the research model and results of the hypotheses. Except for H4, all six of the other hypotheses were supported. Nevertheless, the results indicate that PEU indirectly influenced switching intention significantly (β = 0.294, p < 0.01). The control variable of self-efficacy also influenced switching intention significantly. Other control variables failed to impact switching intention significantly. Main determinants and control variables jointly explained 52.5% of the variance of switching intention. PEU explained 36% of the variance of PUF.
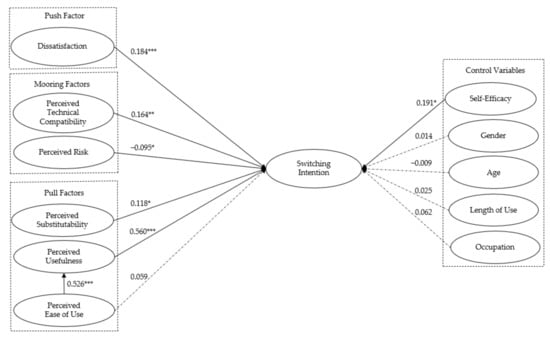
Figure 2.
Model test results. Note: * p < 0.05; ** p < 0.01; *** p < 0.001.
Table 11.
Hypothesis test results.
6. Conclusions and Discussion
6.1. Research Findings
This study investigated factors influencing users’ traditional payment–PMP switching to comprehend how these factors shape their switching intention. More specifically, this study measured how push, pull, and mooring factors affect university students’ switching intention from traditional payment to PMP in South Korea. Most hypotheses were supported. First, dissatisfaction with traditional payment, adopted as the main push factor, positively affected switching intention (β = 0.184, p < 0.001). Traditional payment (e.g., cash and bank cards) has several drawbacks and disadvantages, taking much more time than PMP. These constraints may lead university students to decrease their usage of traditional payment and potentially adopt PMP frequently. This finding is consistent with Lai and Wang [26], who demonstrated that dissatisfaction is a determinant of switching intention.
Second, the pull factors, perceived substitutability and PUF, positively affected switching intention. Specifically, PUF had the most substantial impact (β = 0.560, p < 0.001), followed by perceived substitutability (β = 0.118, p < 0.05). As measurements PUF 1 and PUF 2 indicated, students tend to adopt PMP if they believe the service is useful, convenient to use, and quick to complete a transaction. This finding agrees with Bhattacherjee and Park [24], who revealed that PUF created end-users’ intention to switch to cloud computing. PMP’s desirable functions make students perceive that PMP is a substitution service of traditional payment under an offline environment, thus enhancing their switching intention. Prior studies also found that substitutability between branded cards and mobile applications can increase consumers’ switch to mobile applications. Outside of our expectations, PEU had no significant impact on switching intention (β = 0.059, p > 0.05). The findings for the impact of PEU on mobile payment adoption have been mixed. For example, Kim et al. [37] found that PEU significantly and positively influenced intention to use mobile payment, whereas both Oliveira et al. [4] and Slade et al. [90] failed to detect a significant relationship between effort expectancy (PEU) and adoption intention. Alternatively, this study further examined the indirect effect of PEU on switching intention and found that the p-value was significant (β = 0.294, p < 0.01) (shown in Table 11). In addition, PEU was positively associated with PUF (β = 0.526, p < 0.001). Thus, in this study, the findings of PEU indicated that the degree of effort-free use of PMP could result in higher perceptions of usefulness in performing payment tasks and higher switching intention indirectly. However, it may not enhance the intention to switch to PMP directly (β = 0.059, p > 0.05).
Third, in terms of perceived technical compatibility, the mooring factors positively affected switching intention (β = 0.164, p < 0.01), whereas perceived risk negatively affected switching intention (β = −0.095, p < 0.05). The result of perceived technical compatibility is in line with Cheng et al. [64], who revealed that perceived technical compatibility is an important factor of users’ mobile cloud storage switching intention. The results of perceived risk indicated that students with strong concerns about personal information and monetary loss are reluctant to switch to PMP. This result follows Koenig-Lewis et al. [77], who claimed that a vital barrier for users to accept mobile payment is perceived risk.
6.2. Theoretical Implications
First, this study advances the knowledge of switching intention and mobile payment. Prior studies have consistently investigated users’ mobile payment adoption or continuous usage intention; however, switching behavior received little attention. Users’ switching decision involves the evaluation of incumbent services as well as alternative services. Unlike prior studies, we identified and empirically examined influencing factors of university students’ traditional payment–PMP transition from a switching perspective. The results revealed that university students’ switching intention correlated with alternative services (PMP) and was determined by incumbent services (traditional payment).
Second, this study extends the existing mobile payment research by applying the migration theory. Migration theory is like a “theoretic bridge.” This bridge links post-adoption and IT adoption research together, rather than studying them separately in the literature. We integrated post-adoption constructs with mobile payment adoption constructs into one proposed model based on migration theory.
Third, this study enriches the relationship between TAM, Diffusion of Innovation theory, and switching intention. Specifically, we found some distinctions between mobile payment switching and mobile payment adoption. Although both theories have been adopted extensively in users’ acceptance of specific innovation contexts, the roles in switching behavior have rarely been investigated. PEU, traditionally a dominant factor in mobile payment adoption research, was not significant to mobile payment switching research. However, PUF and dissatisfaction with traditional payment are more influential. These findings support the notion that regardless of the strong effect on initial adoption, ease of use cannot consistently explain post-adoption [39]. Thus, the results provide additional insights into mobile commerce research, especially into mobile payment research.
6.3. Managerial Implications
This study also has important contributions for PMP service providers. First, the results show that when university students are dissatisfied with traditional payment, their intentions to switch to PMP increase. For PMP service providers that would like to attract potential university students, they are recommended to conduct promotional campaigns that emphasize the advantages of PMP over traditional payment. Promotional campaigns can be implemented in universities and may focus on the contactless feature of PMP to reduce direct person-to-person contact, thereby reducing the risk of being infected during the COVID-19 pandemic.
Second, PMP service providers should focus on the PUF construct as the most significant factor in this study. As the measurement items of PUF indicated, university students are attracted to PMP because it can help them make a transaction quickly and effectively. Making PMP useful is crucial, at least from university students’ perspective. Therefore, service providers should continue to invest in R&D to enable university students to complete transactions faster. Additionally, to ensure the sustainable development of PMP during the COVID-19 pandemic, service providers should continue to innovate to make PMP more useful and easier to use, given that innovation is the basis of sustainability [43]. Furthermore, the measurement items of perceived substitutability suggest that service providers should continuously provide various services to distinguish PMP from traditional payment. They should also offer different services in different ways to gratify university students’ needs.
Finally, service providers are recommended to consider the role of perceived technical compatibility carefully. They should improve the compatibility of their services with university students’ mobile devices, including OSs and apps. Notably, students’ perception about technical compatibility depends not only on compatibility with their mobile devices but also on compatibility with merchants’ card readers. Therefore, to provide a satisfactory transaction experience, service providers should optimize their services to be compatible with card readers on the merchant side. Furthermore, though perceived risk had minimal effect on switching intention, there is a need for service providers to regularly upgrade their service technologies to advance the degree of security and decrease the possibility of being hacked. For example, service providers can alleviate students’ risk perceptions by delivering a message after upgrading the services and ensuring that they can safeguard their personal information and financial security.
6.4. Limitations
Although offering many contributions, this study has several limitations. First, samples of this study were restricted to university students in South Korea. The findings may be different across different groups. A comprehensive set of samples from different occupation groups and age groups are supposed to understand switching behaviors better. Second, we did not consider switching behavior as the main outcome. It is not essential for users to thoroughly terminate the usage of traditional payment after switching to PMP. A gradual migration period may exist, during which they try to accept the alternative services while concurrently use the incumbent services [23,27]. Third, future studies interested in perceived substitutability and perceived technical compatibility constructs can further improve their knowledge. For example, future studies may develop new items in detail, such as describing specific functions to satisfy users’ particular needs and compatibility between users and merchants.
Last but not least, this study focused on the migration stream, and as such, we did not consider a counter-stream. Since switching is a complex phenomenon, users may return to the incumbent services to re-evaluate the balance of positive and negative factors of both incumbent and alternative services [17]. Future studies are suggested to conduct counter-stream research that will likely provide new insights into literature and practice.
Author Contributions
Conceptualization, H.-L.M. and Y.-C.L.; methodology, H.-L.M. and Y.-C.L.; software, H.-L.M.; validation, H.-L.M. and Y.-C.L.; formal analysis, H.-L.M. and Y.-C.L.; investigation, H.-L.M.; data curation, H.-L.M. and Y.-C.L.; writing—original draft preparation, H.-L.M.; writing—review and editing, Y.-C.L.; visualization, H.-L.M. and Y.-C.L.; supervision, Y.-C.L. All authors have read and agreed to the published version of the manuscript.
Funding
This research received no external funding.
Data Availability Statement
The data presented in this study are available upon request from the corresponding author. Data are not publicly available due to confidentiality agreements with participants.
Conflicts of Interest
The authors declare no conflict of interest.
Appendix A
Table A1.
Questionnaire.
Table A1.
Questionnaire.
| Construct | Indicators | Mean | Items | Sources |
|---|---|---|---|---|
| Dissatisfaction | How do you feel about your overall experience using traditional payment (e.g., cash, bank cards) in a physical store? | [39] | ||
| DIS1 | 3.51 | Satisfied | ||
| DIS2 | 3.65 | Pleased | ||
| DIS3 | 3.66 | Contented | ||
| DIS4 | 3.75 | Delighted | ||
| Perceived technical compatibility | TCP1 | 5.16 | The proximity mobile payment (e.g., Samsung Pay, Kakao Pay) is compatible with my mobile device’s hardware (e.g., NFC, Bluetooth, camera). | [64] |
| TCP2 | 5.27 | The proximity mobile payment is compatible with my mobile device’s legacy operational system. | ||
| TCP3 | 5.49 | The proximity mobile payment is compatible with my mobile device’s applications. | ||
| Perceived risk | PER1 | 4.38 | I am worried that my data stored in my proximity mobile payment will be used by the proximity mobile payment provider without my authorization. | [64,73,91] |
| PER2 | 4.28 | I am worried that my data stored in my proximity mobile payment will be sold to some profit-seeking organizations without my authorization. | ||
| PER3 | 2.97 | I think it is risky to use the proximity mobile payment platform for transactions in a physical store. | ||
| PER4 | 2.72 | I think there will be monetary losses when using proximity mobile payment to pay in a physical store. | ||
| PER5 | 3.87 | I am worried that my proximity mobile payment provider does not implement security measures to protect my stored data. | ||
| PER6 | 3.69 | I am worried that my proximity mobile payment provider does not have effective mechanisms to ensure that my transaction data are protected from being altered or destroyed accidentally during transaction in a physical store. | ||
| Perceived substitutability | PSS1 | 4.49 | In a physical store, traditional payment offers the same services as the proximity mobile payment. | [92] |
| PSS2 | 4.22 | In a physical store, traditional payment offers services in the same way as the proximity mobile payment. | ||
| PSS3 | 4.26 | In a physical store, traditional payment satisfies the same needs as the proximity mobile payment. | ||
| Perceived usefulness | PUF1 | 5.21 | Proximity mobile payment allows to do my transactions more quickly in a physical store. | [32] |
| PUF2 | 5.31 | The use of the proximity mobile payment would improve my effectiveness in conducting my transactions in a physical store. | ||
| PUF3 | 5.46 | Using proximity mobile payment would make the handing of transactions easier in a physical store. | ||
| PUF4 | 5.47 | Overall, proximity mobile payment is useful. | ||
| Perceived ease of use | PEU1 | 5.59 | Learning to use proximity mobile payment in a physical store would be easy for me. | [32,93] |
| PEU2 | 5.70 | Using proximity mobile payment in a physical store is not challenging. | ||
| PEU3 | 5.56 | It would be easy to follow all the steps to use proximity mobile payment in a physical store. | ||
| PEU4 | 5.66 | Overall, I find proximity mobile payment to be easy to use. | ||
| Self-efficacy | SEF1 | 5.33 | If there was nobody to tell me what to do, I would be able to complete my payment using proximity mobile payment in a physical store. | [20] |
| SEF2 | 5.52 | If I had only the proximity mobile payment manuals for reference, I would be able to make a transaction using it in a physical store. | ||
| SEF3 | 5.51 | If I could call someone for help when needed, I could complete my payment using proximity mobile payment in a physical store. | ||
| SEF4 | 5.58 | If I have used a similar proximity mobile payment in the past, I could complete my payment using it in a physical store. | ||
| SEF5 | 5.59 | If someone showed me how to use it, I could complete my payment using proximity mobile payment in a physical store. | ||
| Switching intention | SWI1 | 5.21 | Please rate the possibility of you switching from traditional payment to proximity mobile payment in a physical store in the near future. (1 = Improbable…7 = Probable) | [18,19,22] |
| SWI2 | 5.54 | The possibility of me switching to proximity mobile payment in a physical store in the near future is high. | ||
| SWI3 | 5.40 | I intend to increase time on proximity mobile payment in a physical store in the near future. | ||
References
- World Health Organization. WHO Coronavirus (COVID-19) Dashboard. 2021. Available online: https://covid19.who.int/ (accessed on 10 August 2021).
- World Health Organization. How Is the COVID-19 Virus Transmitted? 2021. Available online: https://www.who.int/teams/risk-communication/covid-19-transmission-package (accessed on 2 June 2021).
- European Payments Council. Mobile Proximity Payments. Available online: https://www.europeanpaymentscouncil.eu/what-we-do/other-sepa-payments/sepa-goes-mobile/mobile-proximity-payments (accessed on 26 October 2017).
- Oliveira, T.; Thomas, M.; Baptista, G.; Campos, F. Mobile payment: Understanding the determinants of customer adoption and intention to recommend the technology. Comput. Hum. Behav. 2016, 61, 404–414. [Google Scholar] [CrossRef]
- McKinsey & Company. The 2020 McKinsey Global Payments Report. 2020. Available online: https://www.mckinsey.com/~/media/McKinsey/Industries/Financial%20Services/Our%20Insights/Accelerating%20winds%20of%20change%20in%20global%20payments/2020-McKinsey-Global-Payments-Report-vF.pdf (accessed on 25 October 2020).
- Statista. Number of Proximity Mobile Payment Transaction Users Worldwide from 2018 to 2023. 2021. Available online: https://www.statista.com/statistics/557959/global-mobile-proximity-payment-users/ (accessed on 15 January 2021).
- Statista. Proximity Mobile Payment Usage Penetration in Selected Countries in 2019. 2021. Available online: https://www.statista.com/statistics/244501/share-of-mobile-phone-users-accessing-proximity-mobile-payments-country/ (accessed on 17 August 2021).
- The Korea Herald. One-Third of Korea’s Smartphone Users to Make Mobile Payments in 2018. 2018. Available online: http://www.koreaherald.com/view.php?ud=20180116000867 (accessed on 16 January 2018).
- De Luna, I.R.; Liébana-Cabanillas, F.; Sánchez-Fernández, J.; Muñoz-Leiva, F. Mobile payment is not all the same: The adoption of mobile payment systems depending on the technology applied. Technol. Forecast Soc. Chang. 2019, 146, 931–944. [Google Scholar] [CrossRef]
- Johnson, V.L.; Kiser, A.; Washington, R.; Torres, R. Limitations to the rapid adoption of M-payment services: Understanding the impact of privacy risk on M-payment services. Comput. Hum. Behav. 2018, 79, 111–122. [Google Scholar] [CrossRef]
- Yang, S.; Lu, Y.; Gupta, S.; Cao, Y.; Zhang, R. Mobile payment services adoption across time: An empirical study of the effects of behavioral beliefs, social influence, and personal traits. Comput. Hum. Behav. 2012, 28, 129–142. [Google Scholar] [CrossRef]
- Zhou, T. An empirical examination of continuance intention of mobile payment services. Decis. Support Syst. 2013, 54, 1085–1091. [Google Scholar] [CrossRef]
- Amoroso, D.L.; Chen, Y.A.N. Constructs affecting continuance intention in consumers with mobile financial apps: A dual factor approach. J. Inf. Technol. Manag. 2017, 28, 1–24. [Google Scholar]
- Chen, X.; Li, S. Understanding continuance intention of mobile payment services: An empirical study. J. Comput. Inf. Syst. 2017, 57, 287–298. [Google Scholar] [CrossRef]
- Ye, C.; Seo, D.; Desouza, K.C.; Sangareddy, S.P.; Jha, S. Influences of IT substitutes and users experience on post-adoption user switching: An empirical investigation. J. Am. Soc. Inf. Sci. Technol. 2008, 59, 2115–2132. [Google Scholar] [CrossRef]
- Ye, C.; Potter, R. The role of habit in post-adoption switching of personal information technologies: An empirical investigation. Commun. Assoc. Inf. Syst. 2011, 28, 585–610. [Google Scholar] [CrossRef]
- Lee, E.S. A theory of migration. Demography 1966, 3, 47–57. [Google Scholar] [CrossRef]
- Bansal, H.S.; Taylor, S.F.; James, Y.S. “Migrating” to new service provides: Toward a unifying framework of consumers’ switching behaviors. J. Acad. Mark. Sci. 2005, 33, 96–115. [Google Scholar] [CrossRef]
- Wu, K.; Vassileva, J.; Zhao, Y. Understanding users’ intention to switch personal cloud storage services: Evidence from the Chinese market. Comput. Hum. Behav. 2017, 68, 300–314. [Google Scholar] [CrossRef]
- Peng, X.; Zhao, Y.C.; Zhu, Q. Investigating users switching intention for mobile instant messaging application: Taking WeChat as an example. Comput. Hum. Behav. 2016, 64, 206–216. [Google Scholar] [CrossRef]
- Hsieh, J.K.; Hsieh, Y.C.; Chiu, H.C.; Feng, Y.C. Post-adoption switching behavior for online service substitutes: A perspective of the push-pull-mooring framework. Comput. Hum. Behav. 2012, 28, 1912–1920. [Google Scholar] [CrossRef]
- Lai, J.Y.; Debbarma, S.; Ulhas, K.R. An empirical study of consumer switching behavior towards mobile shopping: A push-pull-mooring model. Int. J. Mob. Commun. 2012, 10, 386–404. [Google Scholar] [CrossRef]
- Chang, I.C.; Liu, C.C.; Chen, K. The push, pull and mooring effects in virtual migration for social networking sites. Inf. Syst. J. 2014, 24, 323–346. [Google Scholar] [CrossRef]
- Bhattacherjee, A.; Park, S.C. Why end-users move to the cloud: A migration-theoretic analysis. Eur. J. Inf. Syst. 2014, 23, 357–372. [Google Scholar] [CrossRef]
- Lin, T.C.; Huang, S.L. Understanding the determinants of consumers’ switching intentions in a standards war. Int. J. Electron. Commer. 2014, 19, 163–189. [Google Scholar] [CrossRef]
- Lai, J.Y.; Wang, J. Switching attitudes of Taiwanese middle-aged and elderly patients toward cloud healthcare services: An exploratory study. Technol. Forecast Soc. Chang. 2015, 92, 155–167. [Google Scholar] [CrossRef]
- Sun, Y.; Liu, D.; Chen, S.; Wu, X.; Shen, X.L.; Zhang, X. Understanding users’ switching behavior of mobile instant messaging applications: An empirical study from the perspective of push-pull-mooring framework. Comput. Hum. Behav. 2017, 75, 727–738. [Google Scholar] [CrossRef]
- Ravenstein, E.G. The laws of migration. J. Stat. Soc. Lond. 1885, 48, 167–235. [Google Scholar] [CrossRef]
- Jackson, J.A. Migration. In Aspects of Modern Sociology: Social Processes; Longman: New York, NY, USA, 1986. [Google Scholar]
- Xu, Y.C.; Yang, Y.; Cheng, Z.; Lim, J. Retaining and attracting users in social networking services: An empirical investigation of cyber migration. J. Strat. Inf. Syst. 2014, 23, 239–253. [Google Scholar] [CrossRef]
- Li, C.Y.; Ku, Y.C. The power of a thumbs-up: Will e-commerce switch to social commerce? Inf. Manag. 2018, 55, 340–357. [Google Scholar] [CrossRef]
- Davis, F.D. Perceived usefulness, perceived ease of use, and users acceptance of information technology. MIS Q. 1989, 13, 319–340. [Google Scholar] [CrossRef]
- Fishbein, M.; Ajzen, I. Belief, Attitude, Intention and Behavior: An Introduction to Theory and Research; Addison-Wesley: Reading, MA, USA, 1975. [Google Scholar]
- Rogers, E.M. Diffusion of Innovations, 4th ed.; Free Press: New York, NY, USA, 1995. [Google Scholar]
- Tan, G.W.H.; Ooi, K.B.; Chong, S.C.; Hew, T.S. NFC mobile credit card: The next frontier of mobile payment? Telemat. Inform. 2014, 31, 292–307. [Google Scholar] [CrossRef]
- Hassan, H.E.; Wood, V.R. Does country culture influence consumers’ perceptions toward mobile banking? A comparison between Egypt and the United States. Telemat. Inform. 2020, 46, 101312. [Google Scholar] [CrossRef]
- Kim, C.; Mirusmonov, M.; Lee, I. An empirical examination of factors influencing the intention to use mobile payment. Comput. Hum. Behav. 2010, 26, 310–322. [Google Scholar] [CrossRef]
- Lu, Y.; Yang, S.; Chau, P.Y.; Cao, Y. Dynamics between the trust transfer process and intention to use mobile payment services: A cross-environment perspective. Inf. Manag. 2011, 48, 393–403. [Google Scholar] [CrossRef]
- Bhattacherjee, A. Understanding information systems continuance: An expectation-confirmation model. MIS Q. 2001, 25, 351–370. [Google Scholar] [CrossRef]
- Li, C.Y.; Fang, Y.H. Predicting continuance intention toward mobile branded apps through satisfaction and attachment. Telemat. Inform. 2019, 43, 101248. [Google Scholar] [CrossRef]
- Park, E. User acceptance of smart wearable devices: An expectation-confirmation model approach. Telemat. Inform. 2020, 47, 101318. [Google Scholar] [CrossRef]
- Zhou, T. An empirical examination of users’ post-adoption behavior of mobile services. Behav. Inf. Technol. 2011, 30, 241–250. [Google Scholar] [CrossRef]
- Wu, K.J.; Liao, C.J.; Tseng, M.L.; Chou, P.J. Understanding innovation for sustainable business management capabilities and competencies under uncertainty. Sustainability 2015, 7, 13726–13760. [Google Scholar] [CrossRef]
- Lin, C.A. Audience fragmentation in a competitive video marketplace. J. Advert. Res. 1994, 34, 30–39. [Google Scholar]
- Cha, J. Predictors of television and online video platform use: A coexistence model of old and new video platforms. Telemat. Inform. 2013, 30, 296–310. [Google Scholar] [CrossRef]
- Ferguson, D.A.; Perse, E.M. The World Wide Web as is functional alternative to television. J. Broadcast Electron. Media 2000, 44, 155–174. [Google Scholar] [CrossRef]
- Parthasarathy, M.; Bhattacherjee, A. Understanding post-adoption behavior in the context of online services. Inf. Syst. Res. 1998, 9, 362–379. [Google Scholar] [CrossRef]
- Wolman, D. The End of Money: Counterfeiters, Preachers, Techies, Dreamers-and the Coming Cashless Society; Hachette: Boston, MA, USA, 2012. [Google Scholar]
- Sadeh, N. M-Commerce Technologies, Services, and Business Models; John Wiley & Sons: New York, NY, USA, 2003. [Google Scholar]
- Cha, J.; Chan-Olmsted, S.M. Substitutability between online video platforms and television. J. Mass Commun. Q. 2012, 89, 261–278. [Google Scholar] [CrossRef]
- Perse, E.M.; Courtright, J.A. Normative images of communication media mass and interpersonal channels in the new media environment: Mass and interpersonal channels in the new media environment. Hum. Commun. Res. 1993, 19, 485–503. [Google Scholar] [CrossRef]
- Schierholz, R.; Laukkanen, T. Internet vs. mobile banking: Comparing customer value perceptions. Bus. Process Manag. J. 2007, 13, 788–797. [Google Scholar]
- Teo, A.C.; Tan, G.W.H.; Ooi, K.B.; Hew, T.S.; Yew, K.T. The effects of convenience and speed in m-payment. Ind. Manag. Data Syst. 2015, 115, 311–331. [Google Scholar] [CrossRef]
- KakaoPay Review. What is KakaoPay? Available online: https://comparecamp.com/kakaopay-review-pricing-pros-cons-features/ (accessed on 21 July 2017).
- CNET. Samsung Pay FAQ: Everything You Need to Know. 2021. Available online: https://www.cnet.com/tech/services-and-software/samsung-pay-faq-everything-you-need-to-know-mobile-wallet/ (accessed on 21 July 2021).
- Li, C.Y. Consumer behavior in switching between membership cards and mobile applications: The case of Starbucks. Comput. Hum. Behav. 2018, 84, 171–184. [Google Scholar] [CrossRef]
- Childers, T.L.; Carr, C.L.; Peck, J.; Carson, S. Hedonic and utilitarian motivations for online retail shopping behavior. J. Retail. 2001, 77, 511–535. [Google Scholar] [CrossRef]
- Dennism, C.; Jayawardhena, C.; Papamatthaiou, E.K. Antecedents of internet shopping intentions and the moderating effects of substitutability. Int. Rev. Retail Distrib. Consum. Res. 2010, 20, 411–430. [Google Scholar]
- Karjaluoto, H.; Shaikh, A.A.; Leppäniemi, M.; Luomala, R. Examining consumers’ usage intention of contactless payment systems. Int. J. Bank Mark. 2019, 38, 332–351. [Google Scholar] [CrossRef]
- Brown, S.A.; Venkatesh, V. Model of adoption of technology in households: A baseline model test and extension incorporating household life cycle. MIS Q. 2005, 29, 399–426. [Google Scholar] [CrossRef]
- Khalilzadeh, J.; Ozturk, A.B.; Bilgihan, A. Security-related factors in extended UTAUT model for NFC based mobile payment in the restaurant industry. Comput. Hum. Behav. 2017, 70, 460–474. [Google Scholar] [CrossRef]
- Raza, S.A.; Umer, A.; Shah, N. New determinants of ease of use and perceived usefulness for mobile banking adoption. Int. J. Electron. Cust. Relatsh. Manag. 2017, 11, 44–65. [Google Scholar]
- Verkijika, S.F. Factors influencing the adoption of mobile commerce applications in Cameroon. Telemat. Inform. 2018, 35, 1665–1674. [Google Scholar] [CrossRef]
- Cheng, S.; Lee, S.J.; Choi, B. An empirical investigation of users’ voluntary switching intention for mobile personal cloud storage services based on the push-pull-mooring framework. Comput. Hum. Behav. 2019, 92, 198–215. [Google Scholar] [CrossRef]
- Moon, B. Paradigms in migration research: Exploring ‘moorings’ as a schema. Prog. Hum. Geogr. 1995, 19, 504–524. [Google Scholar] [CrossRef] [PubMed]
- Karahanna, E.; Agarwal, R.; Angst, C.M. Reconceptualizing compatibility beliefs in technology acceptance research. MIS Q. 2006, 30, 781–804. [Google Scholar] [CrossRef]
- Vallerand, R.J. Toward a hierarchical model of intrinsic and extrinsic motivation. Adv. Exp. Soc. Psychol. 1997, 29, 271–360. [Google Scholar]
- Mallat, N. Exploring consumer adoption of mobile payments-A qualitative study. J. Strat. Inf. Syst. 2007, 16, 413–432. [Google Scholar] [CrossRef]
- Tornatzky, L.G.; Klein, K.J. Innovation characteristics and innovation adoption-implementation: A meta-analysis of findings. IEEE Trans. Eng. Manag. 1982, 29, 28–45. [Google Scholar] [CrossRef]
- Harrington, S.J.; Ruppel, C.P. Telecommuting: A test of trust, competing values, and relative advantage. IEEE Trans. Prof. Commun. 1999, 42, 223–239. [Google Scholar] [CrossRef]
- Van Rijnsoever, F.J.; van Hameren, D.; Walraven, P.F.; van Dijk, J.P. Interdependent technology attributes and the diffusion of consumer electronics. Telemat. Inform. 2009, 26, 410–420. [Google Scholar] [CrossRef][Green Version]
- Featherman, M.S.; Pavlou, P.A. Predicting e-services adoption: A perceived risk facets perspective. Int. J. Hum. Comput. Stud. 2003, 59, 451–474. [Google Scholar] [CrossRef]
- McKnight, D.H.; Choudhury, V.; Kacmar, C. The impact of initial consumer trust on intentions to transact with a web site: A trust building model. J. Strat. Inf. Syst. 2002, 11, 297–323. [Google Scholar] [CrossRef]
- Chang, Y.F.; Chen, C.S.; Zhou, H. Smart phone for mobile commerce. Comput. Stand. Interfaces 2009, 31, 740–747. [Google Scholar] [CrossRef]
- Slade, E.L.; Williams, M.D.; Dwivedi, Y.K. Mobile payment adoption: Classification and review of the extant literature. Mark. Rev. 2013, 13, 167–190. [Google Scholar] [CrossRef]
- Kim, M.; Kim, S.; Kim, J. Can mobile and biometric payments replace cards in the Korean offline payments market? Consumer preference analysis for payment systems using a discrete choice model. Telemat. Inform. 2019, 38, 46–58. [Google Scholar] [CrossRef]
- Koenig-Lewis, N.; Marquet, M.; Palmer, A.; Zhao, A.L. Enjoyment and social influence: Predicting mobile payment adoption. Serv. Ind. J. 2015, 35, 537–554. [Google Scholar] [CrossRef]
- Ajzen, I. The theory of planned behavior. Organ. Behav. Hum. Decis. Process. 1991, 50, 179–211. [Google Scholar] [CrossRef]
- Ajzen, I. Perceived behavioral control, self-efficacy, locus of control, and the theory of planned behavior. J. Appl. Soc. Psychol. 2002, 32, 665–683. [Google Scholar] [CrossRef]
- Bandura, A. Self-efficacy mechanism in human agency. Am. Psychol. 1982, 37, 122–147. [Google Scholar] [CrossRef]
- Bank of Korea. Payment usage behavior in Korea: Results and implications. Paym. Surv. 2016, 9, 1–68. [Google Scholar]
- Kim, J.H.; An, J.A.; Oh, S.J.; Oh, J.; Lee, J.K. Emerging COVID-19 Success Story: South Korea Learned the Lessons of MERS. 2021. Available online: https://ourworldindata.org/covid-exemplar-south-korea (accessed on 5 March 2021).
- Statista. Share of Respondents Who Used Mobile Payment Service within the Last Six Months in South Korea as of January 2019, by Age Group. 2021. Available online: https://www.statista.com/statistics/984921/south-korea-mobile-payment-usage-by-age/ (accessed on 5 May 2021).
- Armstrong, J.S.; Overton, T.S. Estimating non-response bias in mail surveys. J. Mark. Res. 1977, 14, 396–402. [Google Scholar] [CrossRef]
- Xu, F.; Luo, X.R.; Hsu, C. Anger or fear? Effects of discrete emotion on employee’s computer-related deviant behavior. Inf. Manag. 2020, 57, 103180. [Google Scholar] [CrossRef]
- Fornell, C.; Larcker, D.F. Evaluating structural equation models with unobservable variables and measurement error. J. Mark. Res. 1981, 18, 39–50. [Google Scholar] [CrossRef]
- Podsakoff, P.M.; MacKenzie, S.B.; Lee, J.Y.; Podsakoff, N.P. Common method biases in behavioral research: A critical review of the literature and recommended remedies. J. Appl. Psychol. 2003, 88, 879–903. [Google Scholar] [CrossRef]
- Liang, H.; Saraf, N.; Hu, Q.; Xue, Y. Assimilation of enterprise systems: The effect of institutional pressures and the mediating role of top management. MIS Q. 2007, 31, 59–87. [Google Scholar] [CrossRef]
- Lindell, M.K.; Whitney, D.J. Accounting for common method variance in cross-sectional research designs. J. Appl. Psychol. 2001, 86, 114–121. [Google Scholar] [CrossRef] [PubMed]
- Slade, E.; Williams, M.; Dwivedi, Y.; Piercy, N. Exploring consumer adoption of proximity mobile payments. J. Strat. Mark. 2015, 23, 209–223. [Google Scholar] [CrossRef]
- Kim, D.J.; Steinfield, C.; Lai, Y.J. Revisiting the role of web assurance seals in business-to-consumer electronic commerce. Decis. Support Syst. 2008, 44, 1000–1015. [Google Scholar] [CrossRef]
- Flavián, C.; Gurrea, R. Perceived substitutability between digital and physical channels: The case of newspapers. Online Inf. Rev. 2007, 31, 793–813. [Google Scholar] [CrossRef]
- Moore, G.C.; Benbasat, I. Development of an instrument to measure the perceptions of adopting an information technology innovation. Inf. Syst. Res. 1991, 2, 192–222. [Google Scholar] [CrossRef]
Publisher’s Note: MDPI stays neutral with regard to jurisdictional claims in published maps and institutional affiliations. |
© 2021 by the authors. Licensee MDPI, Basel, Switzerland. This article is an open access article distributed under the terms and conditions of the Creative Commons Attribution (CC BY) license (https://creativecommons.org/licenses/by/4.0/).