
Potential and Economic Analysis of Solar-to-Hydrogen Production in the Sultanate of Oman


Abstract
:1. Introduction
1.1. General and Motivation
1.2. Related Work
1.3. Research Gap, Objectives, and Contributions
- To examine the potential of green hydrogen production using the solar resources available in the Sultanate of Oman.
- To analyse the solar photovoltaic-to-hydrogen production process considering site resources and temperature variability for determining the capacity factor of the photovoltaic plant instead of assuming it.
- To evaluate the cost of green hydrogen production using the idea of levelized cost and identify the influential cost variables in producing hydrogen using solar power in Omani conditions.
- A pioneering analysis process of solar photovoltaic-to-hydrogen production potential and cost of hydrogen production that considers the capacity factor determined based on the site resources and temperature variability in the Sultanate of Oman.
- Outlining a rank of suitable locations with the potential of dedicated solar photovoltaic-based hydrogen production facilities development and identifying critical variables that significantly impact hydrogen production cost in Omani conditions.
1.4. Paper Structure
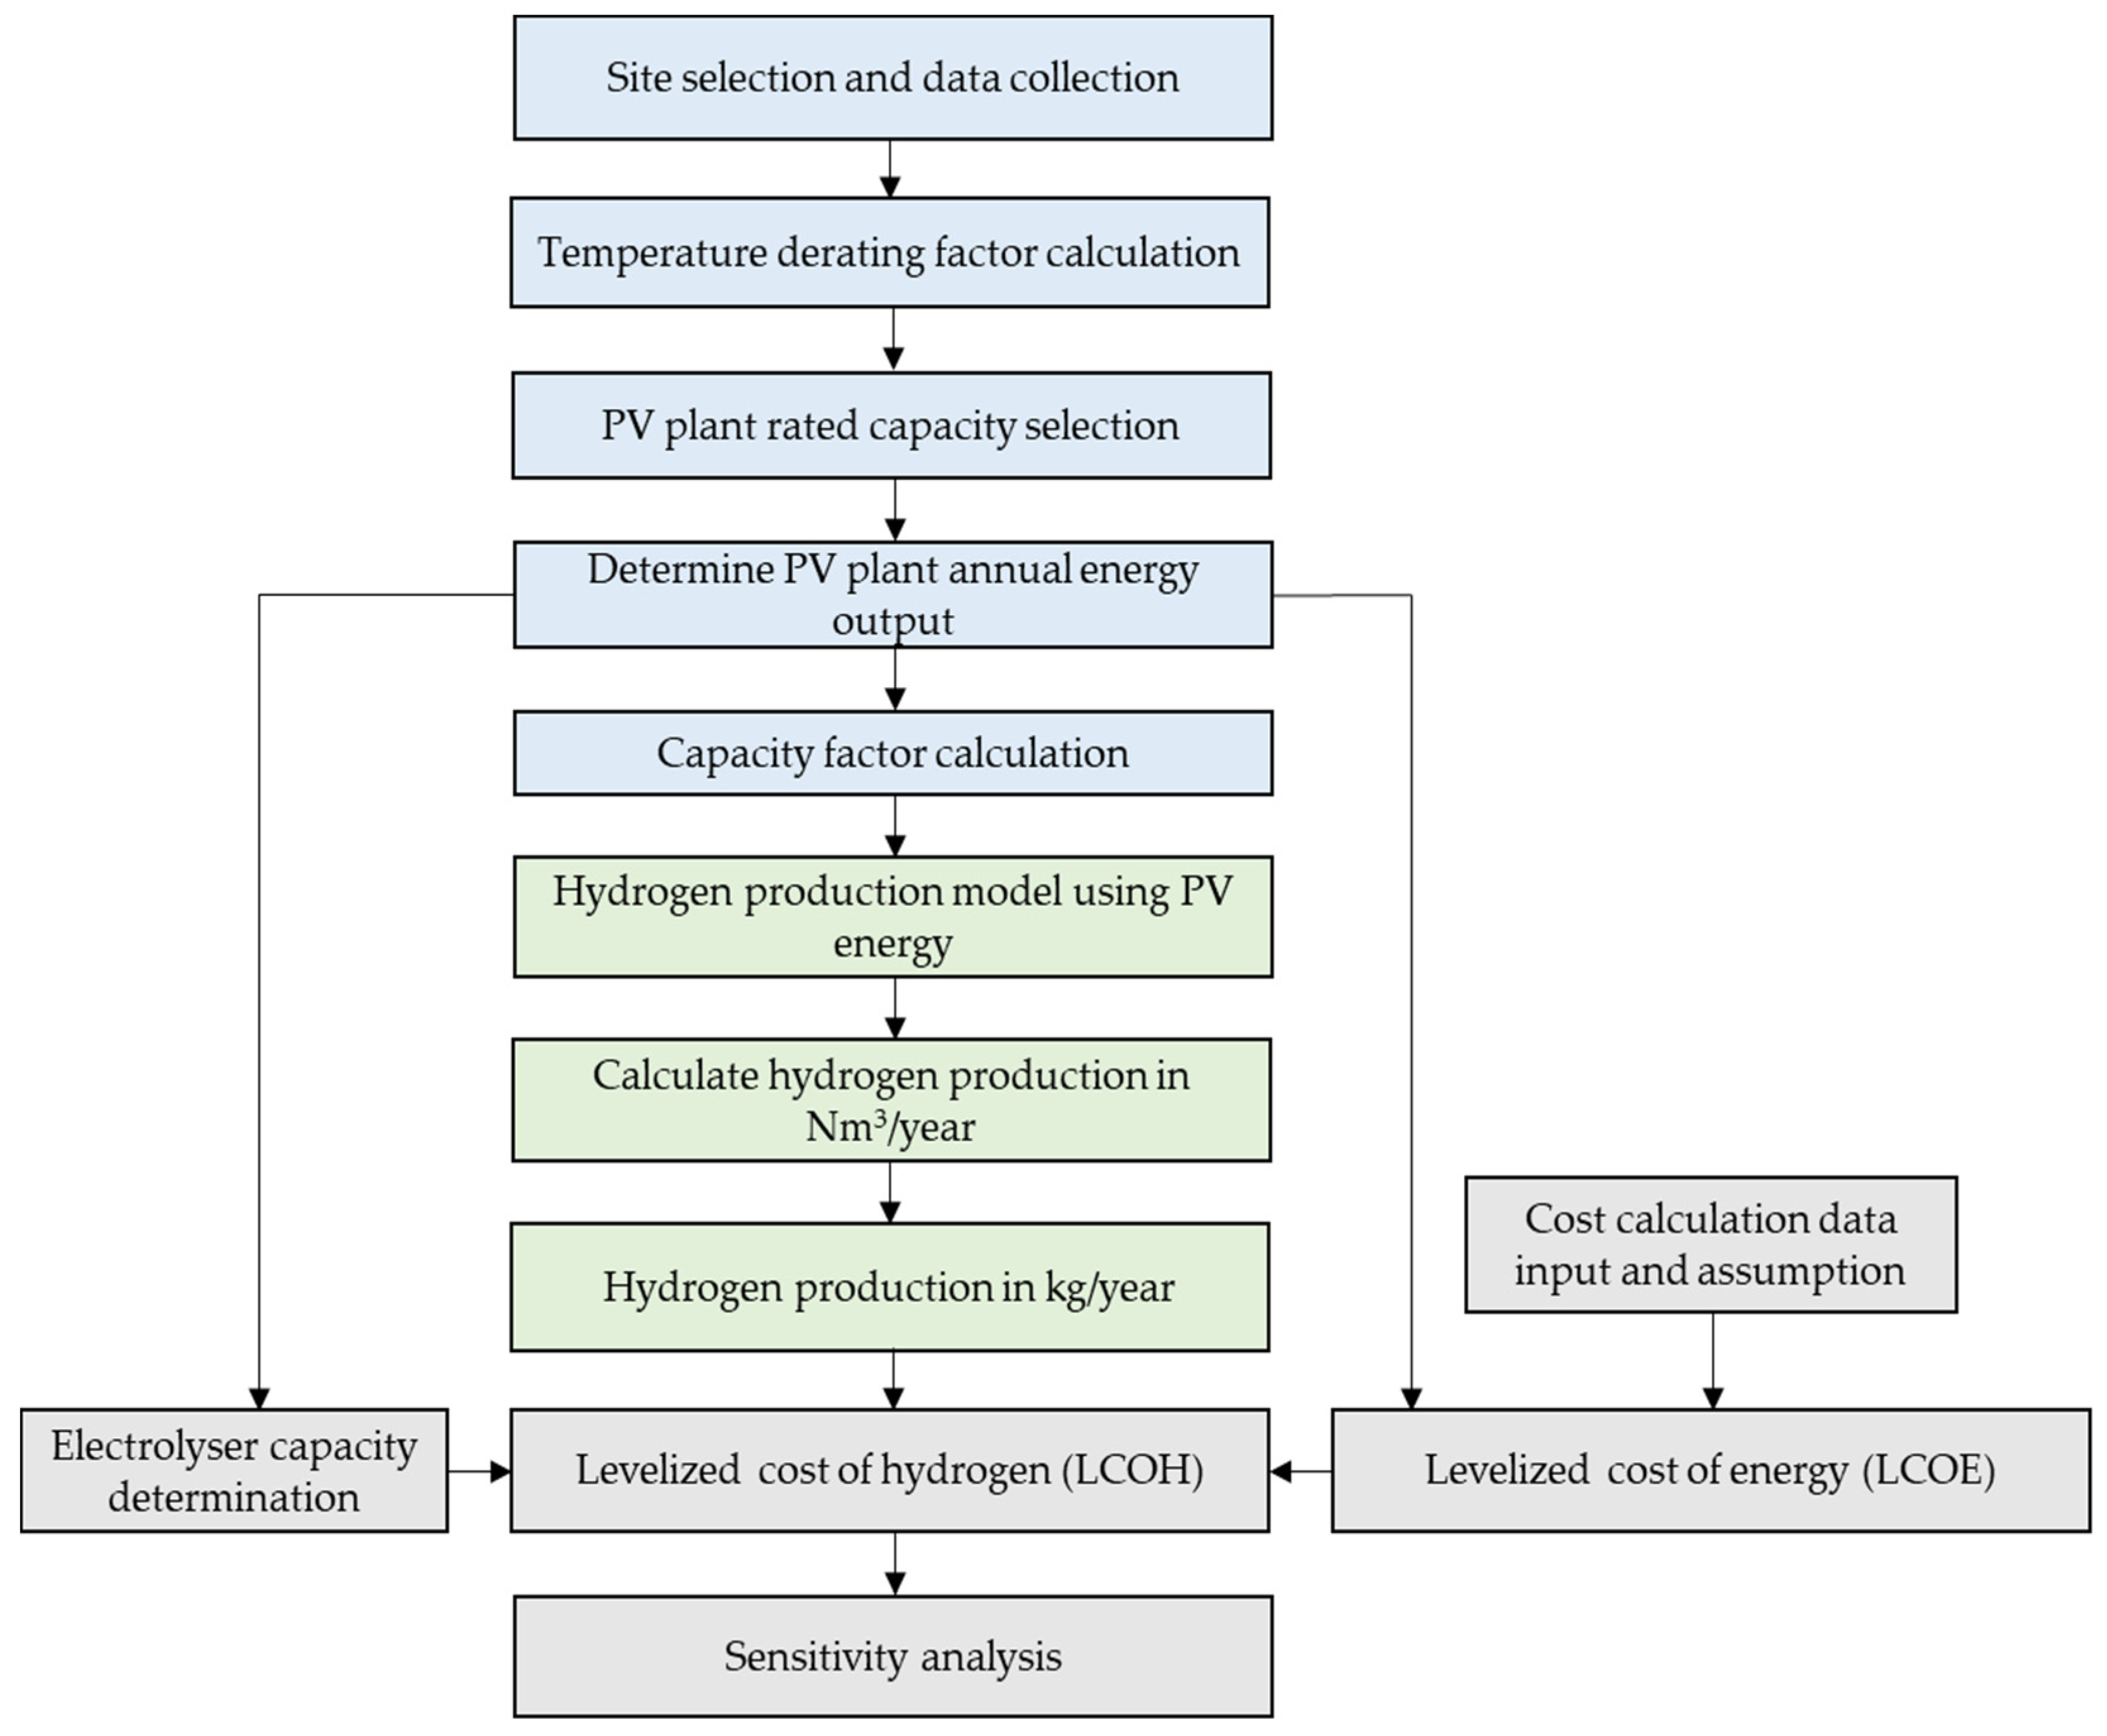
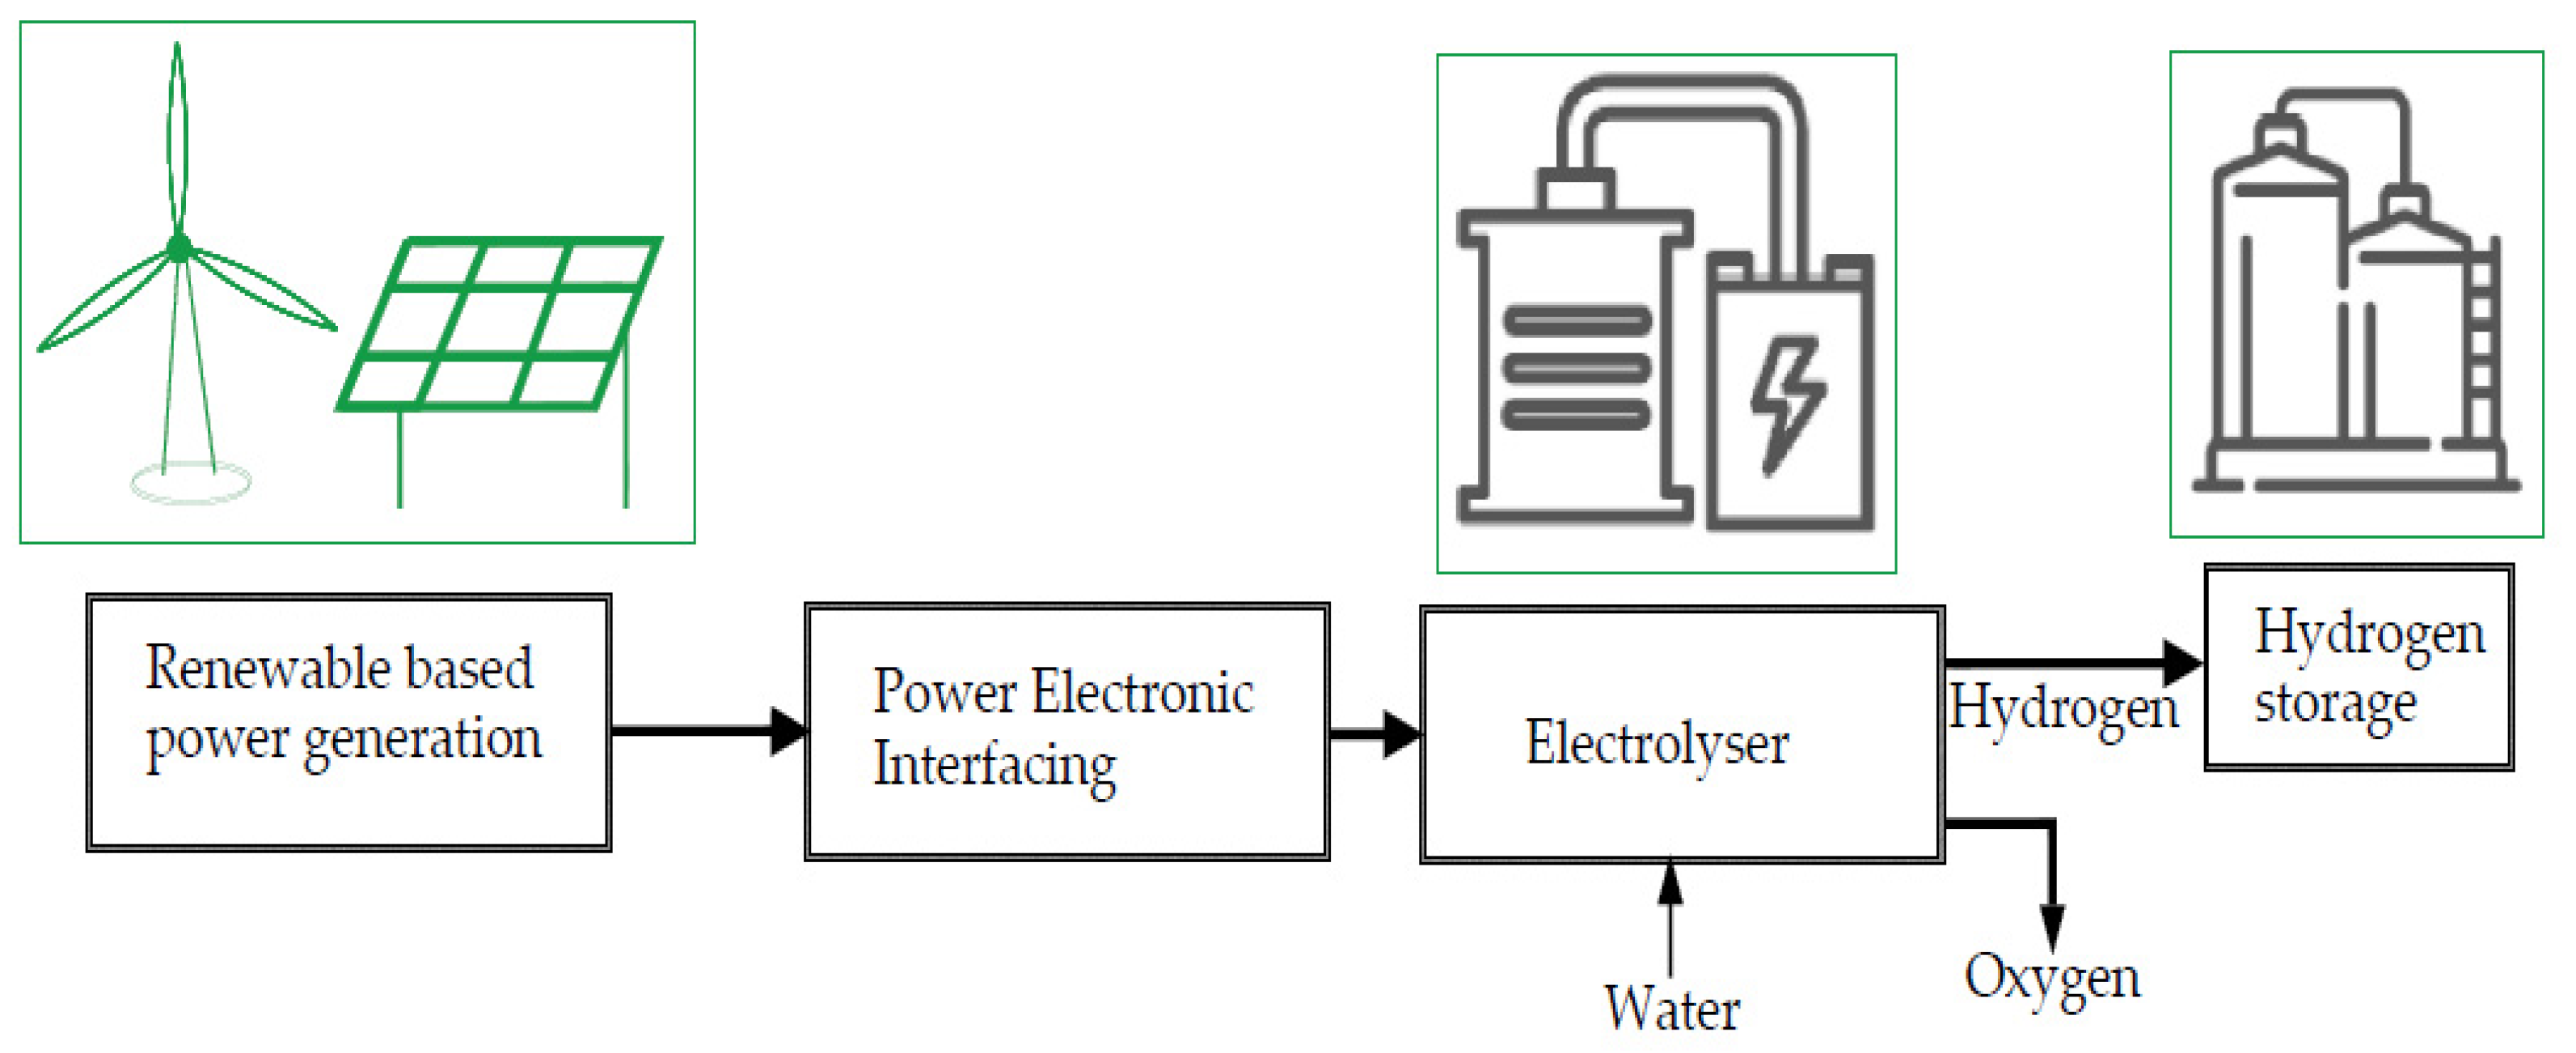
2. Methodology
2.1. Energy Output Model of a PV Plant
2.2. Model of Hydrogen Production
2.3. Economic Model
2.3.1. Model of Energy Production Cost
2.3.2. Model of Hydrogen Production Cost
2.4. Implementation of the Methodology

| Parameter | Value | Reference/Data Obtained |
|---|---|---|
| Solar radiation | Refer to Figure 4 | [51] |
| Site temperature | Refer to Figure 5 | [51] |
| Derating factor due to system components. PV module nameplate DC rating, transformer an inverter, diodes and connections, AC and DC wiring, soiling, shading, system availability, sun tracking, and age. | 0.7895 | [52] |
| PV plant capacity | 2000 kW | Assumed |
| Power converter efficiency | 95% | [35] |
| Average power consumption | 4.53 kWh/Nm3 | [53] |
| PV capital cost per kW | 996 USD | [7] |
| Discount rate | 6.5% | [48] |
| PV system lifetime | 25 years | [48] |
| Operation and maintenance cost of PV plant in per kW | 10 USD | [7] |
| Electrolyser capital cost | 1010 USD/kW | [13] |
| Electrolyser’s operation and maintenance cost | 5% of the annualized capital cost | [13,35] |
| Utilisation factor | 20% | [50] |
| Hydrogen storage cost | 0.5 USD/kg | [50] |
3. Results and Discussion
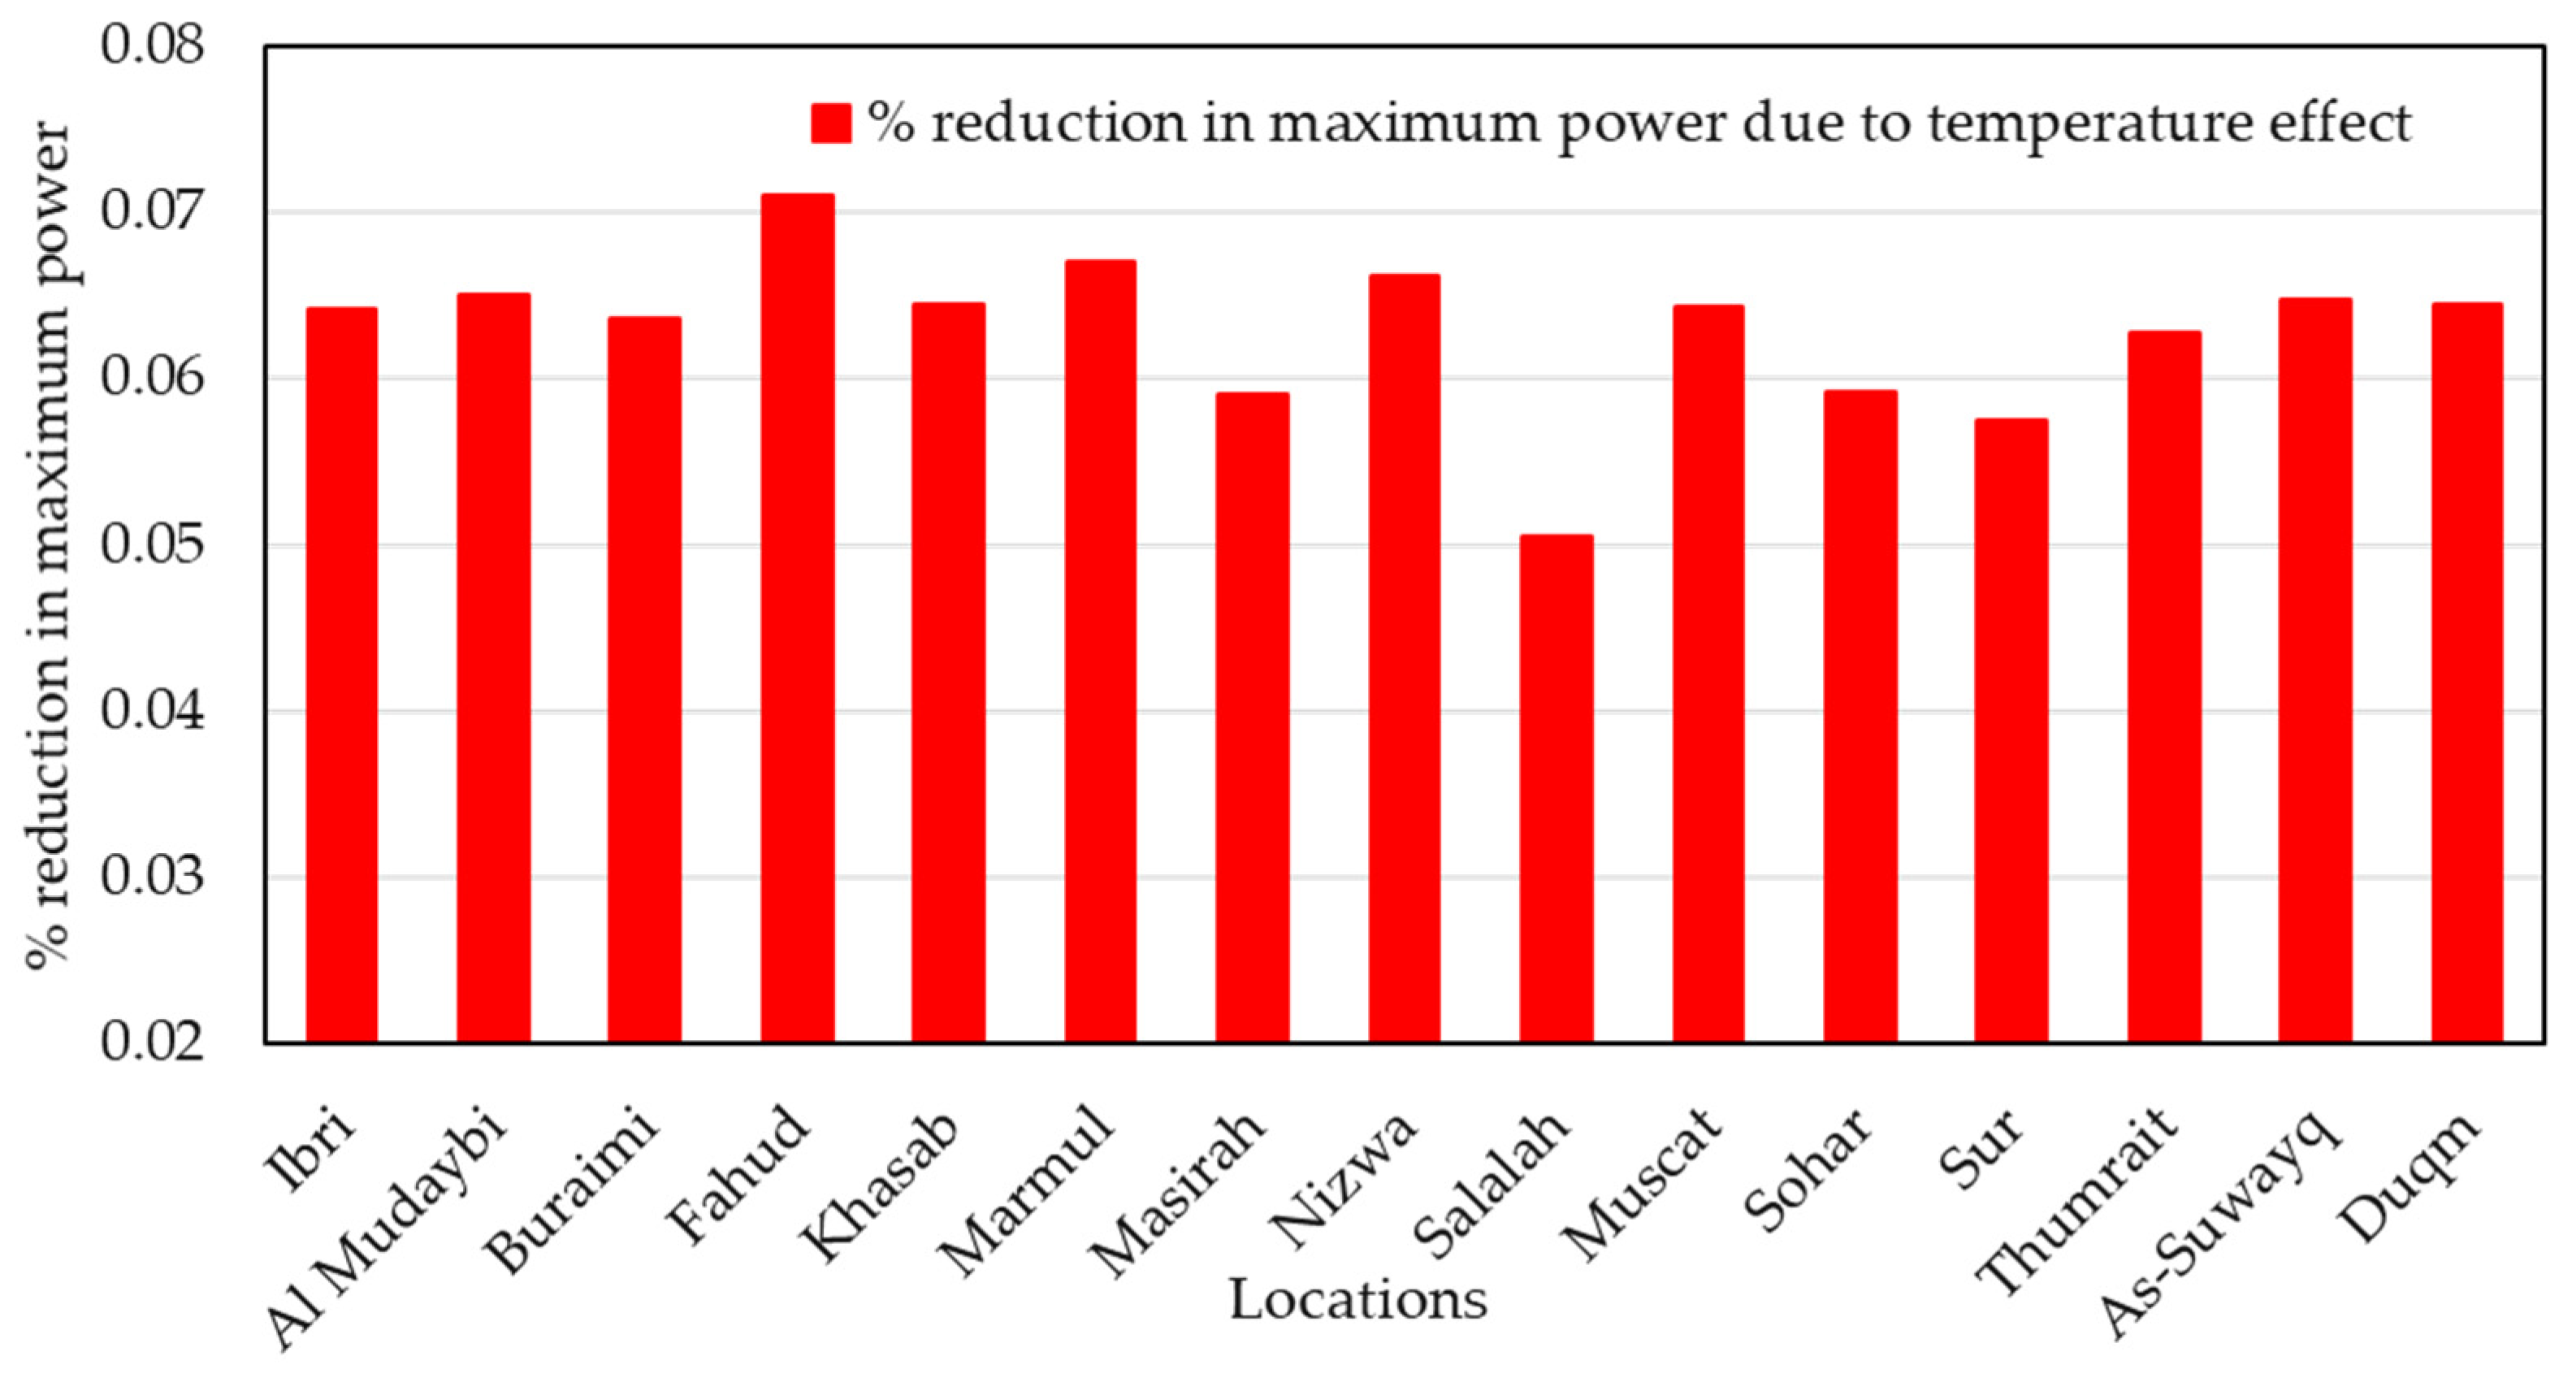
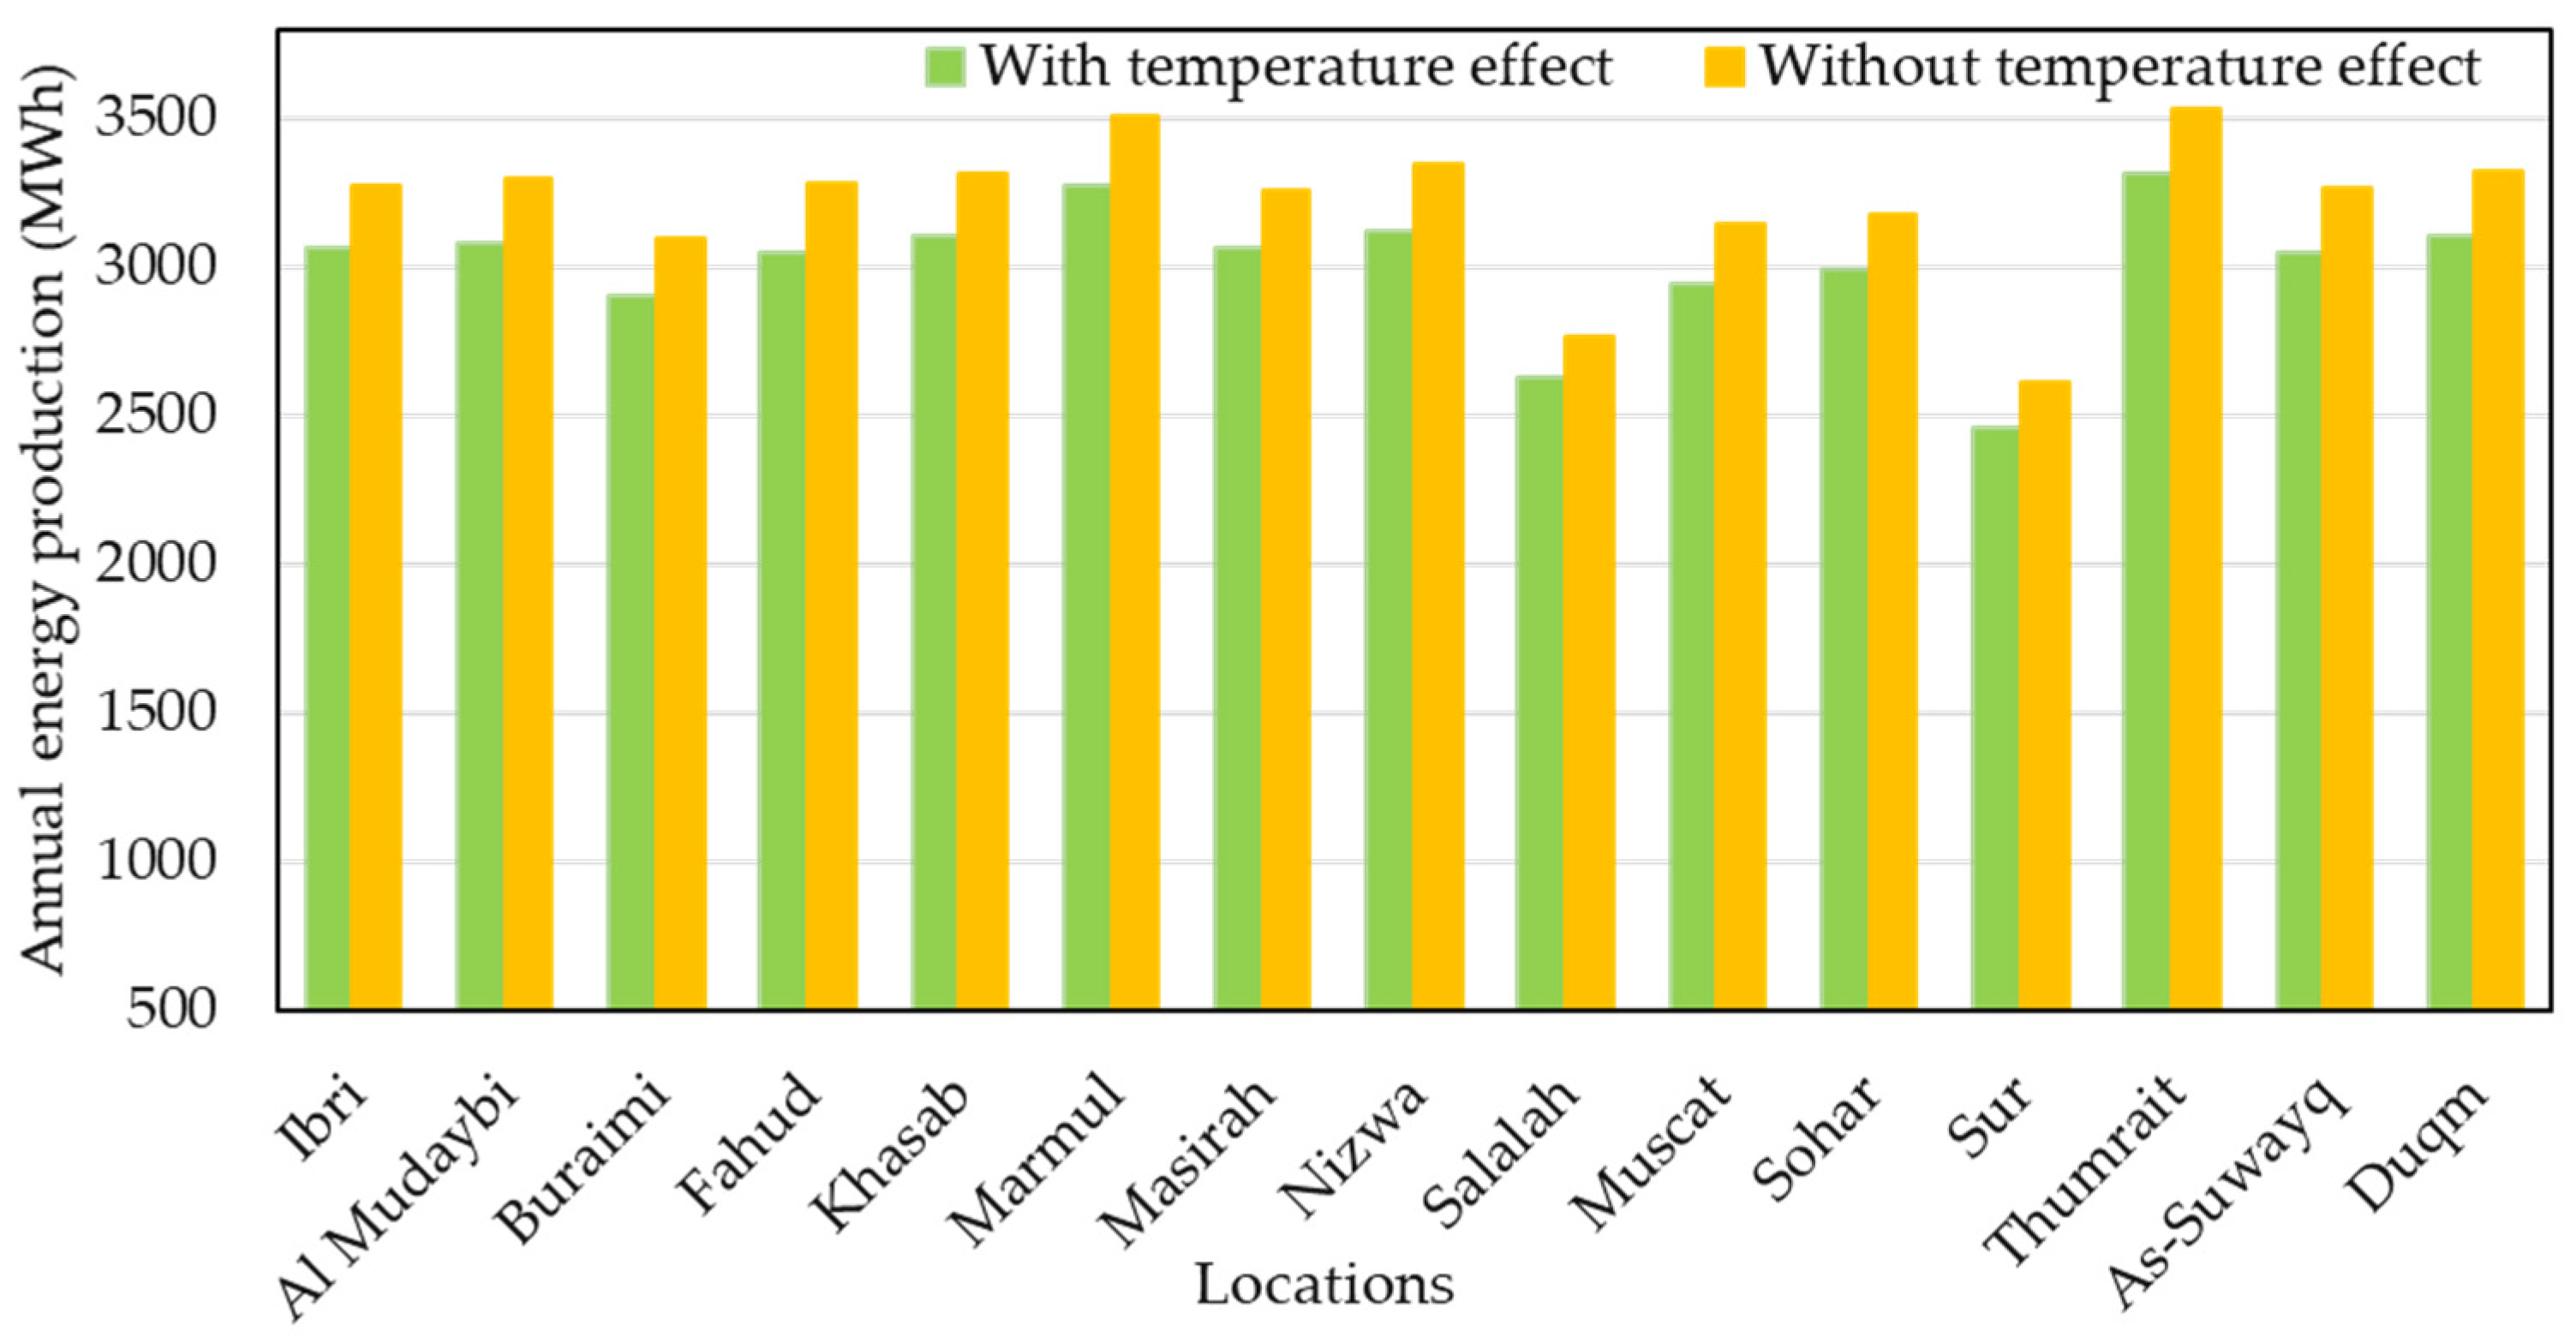
3.1. Energy Output of the Solar PV Plant
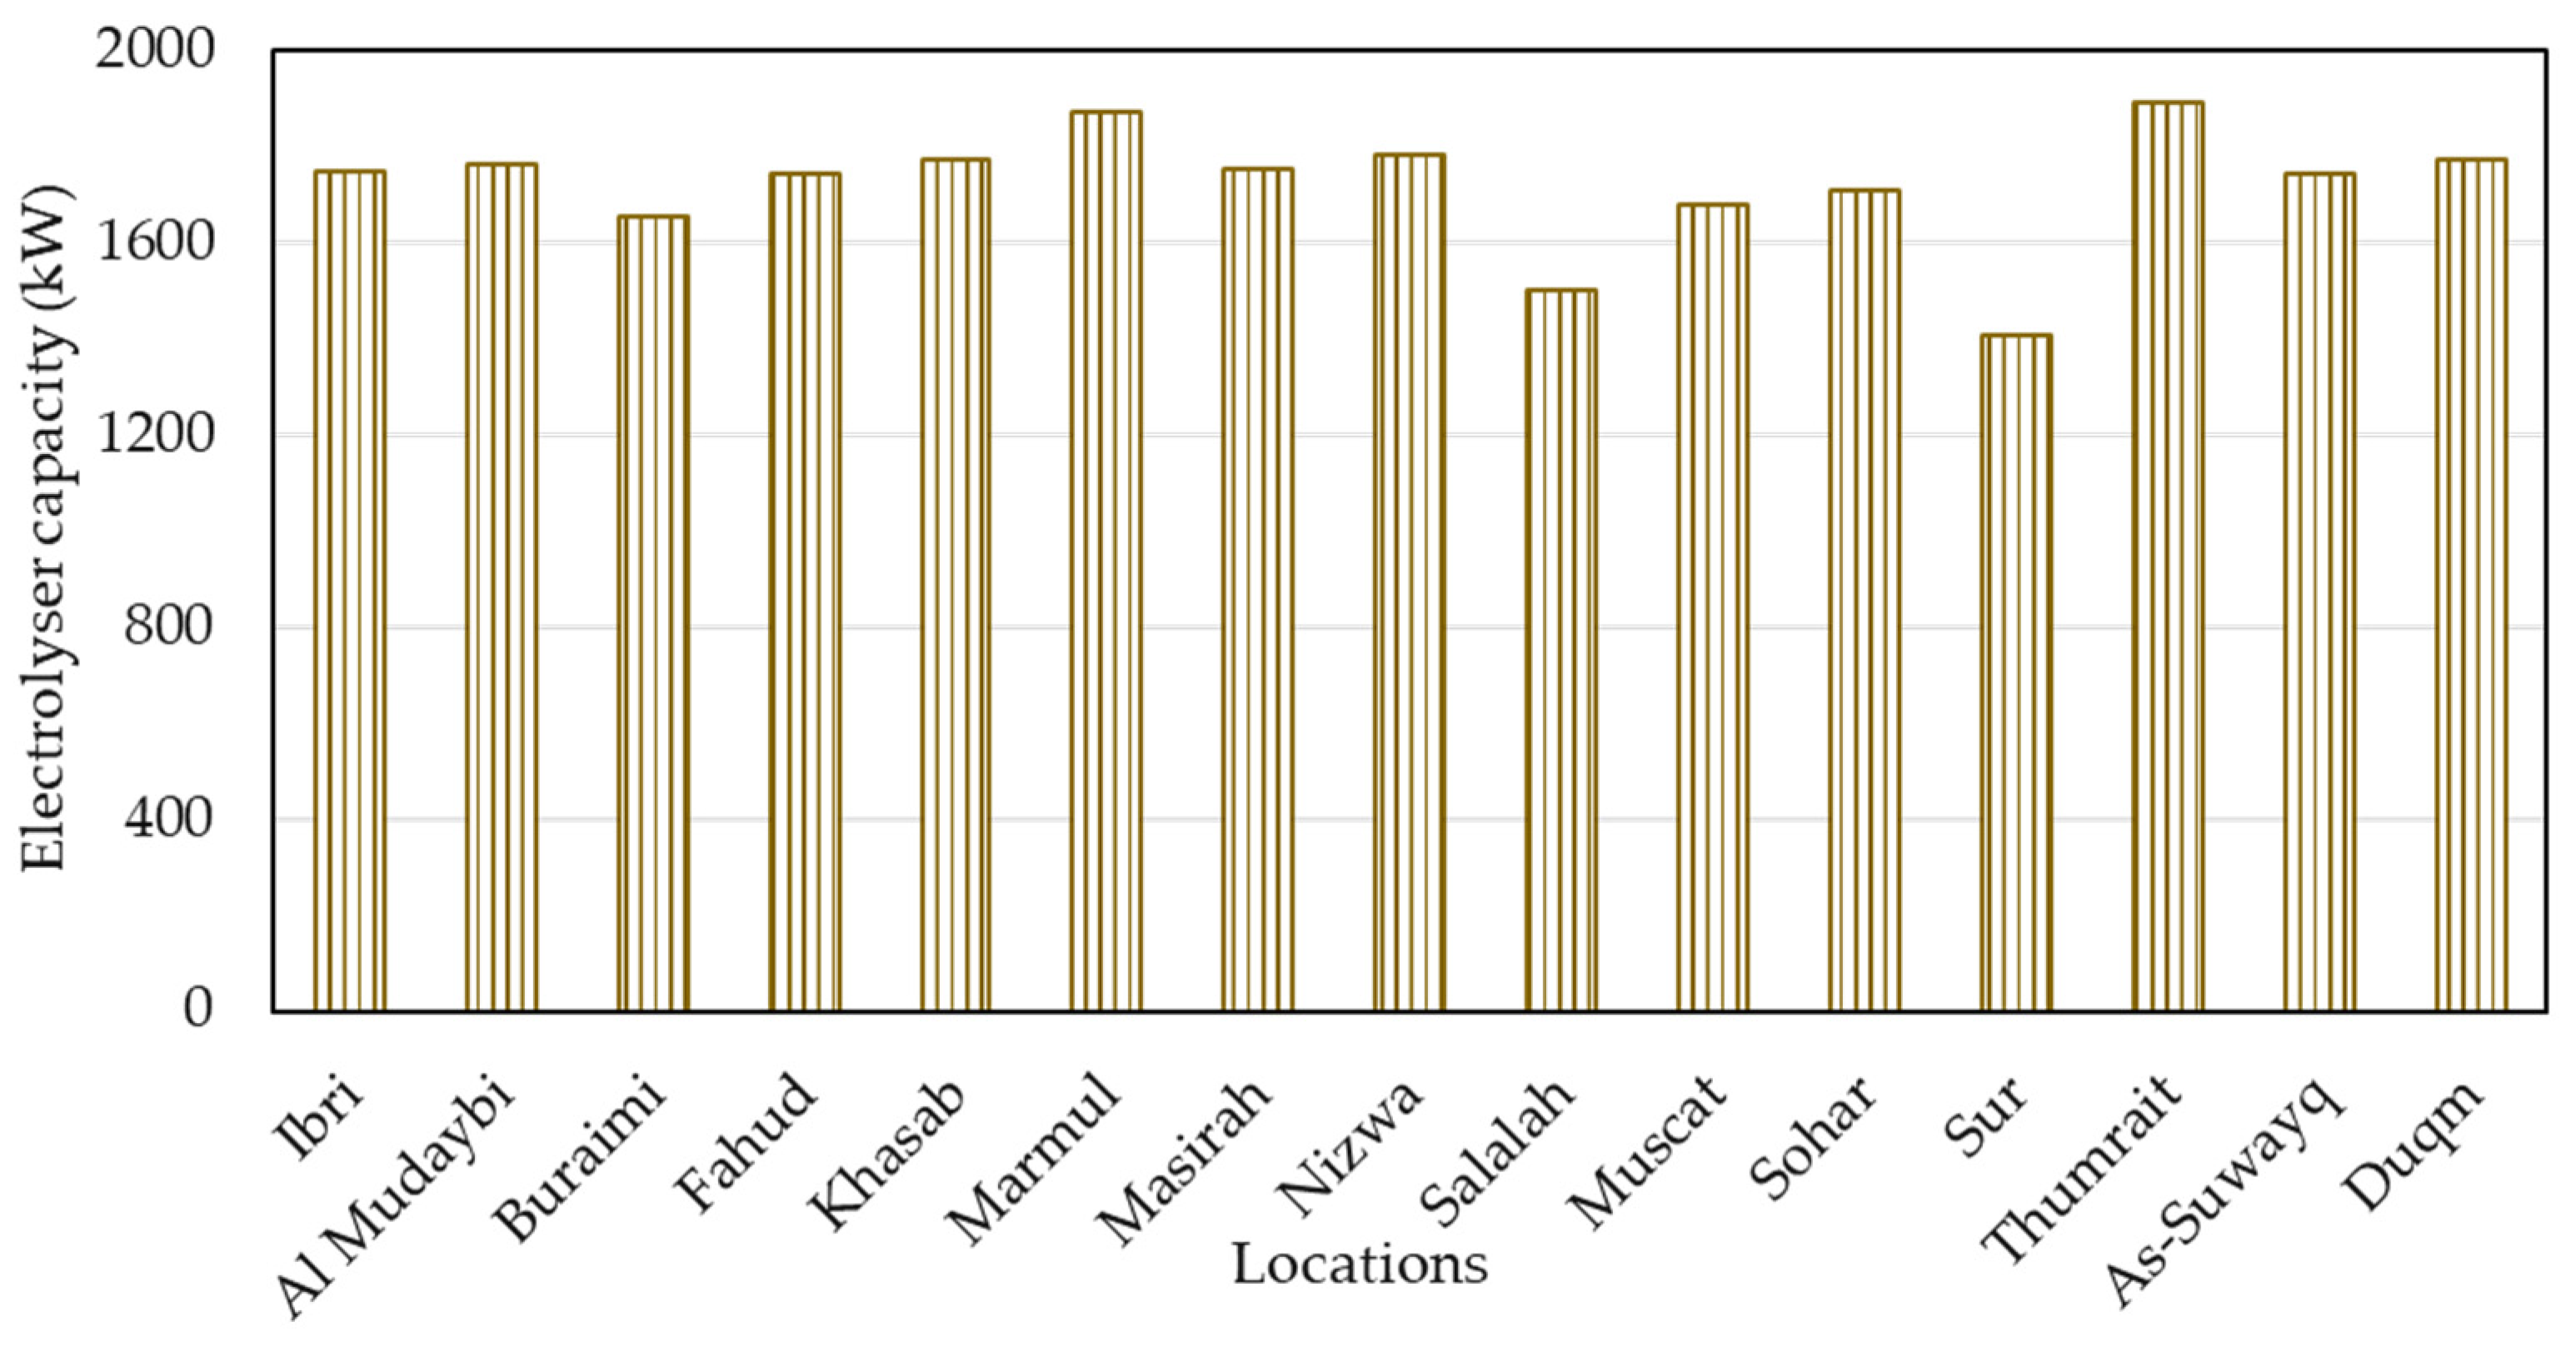
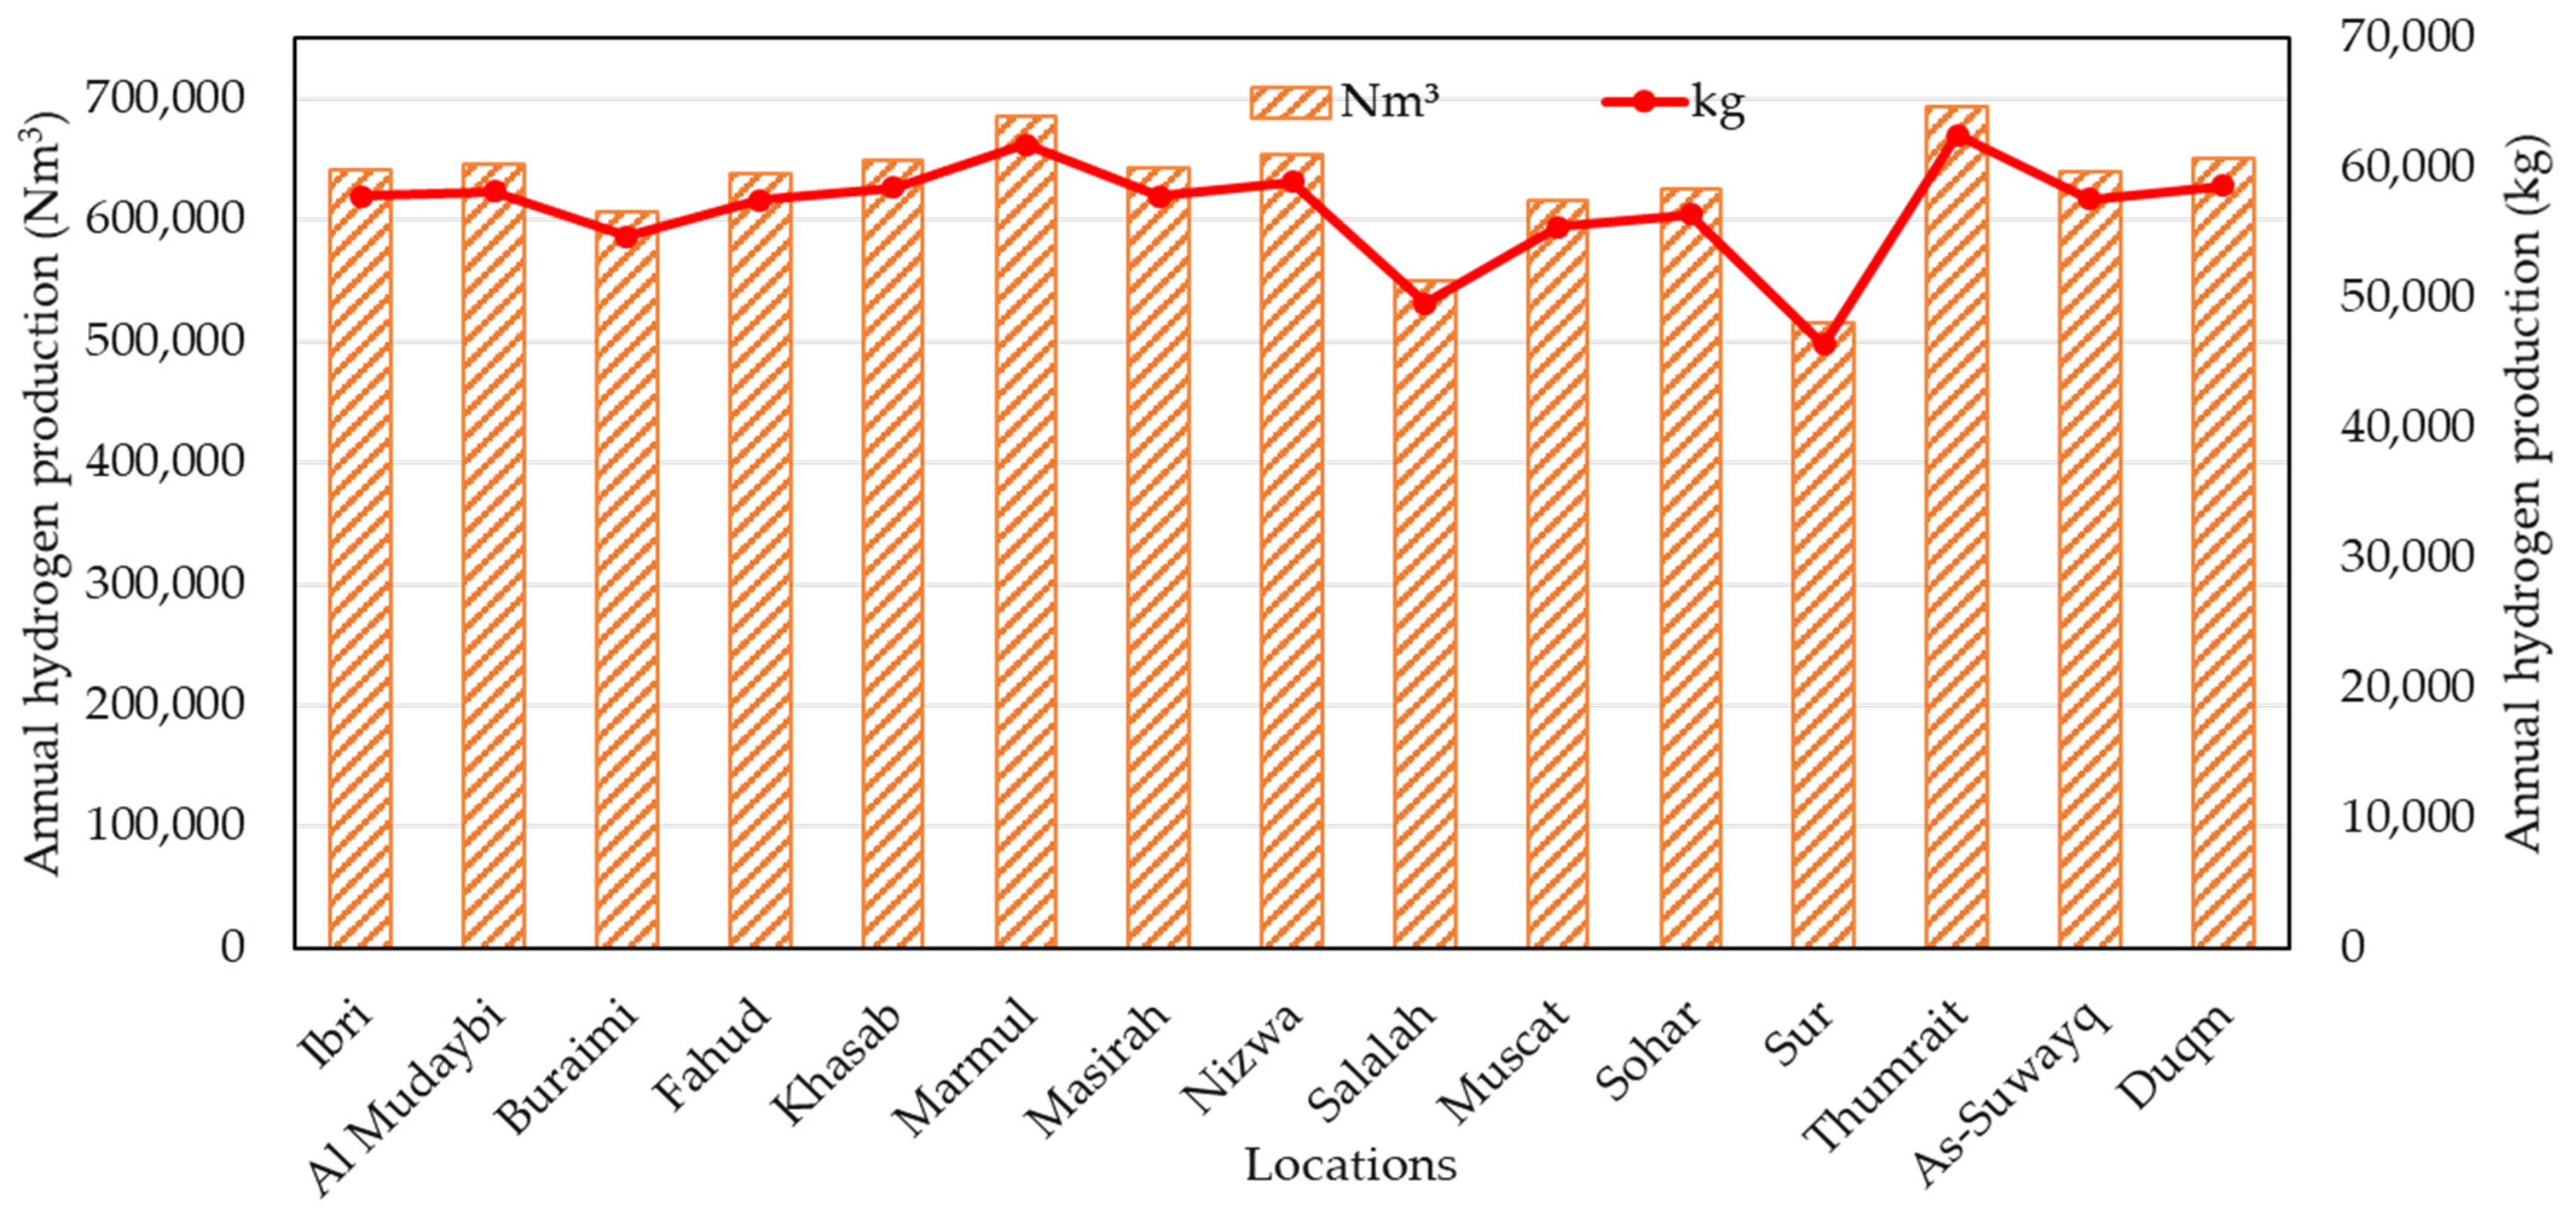
3.2. Hydrogen Production Using Solar PV Power
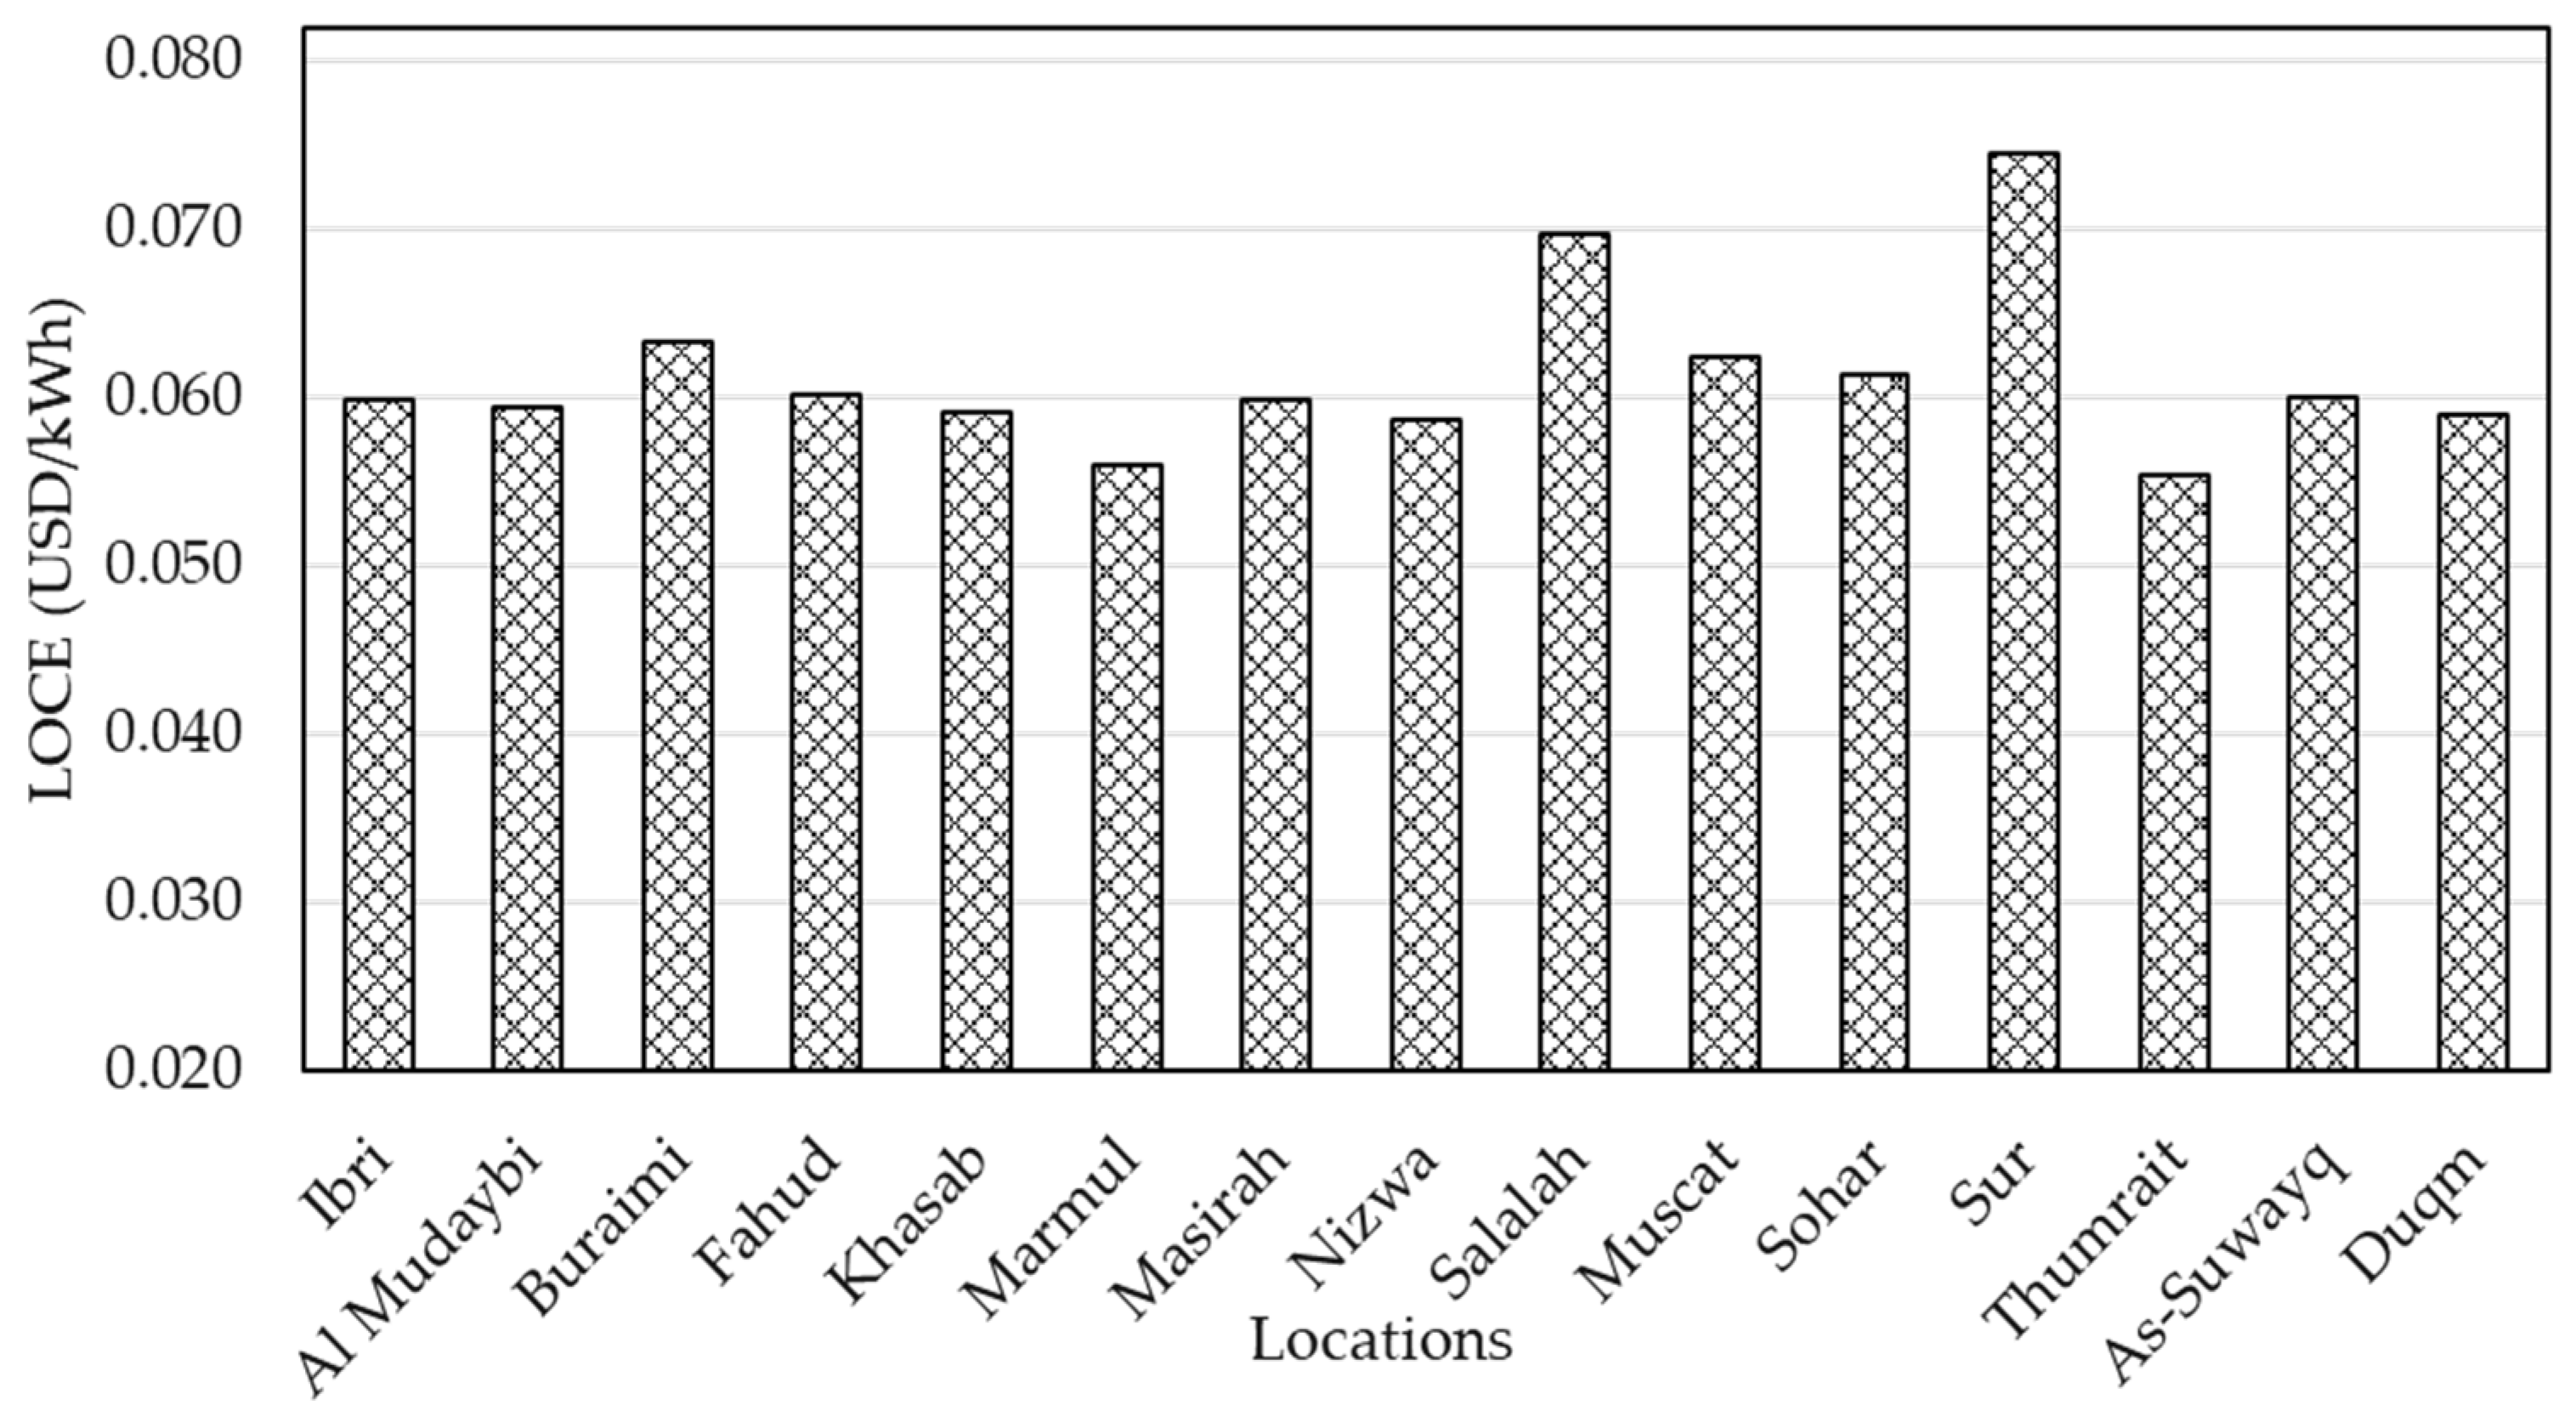
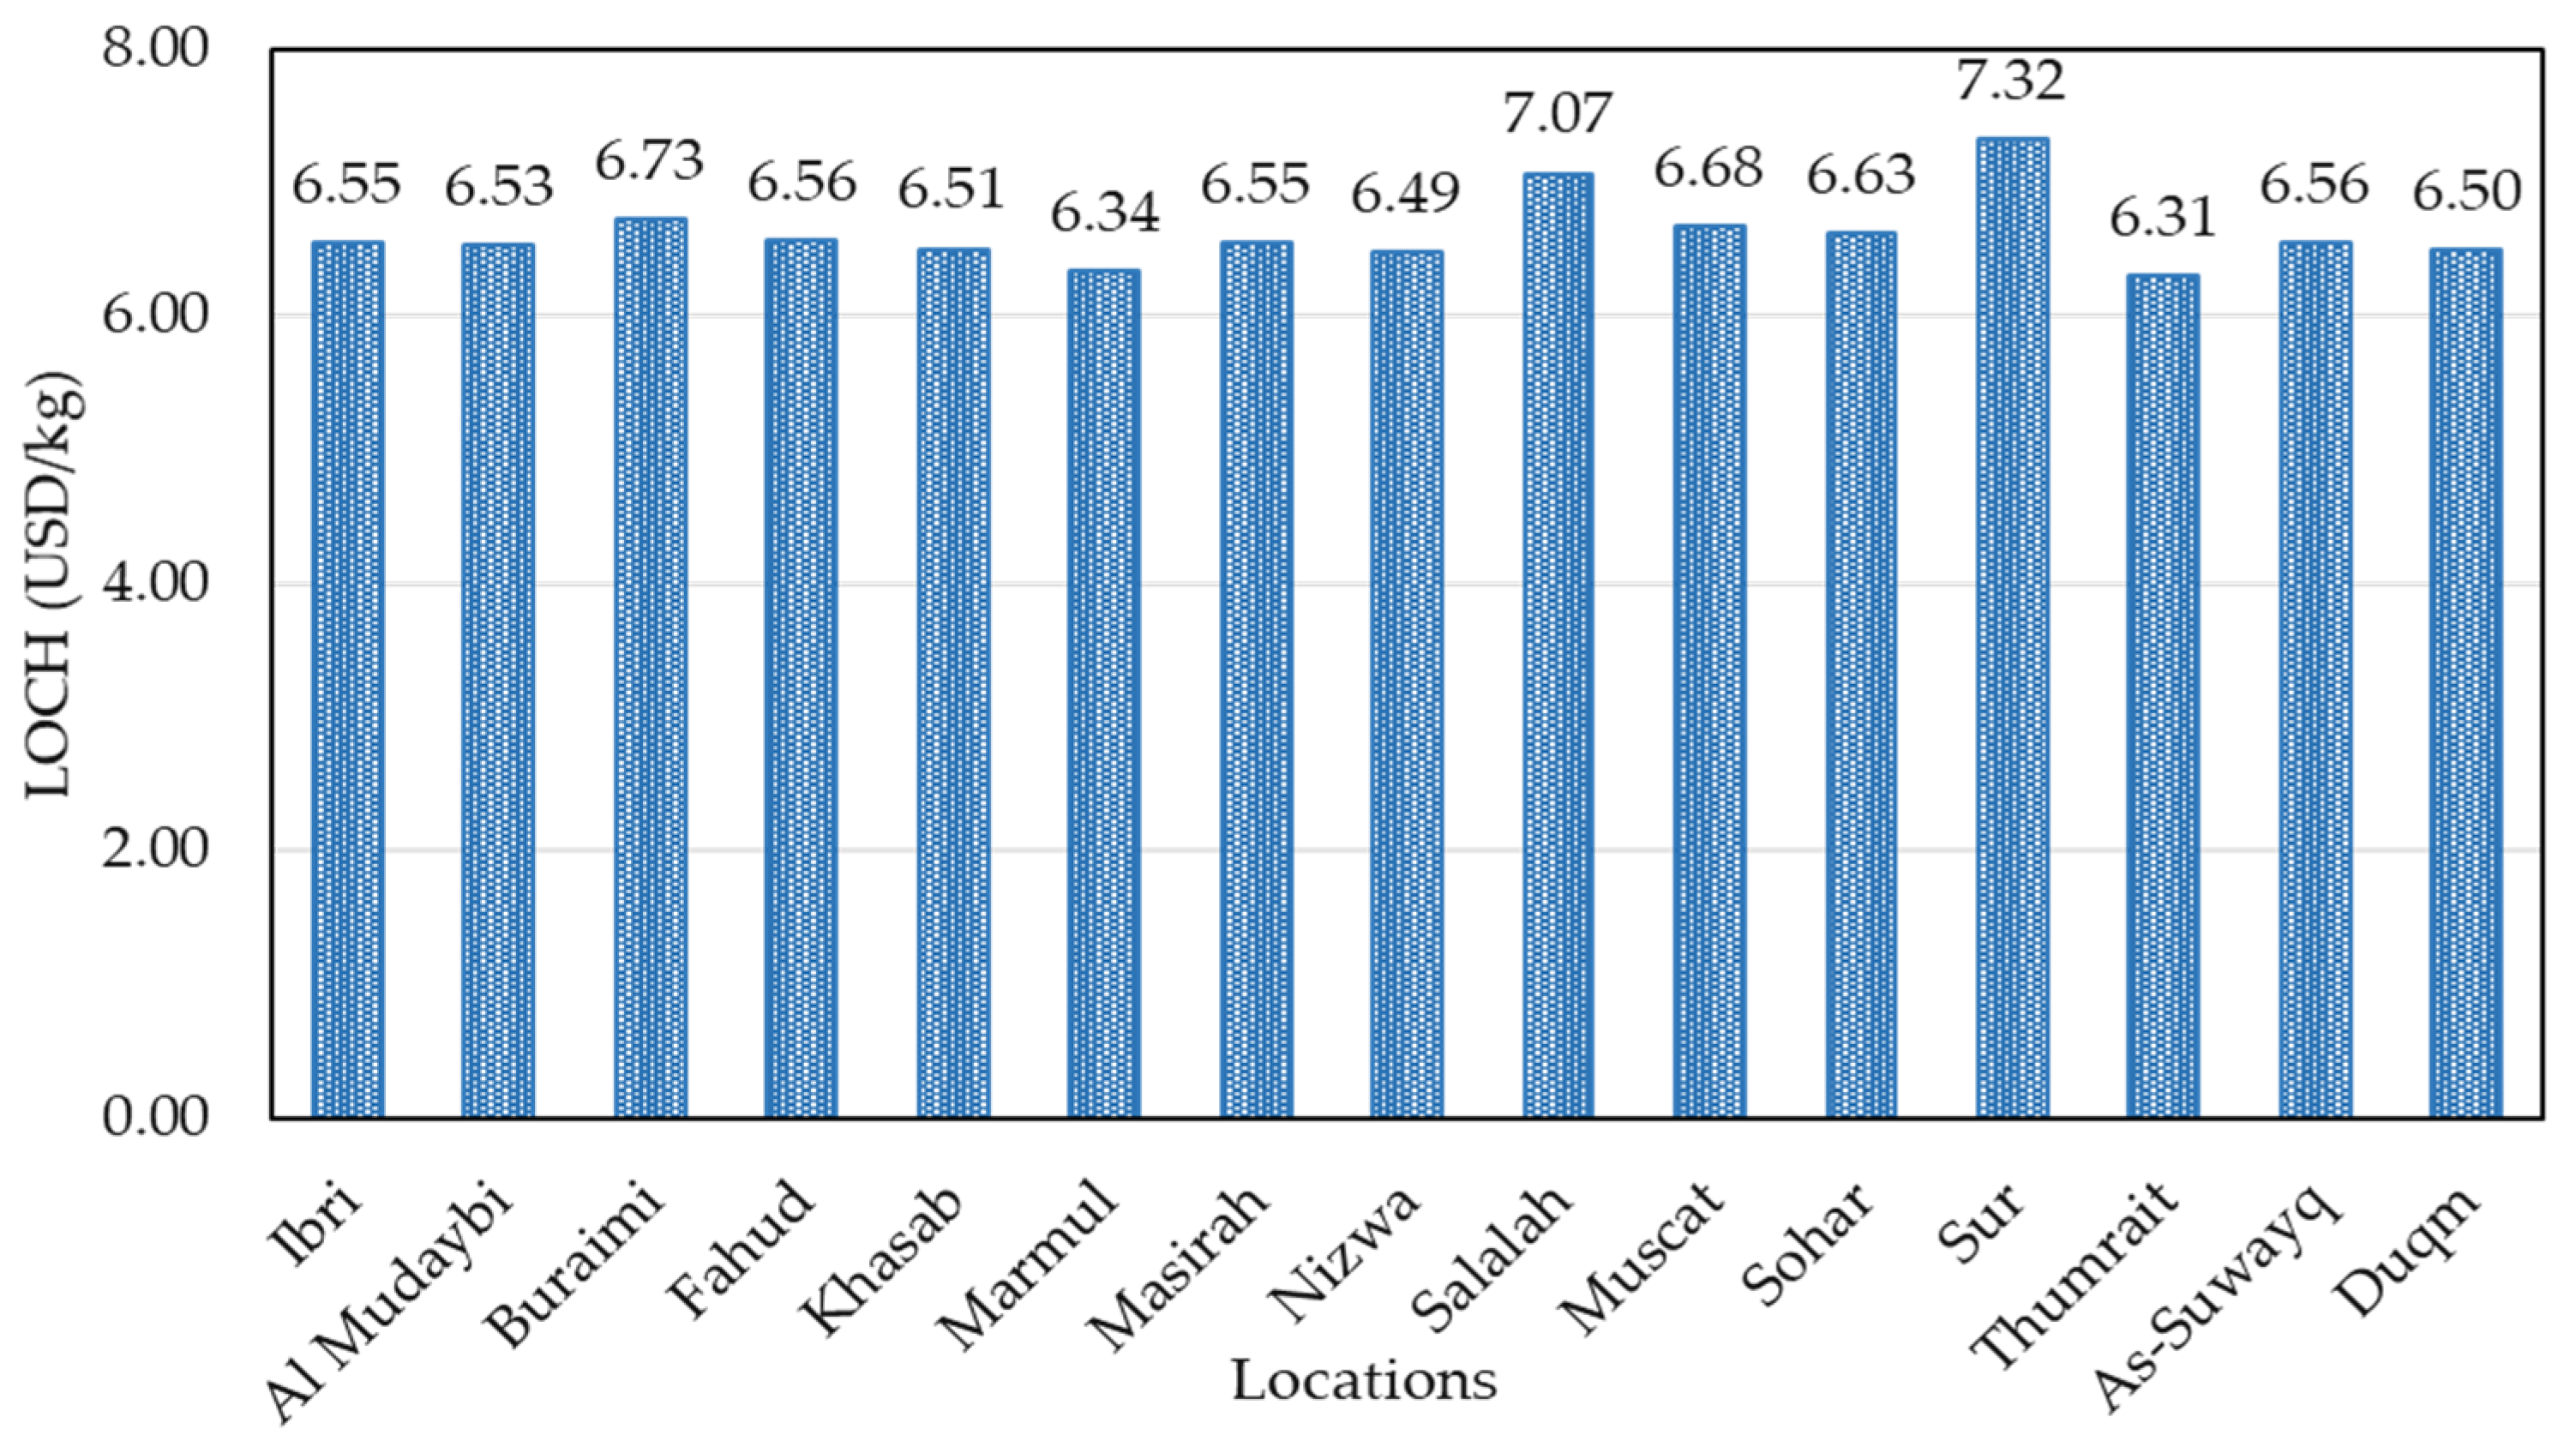
3.3. Economic Analysis
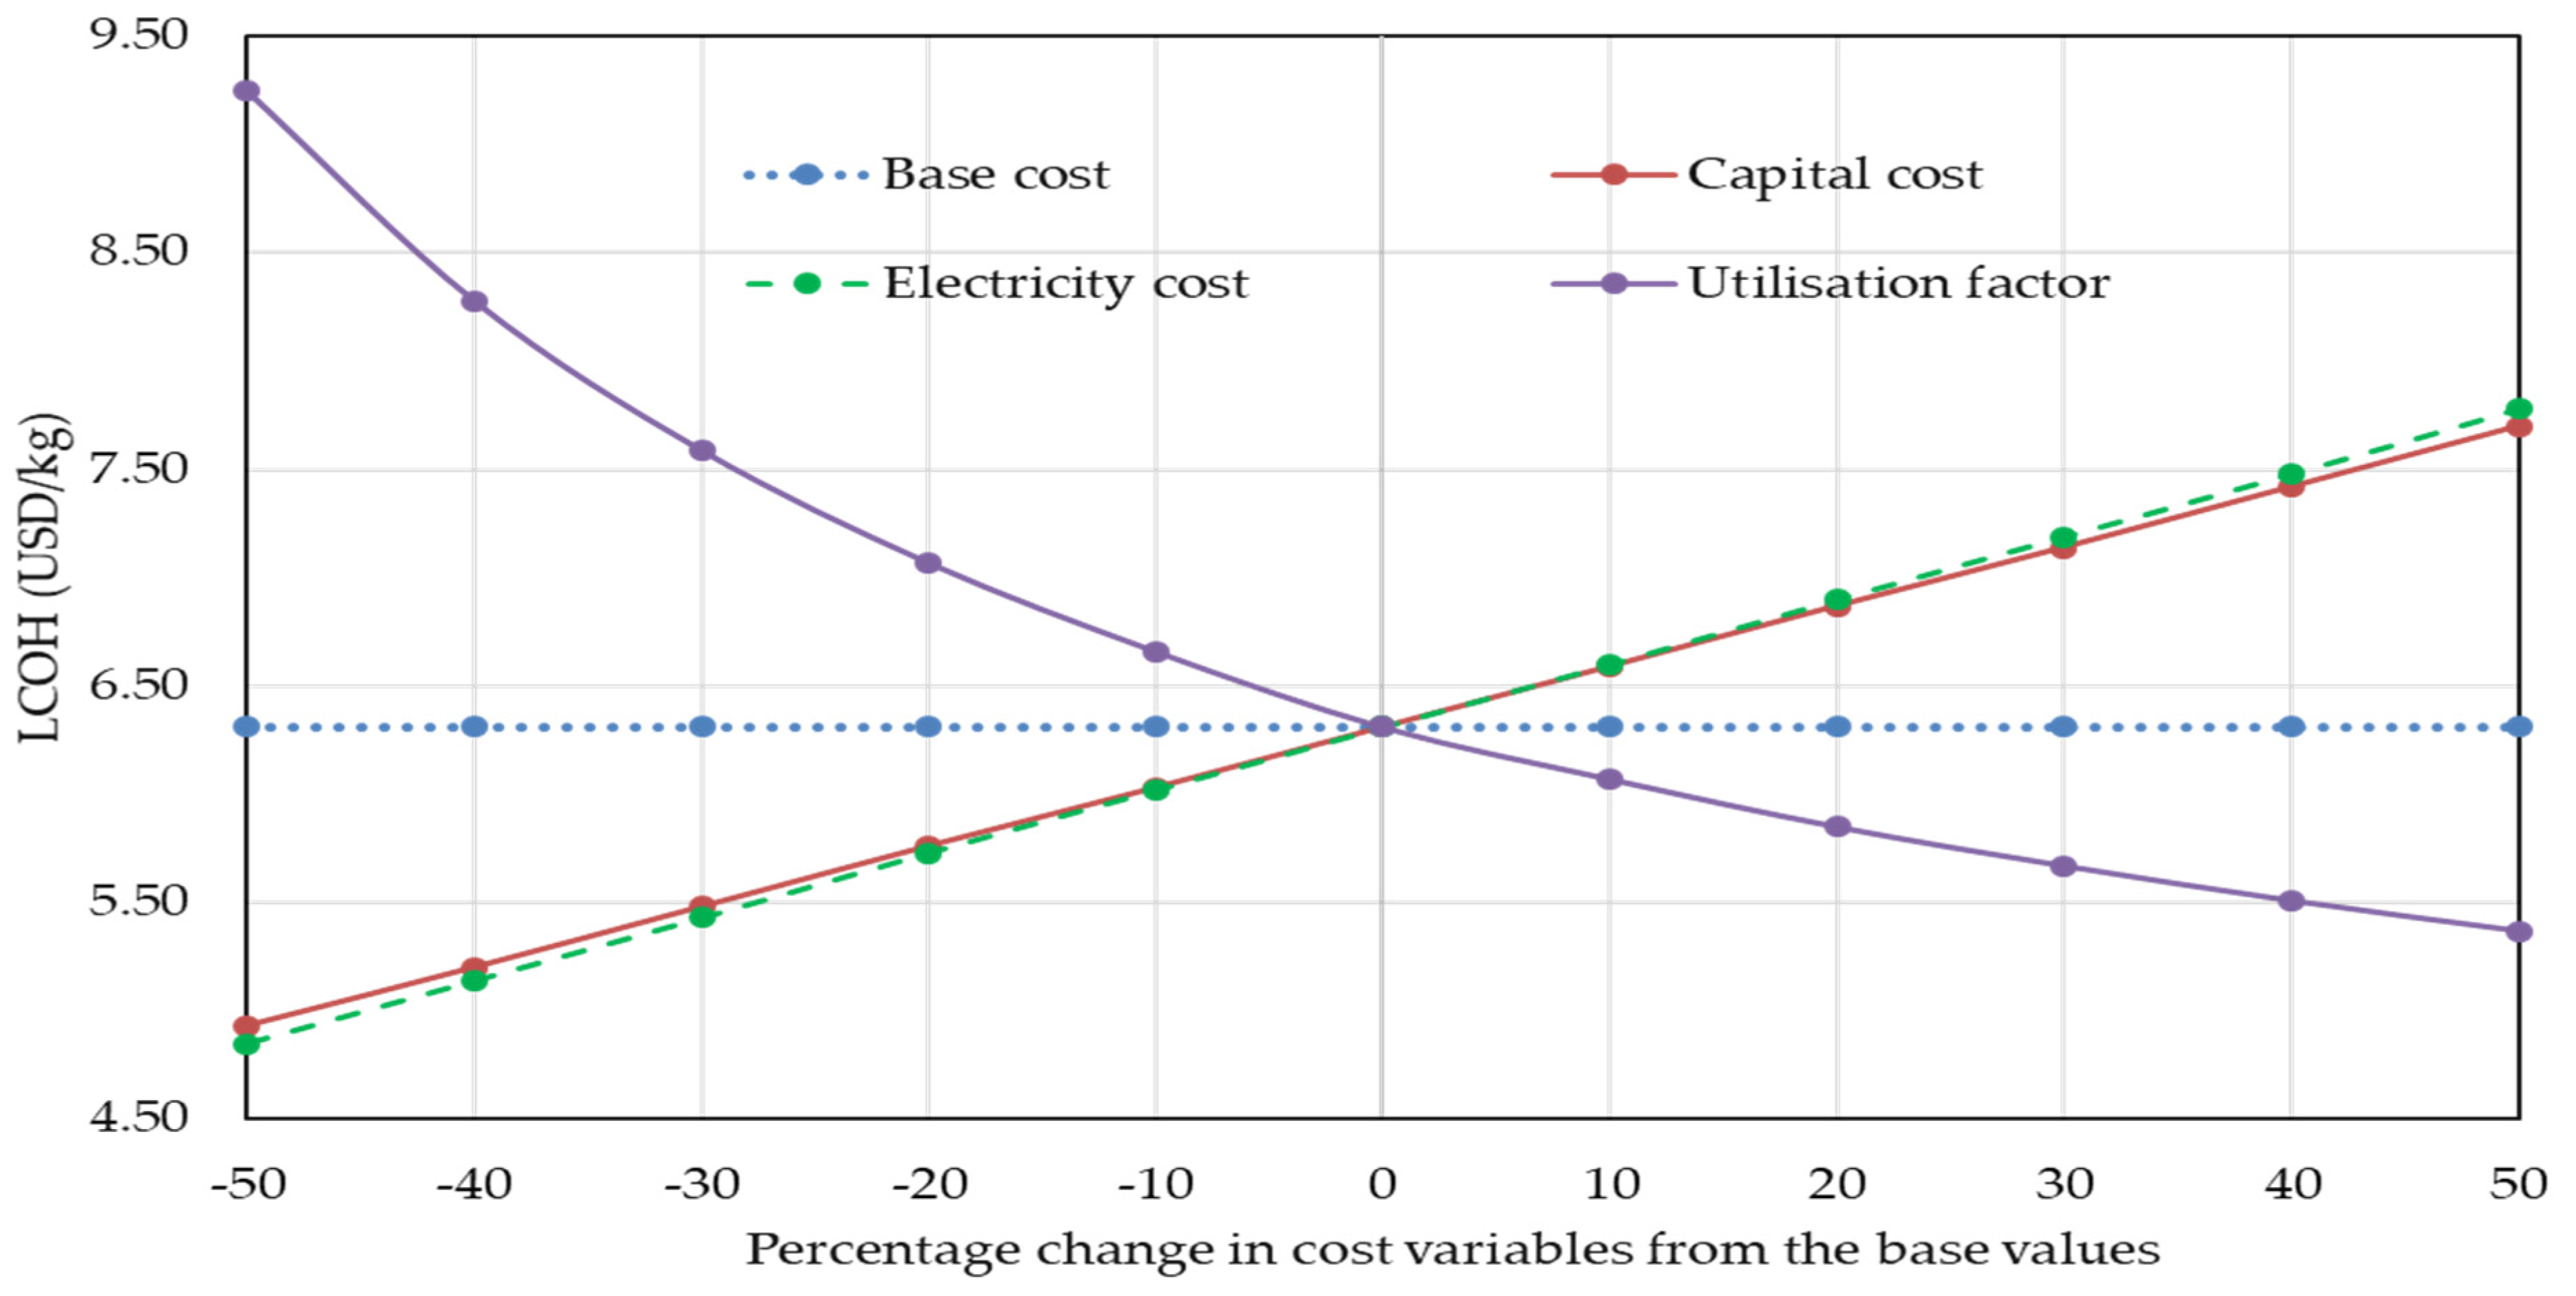
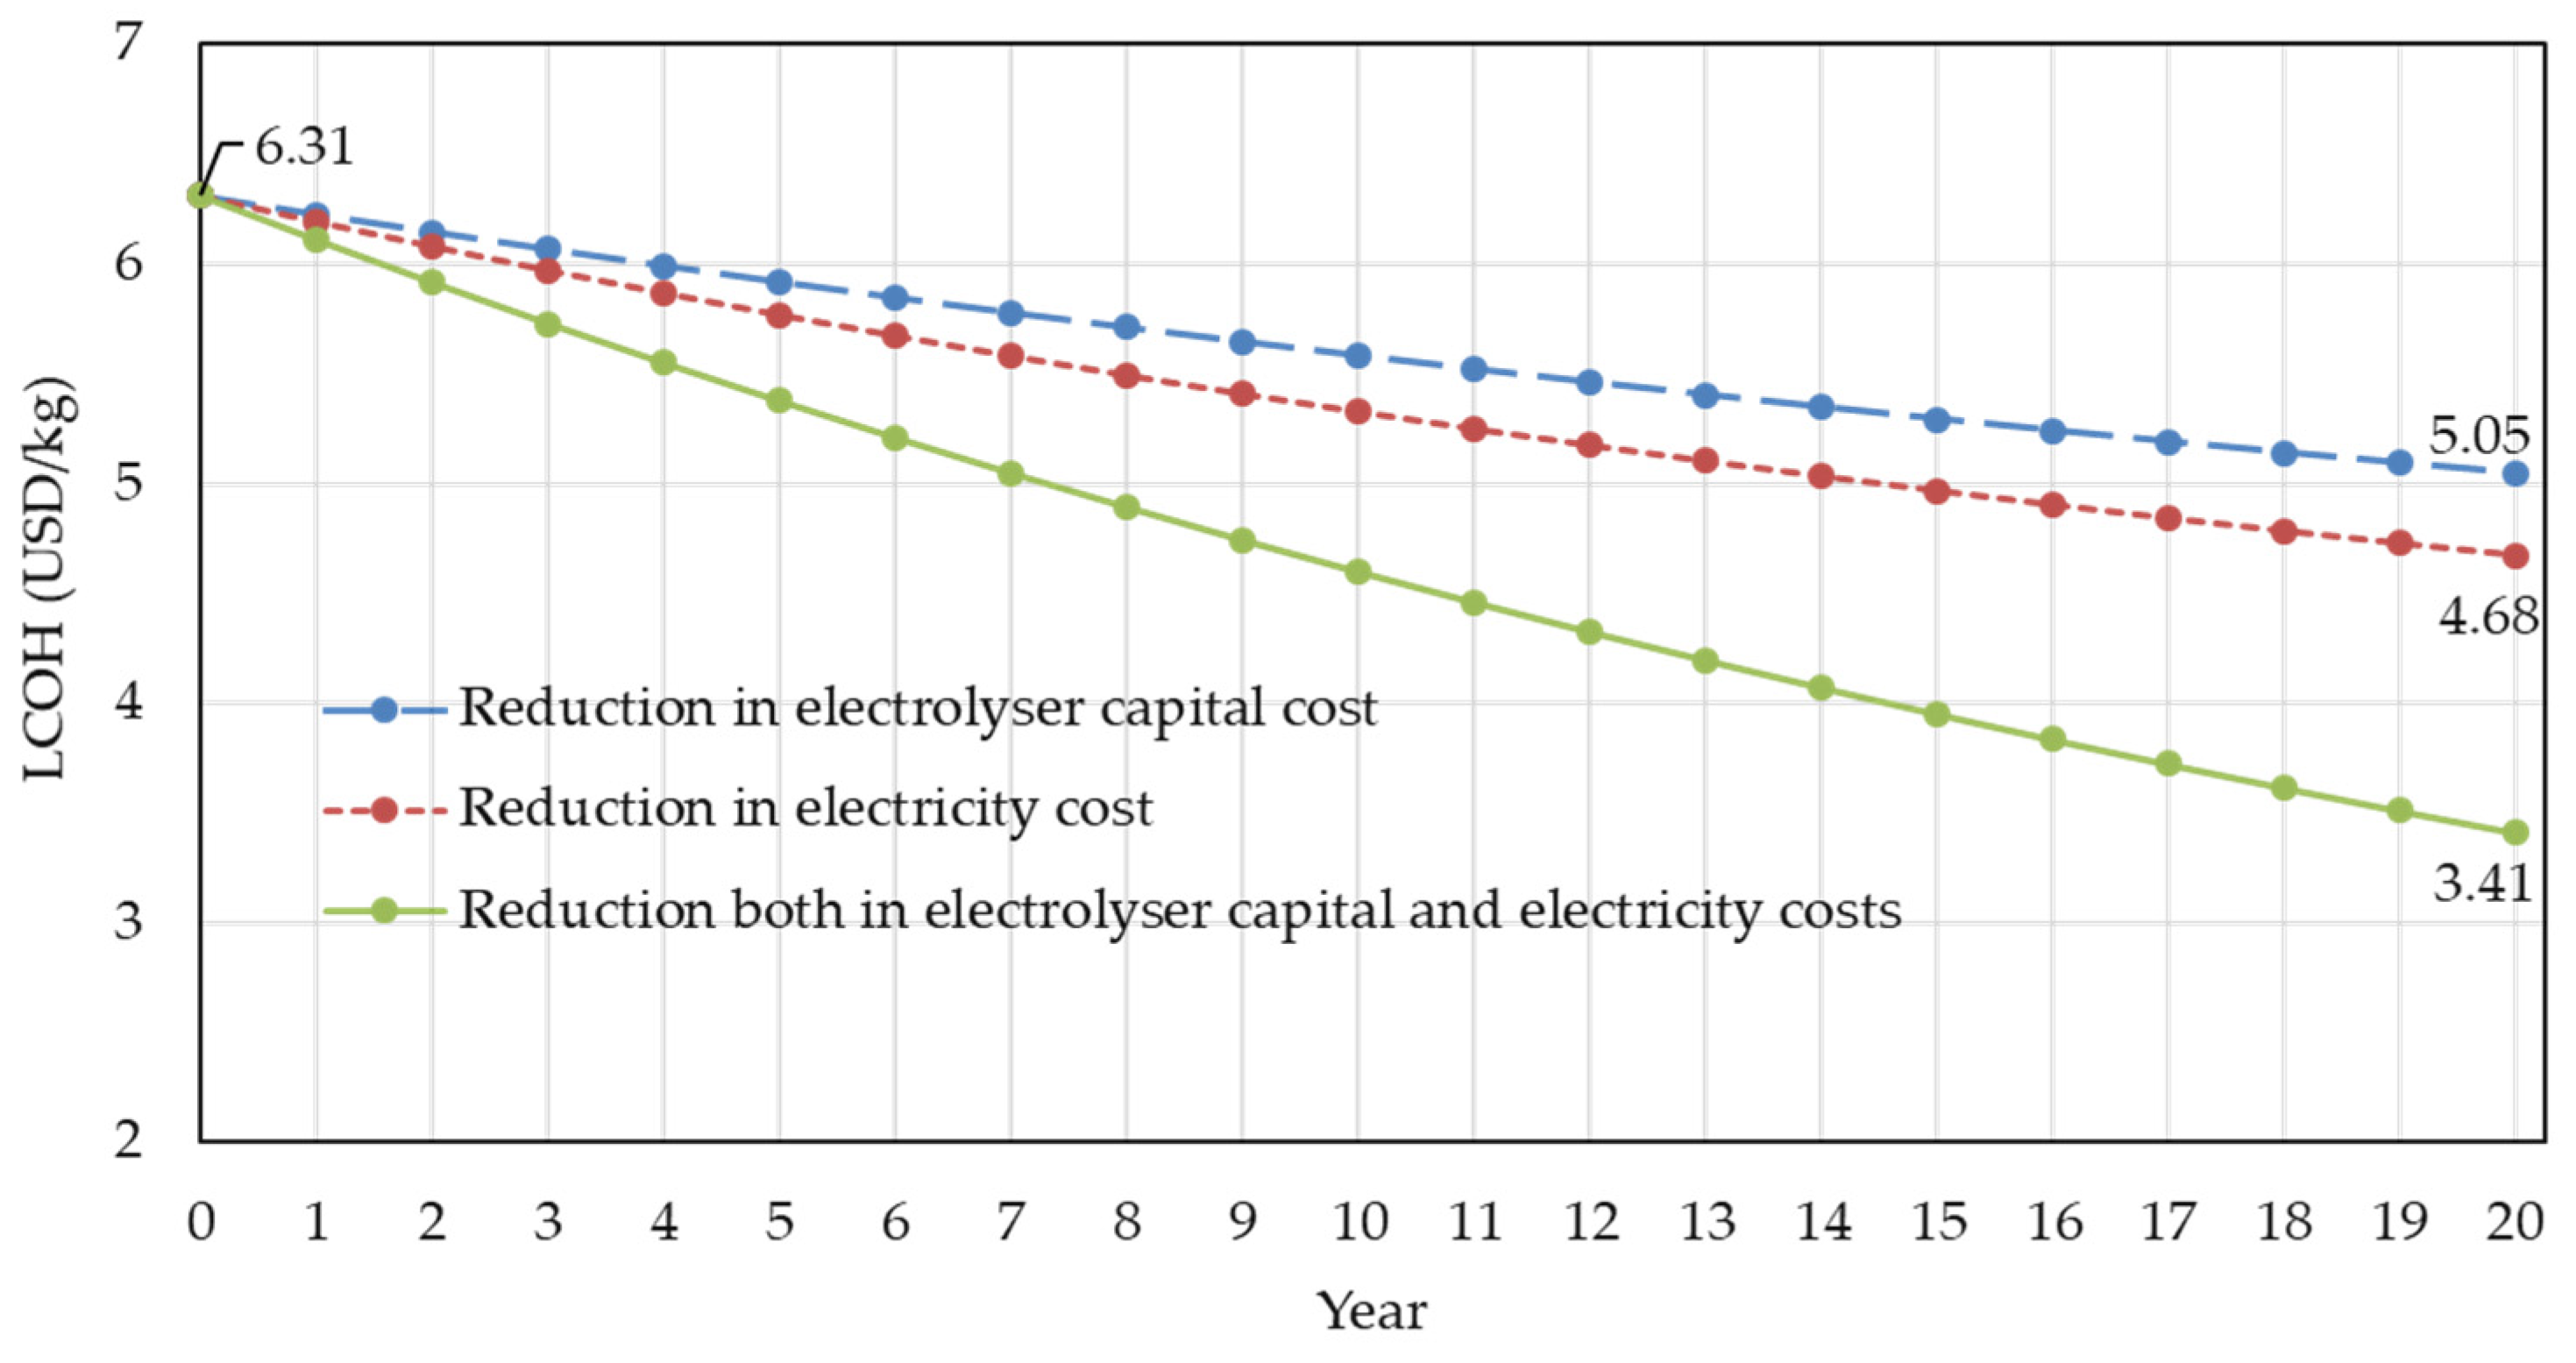
3.4. Sensitivity Analysis
3.5. Technology Adoption Factors and Environmental Impact
4. Conclusions
Funding
Institutional Review Board Statement
Informed Consent Statement
Data Availability Statement
Conflicts of Interest
References
- Renewable Capacity Statistics 2021. Available online: https://www.irena.org/publications/2021/March/Renewable-Capacity-Statistics-2021 (accessed on 4 June 2021).
- Behabtu, H.A.; Messagie, M.; Coosemans, T.; Berecibar, M.; Anlay Fante, K.; Kebede, A.A.; Mierlo, J.V. A Review of Energy Storage Technologies’ Application Potentials in Renewable Energy Sources Grid Integration. Sustainability 2020, 12, 10511. [Google Scholar] [CrossRef]
- Hydrogen Insights: A Perspective on Hydrogen Investment, Market Development and Cost Competitiveness February 2021. Available online: https://hydrogencouncil.com/wp-content/uploads/2021/02/Hydrogen-Insights-2021-Report.pdf (accessed on 5 June 2021).
- Path to Hydrogen Competitiveness: A Cost Perspective, 20 January 2020. Available online: https://hydrogencouncil.com/en/path-to-hydrogen-competitiveness-a-cost-perspective (accessed on 5 June 2021).
- Hossain, E.; Petrovic, S. Renewable Energy Crash Course: A Concise Introduction, 1st ed.; Springer International Publishing: Basel, Switzerland, 2021. [Google Scholar]
- Qazi, A.; Hussain, F.; Rahim, N.A.; Hardaker, G.; Alghazzawi, D.; Shaban, K.; Haruna, K. Towards Sustainable Energy: A Systematic Review of Renewable Energy Sources, Technologies, and Public Opinions. IEEE Access 2019, 7, 63837–63851. [Google Scholar] [CrossRef]
- IRENA (2020), Renewable Power Generation Costs in 2019, International Renewable Energy Agency, Abu Dhabi. Available online: https://www.irena.org/publications/2020/Jun/Renewable-Power-Costs-in-2019 (accessed on 27 August 2020).
- Al-Badi, A.H.; Malik, A.; Gastli, A. Sustainable energy usage in Oman-opportunities and Barriers. Renew. Sustain. Energy Rev. 2011, 15, 3780–3788. [Google Scholar] [CrossRef]
- Ahshan, R.; Shafiq, M.; Hosseinzadeh, N.; Al-Badi, A. Distributed wind systems for moderate wind speed sites. In Proceedings of the 2018 5th International Conference on Renewable Energy: Generation and Applications (ICREGA), Al Ain, United Arab Emirates, 25–28 February 2018; Institute of Electrical and Electronics Engineers (IEEE), 2018; pp. 1–5. [Google Scholar]
- Ahshan, R.; Al-Badi, A.; Hosseinzadeh, N.; Shafiq, M. Small Wind Turbine Systems for Application in Oman. In Proceedings of the 2018 5th International Conference on Electric Power and Energy Conversion Systems (EPECS), Kitakyushu, Japan, 23–25 April 2018; Institute of Electrical and Electronics Engineers (IEEE), 2018; pp. 1–6. [Google Scholar]
- Gastli, A.; Charabi, Y. Solar electricity prospects in Oman using GIS-based solar radiation maps. Renew. Sustain. Energy Rev. 2010, 14, 790–797. [Google Scholar] [CrossRef]
- OPWP’s 7 Year Statement 2018–2024, Issue-12. 2018. Available online: https://www.omanpwp.om/PDF/7%20Year%20Statement%20Issue%2012%202018-2024.pdf (accessed on 24 May 2021).
- Hydrogen from Renewable Power: Technology Outlook for the Energy Transition. Available online: https://www.irena.org/media/Files/IRENA/Agency/Publication/2018/Sep/IRENA_Hydrogen_from_renewable_power_2018.pdf (accessed on 5 June 2021).
- Van de Graaf, T.; Overland, I.; Scholten, D.; Westphal, K. The new oil? The geopolitics and international governance of hydrogen. Energy Res. Soc. Sci. 2020, 70, 101667. [Google Scholar] [CrossRef]
- Noussan, M.; Raimondi, P.; Scita, R.; Hafner, M. The Role of Green and Blue Hydrogen in the Energy Transition—A Technological and Geopolitical Perspective. Sustainability 2020, 13, 298. [Google Scholar] [CrossRef]
- Sun, P.; Elgowainy, A. Updates of Hydrogen Production from SMR Process in GREET ® 2019. Argonne National Laboratory. 2019. Available online: https://greet.es.anl.gov/publication-smr_h2_2019 (accessed on 9 August 2021).
- Soltani, R.; Rosen, M.; Dincer, I. Assessment of CO2 capture options from various points in steam methane reforming for hydrogen production. Int. J. Hydrogen Energy 2014, 39, 20266–20275. [Google Scholar] [CrossRef]
- Khan, M.H.A.; Daiyan, R.; Neal, P.; Haque, N.; MacGill, I.; Amal, R. A framework for assessing economics of blue hydrogen production from steam methane reforming using carbon capture storage & utilization. Int. J. Hydrogen Energy 2021, 46, 22685–22706. [Google Scholar]
- Blue Hydrogen Production Should Be Restricted due to Associated Emissions and High Costs. Available online: https://www.rechargenews.com/energy-transition/blue-hydrogen-production-should-be-restricted-due-to-associated-emissions-and-high-costs/2-1-990584 (accessed on 9 August 2021).
- Yodwong, B.; Guilbert, D.; Phattanasak, M.; Kaewmanee, W.; Hinaje, M.; Vitale, G. AC-DC Converters for Electrolyzer Applications: State of the Art and Future Challenges. Electronics 2020, 9, 912. [Google Scholar] [CrossRef]
- Lettenmeier, P. Efficiency-Electrolysis: White Paper. 2019. Available online: https://assets.new.siemens.com/siemens/assets/api/uuid:139de890-44e1-453b-8176-c3d45c905178/white-paper-efficiency-en.pdf (accessed on 7 June 2021).
- Mohammadi, A.; Mehrpooya, M. A comprehensive review on coupling different types of electrolyzer to renewable energy sources. Energy 2018, 158, 632–655. [Google Scholar] [CrossRef]
- Genç, G.; Çelik, M.; Serdar Genç, M. Cost analysis of wind-electrolyzer-fuel cell system for energy demand in Pnarbaş-Kayseri. Int. J. Hydrogen Energy 2012, 37, 12158–12166. [Google Scholar] [CrossRef]
- Genç, M.S.; Çelik, M.; Karasu, I. A review on wind energy and wind–hydrogen production in Turkey: A case study of hydrogen production via electrolysis system supplied by wind energy conversion system in Central Anatolian Turkey. Renew. Sustain. Energy Rev. 2012, 16, 6631–6646. [Google Scholar] [CrossRef]
- Loisel, R.; Baranger, L.; Chemouri, N.; Spinu, S.; Pardo, S. Economic evaluation of hybrid off-shore wind power and hydrogen storage system. Int. J. Hydrogen Energy 2015, 40, 6727–6739. [Google Scholar] [CrossRef]
- Manage, M.; Hodgson, D.; Milligan, N.; Simons, S.; Brett, D. A techno-economic appraisal of hydrogen generation and the case for solid oxide electrolyser cells. Int. J. Hydrogen Energy 2011, 36, 5782–5796. [Google Scholar] [CrossRef]
- Power2Hydrogen: Electrolysis, Silyzer. 2019. Available online: https://assets.new.siemens.com/siemens/assets./api/uuid:33ef5476-2a47-4421-802be48564d210ac/version:1595233590/2019-10-23-power2x-silyzer-gernot-schneider.pdf (accessed on 7 June 2021).
- Wilberforce, T.; Olabi, A.G. Performance Prediction of Proton Exchange Membrane Fuel Cells (PEMFC) Using Adaptive Neuro Inference System (ANFIS). Sustaininability 2020, 12, 4952. [Google Scholar] [CrossRef]
- Pascuzzi, S.; Anifantis, A.S.; Blanco, I.; Mugnozza, G.S. Electrolyzer Performance Analysis of an Integrated Hydrogen Power System for Greenhouse Heating. A Case Study. Sustaininability 2016, 8, 629. [Google Scholar] [CrossRef] [Green Version]
- Viktorsson, L.; Heinonen, J.T.; Skulason, J.B.; Unnthorsson, R. A Step towards the Hydrogen Economy—A Life Cycle Cost Analysis of A Hydrogen Refueling Station. Energies 2017, 10, 763. [Google Scholar] [CrossRef]
- Aiche-Hamane, L.; Belhamel, M.; Benyoucef, B.; Hamane, M. Feasibility study of hydrogen production from wind power in the region of Ghardaia. Int. J. Hydrogen Energy 2009, 34, 4947–4952. [Google Scholar] [CrossRef]
- Ulleberg, Ø.; Nakken, T.; Eté, A. The wind/hydrogen demonstration system at Utsira in Norway: Evaluation of system performance using operational data and updated hydrogen energy system modeling tools. Int. J. Hydrogen Energy 2010, 35, 1841–1852. [Google Scholar] [CrossRef]
- Geer, T.; Manwell, J.F.; McGowan, G. A Feasibility Study of a Wind/Hydrogen System for Martha’s Vineyard, Massachusetts. In Proceedings of the American Wind Energy Association Windpower 2005 Conference, Denver, CO, USA, 15–16 May 2005. [Google Scholar]
- Olateju, B.; Kumar, A. Hydrogen production from wind energy in Western Canada for upgrading bitumen from oil sands. Energy 2011, 36, 6326–6339. [Google Scholar] [CrossRef]
- Nadaleti, W.C.; dos Santos, G.B.; Lourenço, V. The potential and economic viability of hydrogen production from the use of hydroelectric and wind farms surplus energy in Brazil: A national and pioneering analysis. Int. J. Hydrogen Energy 2020, 45, 1373–1384. [Google Scholar] [CrossRef]
- Menanteau, P.; Quéméré, M.-M.; Le Duigou, A.; Le Bastard, S. An economic analysis of the production of hydrogen from wind-generated electricity for use in transport applications. Energy Policy 2011, 39, 2957–2965. [Google Scholar] [CrossRef] [Green Version]
- Olateju, B.; Kumar, A.; Secanell, M. A techno-economic assessment of large scale wind-hydrogen production with energy storage in Western Canada. Int. J. Hydrogen Energy 2016, 41, 8755–8776. [Google Scholar] [CrossRef]
- Mastropasqua, L.; Pecenati, I.; Giostri, A.; Campanari, S. Solar hydrogen production: Techno-economic analysis of a parabolic dish-supported high-temperature electrolysis system. Appl. Energy 2020, 261, 114392. [Google Scholar] [CrossRef]
- Moser, M.; Pecchi, M.; Fend, T. Techno-Economic Assessment of Solar Hydrogen Production by Means of Thermo-Chemical Cycles. Energies 2019, 12, 352. [Google Scholar] [CrossRef] [Green Version]
- Derbal-Mokrane, H.; Benzaoui, A.; M’Raoui, A.; Belhamel, M. Feasibility study for hydrogen production using hybrid solar power in Algeria. Int. J. Hydrogen Energy 2011, 36, 4198–4207. [Google Scholar] [CrossRef]
- Yates, J.; Daiyan, R.; Patterson, R.; Egan, R.; Amal, R.; Ho-Baille, A.; Chang, N.L. Techno-economic Analysis of Hydrogen Electrolysis from Off-Grid Stand-Alone Photovoltaics Incorporating Uncertainty Analysis. Cell Rep. Phys. Sci. 2020, 1, 100209. [Google Scholar] [CrossRef]
- Gallardo, F.I.; Ferrario, A.M.; Lamagna, M.; Bocci, E.; Garcia, D.A.; Baeza-Jeria, T.E. A Techno-Economic Analysis of solar hydrogen production by electrolysis in the north of Chile and the case of exportation from Atacama Desert to Japan. Int. J. Hydrogen Energy 2021, 46, 13709–13728. [Google Scholar] [CrossRef]
- Gibson, T.; Kelly, N. Optimization of solar powered hydrogen production using photovoltaic electrolysis devices. Int. J. Hydrogen Energy 2008, 33, 5931–5940. [Google Scholar] [CrossRef]
- Levene, J.I.; Mann, M.K.; Margolis, R.M.; Milbrandt, A. An analysis of hydrogen production from renewable electricity sources. Sol. Energy 2007, 81, 773–780. [Google Scholar] [CrossRef]
- Haider, S.A.; Sajid, M.; Iqbal, S. Forecasting hydrogen production potential in islamabad from solar energy using water electrolysis. Int. J. Hydrogen Energy 2021, 46, 1671–1681. [Google Scholar] [CrossRef]
- Parra, D.; Valverde, L.; Pino, F.J.; Patel, M.K. A review on the role, cost and value of hydrogen energy systems for deep decarbonisation. Renew. Sustain. Energy Rev. 2019, 101, 279–294. [Google Scholar] [CrossRef]
- Rahil, A.; Gammon, R. Dispatchable Hydrogen Production at the Forecourt for Electricity Demand Shaping. Sustainability 2017, 9, 1785. [Google Scholar] [CrossRef] [Green Version]
- Ahshan, R.; Al-Abri, R.; Al-Zakwani, H.; Ambu-saidi, N.; Hossain, E. Design and Economic Analysis of a Solar PV System for a Campus Sports Complex. Int. J. Renew. Energy Res. 2020, 10, 67–78. [Google Scholar]
- García, M.A.; Balenzategui, J. Estimation of photovoltaic module yearly temperature and performance based on Nominal Operation Cell Temperature calculations. Renew. Energy 2004, 29, 1997–2010. [Google Scholar] [CrossRef]
- Perez, R.J.E. Analysis of the Levelized Cost of Green Hydrogen Production for Very Heavy Vehicles in New Zealand. Master’s Theses, Victoria University of Wellington, Wellington, New Zealand, 2020. [Google Scholar]
- RETScreen-Climate Database, Managed by CanmetENERGY Varennes Research Centre. Available online: https://www.nrcan.gc.ca/maps-tools-and-publications/tools/modelling-tools/retscreen/7465/ (accessed on 12 April 2021).
- Masters, G.M. Renewable and Efficient Electric Power Systems; John Wiley & Sons: Hoboken, NJ, USA, 2013. [Google Scholar]
- The World’s Most Efficient and Reliable Electrolysers. Available online: https://nelhydrogen.com/water-electrolysers-hydrogen-generators/ (accessed on 13 June 2021).
- Al-Badi, A.H. Performance assessment of 20.4 kW eco-house grid-connected PV plant in Oman. Int. J. Sustain. Eng. 2020, 13, 230–241. [Google Scholar] [CrossRef]
- de Lima, L.C.; Ferreira, L.D.A.; Morais, F.H.B.D.L. Performance analysis of a grid connected photovoltaic system in northeastern Brazil. Energy Sustain. Dev. 2017, 37, 79–85. [Google Scholar] [CrossRef]
- Attari, K.; Elyaakoubi, A.; Asselman, A. Performance analysis and investigation of a grid-connected photovoltaic installation in Morocco. Energy Rep. 2016, 2, 261–266. [Google Scholar] [CrossRef] [Green Version]
- Padmavathi, K.; Daniel, S.A. Performance analysis of a 3MWp grid connected solar photovoltaic power plant in India. Energy Sustain. Dev. 2013, 17, 615–625. [Google Scholar] [CrossRef]
- Bristowe, G.; Smallbone, A. The Key Techno-Economic and Manufacturing Drivers for Reducing the Cost of Power-to-Gas and a Hydrogen-Enabled Energy System. Hydrogen 2021, 2, 273–300. [Google Scholar] [CrossRef]
- Hossain, E.; Faruque, H.M.R.; Sunny, M.S.H.; Mohammad, N.; Nawar, N. A Comprehensive Review on Energy Storage Systems: Types, Comparison, Current Scenario, Applications, Barriers, and Potential Solutions, Policies, and Future Prospects. Energies 2020, 13, 3651. [Google Scholar] [CrossRef]
- Haszpra, L.; Ferenczi, Z.; Barcza, Z. Estimation of greenhouse gas emission factors based on observed covariance of CO2, CH4, N2O and CO mole fractions. Environ. Sci. Eur. 2019, 31, 1–12. [Google Scholar] [CrossRef]


| Application Sector | Applications |
|---|---|
| Transportation | Compact vehicle for urban transportation; mid-size vehicle with extended range; lightweight truck/van for urban distribution; medium size vehicle with short-range; medium-duty truck for regional haul; regional transportation, such as passenger train, SUV, ferry, and buses. Heavy-duty truck for long haul transportation; large ferries for vehicles and people; vehicles for commercial uses, such as large passenger vehicles, buses for long-range transport, coaches for long-distance transportation; forklift, and synfuels for aviation. |
| Heat and power for buildings | Fuel cell-based combined heat and power (CHP) for old hospitals, old flat city centre, and new houses; hydrogen boilers for the new home, old flat city centre, and old hospitals; hybrid heat pump and boiler; and blended application of hydrogen in natural gas boilers. |
| Heat and power for industry | Fuel cell-based backup and remote power generation; hydrogen furnace for high and medium grade heat; combined cycle hydrogen turbine; and simple cycle hydrogen turbine. |
| Industry feedstock | Low-carbon ammonia generation; refining; low-carbon steel-hydrogen DRI; and methanol production. |
| Mobility | Ships for container, motorbikes, tankers, tractors, off-road applications, fuel cells for airplanes |
| Others | Backup power systems, large-scale CHP for industry, mine apparatus, metals processing (non-DRI steel), etc. |
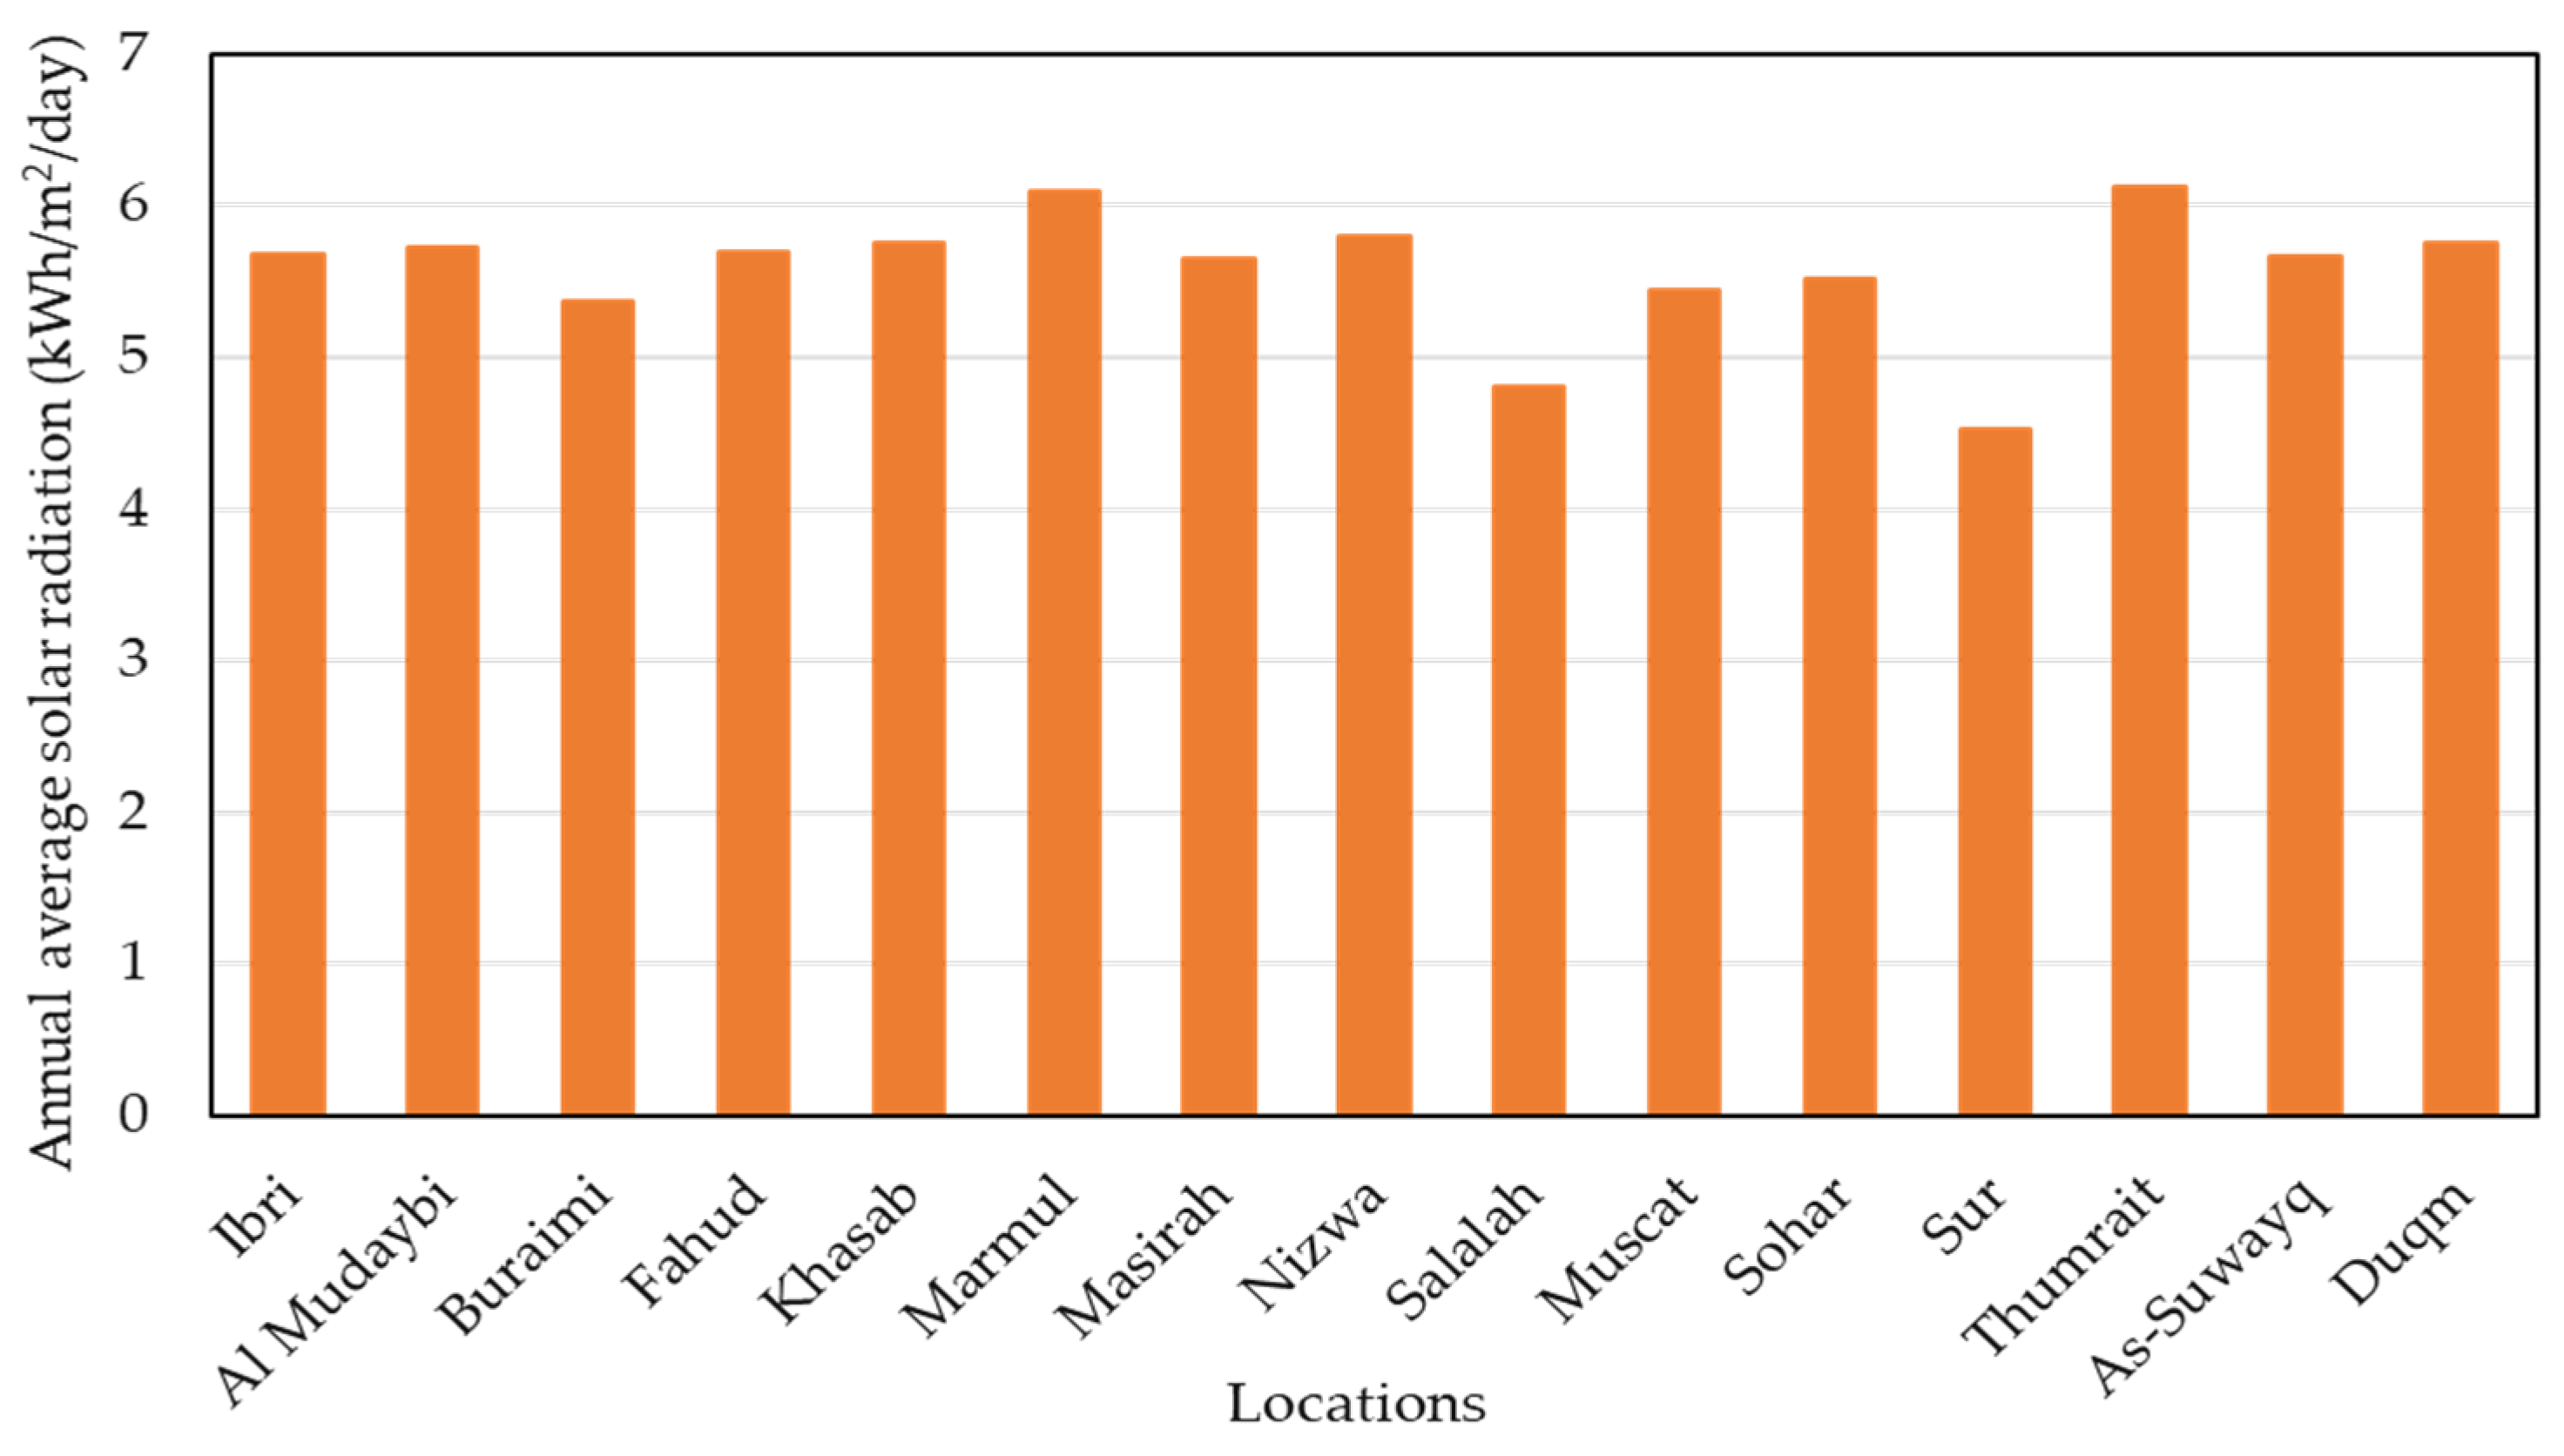
| Site Name | Peak Sun Hour (hours) |
|---|---|
| Ibri | 5.68 |
| Al Mudaybi | 5.72 |
| Buraimi | 5.37 |
| Fahud | 5.69 |
| Khasab | 5.75 |
| Marmul | 6.09 |
| Masirah | 5.65 |
| Nizwa | 5.8 |
| Salalah | 4.8 |
| Muscat | 5.45 |
| Sohar | 5.51 |
| Sur | 4.53 |
| Thumrait | 6.13 |
| As-Suwayq | 5.66 |
| Duqm | 5.76 |
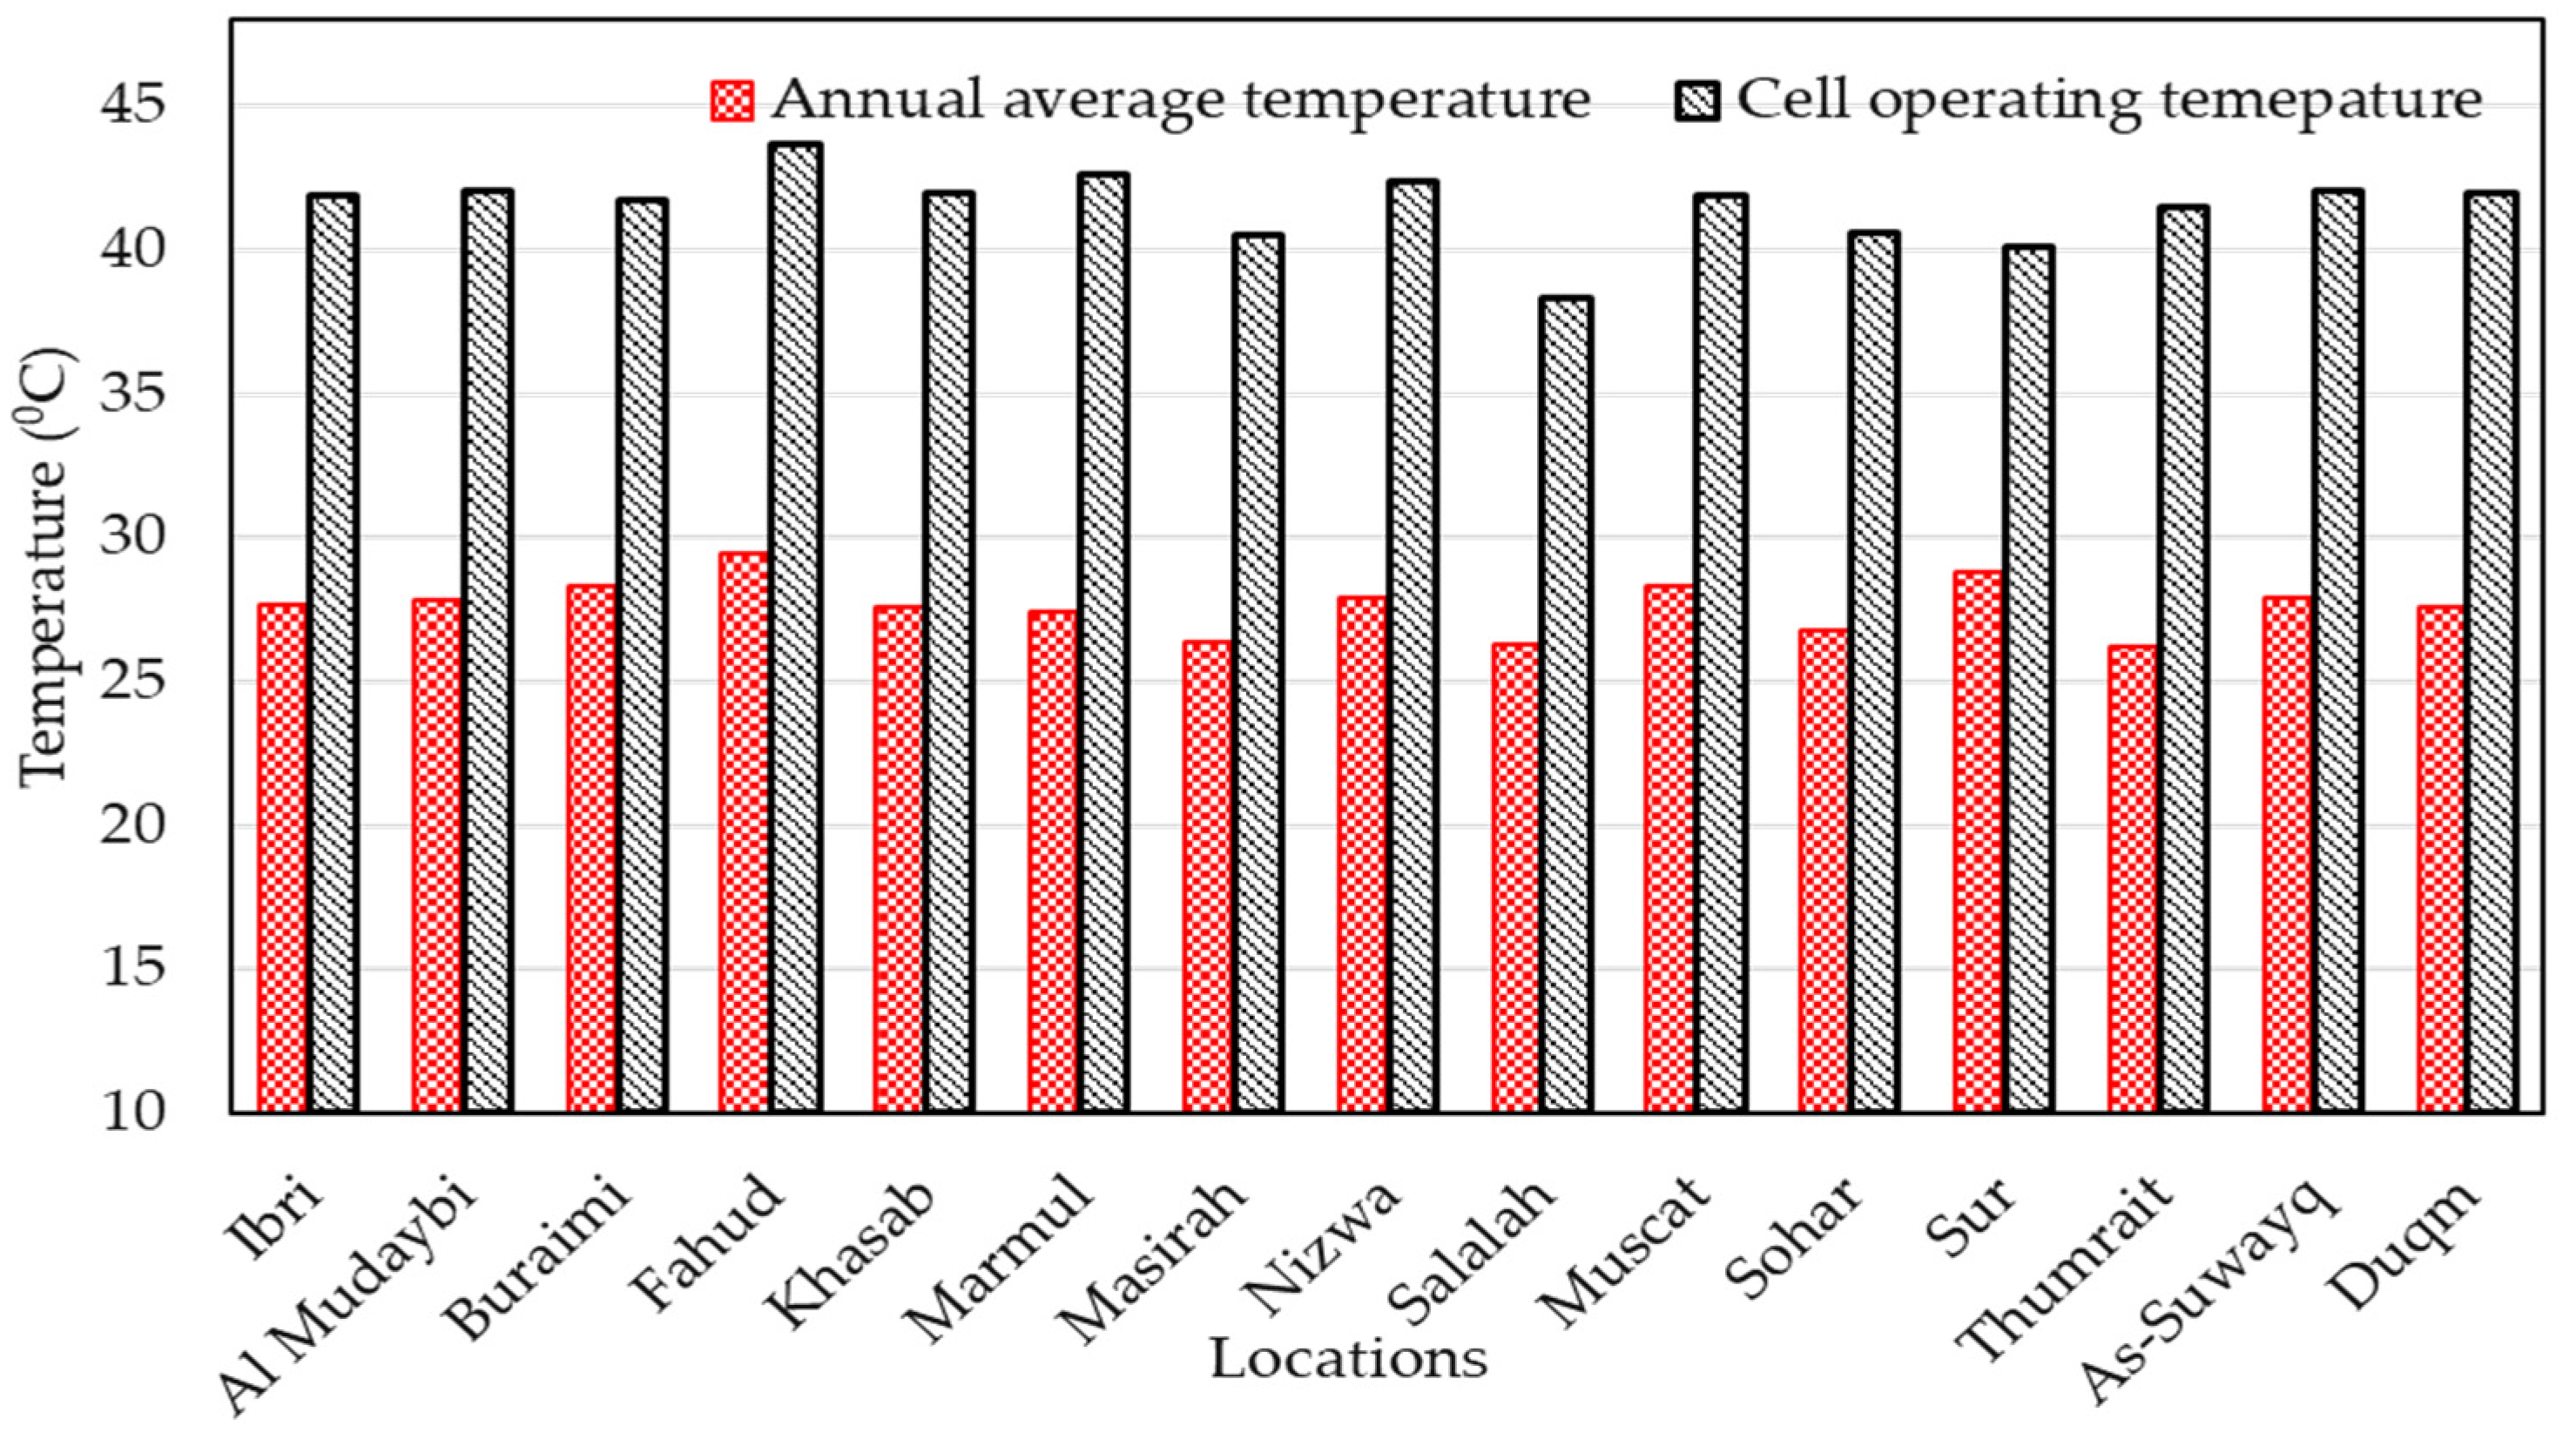
| Rank | Locations | Solar Radiation (kW/m2/day) | Ambient Temperature (°C) | Solar PV Energy Production (MWh/year) | Green Hydrogen Production (kg/year) |
|---|---|---|---|---|---|
| 1 | Thumrait | 6.13 | 26.2 | 3311 | 62,557 |
| 2 | Marmul | 6.09 | 27.4 | 3275 | 61,871 |
| 3 | Nizwa | 5.8 | 27.9 | 3122 | 58,979 |
| 4 | Duqm | 5.76 | 27.56 | 3106 | 58,677 |
| 5 | Khasab | 5.75 | 27.6 | 3100 | 58,572 |
| 6 | Al Mudaybi | 5.72 | 27.8 | 3082 | 58,236 |
| 7 | Masirah | 5.65 | 26.4 | 3064 | 57,892 |
| 8 | Ibri | 5.68 | 27.7 | 3064 | 57,876 |
| 9 | As-Suwayq | 5.66 | 27.9 | 3050 | 57,637 |
| 10 | Fahud | 5.69 | 29.46 | 3046 | 57,558 |
| 11 | Sohar | 5.51 | 26.8 | 2987 | 56,446 |
| 12 | Muscat | 5.45 | 28.3 | 2939 | 55,527 |
| 13 | Buraimi | 5.37 | 28.3 | 2898 | 54,756 |
| 14 | Salalah | 4.8 | 26.3 | 2626 | 49,624 |
| 15 | Sur | 4.53 | 28.8 | 2461 | 46,491 |
Publisher’s Note: MDPI stays neutral with regard to jurisdictional claims in published maps and institutional affiliations. |
© 2021 by the author. Licensee MDPI, Basel, Switzerland. This article is an open access article distributed under the terms and conditions of the Creative Commons Attribution (CC BY) license (https://creativecommons.org/licenses/by/4.0/).
Share and Cite
Ahshan, R. Potential and Economic Analysis of Solar-to-Hydrogen Production in the Sultanate of Oman. Sustainability 2021, 13, 9516. https://doi.org/10.3390/su13179516
Ahshan R. Potential and Economic Analysis of Solar-to-Hydrogen Production in the Sultanate of Oman. Sustainability. 2021; 13(17):9516. https://doi.org/10.3390/su13179516
Chicago/Turabian StyleAhshan, Razzaqul. 2021. "Potential and Economic Analysis of Solar-to-Hydrogen Production in the Sultanate of Oman" Sustainability 13, no. 17: 9516. https://doi.org/10.3390/su13179516
APA StyleAhshan, R. (2021). Potential and Economic Analysis of Solar-to-Hydrogen Production in the Sultanate of Oman. Sustainability, 13(17), 9516. https://doi.org/10.3390/su13179516