Article

A Hybrid Traceability Technology Selection Approach for Sustainable Food Supply Chains

1
Energy, Fluids and Turbomachinery Division, Department of Engineering, University of Cambridge, Cambridge CB2 1PZ, UK
2
School of Agriculture, Food and the Environment, Royal Agricultural University, Gloucestershire GL7 6JS, UK
*
Author to whom correspondence should be addressed.
Sustainability 2021, 13(16), 9385; https://doi.org/10.3390/su13169385
Submission received: 30 June 2021 / Revised: 4 August 2021 / Accepted: 10 August 2021 / Published: 21 August 2021

Abstract

:
Traceability technologies have great potential to improve sustainable performance in cold food supply chains by reducing food loss. In existing approaches, traceability technologies are selected either intuitively or through a random approach, that neither considers the trade-off between multiple cost–benefit technology criteria nor systematically translates user requirements for traceability systems into the selection process. This paper presents a hybrid approach combining the fuzzy Analytic Hierarchy Process (AHP) and Technique for Order Preference by Similarity to Ideal Solution (TOPSIS) with integer linear programming to select the optimum traceability technologies for improving sustainable performance in cold food supply chains. The proposed methodology is applied in four case studies utilising data collected from literature and expert interviews. The proposed approach can assist decision-makers, e.g., food business operators and technology companies, to identify what combination of technologies best suits a given food supply chain scenario and reduces food loss at minimum cost.

1. Introduction

Cold food chains require systematic management of operations and temperature throughout production, processing, and distribution, to assure the quality and safety of perishable food products [1,2]. Failure to effectively manage operations and temperature in the cold chain can affect the freshness and marketability of food by causing excessive ripening, dehydration, softening, color or texture changes and growth of pathogens [3] and can lead to food loss throughout food supply chains (FSCs). Food loss is the main reason for diminishing sustainable performance in cold FSCs, causing significant resource depletion and environmental pollution. Studies [4,5] estimate that globally, 23–24% of total resources including water, land and fertilizers are consumed to produce the lost food that does not reach the consumer, a carbon footprint equivalent to 0.66 Gtonnes CO2 per annum. Despite extensive scientific research and application in practice, cold chain performance can still be improved and there is a pressing need for further investigation to address this issue [6].
Traceability-based cold FSC management has emerged as a popular concept in recent years [7,8]. Traceability necessitates identification and recording of processing information for all product lots or batches in a given process, conceptually known as traceable resource units (TRUs), and sharing of that information as the product (or TRU) moves along the supply chain [9,10]. Traceability is formally enabled by implementing an information system comprising of a wide range of techniques and technologies that reduce food loss through various measures. These include perfect counting of inventories [11]; real time monitoring of the environment and intrinsic product condition [12]; communication of the history and quality of the products [13]; and shelf-life-based product distribution planning [14].
The benefits of traceability technologies in an FSC are not limited only to the maintenance of food quality and safety [8]. Identification traceability technologies, e.g., radio-frequency identification (RFID) and barcodes, linking food products to their producers, packaging, and pallets, reduces the time and effort involved in recalls, leading to a reduction in costs and improvement in the sustainable footprint for FSCs [8,9,15]. Environment monitoring technologies, e.g., wireless sensor network (WSN) and smart packaging indicators (e.g., time/temperature indicators, gas indicators, freshness indicators, and biosensors), not only improve supply chain transparency, but also offer an alternative to the laborious, expensive, and destructive analytical techniques currently applied to food products [16,17].
Technology planning is an important strategic decision that precedes all supply chain operations and must anticipate the costs and benefits of any new implementation [18]. Improper selection of technologies can jeopardize operational performance with subsequent economic loss to the organizations concerned [19] and an environmental impact through poor resource use and allocation. For example, when selecting a suitable RFID variant, consideration should be given to its security criteria. Applications that do not require high security (e.g., automatic identification of inhouse lots or tools) would be made unnecessarily expensive by the incorporation of RFID with cryptological capability. Whereas, in high-security applications (e.g., access control), omission of security criteria can be an expensive oversight if manipulated RFID tags are used to gain access to services without authorization [20]. Therefore, selection of technologies to meet a specific supply chain need requires decision support methods that can consider how various technology alternatives influence a range of performance measures [21,22].
Only a limited number of approaches to select food traceability technologies have been found in the extant literature. Martínez-Sala et al. [23], comparing and contrasting benefits and cost of various technologies, highlight active RFID for automated pallet traceability. However, their approach is completely descriptive rather than quantitative. On the other hand, identifying a set of requirements for real time product monitoring, Qi et al. [24] chose WSN and barcode technologies to match the intended requirements, although no systematic methodology or cost estimation was considered. A more systematic decision tree-based framework considering cost and benefit criteria has been proposed by Óskarsdóttir and Oddsson [8]; however, their framework is more of an intuitive nature rather than quantitative, and seems complex while considering multiple conflicting criteria or selecting a set of technologies for a single case [25]. Thus, a well-organized framework underpinned by quantitative evaluation of cost benefit performance of traceability technologies to match the intended FSC requirement is not reported in the literature, and this presents a research gap.
Multi-criteria decision making (MCDM) provides a normative approach to decision makers for selecting the most suitable technology option characterized by a trade-off among multiple, usually conflicting, criteria [19,26,27]. Efficacy of standard MCDM algorithms, e.g., the Analytic Hierarchy Process (AHP) [28] and the Technique for Order Preference by Similarity to Ideal Solution (TOPSIS), has been proven in various technology evaluation studies such as: logistics information technologies [29], energy technologies [30], additive manufacturing technologies [31], and medical information technologies [32]. For ambiguous, subjective or incomplete technology datasets, fuzzy set theory [33] is often incorporated with both AHP and TOPSIS that cannot be handled with a deterministic approach [26,29]. These methods seem suitable for planning FSC traceability technologies as their associated criteria include both subjective and objective parameters [21]. No study has yet been performed that adopts these techniques in an FSC traceability case scenario [26].
FSC traceability cases can become complex by requiring a set of different technologies and imposing a set of constraints to be complied with by them. For example, the real-time temperature tracking of a low value food item requires a combination of identification and temperature recording technologies that maximizes a measure of total intended benefits while also satisfying the embedded cost constraint. However, conventional MCDM methods are not adequate to fulfil these requirements as they cannot produce combinations of multiple alternatives satisfying the scenario-imposed constraints [34]. To fulfill these requirements, MCDM evaluation of alternatives is followed by a binary integer linear programming (ILP) that can choose a combination from the examined alternatives by assessing the total benefit or cost objective and scenario-imposed constraints using the MCDM scores [34,35]. This type of integrated approach must maintain the consistency of the rankings of technologies obtained in the MCDM stage throughout the final ILP technology selection stage [36].
With these basic premises established, this study aims to develop a new traceability technology selection methodology that can ensure the compatibility of the selected technology or combinations of technologies with FSC case-specific requirements. To that end, a hybrid approach is proposed which integrates standard MCDM methodologies, i.e., fuzzy AHP, fuzzy TOPSIS with ILP, and includes three main phases. The first phase is the Preparatory stage that identifies goals, decision constraints, technology alternatives and evaluation criteria. The next phase is the Technology evaluation stage, where scoring of the technologies is performed with fuzzy AHP and fuzzy TOPSIS. The third phase is the Technology portfolio selection stage that uses ILP to select the best technology portfolio maximizing intended benefits while also satisfying the imposed constraints. To ensure the consistency between the MCDM technology ranking and the final ILP technology selection, we adopted the augmented scoring approach proposed by Tavana et al. [35]. In this study, the proposed methodology has been tested for the four case studies adopted from Óskarsdóttir and Oddsson [8]. Similar to other technology evaluation literature [37], the technology and criteria information we analyzed here has been gathered through an extant literature review followed by expert validation via interviews. The proposed approach can help decision makers to choose the right traceability technologies at the minimum cost for improved cold chain performance. This will increase FSC sustainability by reducing food safety incidents, product recalls and disposals with a direct environmental and economic impact.

2. Traceability Technologies and Selection Criteria

Following an iterative search, content analysis of academic and gray literature, including technology company webpages, datasheets, e-commerce websites [38,39] and expert interviews, this paper captures, analyses and compares generic technology solutions across key selection criteria in the context of sustainable cold FCSs with traceability for identification and temperature monitoring. The comparative analysis of the technology solutions is shown in Table 1 and are briefly discussed below:

2.1. Technologies

Seven main technologies with their respective variability for monitoring identification and environment parameters are assessed in this paper. Among these, paper-based recording is not actually a technology, rather a traceability technique, and is considered in this comparison as it is a default approach for traceability, especially for small and micro-businesses [10]. Barcodes, a commonly used identification technology, consisting of scanning devices and symbology, contains mainly two distinct variations: one-dimensional (1D) and two-dimensional (2D) codes [22,40]. RFID uses radio frequency to identify products and comprises three necessary hardware components: an electronic tag, a reader, and a supervising computer [69]. Among RFID variations, we consider the three major tag energizing categories: passive, semi-passive, and active, and their subsequent alternatives based on tag memory programmability: read-only and read-write, as well as transmission frequencies of LF (low frequency 125/134 KHz), HF (high frequency 13.56 MHz) and UHF (ultra-high frequency 860–960 MHz) [20]. In addition, we consider Near Field Communication (NFC), a variation of HF passive RFID, as well as environment monitoring technologies, WSN and smart packaging indicators. The technology alternatives are briefly discussed below:

2.1.1. Paper-Based Recording

The simplest form of traceability is found as manual documentation of data in pre-printed paper forms [70]. The method involves the writing of every relevant piece of information on paper that follows the flow of material through the supply chain. For effective traceability, the paper documents must be stored and archived in a searchable manner in a timescale that is deemed appropriate by contractual partners.

2.1.2. 1D Barcode

One-dimensional (1D) barcode symbology encodes information into the form of parallel lines, i.e., bars and spaces [67]. Barcodes can be printed on various types of materials and are scanned via special dedicated optical scanners or smartphones with special applications [22,40,71]. Some popular 1D barcode symbology includes: Code 128, Code 93, Code 39, ITF-14, EAN-13, UPC-A, DataBar-14 [21,72]. To avoid unexpected information loss from damaged tags, many 1D barcodes are accompanied with their corresponding alphanumeric codes that are manually readable [40].

2.1.3. 2D Barcode

Two-dimensional (2D) barcodes, possessing higher memory capacity, encrypt more information in the form of matrices of geometric patterns, e.g., rectangles, dots, or hexagons, than their 1D counterpart [21,73]. Available standard 2D barcode symbology includes: Data Matrix, QR code, MaxiCode, and PDF417 [21,72].

2.1.4. RFID Passive LF Read-Only

RFID tags in this category only send information when energized by their readers’ electromagnetic field, as they do not possess their own power source onboard. Due to the low frequency design, they typically operate under a short reading range (i.e., 1–10 cm), requiring insertion or tapping of the tag against the reader with a transmission rate of 8 kbit/s [47,50]. They usually include 64–96b PROM (programmable read-only memory) that contains only the tag identifier (TID), a unique serial number based on ISO/IEC 15963:2009 protocol, permanently embedded by the tag manufacturer [74]. The TID is then used by supply chain operators for identifying an item attaching the tag, which can be read numerous times but cannot be changed [52,60].

2.1.5. RFID Passive LF Read-Write

Read-write passive LF RFID comprises of similar characteristics as read-only passive LF except for memory capacity. Instead of PROM, they include EEPROM (electronically erasable and programmable read-only memory) which users can use to add or modify product data (typically 100,000–1,000,000 times) [52,74]. Based on our e-market survey, a typical passive LF read-write RFID tag possesses 128 b to 256 b memory.

2.1.6. RFID Passive HF Read-Only

Passive HF read-only RFID possesses similar technical characteristics as passive LF read-only, except for their frequency band, resulting in a higher reading range and reading speed. The near-field inductive coupling transmission principle is used in HF RFIDs with a typical read range of up to 1 m and reading speed of 105.9 kb/s [56].

2.1.7. RFID Passive HF Read-Write

Read-write passive HF RFID comprises similar characteristics to their read-write passive LF counterparts, except for the frequency range used. Due to the HF transmission band, they can operate up to a 1 m reading range with 105.9 kb/s data rate [56]. Due to having a higher data rate than LF, these RFIDs are normally provided with higher data memory that falls within 256 b to 1024 b, according to our e-market survey.

2.1.8. RFID Passive HF with Sensor

Some passive HF read-write RFID tags are implanted with low power sensors for recording parameters, e.g., temperature. Due to the RF signal being consumed by these sensors, the tag operation requires a closer reading range than the typical HF RFIDs without sensors [20].

2.1.9. RFID Passive UHF Read Only

Passive UHF read-only RFID possesses similar technical criteria as passive LF and HF read-only, except for their operating frequency band, resulting in a higher reading range and reading speed. A passive UHF RFID system, using backscatter coupling, can transmit data between its tag and reader at a distance up to 9 m with a 40–640 kb/s data transmission speed [47,60].

2.1.10. RFID Passive UHF Read-Write

Passive UHF read-write RFID possesses similar reading range and reading speed as the passive UHF read-only. Like read-write categories under LF and HF bands, these RFIDs contain EEPROM that can be used for multiple writing cycles [52]. As is seen in e-market webpages, these RFIDs possess 256 b to 8 kb memory.

2.1.11. RFID Passive UHF with Sensor

UHF passive read-write RFIDs can also be embedded with sensors for measuring temperature, but at the expense of their reading range [75,76].

2.1.12. Semi-Passive RFID

Semi-passive transponders, despite having onboard batteries, transmit data by harvesting energy from readers [20,48]. The on-tag batteries enable them to accommodate a wider range of sensors and GPS, and they provide a slightly longer reading range while operating at the same passive UHF band 860–960 MHz [3,20,75]. These tags can be programmed to record the required product data either on command or at specified time intervals [61].

2.1.13. Active RFID

The active transponders, having an active transmitter and often also a high-quality receiver, transfer data to the reader, using their own battery, by emitting a high-frequency electromagnetic field at 433.04–434.79 MHz [21]. Due to this high transmitting power, active RFID can offer the highest data transfer speed and longest reading range of up to 100 m [20,49]. Similar to semi-passive, active RFID tags can also be equipped with various sensors and GPS technologies for real time monitoring [20,77].

2.1.14. NFC

NFC is a subgroup of HF RFID, thus operating in the RF band of 13.56 MHz, and supports data rates of 105.9 kb/s [78]. NFC tags do not need a dedicated reader; rather, they can be read by any smartphone with near-field communication capability [79]. Like RFID, multiple NFC tags can be read at a time and are capable of read-write programmability [62].

2.1.15. WSN

WSN refers to a network of spatially dispersed and dedicated sensors that collect data on various physical or environmental parameters and communicate them to a database server through a base station or central node, using a network, e.g., GPRS (General Packet Radio Service) [52,80]. WSNs can be built of numerous nodes and each node consists of radio transceivers, microcontrollers, memory capacity, an energy source, and sensors [62]. WSN offers a high contactless reading speed, but is not suitable for identification purposes like RFIDs [64,80,81].

2.1.16. Smart Packaging Indicator

Smart packaging indicators are made with various sensors to convey information regarding the history of the package and/or the quality of the food [13,16,68]. These indicators can convey either qualitative information, e.g., electric, or colorimetric responses, or quantitative data, e.g., time–temperature history or shelf-life characteristics [13]. In this paper we gather data on the time–temperature indicator (TTI), a specific smart packaging indicator that records temperature and/or indicates the influence of temperature on the food quality [68].

2.2. Technology Criteria

Traceability technology selection criteria are scattered throughout the existing literature [8,44,59]. In this section we consolidate the criteria related to sustainable FSCs, namely product identification and temperature monitoring, into a set of seventeen characteristics that can be used to determine the performance of the aforementioned technologies.

2.2.1. Cost (C1)

Cost is one of the key determinants of supply chain sustainability; the lower the cost, the higher the sustainability. Based upon expert interviews, literature, and an e-market survey [38,39], we consider an overall cost for each technology (Table 1). The overall cost for paper-based traceability systems is considered higher than barcodes, as they require resources such as paper, printers, photocopiers, and other office supplies [40]. On the other hand, barcodes, condensing large amounts of information into small spaces, are considered as almost negligible cost due to the savings on the tag materials and the multiple reusability of the readers [40]. The overall cost of various RFID categories is found to be higher than barcodes and paper forms. Among these technologies, HF and LF are considered as being of a similar cost because HF tags are cheaper and require more expensive readers, while LF tags are costlier but require low-cost readers [20,47]. All UHF RFIDs require significantly more costlier readers than LF and HF [47,48]. Active and semi-passive RFIDs cost more than passive alternatives due to onboard batteries and transceivers. WSNs are also found to have the highest cost among the technologies examined, while TTIs are comparatively less expensive though can be used only single time and the additional cost of recycling packaging in which they are embedded has not been considered here [8].

2.2.2. Vulnerability to Water (C2)

A technology’s capacity to work in a cold chain environment is determined by its ability to be impervious to water. All traceability technologies are not equally efficient in the presence of water. For both the 1D and 2D barcode technologies, presence of water may cause a noticeable performance downturn due to the requirements for a clean clear optic and line-of-sight [40]. Whereas, RFID tags using LF and HF can easily be read while attaching objects containing water and other liquids, UHF passive and semi-passive tags cannot transmit data if the attaching products are high in water content as the UHF wave is absorbed by water [47,55,59]. The performance of active RFID, WSN and smart packaging indicators is not impaired by water [8,59,63].

2.2.3. Flexibility (C3)

Flexibility implies the ability of a data carrier involving a technology to be lightweight, printable, and wearable for ease of attachment to a product [82]. This criterion is highly important while choosing a technology to label products within a supply chain scenario, e.g., the point of sale for the final customers. Barcode labels, being lightweight, printable, and wearable, provide the highest flexibility [40]. Although RFID tags can store more information than barcodes, the tag components altogether are heavier than barcodes. Among RFID variants, UHFs are the lightest, followed by HFs and then LFs, while active and semi-passive tags are the heaviest due to onboard batteries [47,48].

2.2.4. Accuracy of Information (C4)

Accuracy of recorded information is another criterion essential for many cold chain scenarios, e.g., processing, warehousing, and transportation. Accuracy can be determined by the amount of error in a piece of recorded information; the smaller the error, the greater the accuracy. Lack of accuracy can lead to problems such as inventory discrepancy, i.e., the difference between actual physical inventory and associated inventory records, and is influenced by the potential for spoilage during storage and transportation [83,84]. Minimizing product spoilage is a key component of a sustainable supply chain management plan so accuracy of data is important. Manual data collection is highly susceptible to error [41]. Error of barcode reading can also be as high as 20% due to its high reliance on human intervention, line-of-sight, and its vulnerability to harsh environments [40]. In contrast, minimum human dependency, non-line-of-sight and insensitivity to harsh industrial environments enable RFIDs to offer the highest level of read accuracy [20]. For sensing environmental parameters, e.g., temperature, both WSNs and smart packaging indicators provide a similar level of accuracy with around ±0.5 °C error [63].

2.2.5. Reading Range (C5)

Reading range is defined as the farthest distance between a tag or node and a reader or gateway at which a successful data reading can take place [59]. This criterion is applicable to auto-id technologies, barcode, RFID, NFC, and sensing technology, WSN. For these technologies, the three main variations of the reading range observed are: line-of-sight, close-contact reading, and contactless reading. Operational frequency is the major factor that determines whether the data can be read at close contact or contactless [20,59]. The cold chain scenario-imposed constraints ultimately determine the choice of the technology read range [59]. For example, close-contact reading is primarily used in supply chain situations that do not require fast reading and are subject to strict security requirements such as payment at the point-of-sale; while contactless reading is highly important for moving items, such as pallets carried with forklifts or a conveyor belt passing through a checkpoint [3,20]. Close contact reading is offered by LF RFID [49]. Among contactless reading technologies, HF RFID offers 10 cm to 1 m reading range; NFC offers up to 3 cm; UHF passive can be used from 30 cm to 9 m; and active RFID and WSN both offer up to 100 m reading range [47,49,64].

2.2.6. Data Transfer Speed (C6)

Data transfer speed is a composite criterion combining data reading speed and handling of the data carrier (or tag) for the respective technology [20]. Data transfer from paper records is fully manual and hence considered as the slowest. Similarly, automated data acquisition is also not possible from smart packaging indicators, as physical action is required to check the indicator and manually register the data [24,63]. Although barcode technologies offer higher data transfer speed than manual paper forms, with the requirements of high operator handling due to line-of-sight and close contact reading, barcode data transfer can be as slow as 4 s/read [20]. RFID technologies are not dependent on line-of-sight, however LF RFIDs, requiring close contact reading, are slow and their data read rate is 8 kb/s [50]. In contrast, HF passive RFID and NFC offer contactless reading with a data read rate of 105.9 kb/s [56]; while RFIDs in the UHF band can perform data reading at 40–640 kb/s [60]. Semi-passive RFIDs can offer slightly higher reading speeds than UHF passive technologies due to the onboard batteries [3,20,75]. Active RFIDs offer the highest read speed due to onboard transceivers and batteries [20]. WSN offers contactless data transfer to a base station at a speed of 250 kb/s [63,64].

2.2.7. Multiple Tags Readability (C7)

Multiple tags readability refers to the ability to read multiple tags simultaneously, and this criterion is only applicable to auto-id technologies. Multiple tag readability depends on the anti-collision property enabled by implementing algorithms, e.g., time division-based binary-tree and ALOHA for tags and readers [85]. The higher the data transfer rate of an RFID system, the greater the capacity to accommodate an efficient anti-collision algorithm and hence the faster the product tracking. LF RFIDs have limited anti-collision properties, though HF, NFC, UHF, semi-passive and active RFIDs generally embed anti-collision properties in their design [20].

2.2.8. Identification Capacity (C8)

This criterion indicates the ability of a technology to be able to identify a product at different granularity levels. Granularity refers to the level of detail of the product identification recorded by a technology and that depends particularly on the technology’s memory capacity [86]. Identification capacity is necessary for efficient inventory control, as well as tracking product history, and therefore considered as essential for sustainable FSC management. The 1D barcode technology, with limited memory, can only carry the product class or SKU identification, whereas 2D barcodes can encrypt an individual item number due to their higher memory capacity [40,44]. RFID and NFC, due to larger memory and data encoding capacities, are also able to offer item level unique identification with electronic product code (EPC) identifiers, a tag data standard managed by the organization, GS1 [51].

2.2.9. Tag Writing Cycle (C9)

A tag writing cycle reflects whether new data can be written in a technology’s memory during its use in a supply chain. Three variations have been observed for the studied technologies: no writing cycle, single writing cycle, and multiple writing cycles. Read-only RFIDs have no writing cycle for users as they only contain the manufacturer embedded permanent TID which is unable to be modified during their use [52,60,74]. Read-only systems are used where only a small amount of data communication is required, such as identification of pallets, containers, gas bottles and even livestock [20]. Barcodes offer a single writing cycle as they can be written only once by the supply chain operator which then cannot be modified later [21]. On the other hand, RFIDs with read-write capacity (including passive, semi passive and active) and NFCs provide the option of multiple writing cycles. These technologies are important where additional product information (e.g., processing parameters, date of manufacture) is required to be embedded along with the product ID to facilitate data exchange [21,54]. The attribute of a tag writing cycle is not applicable to paper records, WSN and/or smart packaging indicators as they do not include a tag.

2.2.10. Memory Capacity (C10)

Memory capacity determines how much information a technology data carrier can store and thus is an essential element to consider for communication of sustainability related data, e.g., temperature to FSC operators, or carbon footprint data to final customers. Various types of 1D and 2D barcodes can store 20 to 80 and 2335 to 4296 alphanumeric and ASCII characters, respectively [40,72]. For RFID technology, high memory capacity results in higher prices and requires faster information reading to prevent slowing the response of the system [12]. For this reason, LF RFIDs are normally provided with a smaller memory capacity in comparison to HF and UHF passive with a longer read range [20]. Moreover, read-only RFIDs in all frequency bands are embedded with smaller memory size (generally 64 b or 96 b) to include only the TIDs. Conversely, RFIDs and NFCs with read-write capacity include larger memory for users to write data during their use. As per our e-market survey, read-write RFIDs in the HF band are available with 256 b to 1024 b memory size that can increase up to 8 kb for their UHF counterparts. However, active RFID can offer more than 20 kb. WSNs are also embedded with limited memory capacity, though larger memory is found in TTIs to enable them to record partial through to complete temperature history [68].

2.2.11. Environmental Parameters Recording (C11)

The HF and UHF passive RFIDs, normally without a power supply of their own, can only include certain low power sensors for measuring physical parameters, such as temperature, moisture, and shock, at the expense of their reading range [75,76]. The product physical data recording and communication becomes real-time only if a tag is stationary and receives power continuously from the reader, though recording of temperature history is not possible [57,58]. The active and semi-passive RFID tags, with onboard batteries, can record temperatures and integrate them in a temperature history that can be communicated through readers/gateways [61,87]. WSN technologies can communicate discrete temperature in real time, though recording of temperature history is not possible; however, that option can be offered by smart packaging indicators, e.g., TTI [13,65].

2.2.12. Real-Time Location Recording (C12)

Among identification technologies, only semi-passive and active RFIDs, with onboard batteries, can be embedded with global positioning system (GPS) to obtain real-time location information [8]. GPS inclusion is also common for WSN technologies [65]; however, smart packaging indicators do not possess that capacity [8].

2.2.13. Real-Time Alert (C13)

Real-time alerts are an essential element of sustainable cold FSC management, as real-time action can limit product loss and therefore reduce environmental impact of product disposal. Real-time alert systems, informing on emergency food conditions, e.g., loss of temperature control, requires a continuous power supply which means it is not possible to support such systems by passive RFIDs. However, semi-passive and active RFIDs with onboard power sources can accommodate real-time alert systems [20]. WSN, on the other hand, can also include an alarm module to indicate any changes in environment or the physical condition of the food [63]. Smart packaging indicators are also able to identify potential quality problems and emit alerts (e.g., electric and colorimetric signals) [13]. Automatic alert systems are not applicable to barcode technologies and manual paper records [8].

2.2.14. Durability of Data Carrier (C14)

Passive RFID systems are completely insensitive to manufacturing environment issues, e.g., dust, moisture, oils, coolants, gases, high temperatures, and hence are durable for as long as 10 to 20 years [53]. Active and semi-passive RFIDs are also impervious to harsh environmental conditions, however with onboard limited lifetime batteries, they can last around 2 to 7 years depending on the level of use [20]. Manual paper forms can be easily damaged, misplaced or lost, and hence are considered as least durable of the technologies; barcodes are comparatively more resilient, though they can be easily damaged (soiled, scratched) by harsh environmental conditions and handling beyond their readable limit [22].

2.2.15. World-Wide Standard (C15)

Consistency of symbology and technical specification is important, especially when a product moves from one FSC party to another, so that its accompanying information is understood and accepted by all parties involved. This requirement leads to the progression of globally accepted technology standards enabling interoperability and coordination of traceability data shared among multiple stakeholders. The two most widely used barcode symbology standards, the Universal Product Code (UPC) and the European Article Numbering (EAN) led to the foundation of the EAN/UPC barcode standards for consumer products (retail) [40]. ISO/IEC 15963 is a generic standard for TID in RFID tags complying with various standardization requirements, e.g., the GS1 numbering scheme [74]. Some other standards, such as ISO 18000 series, define technical specifications of RFID technologies for item management in FCSs [88]. There are also some specific standards such as ISO 11784, ISO 11785, and ISO 14223 for identification code and technical specification of animal ear tags; and ISO/IEC 14443 and ISO/IEC 15693 for HF RFID and NFC cards [20]. Whereas WSNs are usually built with IEEE 802.15.4 Zigbee protocol and data structure standards, e.g., XML [62,66], TTIs do not possess any technical or computer readable data standards that they need to comply with [24].

2.2.16. Data Security (C16)

Like many other information technologies, traceability technologies are also subject to the potential risk of security loss, e.g., data accessibility or manipulation [22]. In a closed area (e.g., processing facility), where the traceability system operator and user are not separate parties, data security is not important [20]. However, in situations where a third party is involved (e.g., transportation, retail store), data security is an essential criterion. Manual paper forms with no encryption are highly susceptible to security risks as they can be easily edited, mishandled, or damaged; whereas barcodes with simple encryption provide comparatively more security, although the encrypted data situating outside on a tag surface may still suffer cloning or modification [22,46]. In contrast, information recorded in RFIDs is not physically visible from outside [46,83]. RFID with read-write capacity can further be protected with passwords and even cryptographic measures to enable it for high-security applications such as access control [20]. For WSNs, high data security can also be attained with both password and cryptographic protection, whereas with smart packaging indicators, data is physically visible, providing the lowest or no data security against unauthorized access [8,67].

2.2.17. Manual Data Readability (C17)

Manual data readability is important if the data is intended for the final customers or infield workers who do not carry special data reading devices and/or need instant information. Furthermore, damage (e.g., tears and scratches) to data carrying technologies, and unavailability of electricity or internet or phone networks may lead to users opting for manual reading [89]. To avoid unexpected information loss from damaged tags, 1D barcodes are often accompanied with their corresponding alphanumeric codes that are manually readable, holding a distinct advantage over alternative technology; for example, RFID cannot be read without a dedicated scanner [40,72]. Among environment parameters recording technologies, time–temperature indicators can provide instant shelf-life information and temperature history to infield personnel (e.g., operators and customers), though WSN requires a special gateway to obtain this information [24].

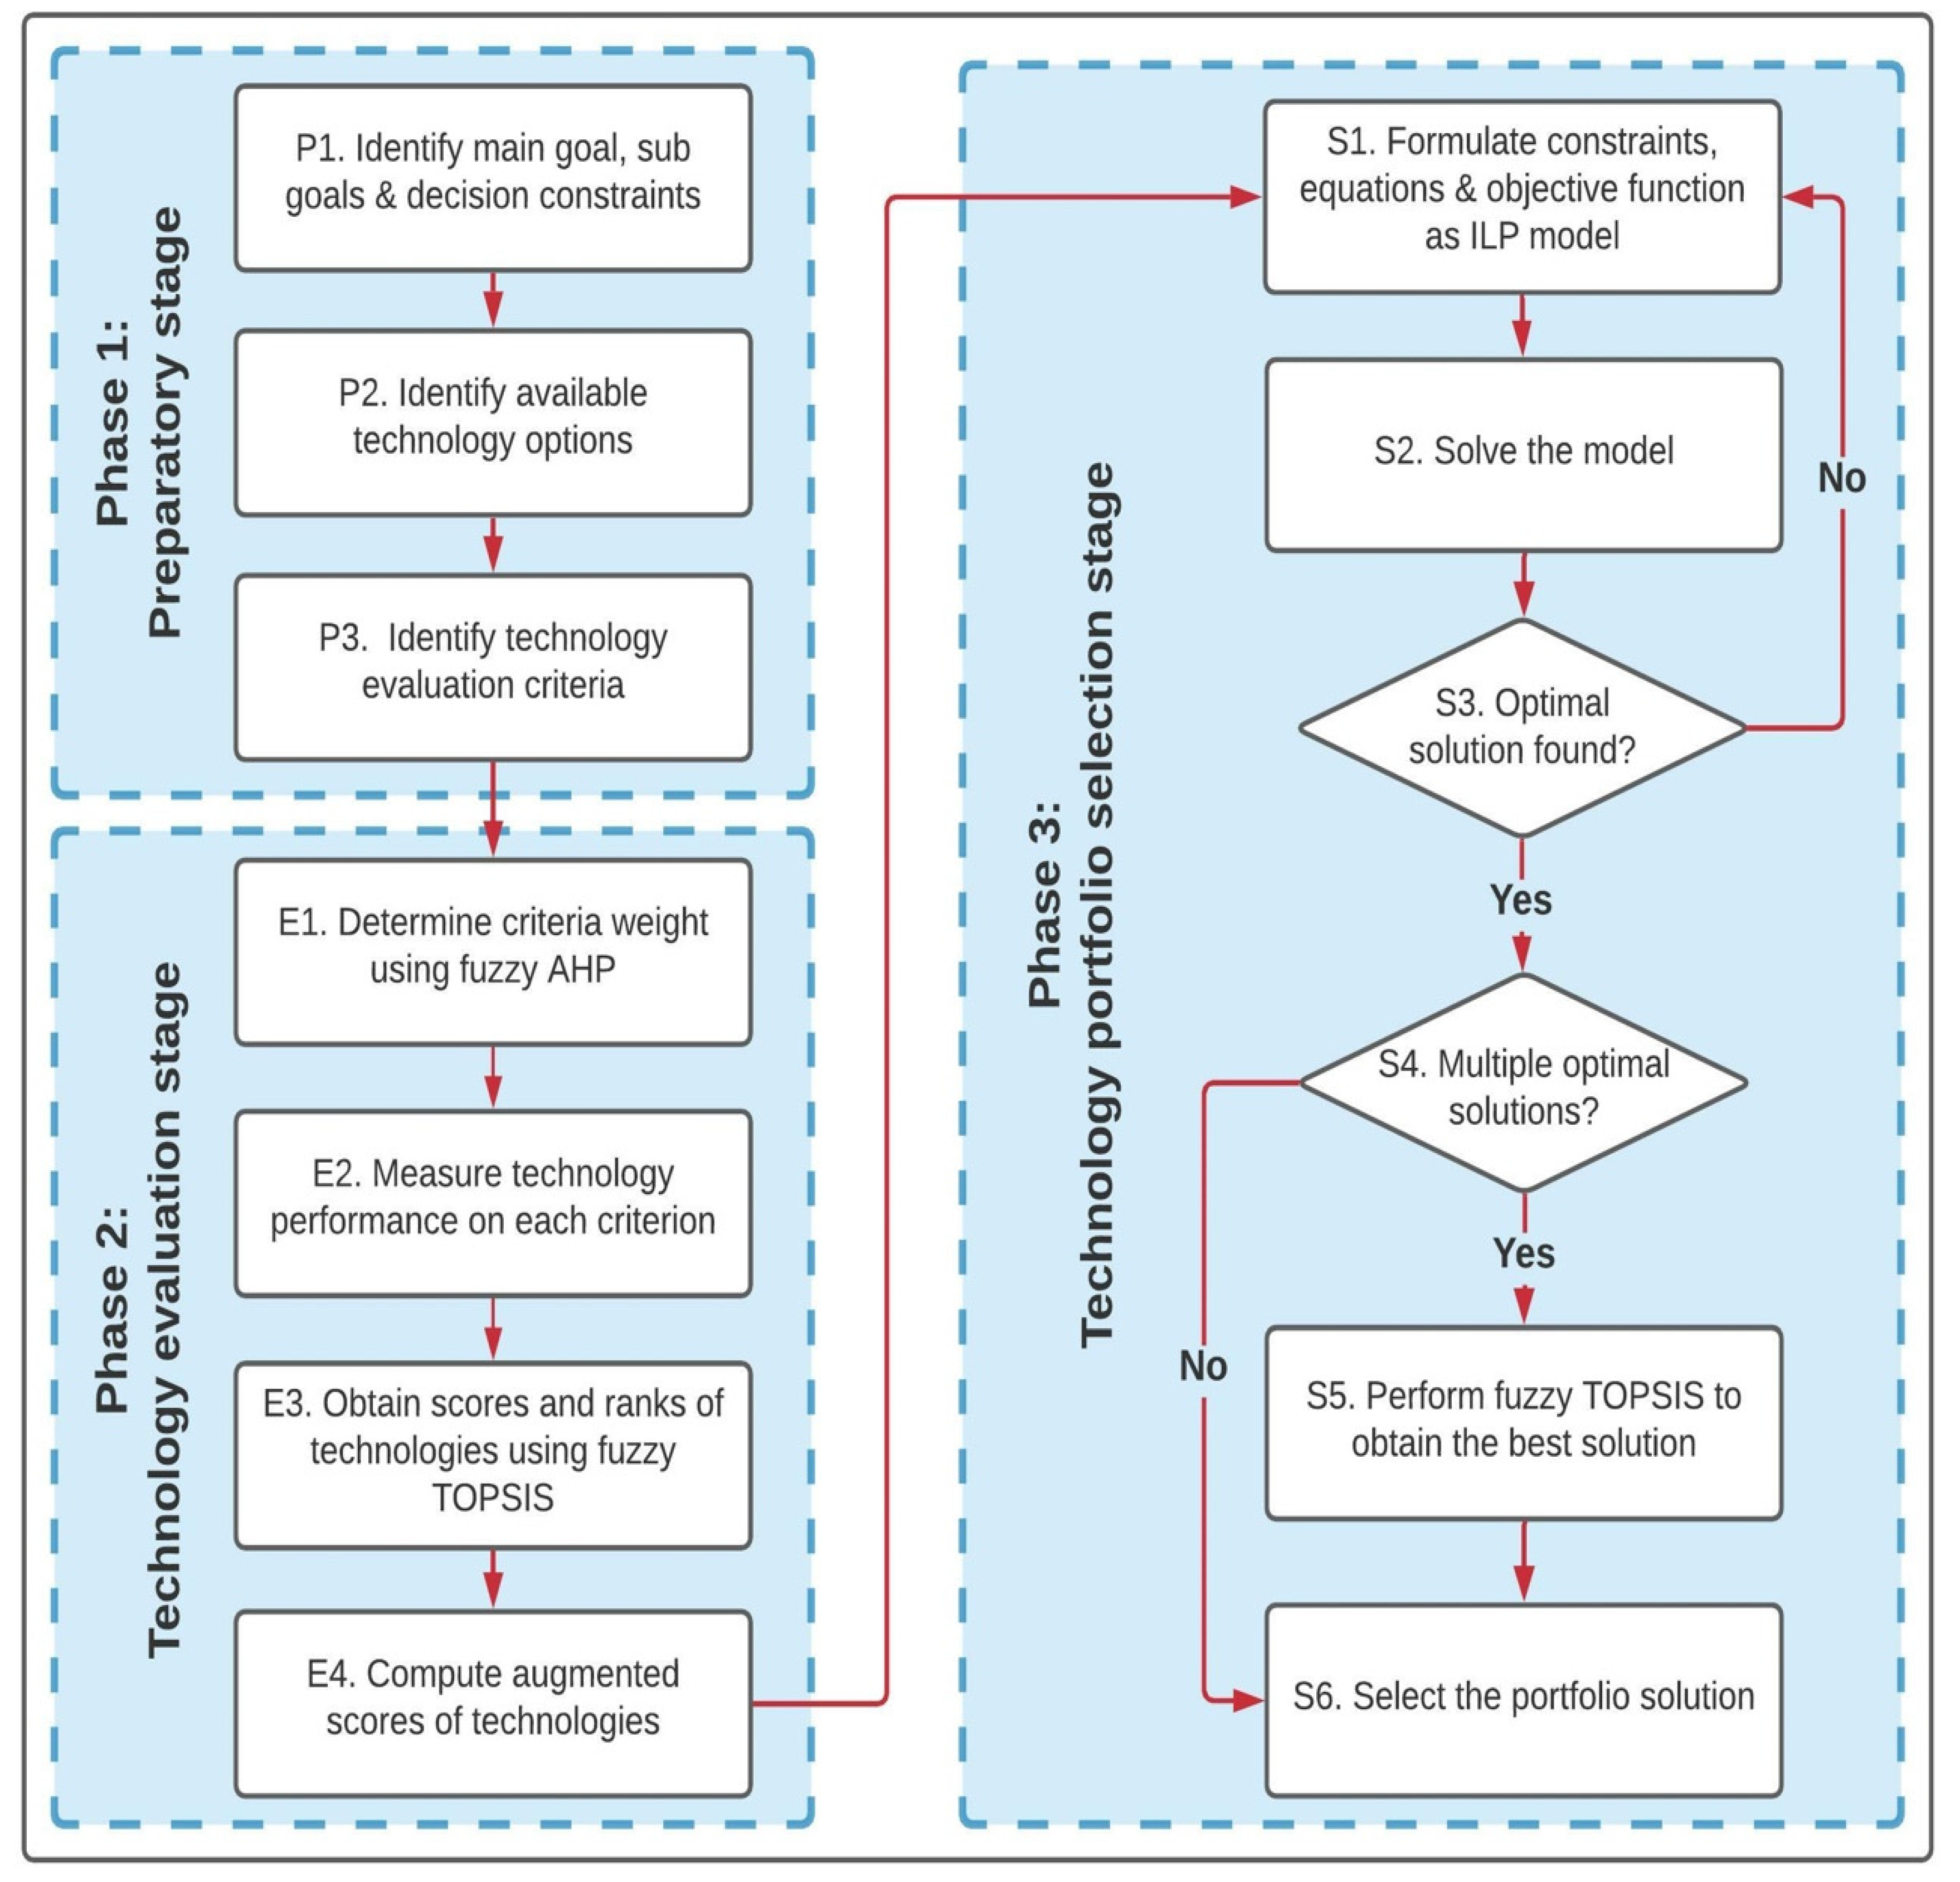
3. Proposed Framework

The proposed technology portfolio selection framework, developed in this research, comprises three main phases: the preparatory stage, the technology evaluation stage, and the technology portfolio selection stage. This technology portfolio selection framework is shown in Figure 1 and discussed in the following paragraphs.

3.1. Phase 1: Preparatory Stage

The preparatory stage includes the three following steps:
P1. Identify the main goal, subgoals and decision constraints: Technology portfolio selection for any scenario or case generally starts with defining an overarching goal [18]. The goal for traceability technology selection is the main requirement, either derived from a particular FSC scenario, or demanded by a corresponding actor, e.g., food business operator or end customer [19]. A relatively broad goal is further broken down into specific subgoals such that the main goal is achieved through accomplishing the subgoals [18]. For example, temperature tracking of a food product can be further divided into two subgoals: product tracking and temperature monitoring. Apart from goals and subgoals, each case also includes some decision constraints [35], for example, traceability of a low value food item imposing a cost/budget constraint, or the requisite of selecting among mutually exclusive technologies, putting a constraint on the total number of selected technologies.
P2. Identify available technology options: Shortlisting of candidate technologies is another important step in any technology selection process [19]. In real life settings, these types of selections are normally performed by technology experts who consider the technologies available and the intended benefits for the traceability system. However, in this paper, technology information is gathered through the literature review and e-market webpages followed by expert interviews (Table 1). The focus was to identify the most commonly used technologies for product identification and temperature monitoring.
P3. Identify technology evaluation criteria: To achieve the goal/subgoals defined in step P1, selection criteria for the technologies considered in step P2 are identified. Although in a real case scenario, decision makers, e.g., technology experts can do this job, in this study, we followed a similar approach to Büyüközkan et al. [37] and consolidated a set of decision criteria from the traceability technology literature (discussed in Section 2 and Table 1) that are most appropriate in the context of sustainable cold FSC management. A specific set of criteria were picked out from this list for each case goal, based on the opinion of our technology experts.

3.2. Phase 2: Technology Evaluation Stage

The technology evaluation stage constitutes the four following steps:
E1. Determine criteria weight using fuzzy AHP: The relative weights for all technology criteria identified in step P3 are determined using fuzzy AHP. In fuzzy AHP, a fuzzy scale comprising a series of fuzzy numbers is used to define the verbal expression of decision makers in a pairwise criteria comparison matrix [25]. The main stages comprising fuzzy AHP are described below and is further demonstrated in the context of this paper in Section 4.
E1.1. Decision makers are asked to allocate values according to the fuzzy criteria rating scale to construct the pairwise criteria comparison matrix.
Let us consider that   C 1 ,   C 2 ,   C n are criteria identified in step P3 and a ˜ i , j k denotes the preference rating given by k th decision maker for criterion C i relative to criterion   C j , where i , j = 1 , 2 , , n . a ˜ i , j k is a triangular fuzzy number (TFN) that can be represented by a triplet such that a ˜ i , j k = ˜ ( l i , j k ,   m i , j k , u i , j k ) , where l , m and u are the smallest possible, most probable, and largest possible values of a , respectively. The n × n   sized decision matrix for the k th decision maker is given in Equation (1).
                              C 1   C 2   C n A k ˜ = C 1 C 2 C n [ a ˜ 1 , 1 k a ˜ 1 , 2 k a ˜ 2 , 1 k a ˜ 2 , 2 k a ˜ 1 , n k a ˜ 2 , n k a ˜ n , 1 k a ˜ n , 2 k a ˜ n , n k ]  
E1.2. For multiple decision makers, the geometric mean is obtained for preference ratings for each criteria comparison given by all decision makers [89] by using Equation (2)
a ˜ i , j = ˜ ( l i , j , m i , j , u i , j ) = ( ( k = 1 p l i , j k ) 1 / p , ( k = 1 p m i , j k ) 1 / p ,   ( k = 1 p u i , j k ) 1 / p )   i , j = 1 , 2 , , m
where a ˜ i , j   is combined preference rating obtained for p number of decision makers.
E1.3. The combined preference ratings a ˜ i , j are integrated into a combined decision matrix as shown in Equation (3).
                              C 1   C 2   C n A k ˜ = C 1 C 2 C n [ a ˜ 1 , 1 a ˜ 1 , 2 a ˜ 2 , 1 a ˜ 2 , 2 a ˜ 1 , n a ˜ 2 , n a ˜ n , 1 a ˜ n , 2 a ˜ n , n ]
E1.4. The fuzzy weight values are calculated for all criteria using Equation (4)
W ˜ i = G ˜ i × ( i = 1 m G ˜ i ) 1
where
( i = 1 m G ˜ i ) 1 = 1 i = 1 m u i ,   1 i = 1 m m i , 1 i = 1 m l i
E1.5. The fuzzy weights are then defuzzified to obtain their crisp values for all criteria using Equation (6). Among numerous defuzzification methods, the one proposed in Chen and Huang [90] is found herein to present the best non-fuzzy performance measure for the collected dataset.
W i = D e f u z z i f i c a t i o n ( W ˜ i ) = l i + m i + u i 3
E2. Measure technology performance on each criterion: Performance is measured for the technologies shortlisted in the preparatory step P3 by presenting various units that quantify the technologies’ performance on selected criteria. Linguistic variables and associated fuzzy rating scale are often used to indicate these performance levels [91]. In real case scenarios, the linguistic variables presenting technology performance are gathered in a technology performance table through accumulating experts’ knowledge [29]. In this present study, we construct a technology performance table (shown in Table 1) based on the data gathered from literature and expert opinion. The construction of this table in the context of this paper is demonstrated in Section 4.
E3. Obtain scores and rank of technologies using fuzzy TOPSIS: Fuzzy TOPSIS is applied on the technology performance table constructed in the step E2. Similar to the methodology of Lupo and Bellomo [92], in this paper we first convert the technology performance matrix in its crisp form and then follow the classical TOPSIS algorithm for a regular real number [27]. Our Fuzzy TOPSIS procedure comprises the following steps:
E3.1. Obtain fuzzy technology performance matrix: Assume T 1 ,   T 2 , , T r   are r possible technology alternatives and   C 1 , C 2 ,   C n are selected criteria in step P3. y ˜ k , i   is a TFN such that y ˜ k , i   = ˜ ( l k , i , m k , i , u k , i ) denoting the performance rating for technology T k on criterion   C i , where k = 1 , 2 , , r and i = 1 , 2 , , n . Therefore, the r × n   sized technology performance matrix can be written as Equation (7).
                              C 1   C 2   C n B ˜ = T 1 T 2 T r [ y ˜ 1 , 1 y ˜ 1 , 2 y ˜ 2 , 1 y ˜ 2 , 2 y ˜ 1 , n y ˜ 2 , n y ˜ r , 1 y ˜ z , 2 y ˜ r , n ]
E3.2. Obtain defuzzified technology performance matrix: The technology performance matrix B ˜   is defuzzified using Equation (6) as given in Equations (8) and (9)
                                                                                                                      C 1   C 2   C n B = D e f u z z i f i c a t i o n ( B ˜ ) = T 1 T 2 T r [ y 1 , 1 y 1 , 2 y 2 , 1 y 2 , 2 y 1 , n y 2 , n y r , 1 y r , 2 y r , n ]
where
y i , j = D e f u z z i f i c a t i o n ( y ˜ k , i ) = l k , i + m k , i + u k , i 3     k = 1 , 2 , , r   a n d   i = 1 , 2 , , n
E3.3. Obtain normalized technology performance matrix: The normalized technology performance matrix is calculated as follows:
                                                                                                                    C 1   C 2   C n B n = N o r m a l i z a t i o n ( B ) = T 1 T 2 T r [ z 1 , 1 z 1 , 2 z 2 , 1 z 2 , 2 z 1 , n z 2 , n z r , 1 z r , 2 z r , n ]
where
z k , i = y k , i k = 1 r y k , i 2   k = 1 , 2 , , r   a n d   i = 1 , 2 , , n
E3.4. Obtain weighted normalized technology performance matrix: The weighted normalized technology performance matrix is calculated by multiplying the normalized performance matrix with corresponding criteria weight W i obtained in step E1.5 of the technology evaluation stage.
                                                                                                                                                  C 1   C 2   C n B v = W e i g h t e d   N o r m a l i z a t i o n ( B n ) = T 1 T 2 T r [ v 1 , 1 v 1 , 2 v 2 , 1 v 2 , 2 v 1 , n v 2 , n v r , 1 v r , 2 v r , n ]
v k , i = z k , i × W i
E3.5. Calculate positive ideal and negative ideal solutions: The positive ideal and negative ideal solutions S + and S   are determined using Equations (14) and (15), respectively:
S + = { v 1 + , , v n + } = { ( max k   v k , i | i P ) , ( min k   v k , i | i N ) }
S = { v 1 , , v n } = { ( min k   v k , i | i P ) , ( max k   v k , i | i N ) }
where P is a set of benefit criteria and N is a set of detriment criteria.
E3.6. Calculate distances of each alternative from positive ideal and negative ideal solutions: The separation for each technology from positive and negative ideal solutions are measured using Equations (16) and (17), respectively:
d k + = { i = 1 n ( v k , i v i + ) 2 } 1 2 , k = 1 , 2 , , r
d k = { i = 1 n ( v k , i v i ) 2 } 1 2 , k = 1 , 2 , , r
E3.7. Calculate closeness coefficients to score and rank the alternatives: The relative closeness of each technology alternative T k to the ideal solutions S + and S   is defined by its closeness coefficient c c k that is determined using Equation (18):
c c k = d k ( d k + + d k ) ,   k = 1 , 2 , , r
Technologies are ranked according to their c c k values. c c k [ 0 , 1 ] and a higher value of c c k means that the technology T k has a longer distance from the negative ideal solution, a shorter distance from the positive ideal solution, and hence a higher rank compared to the other alternatives, and vice versa. c c k can also be considered as the MCDM score of an examined technology.
E4. Compute augmented scores of technologies: After evaluating and ranking, the highest scored technology cannot be chosen straightforwardly without considering the constraints and preferences prevailing in a certain FSC case situation [34]. Therefore, the constraints and preferences are integrated in an ILP formulation where the objective function is to maximize the sum of the binary variables assigned to the considered technology alternatives, each one multiplied by its MCDM score calculated in the previous step. However, this ILP formulation does not necessarily maintain the preference order derived from the MCDM ranking of the technologies. This is because the ILP can select a combination of technologies with the highest combined MCDM scores, even if the individual technologies within this combination were not initially prioritized by the MCDM technique. As a result, the portfolio of technologies providing the highest benefit cannot be chosen.
Therefore, Kabli [36] states that hybrid approaches should maintain coherence throughout these portfolio selection steps. As a result, it is important to maintain the consistency of the rankings of technologies obtained in the technology evaluation stage through to the final phase, technology portfolio selection. To this end, we adopt a similar approach to Tavana et al. [35] and replace the MCDM scores of technology alternatives, c c k with augmented scores a s k   in the ILP objective function. By applying the augmented scores, the problem of underestimating high benefit technologies is solved, and the initial MCDM ranking of the technologies is maintained throughout the ILP selection process.
The key tactic here is to assign augmented scores to technologies so that the augmented score of k th technology is always greater than the sum of the scores of all the technologies worse than k , based on the rankings obtained through c c k . To do so, if we assign a score of 1 to the worst technology, the next technology score is (1 + 1) = 2, the one after is 1 + 2 + 1 = 4, and so on. Following this approach, the augmented score a s k   of the k th technology will be 2 k 1 , as shown in Equation (19) as follows:
a s k = 2 k 1

3.3. Phase 3: Technology Portfolio Selection Stage

The technology portfolio selection stage comprises the following six steps.
S1. Formulate constraints equations and objective function as an ILP model: The initial preferences and constraints identified in phase 1 are converted into constraint equations and objective function of an ILP model. The objective function and some exemplary constraints that may affect the food traceability technology selection decision are shown below:
(i) Objective function:
M a x   Z = k = 1 r a s k × x k
where Z   is the total amount of benefit obtained from the selected portfolio; k is an index such that k = 1 , 2 , r ; x k is a binary integer variable where x k = 1 if technology k   is selected, x k = 0 otherwise; and a s k is the augmented scores of technologies.
Subject to:
(ii) Total number of technologies in the portfolio:
k = 1 r x k K
K is a constant number denoting the maximum preferred number of technologies in the selected portfolio.
(iii) Necessary technology in the portfolio:
x k = 1
Say,   x k must be present in the selected portfolio.
(iv) Mutually exclusiveness of technologies:
x 1 + x 2 1
Say, technology 1 and technology 2 cannot be simultaneously present in the selected portfolio.
(v) Interdependency of technologies:
x 2 x 4
Say, technology 4 must be selected to select technology 2 .
(vi) Cost constraint:
k = 1 r x k × c k B
The summation of technology costs c k   in the selected portfolio must not exceed the maximum allowable budget B .
S2. Solve the model: The model constructed in step S1 is solved to obtain the optimum portfolio of technologies.
S3. Obtaining solution: It is necessary to check whether the optimal solution is found in step S2. If the optimal solution is not found, the ILP model needs to be checked and reformulated.
S4. Number of optimal solutions: If a single optimal solution is obtained, step S6 can be taken; however, for multiple optimal solutions, step S5 is followed.
S5. Perform fuzzy TOPSIS to obtain the best solution: The decision makers need to assign new weights for the criteria. It is necessary to realize that a particular technology performance on a criterion will be different than that for a portfolio containing that technology, as the interaction among technologies within the portfolio will also come into consideration. In this way, the best portfolio with the highest score can be identified.
S6. Select the portfolio solution: The best portfolio of technologies is selected for pilot implementation.
The framework is now applied to the case studies demonstrated in Section 4.

4. Case Study

In this section we demonstrate the applicability of the proposed framework with four case studies adopted from the work by Óskarsdóttir and Oddsson [8]. TFN scales are used in this study for assigning ratings for both the criteria and technology alternatives. The criteria rating scale is approximated from Saaty’s 9-point scale [25] that is shown in Table 2.
The technology rating scale (shown in Table 3) is an 8-point scale starting with (0, 0, 0), signifying certainly not/negligible/not applicable, up to (0.8, 0.9, 1.0) that stands for the highest performance level.
As a part of the study, two decision makers are interviewed to ‘sense check’ and support the identified goal, subgoals, relevant criteria, constraints, and the formulation of the decision matrices for each FSC case. The technologies and their performance criteria are shortlisted from Table 1. The technology data in Table 1 are subjective, incomplete, intermediary, or continuous, and therefore are approximated into qualitative performance measures using the fuzzy scale in Table 3 (written within parenthesis in Table 1) [93]. The quantitative values associated with these qualitative technology performance measures can be found in Table S1 in the Supplementary Material. The quantitative performance measures are further used to calculate the technology scores.
We then calculate the augmented technology scores and use it in the ILP objective function with case-specific constraint equations. Finally, we determine the optimal technology solution/s that satisfy the objective function and associated constraints for a given case and explain the rationale that underpins this solution.

4.1. Case 1

Fresh arctic char (fish) is transported by truck and air from the production site in northern Iceland, through Keflavik airport, to New York. The product units, shipped as pallets, are often not placed in a cold storage immediately after arrival in New York, and instead are left outside in a temperature more than 30 °C. As a result, shelf-life deterioration and spoilage occurs in the perishable arctic char. Hence, the associated FSC operators intend to monitor the real-time ambient temperature that the pallets are subjected to, so that the necessary actions can be taken immediately in the event of product temperature rise to minimise spoilage and sustainability loss. To obtain the optimum technology portfolio, the proposed framework is used as follows:
Phase 1: The goal of this case is to enable FSC partners to monitor the real-time ambient temperature of the pallets. This goal can be divided into two subgoals: online tracking of pallets and online real-time temperature monitoring. Online tracking of a pallet throughout its transportation is fulfilled by satisfying two requirements: automatic identification of the pallet and its carried product units. The technical criteria chosen for a pallet automatic identification are identification capacity (C8) and tag reading range (C5); while to enable identification of the product units carried by this pallet, a tag attaching the pallet needs to be capable of storing the carried products’ identification, which requires two more technical criteria: memory size (C10) and tag writing cycle (C9).
The criteria chosen for online temperature monitoring include real-time environmental parameter recording (C11) and data transfer speed (C6). Some additional criteria are also considered for this scenario. Information accuracy (C4) is chosen for ensuring the transmission of correct information, while worldwide standard (C15) is required to obtain the data in a standard form capable of being directly sent to a web server-based traceability information system that can be accessed, understood, and analyzed by multi-country FSC partners (e.g., Northern Iceland and New York). Data security (C16) is chosen for protection against security risks throughout the transportation from Northern Iceland to New York. Cost (C1) has also been included in the chosen criteria list as a driver for selecting optimized technologies, as no data on technology budget is available from Óskarsdóttir and Oddsson [8], who consider the shipping unit (a pallet with Arctic char product units) as high valued. However, with appropriate budget information, cost can be used as a constraint under the ILP model.
Three constraints are also identified in this case; maximum two technologies (considering two different goals of product tracking and environment monitoring) can be selected; technologies with identification capacities are mutually exclusive; and technologies with environment parameter recording capacity are mutually exclusive.
Phase 2: A pairwise comparison matrix for the selected criteria similar to Equation (1) is obtained for each decision maker, which are then combined using Equation (2) as shown in Table 4:
Fuzzy weight values for the selected criteria are calculated by using Equations (4) and (5), which are then defuzzified using Equation (6) into crisp values: C1 = 0.0178, C4 = 0.0400, C5 = 0.223, C6 = 0.137, C8 = 0.182, C9 = 0.068, C10 = 0.068, C11 = 0.217, C15 = 0.028, C16 = 0.0174. These criteria weights are then used in the technology evaluation. Criteria which are not shortlisted in Phase 1 are assigned 0 weight value to be excluded automatically.
The quantitative technology performance measures shown in Table S1 in the Supplementary Material is used in this stage. Equations (8)–(18) are used to calculate the MCDM score c c k for each technology. After that, the augmented scores a s k are computed using Equation (19). The TOPSIS scores c c k and augmented scores a s k   for the technology alternatives are shown in ascending order in Table 5:
Phase 3: The augmented scores are then used in the objective function of an ILP model. Three constraint equations are formed based on the constraints identified in Phase 1. The model is solved, providing the optimum technology: Active RFID. As a single optimum solution is obtained that satisfies the main goal identified in phase 1, no further fuzzy TOPSIS evaluation (S5) is performed.

4.2. Case 2

Fresh fish is transported from Iceland to Europe using temperature-controlled containers. The FSC partner in Europe discovers that the cargo is spoiled and assumes that it has exited the temperature limits at some point during transportation. His main interest is to verify at the designated product checkpoints whether the product temperature was within limits throughout the whole transportation phase. Again, product loss is the key sustainability attribute considered here.
Phase 1: The main goal identified for this case is to verify at the checkpoint whether product temperature has remained within the defined limit(s) at all stages of product movement. Two subgoals realised here are the automatic identification of the containers at the checkpoint and accessing its temperature history. The technical criteria chosen for enabling automatic identification are identification capacity (C8) and tag reading range (C5); while to support temperature history accessibility, three technical criteria are real time environment parameters recording (C11), memory size (C10) and tag writing cycle (C9). Data transfer speed (C6) is also taken into consideration as the time window allowed for data reading can be incredibly small, considering the containers carried by forklifts passing quickly through a checkpoint [3]. As with Case 1, some additional criteria are chosen for case 2 and these are: recorded information accuracy (C4), worldwide standards (C15), data security (C16), and cost (C1). Three similar constraints to Case 1 are likely to influence the technology decision.
Phase 2: The combined pairwise criteria comparison matrix for two decision makers are shown in Table S2 in the Supplementary Material. The fuzzy weight values are calculated, which are then defuzzified into: C4 = 0.0615, C6 = 0.0510, C5 = 0.0641, C8 = 0.213, C9 = 0.105, C10 = 0.192, C11 = 0.234, C15 = 0.043, C10.019, C16 = 0.0186. The criteria weights are then used for calculating MCDM scores c c k and augmented scores a s k (shown in Table S3 in the Supplementary Material).
Phase 3: The augmented scores are used in the formulation of an ILP model including an objective function and three constraint equations. The optimum technology for this case is, again, Active RFID.

4.3. Case 3

A consumer wants to trace the origin information of fresh salmon she buys from a store. The consumer desires to be able to use her smartphone to scan the packet label to access a website informing her of the product origin including the producer, the salmon batch number, and which pen the fish has been raised in. The consumer wants to confirm this at the point of purchase. This aspect of sustainable supply chain verification by consumers being able to confirm the origin of their product is gaining contemporary interest [94,95].
Phase 1: The main goal of this case is enabling the customer to access product origin information through a packet label, which is further divided into two subgoals; each salmon packet, being a low value consumer item, must be attached to a light weight, low value standard identification label readable by customers; and the label should carry product information. To satisfy the first requirement, cost (C1), identification capacity (C8), flexibility (C3) and worldwide standard (C15) are identified as essential criteria for consideration. Whereas, to fulfil the second requirement, information accuracy (C4), tag writing cycle (C9), writable memory size (C10) and data security (C16) are chosen, for many of the reasons outlined in previous cases. A single constraint considered here is to choose a single technology solution for ease of consumer access.
Phase 2: The combined pairwise criteria comparison matrix is formulated (shown in Table S4 of Supplementary Material). The defuzzified criteria weights are: C3 = 0.178, C4 = 0.178, C8 = 0.069, C9 = 0.027, C10 = 0.047, C15 = 0.103, C16 = 0.027, C1 = 0.371, which are then used to calculate the MCDM scores c c k and augmented scores a s k shown in Table S5 in the Supplementary Material.
Phase 3: An ILP model is formulated with an objective function and one constraint equation. The optimum technology for this case is the 2D barcode with associated reading ability for the consumer, e.g., a phone app.

4.4. Case 4

A consumer wants to know that the fresh fish he buys from a retail store is fresh, i.e., it has not spoiled and has enough shelf-life. The consumer wants to verify this at the point of purchase.
Phase 1: The goal is to inform customer of the temperature history of the fish, which can be subdivided into two further goals: tracing of packets of fish with a lightweight inexpensive, standard tag, and the tag providing a means to visualize product temperature history. The first requirement is the same as case 3 and thus similar criteria would be inevitable: cost (C1), identification capacity (C8), flexibility (C3) and worldwide standard (C15). To fulfil the second requirement, environment parameter recording (C11), memory size (C10), manual data readability (C17), information accuracy (C4), and data security (C16) are considered as important criteria. The three constraints are the same as Case 1 and 2 and are considered for the technology decision.
Phase 2: The combined pairwise criteria comparison matrix for two decision makers are given in Table S6 in the Supplementary Material. The criteria weights are calculated which are then used to calculate the MCDM scores c c k and augmented scores a s k (provided in Table S7 of the Supplementary Material).
Phase 3: An ILP model is formulated with an objective function and three constraint equations. The optimum technology combination found for this case is 1D barcode and time–temperature smart indicator on packaging. The findings are now discussed in Section 5.

5. Discussion

This study aims to develop a systematic methodology for food traceability technology selection that considers quantitative cost–benefit analysis of examined technologies and selects a single technology or a combination of technologies showing the maximum compatibility with the intended FSC case-specific requirements, that was absent in the literature. Therefore, a hybrid approach is proposed which integrates standard MCDM methodologies, i.e., fuzzy AHP, fuzzy TOPSIS with ILP, and includes three main phases. In the first phase, the main goal and subgoals, the constraints, the technologies, and their selection criteria are identified for an intended FSC case; in the second phase, the technologies are evaluated based on the shortlisted criteria; and finally, in the third phase, the technologies offering maximum cost–benefit performance and satisfying the predefined constraints are selected.
Four case studies from extant literature [8] are used as a foundation to apply the proposed methodology. For both the first and second cases, active RFID is found as the best solution that satisfies the main goals of the respective cases to allow FSC parties to monitor real-time pallet temperature and track product temperature history. Although informing specific FSC actors about product temperature history is also the main goal of the fourth case, the optimum solution obtained here is a combination of 1D barcode and time–temperature indicator on the packaging. The reason for this alternative choice is, in the fourth case, the traceability goal is to inform consumers with the limited potential for reading, i.e., it must be visual and is intended for a low-value item (a packet containing a small fish portion); whereas the second case is concerned with verifying a high-value item (whole fish container) with FSC partners as the traceability beneficiaries. While fulfilling the main goals and cost–benefit criteria, optimal technologies for all these cases satisfy the decision constraints, i.e., the total number of selected technologies can be at most two with not more than one identification and one temperature monitoring technologies. The third case imposes a different constraint, i.e., selecting a single technology that derives from the main goal—identifying a low-cost label informing origin for a consumer item—and the optimal technology found here is 2D barcode or QR code. The outcomes of all these cases demonstrate the fitness of our proposed framework in achieving the study objective across a range of FSC scenarios.
In contrast to our result, the study of Óskarsdóttir and Oddsson [8] identified WSN, active RFID, QR code and time–temperature indicators as optimum technologies for cases 1, 2, 3 and 4, respectively. We found same results for cases 2 and 3, although the model proposed in our study shows variances for cases 1 and 4. The reason for this is that we considered both the identification and temperature recording goals for all the cases, while the approach in Óskarsdóttir and Oddsson [8] seems to consider only the temperature recording goal for cases 1 and 4. However, traceability of temperature readings to a given product is not possible without product identification, and the technology cost–benefit analysis needs to cover both aspects of product identification and time–temperature monitoring.
In our study, a single technology is determined as an optimum solution for the first three cases, while for case 4, a solution with two technologies is selected. This implies that the proposed technology selection approach is applicable in finding either an optimum single or a group of technologies for an intended FSC scenario, which builds on the previous traceability technology studies [8,21]. Use of fuzzy scales to measure technology performance in the proposed approach increases its adaptability in real case scenarios where data can be subjective, uncertain, or even incomplete [26]. Various FSC cases, requiring a combination of technologies to satisfy case specific preferences or constraints, can also be served by our proposed methodology, although this paper is scoped to the cold food supply chain.
We mainly consider the criteria which are applicable to cold FSC sustainability management through traceability of items and temperature measures. The study has compared various technologies, but not various forms under a single technology, e.g., various barcode symbology standards, or size and shape of RFID tags. This could be seen as a limitation of the study, but this work sought to develop the methodology for technology selection and could be more nuanced in further developments to consider not only inter-technology comparison, but intra-technology comparisons too.
A potential limitation of our proposed approach is that we cannot formulate a cost/budget minimization objective function or a cost/budget constraint equation in our ILP analysis, as no quantitative data on the technology cost or budget is available from Óskarsdóttir and Oddsson [8]. Therefore, we approximate the quantitative ordinal cost values from the mixed (quantitative and qualitative) data collected through literature searches and expert interviews, and consider that under the MCDM evaluation phase before running constrained ILP maximization to optimize the technology selection. However, if our proposed approach is used for real industry owned technology solutions with practical cost or budget data for actual FSC cases, then cost could be used as a minimization objective function or constraint equation under the ILP model, and even better results are expected to derive from that approach.
Although we adopted fuzzy AHP, fuzzy TOPSIS and ILP methods in this study, other optimization techniques, e.g., PROMETHEE, weighted sum, weighted product, goal programming or any quick heuristic could also be used and tested under the proposed approach to calculate the time and effort required to complete the overall approach, and formulate the most effective and time-efficient technology selection method.
Our proposed approach is intended as a decision-support tool to assist cold FSC industries in technology selection for sustainable FSC transformation, according to the scenario-specific requirements. However, FSC traceability systems are complex, comprised of a multitude of processes across multiple stakeholders with diverse levels of information requirements, technology settings, capacity, knowledge, resources, and regulatory controls. For successful traceability technology implementation, the technology planning decision must be accompanied by appropriate managerial processes within, and between, individual food businesses across supply chains. Development of standardized traceability practice guidelines, employee training, use of standard data lists, coherent identifier codes, consistent data semantics and data formats are some of the key measures that must be taken to underpin the decisions made regarding the traceability technology to adopt in a specific scenario.

6. Conclusions

Selection of traceability technologies aligning with a cold FSC scenario is a complex decision problem requiring combinatorial consideration of multiple cost–benefit criteria of multiple technology alternatives and case specific constraints or preferences. A systematic approach to address these requirements is currently absent in the literature. Therefore, we propose a hybrid approach combining fuzzy AHP, fuzzy TOPSIS and ILP, and apply it in four case studies. Use of such standard optimization methods for selecting case specific food traceability technologies is a new theoretical contribution made by this paper that can further be refined into a standard traceability technology adoption framework. Expected users of the proposed approach could be managers, quality officers and technology experts in larger businesses or small and medium-sized operators, who intend to identify a suitable traceability solution or redesign the existing system, especially to improve its sustainability performance. Selecting the right technologies can deliver improved sustainability performance through reduced food loss, enhanced quality, product safety and productivity, quick and more focused responses in the event of recalls, and increased ease of operation. Other possible users could be technology developers, regulators and certification bodies, who could use the approach to examine existing technologies that are in use and determine which solutions are required for different FSC scenarios as part of traceability system development and third-party verification activities.

Supplementary Materials

The following are available online at https://www.mdpi.com/article/10.3390/su13169385/s1, Table S1: Technology performance matrix; Table S2: Combined pairwise criteria comparison matrix for two decision makers for case 2, Table S3: TOPSIS scores and augmented scores of technologies for case 2, Table S4: The combined pairwise criteria comparison matrix for two decision makers for case 3, Table S5: TOPSIS scores and augmented scores of technologies for case 3, Table S6: Combined pairwise criteria comparison matrix for two decision makers for case 4, Table S7: TOPSIS scores and augmented scores of technologies for case 4.

Author Contributions

Conceptualization, S.I. and J.M.C.; investigation, S.I.; methodology, S.I.; validation, S.I., J.M.C. and L.M.; formal analysis, S.I.; data curation, S.I.; writing—original draft preparation, S.I.; writing—review and editing, L.M. and J.M.C.; supervision, J.M.C. and L.M.; project administration, S.I. and J.M.C.; funding acquisition, S.I. All authors have read and agreed to the published version of the manuscript.

Funding

This research was funded by the Commonwealth Scholarship Commission (CSC), London, UK, Reference no: BDCS-2018-59, and the Cambridge Commonwealth, European and International Trust, Cambridge, UK, reference no: 10462604.

Institutional Review Board Statement

Not applicable.

Informed Consent Statement

Informed consent was obtained from all interviewees involved in the study.

Data Availability Statement

The data presented in this study are available upon reasonable request from the corresponding author.

Acknowledgments

The authors cordially acknowledge and thank the Lead innovation technologist from Emerson Commercial & Residential solutions and the Portfolio development executive from Siemens for their interviews to support data collection for cold food traceability technology selection.

Conflicts of Interest

The authors declare no conflict of interest.

References

  1. Luo, H.; Zhu, M.; Ye, S.; Hou, H.; Chen, Y.; Bulysheva, L. An intelligent tracking system based on internet of things for the cold chain. Internet Res. 2016, 26, 435–445. [Google Scholar] [CrossRef]
  2. Wu, J.Y.; Hsiao, H.I. Food quality and safety risk diagnosis in the food cold chain through failure mode and effect analysis. Food Control 2021, 120, 107501. [Google Scholar] [CrossRef]
  3. Jedermann, R.; Ruiz-Garcia, L.; Lang, W. Spatial temperature profiling by semi-passive RFID loggers for perishable food transportation. Comput. Electron. Agric. 2009, 65, 145–154. [Google Scholar] [CrossRef] [Green Version]
  4. FAO. Food Wastage Footprint: Impacts on Natural Resources. Summary Report. 2013. Available online: http://www.fao.org/3/i3347e/i3347e.pdf (accessed on 2 February 2021).
  5. Kummu, M.; de Moel, H.; Porkka, M.; Siebert, S.; Varis, O.; Ward, P.J. Lost food, wasted resources: Global food supply chain losses and their impacts on freshwater, cropland, and fertiliser use. Sci. Total Environ. 2012, 438, 477–489. [Google Scholar] [CrossRef] [PubMed]
  6. Ndraha, N.; Hsiao, H.I.; Vlajic, J.; Yang, M.F.; Lin, H.T.V. Time-temperature abuse in the food cold chain: Review of issues, challenges, and recommendations. Food Control 2018, 89, 12–21. [Google Scholar] [CrossRef] [Green Version]
  7. Alfian, G.; Rhee, J.; Ahn, H.; Lee, J.; Farooq, U.; Ijaz, M.F.; Syaekhoni, M.A. Integration of RFID, wireless sensor networks, and data mining in an e-pedigree food traceability system. J. Food Eng. 2017, 212, 65–75. [Google Scholar] [CrossRef]
  8. Óskarsdóttir, K.; Oddsson, G.V. Towards a decision support framework for technologies used in cold supply chain traceability. J. Food Eng. 2019, 240, 153–159. [Google Scholar] [CrossRef] [Green Version]
  9. Islam, S.; Cullen, J.M. Food Traceability: A Generic Theoretical Framework. Food Control 2021, 123, 107848. [Google Scholar] [CrossRef]
  10. Islam, S.; Cullen, J.M.; Manning, L. Visualising food traceability systems: A novel system architecture for mapping material and information flow. Trends Food Sci. Technol. 2021, 112, 708–719. [Google Scholar] [CrossRef]
  11. Bertolini, M.; Bottani, E.; Rizzi, A.; Volpi, A.; Renzi, P. Shrinkage reduction in perishable food supply chain by means of an RFID-based FIFO management policy. Int. J. RF Technol. 2013, 5, 123–136. [Google Scholar] [CrossRef]
  12. Boss, R.W. The technology of RFID. Libr. Technol. Rep. 2009, 39, 18–24. Available online: https://journals.ala.org/index.php/ltr/article/view/4724/5625 (accessed on 3 January 2021).
  13. Balbinot-Alfaro, E.; Craveiro, D.V.; Lima, K.O.; Costa, H.L.G.; Lopes, D.R.; Prentice, C. Intelligent Packaging with pH Indicator Potential. Food Eng. Rev. 2019, 11, 235–244. [Google Scholar] [CrossRef]
  14. Jedermann, R.; Nicometo, M.; Uysal, I.; Lang, W. Reducing food losses by intelligent food logistics. Philos. Trans. R. Soc. A Math. Phys. Eng. Sci. 2014, 372, 20130302. [Google Scholar] [CrossRef]
  15. Qian, J.P.; Yang, X.T.; Wu, X.M.; Zhao, L.; Fan, B.L.; Xing, B. A traceability system incorporating 2D barcode and RFID technology for wheat flour mills. Comput. Electron. Agric. 2012, 89, 76–85. [Google Scholar] [CrossRef]
  16. Liegeard, J.; Manning, L. Use of intelligent applications to reduce household food waste. Crit. Rev. Food Sci. Nutr. 2020, 60, 1048–1061. [Google Scholar] [CrossRef]
  17. Vijayakumar, V.; Balakrishnan, N. Artificial intelligence-based agriculture automated monitoring systems using WSN. J. Ambient Intell. Humaniz. Comput. 2021, 12, 8009–8016. [Google Scholar] [CrossRef]
  18. Jiang, Z.; Zhang, H.; Sutherland, J.W. Development of multi-criteria decision making model for remanufacturing technology portfolio selection. J. Clean. Prod. 2011, 19, 1939–1945. [Google Scholar] [CrossRef]
  19. Jadhav, A.S.; Sonar, R.M. Evaluating and selecting software packages: A review. Inf. Softw. Technol. 2009, 51, 555–563. [Google Scholar] [CrossRef]
  20. Finkenzeller, K. RFID Handbook Fundamentals and Applications in Contactless Smart Cards, Radio Frequency Identification and Near-Field Communication, 3rd ed.; John Wiley & Sons: West Sussex, UK, 2010; pp. 1–435. [Google Scholar]
  21. Musa, A.; Gunasekaran, A.; Yusuf, Y. Supply chain product visibility: Methods, systems and impacts. Expert Syst. Appl. 2014, 41, 176–194. [Google Scholar] [CrossRef]
  22. Tu, Y.J.; Zhou, W.; Piramuthu, S. Critical risk considerations in auto-ID security: Barcode vs. RFID. Decis. Support. Syst. 2021, 142, 113471. [Google Scholar] [CrossRef]
  23. Martínez-Sala, A.S.; Egea-López, E.; García-Sánchez, F.; García-Haro, J. Tracking of returnable packaging and transport units with active RFID in the grocery supply chain. Comput. Ind. 2009, 60, 161–171. [Google Scholar] [CrossRef] [Green Version]
  24. Qi, L.; Xu, M.; Fu, Z.; Mira, T.; Zhang, X. C2SLDS: A WSN-based perishable food shelf-life prediction and LSFO strategy decision support system in cold chain logistics. Food Control 2014, 38, 19–29. [Google Scholar] [CrossRef] [Green Version]
  25. Liu, Y.; Eckert, C.M.; Earl, C. A review of fuzzy AHP methods for decision-making with subjective judgements. Expert Syst. Appl. 2020, 161, 113738. [Google Scholar] [CrossRef]
  26. Hamzeh, R.; Xu, X. Technology selection methods and applications in manufacturing: A review from 1990 to 2017. Comput. Ind. Eng. 2019, 138, 106123. [Google Scholar] [CrossRef]
  27. Jahanshahloo, G.R.; Lotfi, F.H.; Izadikhah, M. Extension of the TOPSIS method for decision-making problems with fuzzy data. Appl. Math. Comput. 2006, 181, 1544–1551. [Google Scholar] [CrossRef]
  28. Saaty, T.L. Analytic hierarchy process. Wiley StatsRef Stat. Ref. Online 2014. [Google Scholar] [CrossRef]
  29. Ayça Erdoğan, S.; Kahraman, C.; Yasin Ateş, N.; Gülbay, M.; Çevik, S. Hierarchical fuzzy TOPSIS model for selection among logistics information technologies. J. Enterp. Inf. Manag. 2007, 20, 143–168. [Google Scholar] [CrossRef]
  30. Dinmohammadi, A.; Shafiee, M. Determination of the most suitable technology transfer strategy for wind turbines using an integrated AHP-TOPSIS decision model. Energies 2017, 10, 642. [Google Scholar] [CrossRef] [Green Version]
  31. Anand, M.B.; Vinodh, S. Application of fuzzy AHP–TOPSIS for ranking additive manufacturing processes for microfabrication. Rapid Prototyp. J. 2018, 24, 424–435. [Google Scholar] [CrossRef]
  32. Rajak, M.; Shaw, K. Evaluation and selection of mobile health (mHealth) applications using AHP and fuzzy TOPSIS. Technol. Soc. 2019, 59, 101186. [Google Scholar] [CrossRef]
  33. Zadeh, L.A. Fuzzy sets. In Fuzzy Sets, Fuzzy Logic, and Fuzzy Systems: Selected Papers by Lotfi A Zadeh; Klir, G.J., Yuan, B., Eds.; World Scientific: Singapore, 1996; Volume 6, pp. 394–432. [Google Scholar] [CrossRef]
  34. Mavrotas, G.; Diakoulaki, D.; Caloghirou, Y. Project prioritization under policy restrictions. A combination of MCDA with 0–1 programming. Eur. J. Oper. Res. 2006, 171, 296–308. [Google Scholar] [CrossRef]
  35. Tavana, M.; Keramatpour, M.; Santos-Arteaga, F.J.; Ghorbaniane, E. A fuzzy hybrid project portfolio selection method using data envelopment analysis, TOPSIS and integer programming. Expert Syst. Appl. 2015, 42, 8432–8444. [Google Scholar] [CrossRef]
  36. Kabli, M.R. A Multi-Attribute Decision Making Methodology for Selecting New R&D Projects Portfolio with a Case Study of Saudi Oil Refining Industry. Ph.D. Thesis, University of Nottingham, Nottingham, UK, 2009. [Google Scholar]
  37. Büyüközkan, G.; Karabulut, Y.; Arsenyan, J. RFID service provider selection: An integrated fuzzy MCDM approach. Measurement 2017, 112, 88–98. [Google Scholar] [CrossRef]
  38. Alibaba. Available online: www.alibaba.com (accessed on 1 March 2021).
  39. Amazon. Available online: www.amazon.co.uk (accessed on 1 March 2021).
  40. McCathie, L.; Michael, K. Is it the end of barcodes in supply chain management? In Proceedings of the Collaborative Electronic Commerce Technology and Research Conference LatAm, University of Talca, Talca, Chile, 3–5 October 2005; pp. 1–19. [Google Scholar]
  41. Senneset, G.; Forås, E.; Fremme, K.M. Challenges regarding implementation of electronic chain traceability. Br. Food J. 2007, 109, 805–818. [Google Scholar] [CrossRef]
  42. Fan, B.; Qian, J.; Wu, X.; Du, X.; Li, W.; Ji, Z.; Xin, X. Improving continuous traceability of food stuff by using barcode-RFID bidirectional transformation equipment: Two field experiments. Food Control 2019, 98, 449–456. [Google Scholar] [CrossRef]
  43. Erman Erkan, T.; Feryal Can, G. Selecting the best warehouse data collecting system by using AHP and FAHP methods. Teh. Vjesn. Tech. Gaz. 2014, 21, 87–93. [Google Scholar]
  44. D’Hont, S. The Cutting Edge of RFID Technology and Applications for Manufacturing and Distribution. Tex. Instrum. TIRIS 2004, 16, 1–13. Available online: http://idc-online.com/technical_references/pdfs/instrumentation/The%20Cutting%20Edge%20of%20RFID%20Technology.pdf (accessed on 15 March 2021).
  45. GS1. EAN/UPC Barcodes. Available online: https://www.gs1.org/standards/barcodes/ean-upc (accessed on 26 April 2021).
  46. Aroor, S.R.; Deavours, D.D. Evaluation of the state of passive UHF RFID: An experimental approach. IEEE Syst. J. 2007, 1, 168–176. [Google Scholar] [CrossRef]
  47. RFID4U. How to Select a Correct Tag—Frequency. Available online: https://rfid4u.com/rfid-frequency (accessed on 29 December 2020).
  48. Chawla, V.; Ha, D.S. An overview of passive RFID. IEEE Commun. Mag. 2007, 45, 11–17. [Google Scholar] [CrossRef]
  49. Impinj. Types of RFID Systems. Available online: https://www.impinj.com/products/technology/how-can-rfid-systems-be-categorized (accessed on 10 January 2021).
  50. ISO/IEC. ISO/IEC 18000-2:2009 Information Technology—Radio Frequency Identification for Item Management—Part 2: Parameters for Air Interface Communications Below 135 kHz. 2009. Available online: https://bsol.bsigroup.com/Bibliographic/BibliographicInfoData/000000000030273596 (accessed on 1 May 2021).
  51. GS1. EPC Tag Data Standard—Defines the Electronic Product CodeTM and Specifies the Memory Contents of Gen 2 RFID Tags. 2019. Available online: https://www.gs1.org/sites/default/files/docs/epc/GS1_EPC_TDS_i1_13.pdf (accessed on 26 April 2021).
  52. Costa, C.; Antonucci, F.; Pallottino, F.; Aguzzi, J.; Sarriá, D.; Menesatti, P. A review on agri-food supply chain traceability by means of RFID technology. Food Bioprocess. Technol. 2013, 6, 353–366. [Google Scholar] [CrossRef]
  53. Favre, R. Using Radio Frequency Identification (RFID) for Monitoring Trees in the Forest: State-of-the-Technology Investigation; United States Department of Agriculture (USDA): Washington, DC, USA, 2014; Report. Available online: https://www.fs.fed.us/t-d/pubs/pdfpubs/pdf14191805/pdf14191805dpi100.pdf (accessed on 24 May 2021).
  54. Feng, J.; Fu, Z.; Wang, Z.; Xu, M.; Zhang, X. Development and evaluation on a RFID-based traceability system for cattle/beef quality safety in China. Food Control 2013, 31, 314–325. [Google Scholar] [CrossRef]
  55. Abad, E.; Palacio, F.; Nuin, M.; De Zárate, A.G.; Juarros, A.; Gómez, J.M.; Marco, S. RFID smart tag for traceability and cold chain monitoring of foods: Demonstration in an intercontinental fresh fish logistic chain. J. Food Eng. 2009, 93, 394–399. [Google Scholar] [CrossRef]
  56. ISO/IEC. ISO/IEC 18000-3:2010 Information technology—Radio Frequency Identification for Item Management—Part 3: Parameters for Air Interface Communications at 13.56 MHz. 2010. Available online: https://bsol.bsigroup.com/Bibliographic/BibliographicInfoData/000000000030219362 (accessed on 1 May 2021).
  57. Tan, J.; Sathyamurthy, M.; Rolapp, A.; Gamez, J.; Hennig, E.; Schäfer, E.; Sommer, R. A Fully Passive RFID Temperature Sensor SoC With an Accuracy of ±0.4 °C (3σ) From 0 °C to 125 °C. IEEE J. Radio Freq. Identif. 2019, 3, 35–45. [Google Scholar] [CrossRef]
  58. Thakur, M.; Forås, E. EPCIS based online temperature monitoring and traceability in a cold meat chain. Comput. Electron. Agric. 2015, 117, 22–30. [Google Scholar] [CrossRef]
  59. Bukkapatnam, S.; Govardhan, J.M.; Hariharan, S.; Rajamani, V.; Gardner, B.; Contreras, A. Sensor (RFID) Networks and Complex Manufacturing Systems Monitoring (COMMSENS): Laboratory for RFID Research; Unpublished Research; Oklahoma State University: Stillwater, OK, USA, 2005; Available online: https://citeseerx.ist.psu.edu/viewdoc/download?doi=10.1.1.817.9444&rep=rep1&type=pdf (accessed on 15 February 2021).
  60. GS1. EPCTM Radio-Frequency Identity Protocols Generation-2 UHF RFID. 2015. Available online: https://www.gs1.org/sites/default/files/docs/epc/Gen2_Protocol_Standard.pdf (accessed on 26 April 2021).
  61. Blom, E.D.; Wan, J.; Urie, S.H.U.S. RFID Temperature Logger Incorporating a Frequency Ratio Digitizing Temperature Sensor. Patent No. 7,474,230, 6 January 2009. [Google Scholar]
  62. Islam, S.; Manning, L.; Cullen, J.M. Advances in traceability systems in agri-food supply chains. In Developing Smart Agri-Food Supply Chains: Using Technology to Improve Safety and Quality; Manning, L., Ed.; Burleigh Dodds Science Publishing Ltd.: Cambridge, UK, 2021. [Google Scholar]
  63. Hammervoll, T.; Jensen, L.M.; Hafliðason, T.; Ólafsdóttir, G.; Bogason, S.; Stefánsson, G. Criteria for temperature alerts in cod supply chains. Int. J. Phys. Distrib. Logist. Manag. 2012, 42, 355–371. [Google Scholar] [CrossRef]
  64. Crossbow Technology Datasheet. Crossbow’s TelosB Mote (TPR2400) Datasheet. Available online: https://www.willow.co.uk/TelosB_Datasheet.pdf (accessed on 3 March 2021).
  65. Wang, J.; Wang, H.; He, J.; Li, L.; Shen, M.; Tan, X.; Min, H.; Zheng, L. Wireless sensor network for real-time perishable food supply chain management. Comput. Electron. Agric. 2015, 110, 196–207. [Google Scholar] [CrossRef]
  66. Huang, V.; Javed, M.K. Semantic sensor information description and processing. In Proceedings of the Second International Conference on Sensor Technologies and Applications (Sensorcomm 2008), Cap Esterel, France, 25–31 August 2008; IEEE Computer Society: Washington, DC, USA, 2008; pp. 456–461. [Google Scholar] [CrossRef]
  67. Lee, C.C. Security and Privacy in Wireless Sensor Networks: Advances and Challenges. Sensors 2020, 20, 744. [Google Scholar] [CrossRef] [Green Version]
  68. Dobrucka, R.; Cierpiszewski, R. Active and intelligent packaging food-Research and development-A Review. Pol. J. Food Nutr. Sci. 2014, 64, 7–15. [Google Scholar] [CrossRef] [Green Version]
  69. Tan, J.; Koo, S.G. A survey of technologies in internet of things. In Proceedings of the 2014 IEEE International Conference on Distributed Computing in Sensor Systems, Marina Del Rey, CA, USA, 26–28 May 2014; IEEE: Piscataway, NJ, USA, 2014; pp. 269–274. [Google Scholar] [CrossRef]
  70. Zhang, X.; Zhang, J.; Liu, F.; Fu, Z.; Mu, W. Strengths and limitations on the operating mechanisms of traceability system in agro food, China. Food Control 2010, 21, 825–829. [Google Scholar] [CrossRef]
  71. Von Reischach, F.; Karpischek, S.; Adelmann, R.; Michahelles, F. Evaluation of 1D barcode scanning on mobile phones. In Proceedings of the 2010 Internet of Things (IOT), Tokyo, Japan, 29 November–1 December 2010; IEEE: Piscataway, NJ, USA, 2010; pp. 2–5. [Google Scholar] [CrossRef]
  72. Tec-IT. Barcode Overview. Available online: https://www.tec-it.com/en/support/knowbase/barcode-overview/linear/Default.aspx (accessed on 30 April 2021).
  73. Palmer, R.C. The Bar Code Book: Reading, Printing, and Specification of Bar Code Symbols, 3rd ed.; Helmers Publishing Inc.: Peterborough, NH, USA, 1989. [Google Scholar]
  74. ISO/IEC. ISO/IEC 15963:2009 Information Technology—Radio Frequency Identification for Item Management—Unique Identification for RF Tags. 2009. Available online: https://bsol.bsigroup.com/Bibliographic/BibliographicInfoData/000000000030273595 (accessed on 1 May 2021).
  75. Occhiuzzi, C.; Caizzone, S.; Marrocco, G. Passive UHF RFID antennas for sensing applications: Principles, methods, and classifications. IEEE Antennas Propag. Mag. 2013, 55, 14–34. [Google Scholar] [CrossRef] [Green Version]
  76. Vaz, A.; Ubarretxena, A.; Zalbide, I.; Pardo, D.; Solar, H.; Garcia-Alonso, A.; Berenguer, R. Full passive UHF tag with a temperature sensor suitable for human body temperature monitoring. IEEE Trans. Circuits Syst. II Express Briefs 2010, 57, 95–99. [Google Scholar] [CrossRef]
  77. Howard, J. Combination RFID and GPS Functionality on Intelligent Label. U.S. Patent No. 6,614,392, 2 September 2003. [Google Scholar]
  78. Mainetti, L.; Patrono, L.; Stefanizzi, M.L.; Vergallo, R. An innovative and low-cost gapless traceability system of fresh vegetable products using RF technologies and EPCglobal standard. Comput. Electron. Agric. 2013, 98, 146–157. [Google Scholar] [CrossRef]
  79. Trafton, A. Detecting Gases Wirelessly and Cheaply. Available online: https://news.mit.edu/2014/wireless-chemical-sensor-for-smartphone-1208 (accessed on 8 December 2014).
  80. Aung, M.M.; Chang, Y.S. Traceability in a food supply chain: Safety and quality perspectives. Food Control 2014, 39, 172–184. [Google Scholar] [CrossRef]
  81. Ruiz-Garcia, L.; Lunadei, L.; Barreiro, P.; Robla, I. A Review of Wireless Sensor Technologies and Applications in Agriculture and Food Industry: State of the Art and Current Trends. Sensors 2009, 9, 4728–4750. [Google Scholar] [CrossRef] [PubMed] [Green Version]
  82. Leenen, M.A.M.; Arning, V.; Thiem, H.; Steiger, J.; Anselmann, R. Printable electronics: Flexibility for the future. Phys. Status Solidi A 2009, 206, 588–597. [Google Scholar] [CrossRef]
  83. Fan, T.J.; Chang, X.Y.; Gu, C.H.; Yi, J.J.; Deng, S. Benefits of RFID technology for reducing inventory shrinkage. Int. J. Prod. Econ. 2014, 147, 659–665. [Google Scholar] [CrossRef]
  84. Ruiz-Garcia, L.; Lunadei, L. Monitoring cold chain logistics by means of RFID. In Sustainable Radio Frequency Identification Solutions; Turcu, C., Ed.; IntechOpen: London, UK, 2010; Volume 2, pp. 37–50. Available online: http://oa.upm.es/9615/1/Sustainable_RFID_Solutions.pdf (accessed on 4 April 2021).
  85. Qu, Z.; Sun, X.; Chen, X.; Yuan, S. A novel RFID multi-tag anti-collision protocol for dynamic vehicle identification. PLoS ONE 2019, 14, e0219344. [Google Scholar] [CrossRef]
  86. Karlsen, K.M.; Donnelly, K.A.M.; Olsen, P. Granularity and its importance for traceability in a farmed salmon supply chain. J. Food Eng. 2011, 102, 1–8. [Google Scholar] [CrossRef]
  87. Kumar, P.; Reinitz, H.W.; Simunovic, J.; Sandeep, K.P.; Franzon, P.D. Overview of RFID Technology and Its Applications in the Food Industry. J. Food Sci. 2009, 74, R101–R106. [Google Scholar] [CrossRef]
  88. ISO/IEC. ISO/IEC 18000-6:2013 Information Technology. Radio Frequency Identification for Item Management. 2013. Available online: https://bsol.bsigroup.com/Bibliographic/BibliographicInfoData/000000000030246358 (accessed on 1 May 2021).
  89. Chou, C.H.; Liang, G.S.; Chang, H.C. A fuzzy AHP approach based on the concept of possibility extent. Qual. Quant. 2013, 47, 1–14. [Google Scholar] [CrossRef]
  90. Chen, C.T.; Huang, S.F. Order-fulfillment ability analysis in the supply-chain system with fuzzy operation times. Int. J. Prod. Econ. 2006, 101, 185–193. [Google Scholar] [CrossRef]
  91. Mohammed, A.; Setchi, R.; Filip, M.; Harris, I.; Li, X. An integrated methodology for a sustainable two-stage supplier selection and order allocation problem. J. Clean. Prod. 2018, 192, 99–114. [Google Scholar] [CrossRef] [Green Version]
  92. Lupo, T.; Bellomo, E. DINESERV along with fuzzy hierarchical TOPSIS to support the best practices observation and service quality improvement in the restaurant context. Comput. Ind. Eng. 2019, 137, 106046. [Google Scholar] [CrossRef]
  93. Li, Q. A novel Likert scale based on fuzzy sets theory. Expert Syst. Appl. 2013, 40, 1609–1618. [Google Scholar] [CrossRef]
  94. Rana, R.L.; Tricase, C.; De Cesare, L. Blockchain technology for a sustainable agri-food supply chain. Br. Food J. 2021. [Google Scholar] [CrossRef]
  95. Violino, S.; Pallottino, F.; Sperandio, G.; Figorilli, S.; Antonucci, F.; Ioannoni, V.; Fappiano, D.; Costa, C. Are the innovative electronic labels for extra virgin olive oil sustainable, traceable, and accepted by consumers? Foods 2019, 8, 529. [Google Scholar] [CrossRef] [PubMed] [Green Version]
Figure 1. Technology portfolio selection framework.
Sustainability 13 09385 g001
Table 1. Food traceability technologies compared across key criteria.
BenefitOverall Cost
(C1)
Vulnerability to Water
(C2)
Flexibility
(C3)
Accuracy of Information
(C4)
Reading Range
(C5)
Data Transfer Speed
(C6)
Multiple Tags Readability
(C7)
Identification Capacity
(C8)
Tag Writing Cycle
(C9)
Memory Capacity
(C10)
Environmental Parameters Recording
(C11)
Real Time Location Recording
(C12)
Real Time Alert
(C13)
Durability of Data Carrier (C14)World-Wide Standard (C15)Data Security
(C16)
Manual Data Readability (C17)
Technology
Paper based recordingMore than barcode for no encoding [38,39] (Lowest)Most susceptible to damage [8]
(Highest)
High carrier weight for no encoding [40]
(Lowest)
Least accurate for human error [41]
(Lowest)
(Not applicable)Slowest data transfer [40]
(Negligible)
(Not applicable)Item level unique identification (Highest)(Not applicable)(Not applicable)(Not applicable)(Certainly not)(Certainly not)Limited durability
(Lowest)
No standardization [8]
(Certainly not)
No encryption or password protection (Certainly not)Manually readable
(Highest)
1D BarcodeEncoding capacity and lowest carrier cost [38,39] (Between negligible and lowest)Noticeable performance downturn [40] (Fair)Light weight, printable and wearable tag [40]
(Highest)
Minimum 80% accuracy for human error, line-of-sight and harsh environment [40] (Medium high to high)Line-of-sight and close-contact reading up to 10 cm [42] (Lowest)Line-of-sight and shortest reading distance causes around 4 s/read [20]
(Low)
Read tag individually [43]
(Certainly not)
Product class/SKU identification [40,44]
(Fair)
Single writing tag [21]
(Lowest)
20–80 alphanumeric characters
(Lowest)
(Certainly not)(Certainly not)(Certainly not)Limited durability for environmental damage [22]
(Lowest)
Global symbology standard [40,45]
(Highest)
Simple encryption of data visible physically [22,46]
(Low)
Manual readability by accompanied alphanumeric code [40]
(Highest)
2D barcodeEncoding capacity with lowest carrier cost [38,39] (Between negligible and lowest)Noticeable performance downturn [40] (Fair)Light weight, printable and wearable tag [40] (Highest)Minimum 80% accuracy for human error, line-of-sight, and harsh environment [40] (Medium high to high)Line-of-sight and close-contact reading up to 10 cm [42]
(Lowest)
Line-of-sight and shortest reading distance causes around 4 s/read [20]
(Low)
Reads tag individually [43]
(Certainly not)
Item level unique identification [40] (Highest)Single writing tag [21] (Lowest)2335–4296 alphanumeric and ASCII characters (Medium high)(Certainly not)(Certainly not)(Certainly not)Limited durability for environmental damage [22]
(Lowest)
Global standard for symbology [40,45]
(Highest)
Deep encryption of data visible physically [42]
(Fair)
No instant manual readability [40]
(Certainly not)
RFID passive LF read-onlyHigher tag cost than HF and UHF for heavier antenna design [38,39] (Fair)Waterproof [47]
(Certainly not)
Heavier than HF, UHF RFID tags and barcodes [47,48] (Fair)Most accurate for minimum human dependency and environment insensitivity [20] (Highest)Non-line-of-sight and close contact reading between 1–10 cm [49]
(Low)
Data transfer at 8 kb/s [50]
(Between Low and medium low)
Reads tag individually [20]
(Certainly not)
Item level unique identification [51]
(Highest)
No writing capacity [52]
(Certainly not)
64–96b TID written by manufacturer (Low)(Certainly not)(Certainly not)(Certainly not)10–20 years [53] (Highest)ISO11784, ISO 11785, ISO/IEC 15963 [20] (Highest)Binary encryption of data, invisible outside but low protection against unauthorized memory access [20] (Fair)No instant manual readability [40]
(Certainly not)
RFID passive LF read-writeHigher tag cost than HF and UHF for heavier antenna design [38,39] (Fair) Waterproof [47]
(Certainly not)
Heavier than HF, UHF RFID tags and barcodes [47,48] (Fair)Most accurate for minimum human dependency and environment insensitivity [20] (Highest)Non-line-of-sight and close contact reading between 1–10 cm [49]
(Low)
Data transfer at 8 kb/s [50]
(Between Low and medium low)
Reads small number of tags at once [20] (Low)Item level unique identification [51]
(Highest)
Multiple writing tag [54] (Highest)128–256 b memory [38,39] (Medium Low)(Certainly not)(Certainly not)(Certainly not)10–20 years [53] (Highest)ISO/IEC 15963, ISO/IEC 14223, ISO/IEC 18000-2 [20] (Highest)Binary encryption, password and cryptographic protection [20]
(Highest)
No instant manual readability [40]
(Certainly not)
RFID passive HF read-onlyLower tag cost and higher reader cost than LF [38,39] (Fair)Waterproof [47,55]
(Certainly not)
Thinner than LF tags but thicker than UHF tags [47,48]
(High)
Most accurate for minimum human dependency and environment insensitivity [20] (Highest)Contactless reading between 10 cm–1 m [49]
(Fair)
Data transfer at 105.9 kb/s [56] (Fair)Reads more tags than LFsimultaneously [20] (Fair)Item level unique identification [51] (Highest)No writing capacity [52] (Certainly not)64–96 b TID written by manufacturer (Low)(Certainly not)(Certainly not)(Certainly not)10–20 years [53] (Highest)ISO/IEC 15963, ISO/IEC 15693, [20] (Highest)Binary encrypted data, invisible outside but low protection against unauthorized memory access [20] (Fair)No instant manual readability [40] (Certainly not)
RFID passive HF read-writeLower tag cost, and higher reader cost than LF [38,39] (Fair)Waterproof [47,55]
[Certainly not]
Thinner than LF tags but thicker than UHF tags [47,48]
(High)
Most accurate for minimum human dependency and environment insensitivity [20] (Highest)Contactless reading between 10 cm–1 m [49] (Fair)Data transfer at 105.9 kb/s [56] (Fair)Reads more tags than LFsimultaneously [20] (Fair)Item level unique identification [51] (Highest)Multiple writing tag [54] (Highest)256–1024 b [38,39] (Fair)(Certainly not)(Certainly not)(Certainly not)10–20 years [53] (Highest)ISO/IEC 15963, ISO/IEC 15693, ISO/IEC 18000-3 [20] (Highest)Binary encryption, password and cryptographic protection [20] (Highest)No instant manual readability [40] (Certainly not)
RFID passive HF with sensor Lower tag cost, and higher reader cost than LF [38,39] (Fair)Waterproof [47,55] (Certainly not)Thinner than LF tags but thicker than UHF tags [47,48] (High)Most accurate for minimum human dependency and environment insensitivity [20] (Highest)Reading range impaired by onboard sensor [20] (Low)Data
transfer at 105.9 kb/s [56] (Fair)
Reads more tags than LFsimultaneously [56] (Fair)Item level unique identification [33,51] (Highest)Multiple writing tag [54] (Highest)256–1024 b [38,39] (Fair)Records only when powered by reader [57,58] Fair)(Certainly not)(Certainly not)10–20 years [53] (Highest)ISO/IEC 15963, ISO/IEC 15693, ISO/IEC 18000-3 [20] (Highest)Binary encryption, password and cryptographic protection [20] (Highest)No instant manual readability [40] (Certainly not)
RFID passive UHF read onlyHigher reader cost than HF and LF [38,39] (Medium high)Affects readability [55,59] (Between medium high and high)Thinner than HF tags [47,48] (Highest) Most accurate for minimum human dependency and environment insensitivity [20] (Highest)Contactless reading between 3 cm–9 m [47] (High)Data
transfer at 40–640 kb/s
[60] (Medium high to high)
Reads more tags than HFsimultaneously [20] (Between medium high and high)Item level unique identification [51] (Highest)No writing capacity [52] (Certainly not)64–96 b TID written by manufacturer (Low)(Certainly not)(Certainly not)(Certainly not)10–20 years [53] (Highest)ISO/IEC 15963, ISO/IEC 18000-6, EPC gen2 UHF protocol [20] (Highest)Binary encrypted data, invisible outside but low protection against unauthorized memory access [20] (Fair)No instant manual readability [20] (Certainly not)
RFID passive UHF read-writeHigher reader cost than HF and LF [38,39] (Medium high)Affects readability [55,59] (Between medium high and high)Thinner than HF tags [47,48] (Highest)Most accurate for minimum human dependency and environment insensitivity [20] (Highest)Contactless reading between 3 cm–9 m [47] (High)Data
transfer at 40–640 kb/s [60] (Medium high to high)
Reads more tags than HFsimultaneously [20] (Between medium high and high)Item level unique identification [51] (Highest)Multiple writing tag [54] (Highest)256 b–8 kb [38,39] (Medium high)(Certainly not)(Certainly not)(Certainly not)10–20 years [53] (Highest)ISO/IEC 15963, ISO/IEC 18000-6C, EPC gen2 UHF protocol [20] (Highest)Binary encryption, password and cryptographic protection [20] (Highest)No instant manual readability [40] (Certainly not)
RFID passive UHF read write with sensorHigher reader cost than HF and LF [38,39] (Medium high) Affects readability [55,59] (Between medium high and high)Thinner than HF tags [47,48] (Highest)Most accurate for minimum human dependency and environment insensitivity [20] (Highest)Reading range impaired by onboard sensor [20]
(Fair)
Data
transfer at 40–640 kb/s [60] (Medium high to high)
Reads more tags than HFsimultaneously [20] (Between medium high and high)Item level unique identification [51] (Highest)Multiple writing tag [54] (Highest)256 b–8 kb [38,39] (Medium high)Records only when powered by reader [57,58] (Fair)(Certainly not)(Certainly not)10–20 years [53] (Highest)ISO/IEC 15963, ISO/IEC 18000-6C, EPC gen2 UHF protocol [20] (Highest)Binary encryption, password and cryptographic protection [20] (Highest)No instant manual readability [40] (Certainly not)
Semi passive RFIDHigher tag cost than UHF due to battery [38,39] (Between high and highest)Affects readability [55,59] (Between medium high and high)Heavier than passive LF due to onboard battery [8,47] (Low)Most accurate for minimum human dependency and environment insensitivity [20] (Highest)Contactless reading between 3 cm–15 m [20] (High)Larger reading speed than UHF due to battery [20] (High)Reads more tags than HFsimultaneously [20] (Between medium high and high)Item level unique identification [51] (Highest)Multiple writing tag [20] (Highest)Up to 20 kb [38,39]
(High)
Real time recording of product physical data with onboard battery [61] (Highest)Real time recording of location with onboard battery and sensor [8] (Highest)Connect alert module with onboard battery [8] (Highest) 2–7 years for limited battery life [20] (Fair to medium high)ISO/IEC 15963, ISO/IEC 18000-6 [20] (Highest)Binary encryption, password and cryptographic protection [20] (Highest)No instant manual readability [40] (Certainly not)
Active RFIDHigher tag cost than semi passive due to transmitter [38,39] (Highest)Waterproof [59] (Certainly not)Heaviest tag with onboard battery and transceiver [47] (Certainly not)Most accurate for minimum human dependency and environment insensitivity [20] (Highest)Contactless reading up to 100 m [49] (Highest)Maximum read speed for high frequency, battery, and transceiver [20] (Highest)Reads maximum number of tags simultaneously as tags include own batteries and transceivers (Highest)Item level unique identification [51] (Highest)Multiple writing tag [54] (Highest)More than 20 kb [38,39] (Highest)Real time recording of product physical data with onboard battery [23] (Highest)Real time recording of location with onboard battery and sensor [8] (Highest)Connects alert module with onboard battery [8] (Highest)2–7 years for limited battery life [20] (Fair to medium high)ISO/IEC 15963 [20] (Highest)Binary encryption, password and cryptographic protection [20] (Highest)No instant manual readability [40] (Certainly not)
NFCNo additional reader cost as smartphone reading is possible [38,39] (Low)Waterproof [47,55] (Certainly not)Thinner than LF tags [47,48] (High)Most accurate for minimum human dependency and environment insensitivity [20] (Highest)Contactless reading between 1–3 cm (Low) Data
transfer at 105.9 kb/s [56] (Fair)
Reads multiple tagssimultaneously as HF RFID [20] (Fair)Item level unique identification [51] (Highest)Multiple writing tag [62] (Highest)256–1024 b [38,39] (Fair)(Certainly not)(Certainly not)(Certainly not)10–20 years [53] (Highest)ISO14443A, ISO/IEC 18000-3 [20] (Highest)Binary encryption, password and cryptographic protection [20] (Highest)No instant manual readability [40] (Certainly not)
WSNHighest cost as a node comprising multiple components [38,39] (Highest)Waterproof [8]
(Certainly not)
Heaviest node consisting of several components [8] (Certainly not)Can be as high as ±0.5 °C for temperature sensors [63] (Highest)Contactless reading up to 100 m [64] (Highest)Data
transfer at 250 kb/s [64] (Between fair and medium high)
(Not applicable)(Not applicable)(Not applicable)Limited memory capacity [63] (Low)Real time recording of product physical data with onboard battery [65] (Highest)Real time recording of location with onboard battery and sensor [8] (Highest)Includes real time alert module [63] (Highest) 2–7 years for limited battery life [8] (Fair to medium high)IEEE 802.15.4 Zigbee protocol and computer readable data standard [62,66] (Highest)Password and cryptographic protection against unauthorized access [67] (Highest)No instant manual readability [24] (Certainly not)
Smart packaging indicatorHigh cost due to absence of reuse capability [38,39] (High)Waterproof [63]
(Certainly not)
Light weight, printable and wearable [8]
(Highest)
Can be as high as ±0.5 °C for TTIs
[63] (Highest)
(Not applicable)Slowest manual data transfer [63] (Negligible)(Not applicable)(Not applicable)(Not applicable)Records full temperature history [68]
(Highest)
Records environmental parameters with own battery [13] (Highest)(Certainly not)Can emit a signal in response to any change [13] (Highest)Single use only [8] (Lowest)No technical or data standard [24] (Certainly not)No encryption or password protection [8] (Certainly not)Manual readability [24] (Highest)
Table 2. Criteria rating fuzzy scale.
Saaty’s ScaleLinguistic TermFuzzy Number
1Equally important(1, 1, 1)
2Between equally and weakly important(1, 2, 3)
3Weakly important(2, 3, 4)
4Between weakly and fairly important(3, 4, 5)
5Fairly important(4, 5, 6)
6Between fairly and strongly important(5, 6, 7)
7Strongly important(6, 7, 8)
8Between strongly and absolutely important(7, 8, 9)
9Absolutely important(9, 9, 9)
Table 3. Technology performance rating fuzzy scale.
Linguistic TermFuzzy Number
Certainly not/negligible/not applicable(0.0, 0.0, 0.0)
Lowest(0.0, 0.1, 0.2)
Low(0.1, 0.2, 0.3)
Medium low(0.2, 0.3, 0.4)
Fair(0.3, 0.5, 0.7)
Medium high(0.5, 0.7, 0.8)
High(0.7, 0.8, 0.9)
Highest(0.8, 0.9, 1.0)
Table 4. Combined pairwise criteria comparison matrix for two decision makers for case 1.
CriteriaC4C5C6C8C11C15C16C10C9C1
C4(1, 1, 1)(0.14, 0.17, 0.2)(0.18, 0.22, 0.29)(0.16, 0.19, 0.24)(0.14, 0.17, 0.20)(1, 2, 3)(2.45, 3.46, 4.47)(0.29, 0.41, 0.71)(0.29, 0.41, 0.71)(2.45, 3.46, 4.47)
C5(5, 6, 7)(1, 1, 1)(1.41, 2.45, 3.46)(0.82, 1.23, 2)(0.58, 1, 1.7)(6, 7, 8)(7.94, 8.49, 9)(3.46, 4.47, 5.48)(3.46, 4.47, 5.48)(7.94, 8.49, 9)
C6(3.46, 4.47, 5.48)(0.29, 0.41, 0.71)(1, 1, 1)(0.45, 0.71, 1)(0.29, 0.41, 0.71)(4.47, 5.48, 6.48)(6, 7, 8)(2, 3, 4)(1.73, 2.83, 3.87)(5.92, 6.93, 7.94)
C8(4.24, 5.29, 6.33)(0.50, 0.82, 1.22)(1, 1.41, 2.24)(1, 1, 1)(0.63, 0.87, 1.16)(5.29, 6.33, 7.35)(6.71, 7.35, 7.94)(2.24, 3.46, 4.58)(2.83, 3.87, 4.90)(6.48, 7.48, 8.49)
C11(4.90, 5.92, 6.93)(0.58, 1, 1.73)(1.41, 2.45, 3.46)(0.87, 1.16, 1.58)(1, 1, 1)(5.92, 6.93, 7.94)(7.94, 8.49, 9)(3.46, 4.47, 5.48)(3.16, 4.24, 5.29)(7.35, 7.94, 8.49)
C15(0.33, 0.50, 1)(0.13, 0.14, 0.17)(0.15, 0.18, 0.22)(0.14, 0.16, 0.19)(0.13, 0.14, 0.17)(1, 1, 1)(1.41, 2.45, 3.46)(0.22, 0.29, 0.41)(0.22, 0.29, 0.41)(1.41, 2.45, 3.46)
C16(0.22, 0.29, 0.41)(0.11, 0.12, 0.13)(0.13, 0.14, 0.17)(0.13, 0.14, 0.15)(0.11, 0.12, 0.13)(0.29, 0.41, 0.71)(1, 1, 1)(0.17, 0.20, 0.25)(0.17, 0.20, 0.26)(0.58, 1, 1.73)
C10(1.41, 2.45, 3.46)(0.18, 0.22, 0.29)(0.25, 0.33, 0.50)(0.22, 0.29, 0.45)(0.18, 0.22, 0.29)(2.45, 3.46, 4.47)(4, 5, 6)(1, 1, 1)(0.577, 1, 1.732)(3.873, 4.899, 5.916)
C9(1.414, 2.449, 3.464)(0.183, 0.224, 0.289)(0.258, 0.354, 0.577)(0.204, 0.258, 0.354)(0.189, 0.236, 0.316)(2.449, 3.464, 4.472)(3.873, 4.899, 5.916)(0.577, 1, 1.732)(1, 1, 1)(4, 5, 6)
C1(0.223, 0.289, 0.408)(0.111, 0.118, 0.126)(0.126, 0.144, 0.169)(0.118, 0.134, 0.154)(0.118, 0.126, 0.136)(0.289, 0.408, 0.707)(0.577, 1, 1.732)(0.169, 0.204, 0.258)(0.167, 0.200, 0.250)(1, 1, 1)
Table 5. TOPSIS scores and augmented scores of technologies for case 1.
Score TOPSIS   Score   ( c c k ) Augmented   Score   ( a s k )
Technologies
1D barcode 0.1940351
Paper-based records0.2445712
2D barcode0.2928404
RFID passive LF read-only 0.3002408
RFID passive LF read-write0.32331116
NFC0.35578732
RFID passive HF read-only0.40774164
RFID passive HF read-write 0.430721128
Smart packaging indicator0.456266256
RFID passive HF with sensor0.497800512
RFID passive UHF read only0.5039041024
RFID passive UHF read-write0.5259852048
RFID passive UHF read-write with sensor0.6315674096
WSN0.6940058192
Semi-passive RFID0.91653316384
Active RFID0.96291132768
Publisher’s Note: MDPI stays neutral with regard to jurisdictional claims in published maps and institutional affiliations.

