
Promoting Green Real Estate Development by Increasing Residents’ Satisfaction


Abstract
:1. Introduction
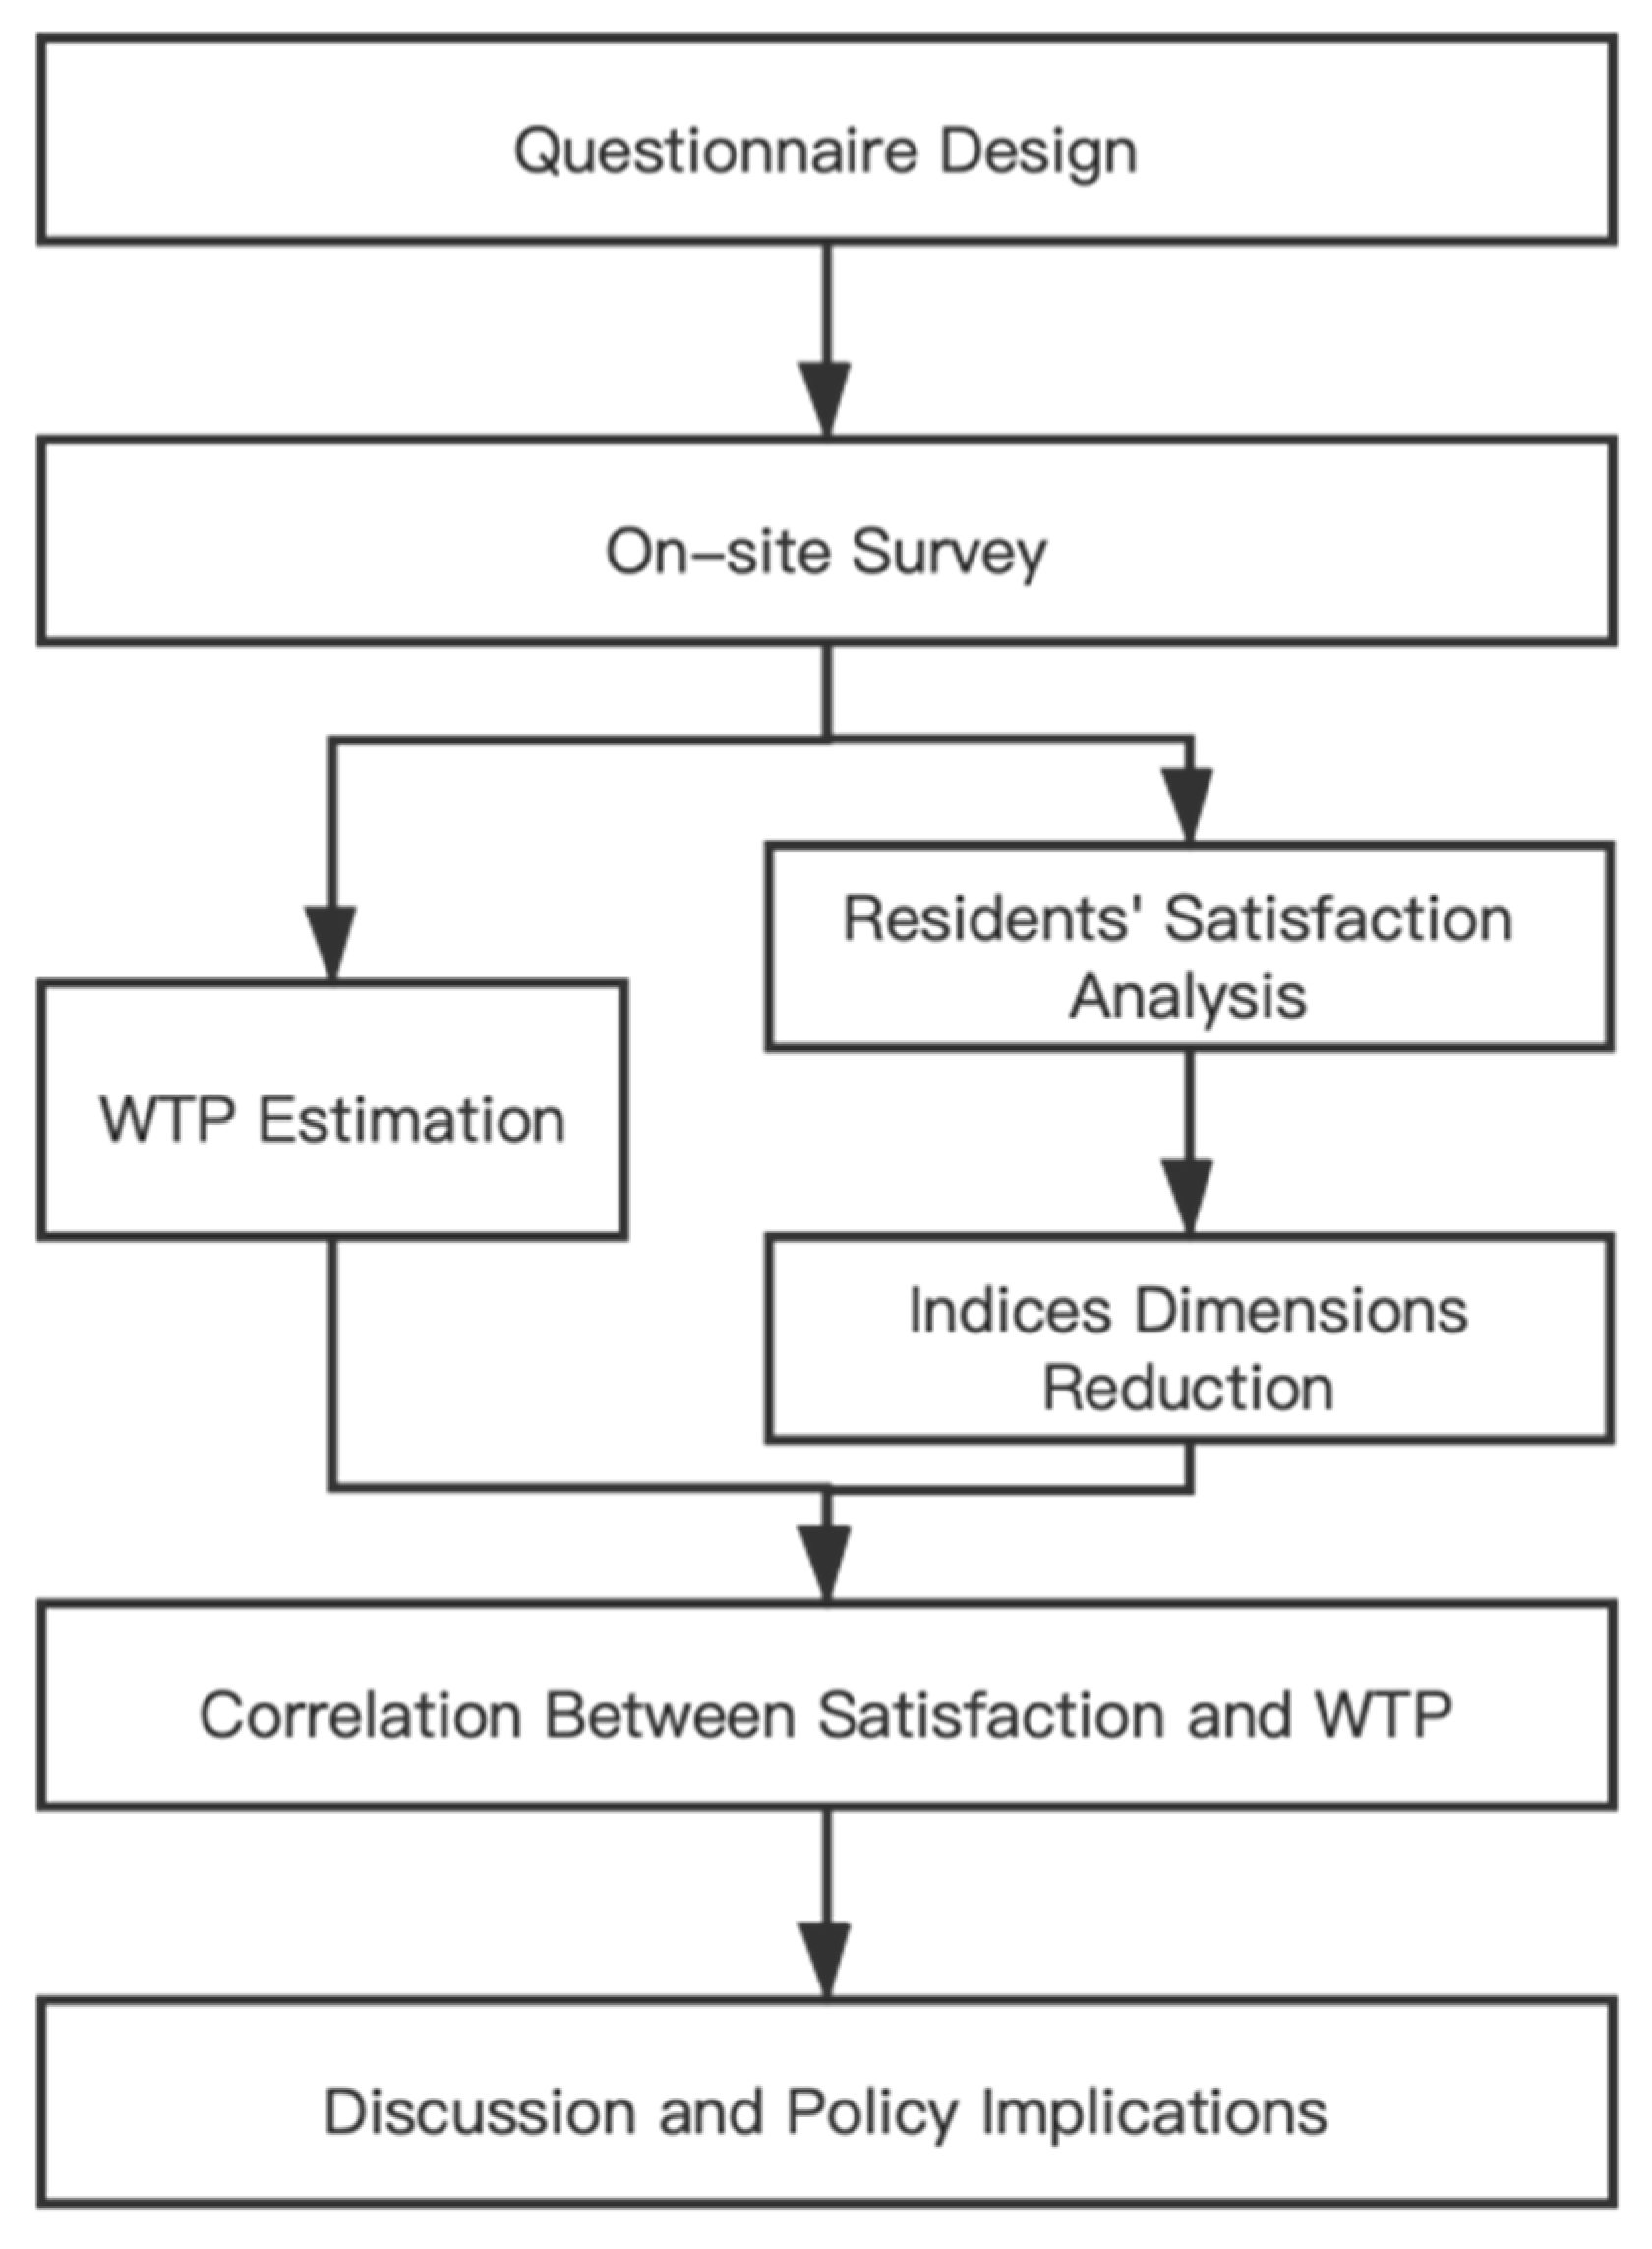
2. Methods
2.1. Data Collection and Sorting
2.2. WTP Elicitation Method
3. Results
3.1. Residents Demographic Information
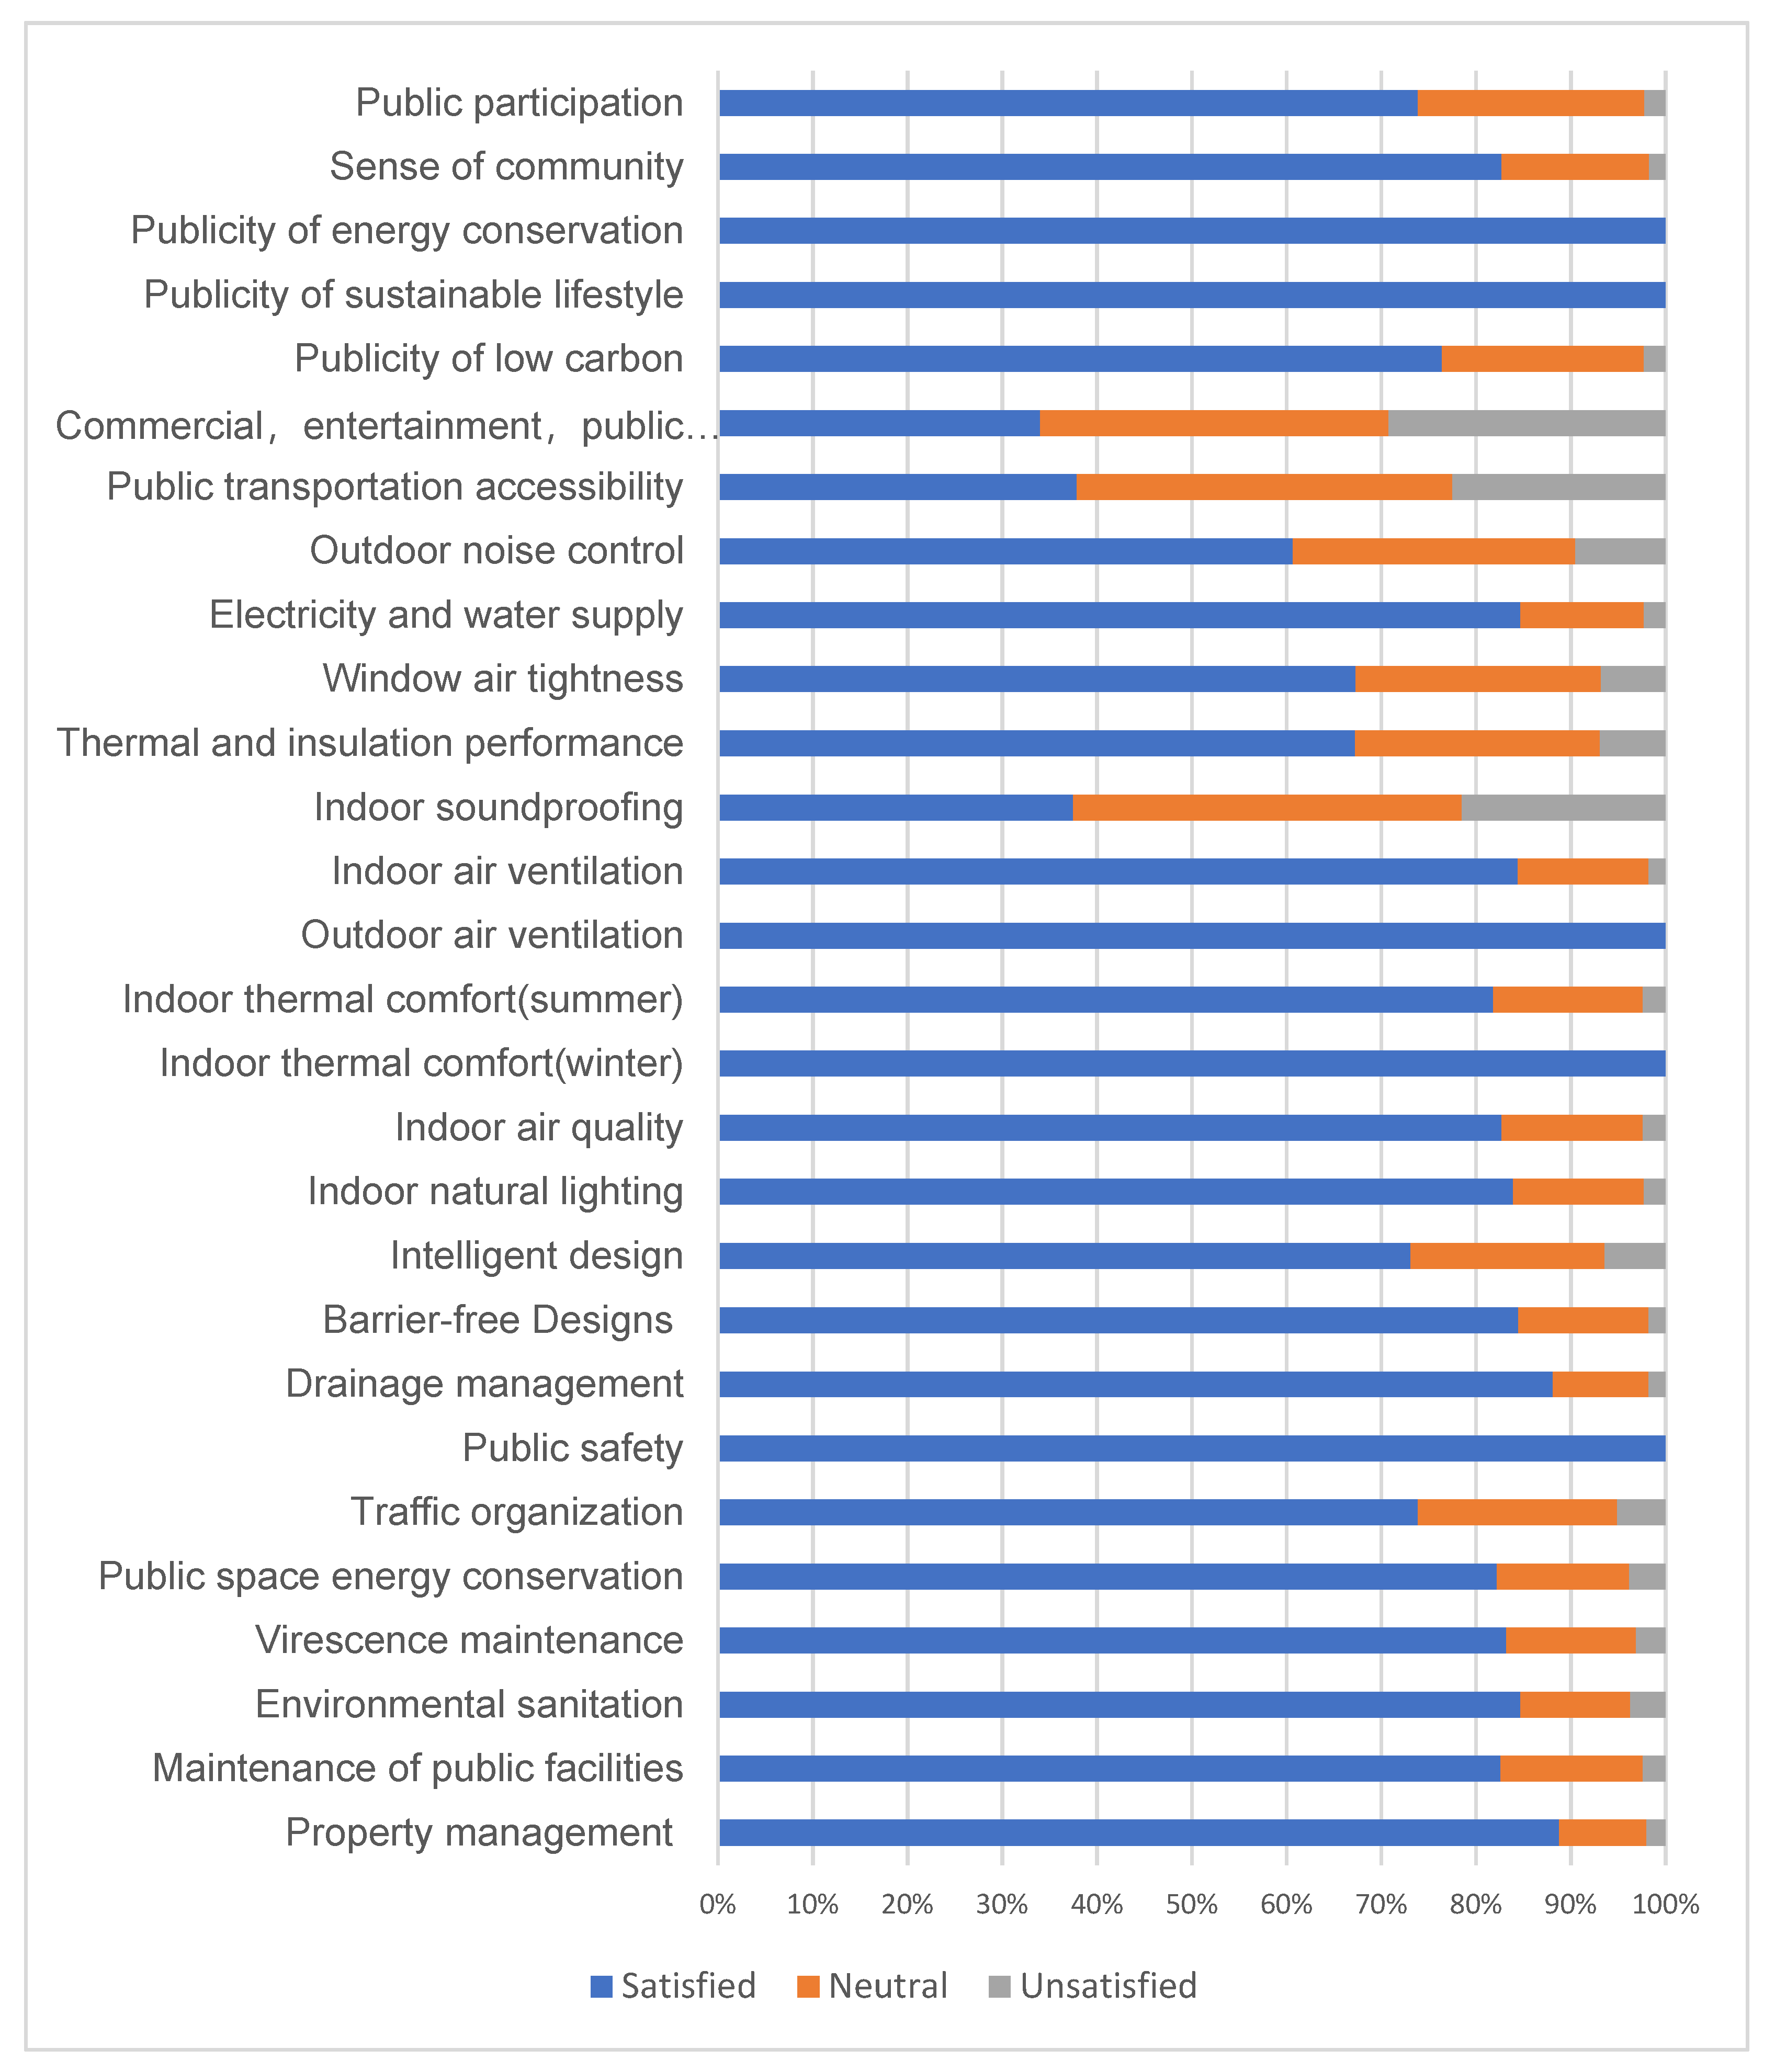
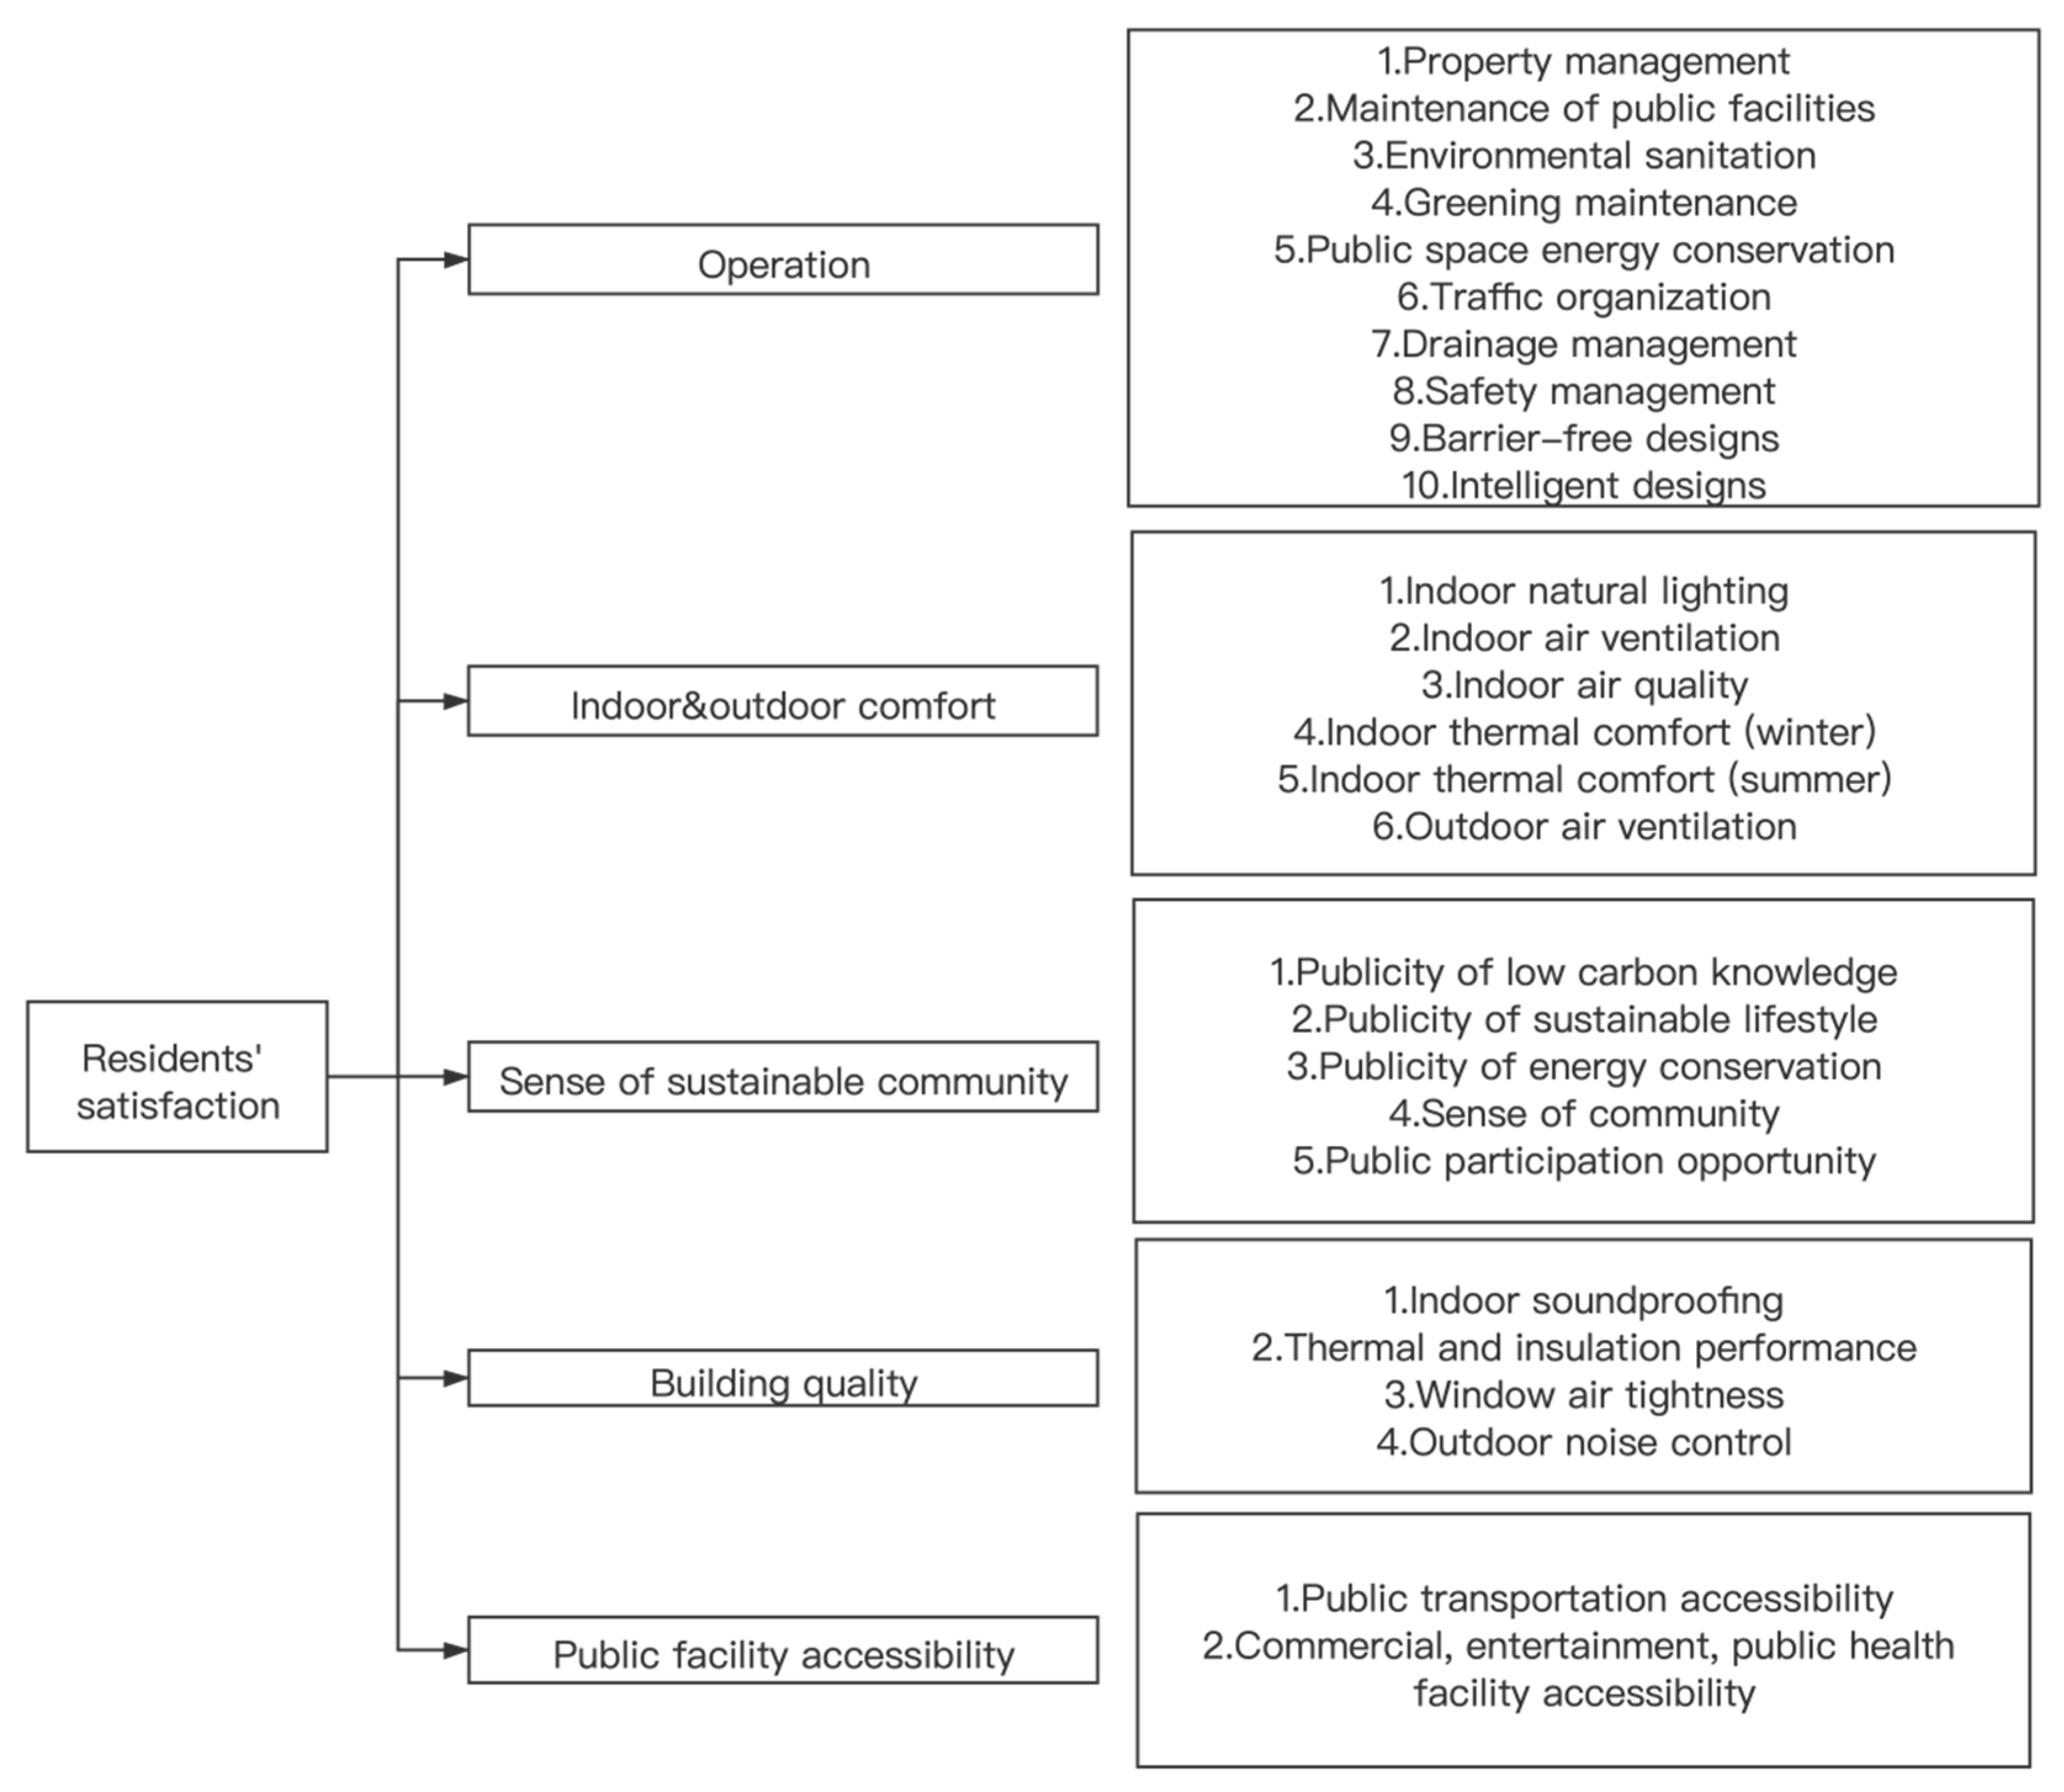
3.2. Residents’ Satisfaction and its Dimension
3.3. Residents’ WTP and Determinants
4. Discussion
5. Conclusions
Author Contributions
Funding
Institutional Review Board Statement
Informed Consent Statement
Data Availability Statement
Acknowledgments
Conflicts of Interest
References
- Azizi, N.S.M.; Wilkinson, S.; Fassman, E. An analysis of occupants response to thermal discomfort in green and conventional buildings in New Zealand. Energy Build. 2015, 104, 191–198. [Google Scholar] [CrossRef]
- Zhu, Y.; Lin, B. Sustainable housing and urban construction in China. Energy Build. 2004, 36, 1287–1297. [Google Scholar] [CrossRef]
- Zhao, D.X.; He, B.J.; Johnson, C.; Mou, B. Social problems of green buildings: From the humanistic needs to social acceptance. Renew. Sustain. Energy Rev. 2015, 51, 1594–1609. [Google Scholar] [CrossRef]
- Robichaud, L.B.; Anantatmula, V.S. Greening Project Management Practices for Sustainable Construction. J. Manag. Eng. 2010, 27, 48–57. [Google Scholar] [CrossRef]
- Zhang, X. Green real estate development in China: State of art and prospect agenda—A review. Renew. Sustain. Energy Rev. 2015, 47, 1–13. [Google Scholar] [CrossRef]
- Eichholtz, P.; Kok, N.; Quigley, J.M. The Economics of Green Building. Rev. Econ. Stats 2013, 95, 50–63. [Google Scholar] [CrossRef]
- Li, F.; Yan, T.; Liu, J.; Lai, Y.; Uthes, S.; Lu, Y.; Long, Y. Research on social and humanistic needs in planning and construction of green buildings. Sustain. Cities Soc. 2014, 12, 102–109. [Google Scholar] [CrossRef]
- Liu, Y.; Sun, X.; Sun, T.; Shi, X.; Liu, J. Promoting green residential buildings by increasing homebuyers’ willingness to pay: Evidence from Sino-Singapore Tianjin Eco-city in China. J. Clean. Prod. 2019, 238, 117884. [Google Scholar] [CrossRef]
- Portnov, B.A.; Trop, T.; Svechkina, A.; Ofek, S.; Akron, S.; Ghermandi, A. Factors affecting homebuyers’ willingness to pay green building price premium: Evidence from a nationwide survey in Israel. Build. Environ. 2018, 137, 280–291. [Google Scholar] [CrossRef]
- Zanuzdana, A.; Khan, M.; Kraemer, A. Housing Satisfaction Related to Health and Importance of Services in Urban Slums: Evidence from Dhaka, Bangladesh. Soc. Indic. Res. 2013, 112, 163–185. [Google Scholar] [CrossRef]
- Chau, C.K.; Tse, M.S.; Chung, K.Y. A choice experiment to estimate the effect of green experience on preferences and willingness-to-pay for green building attributes. Build. Environ. 2010, 45, 2553–2561. [Google Scholar] [CrossRef]
- Zalejska-Jonsson, A. Stated WTP and rational WTP: Willingness to pay for green apartments in Sweden. Sustain. Cities Soc. 2014, 13, 46–56. [Google Scholar] [CrossRef]
- Zeng, C.; Liu, S.; Shukla, A.; Yang, B. Identifying the occupant’s satisfaction and awareness for the performance of Eco Houses in the United Kingdom. J. Build. Eng. 2018, 18, 281–291. [Google Scholar] [CrossRef]
- Liang, H.H.; Chen, C.P.; Hwang, R.L.; Shih, W.M.; Lo, S.C.; Liao, H.Y. Satisfaction of occupants toward indoor environment quality of certified green office buildings in Taiwan. Build. Environ. 2014, 72, 232–242. [Google Scholar] [CrossRef]
- Huang, Z.; Du, X.; Yu, X. Home ownership and residential satisfaction: Evidence fromHangzhou, China. Habitat Int. 2015, 49, 74–83. [Google Scholar] [CrossRef]
- Bonaiuto, M.; Fornara, F.; Ariccio, S.; Cancellieri, U.G.; Rahimi, L. Perceived residential environment quality indicators (PREQIs) relevance for UN-HABITAT city prosperity index (CPI). Habitat Int. 2014, 45, 53–63. [Google Scholar] [CrossRef]
- Zhan, D.; Kwan, M.P.; Zhang, W.; Fan, J.; Yu, J.; Dang, Y. Assessment and determinants of satisfaction with urban livability in China. Cities 2018, 79, 92–101. [Google Scholar] [CrossRef]
- Arrow, K.; Solow, R.; Portney, P.R.; Leamer, E.E.; Radner, R.; Schuman, H. Report of the NOAA Panel on Contingent Valuation Report to the General Council of the US National Oceanic and Atmospheric Administration; Resources for the Future: Washington, DC, USA, 1993. [Google Scholar]
- Zhou, Y.; Chen, H.B.; Xu, S.; Wu, L. How cognitive bias and information disclosure affect the willingness of urban residents to pay for green power? J. Clean. Prod. 2018, 189, 552–562. [Google Scholar] [CrossRef]
- McConnell, K.E. Models for referendum data: The structure of discrete choice models for contingent valuation. J. Environ. Econ. Manag. 1990, 18, 19–34. [Google Scholar] [CrossRef]
- Steinberg, D.; Patchan, M.; Schunn, C.D.; Landis, A. Developing a Focus for Green Building Occupant Training Materials. J. Green Build. 2009, 4, 175–184. [Google Scholar] [CrossRef] [Green Version]
- Xie, X.; Lu, Y.; Gou, Z. Green Building Pro-Environment Behaviors: Are Green Users Also Green Buyers? Sustainability 2017, 9, 1703. [Google Scholar] [CrossRef] [Green Version]
- Liu, Y.; Lu, Y.; Hong, Z.; Nian, V.; Loi, T. The ‘START’ framework to evaluate national progress in green buildings and its application in cases of Singapore and China. Environ. Impact Asses. Rev. 2019, 75, 67–78. [Google Scholar] [CrossRef]
- Liao, X. Public appeal, environmental regulation and green investment: Evidence from China. Energy Policy 2018, 119, 554–562. [Google Scholar] [CrossRef]
- Missimer, M.; Robert, K.H.; Broman, G. A Strategic Approach to Social Sustainability-Part 1: Exploring the Social System. J. Clean. Prod. 2017, 140, 32–41. [Google Scholar] [CrossRef] [Green Version]
- Tsai, T. Strategies of Building a Stronger Sense of Community for Sustainable Neighborhoods: Comparing Neighborhood Accessibility with Community Empowerment Programs. Sustainability 2014, 6, 2766–2785. [Google Scholar] [CrossRef] [Green Version]
- Perkins, D.D.; Long, D.A. Neighborhood Sense of Community and Social Capital. In Psychological Sense of Community; Springer: Boston, MA, USA, 2002; pp. 291–318. [Google Scholar]
- Xu, Q.; Perkins, D.D.; Chow, C. Sense of Community, Neighboring, and Social Capital as Predictors of Local Political Participation in China. Am. J. Community Psychol. 2010, 45, 259–271. [Google Scholar] [CrossRef] [PubMed]
- Fan, L. International influence and local response: Understanding community involvement in urban heritage conservation in China. Int. J. Herit. Stud. 2014, 20, 651–662. [Google Scholar] [CrossRef]


| Variables | Characteristic | Frequency | Percentage |
|---|---|---|---|
| Gender | Male | 316 | 51.5 |
| Female | 298 | 48.5 | |
| Age | 18–30 | 216 | 35.2 |
| 31–49 | 280 | 45.6 | |
| 50–64 | 91 | 14.8 | |
| Over 65 | 27 | 4.4 | |
| Income | 0 | 29 | 4.7 |
| 1–5000 | 98 | 16 | |
| 5001–10,000 | 214 | 34.9 | |
| 10,001–20,000 | 218 | 35.5 | |
| Over 20,000 | 55 | 9 | |
| Number of family members | 1–2 | 303 | 49.3 |
| 3 | 147 | 23.9 | |
| 4 | 124 | 20.2 | |
| Other | 40 | 6.5 | |
| Floor | 1–3 | 138 | 22.5 |
| 4–6 | 202 | 32.9 | |
| 7–9 | 167 | 27.2 | |
| 10 or above | 107 | 17.4 | |
| Number of rooms | 1 bedroom and 0 livingroom | 113 | 18.4 |
| 1 bedroom and 1 livingroom | 246 | 40.1 | |
| 2 bedroom and 1 livingroom | 251 | 40.9 | |
| Other | 4 | 0.7 | |
| Commuting distance | Less than 2 km | 131 | 21.3 |
| 2–5 km | 137 | 22.3 | |
| 5–10 km | 226 | 36.8 | |
| over 10 km | 120 | 19.5 |
| Index | Mean Value |
|---|---|
| Property management | 4.31 |
| Maintenance of public facilities | 4.26 |
| Environmental sanitation | 4.27 |
| Greening maintenance | 4.19 |
| Public space energy conservation | 4.14 |
| Traffic organization | 4.05 |
| Drainage management | 4.25 |
| Safety management | 4.32 |
| Barrier-free designs | 4.32 |
| Intelligent design | 4.20 |
| Indoor natural lighting | 3.97 |
| Indoor air quality | 4.19 |
| Indoor thermal comfort (winter) | 4.09 |
| Indoor thermal comfort (summer) | 4.12 |
| Outdoor air ventilation | 4.15 |
| Indoor air ventilation | 4.21 |
| Indoor soundproofing | 3.24 |
| Thermal and insulation performance | 3.96 |
| Window air tightness | 3.86 |
| Electricity and water supply | 4.20 |
| Outdoor noise control | 3.96 |
| Public transportation accessibility | 3.22 |
| Commercial, entertainment, and public health facility accessibility | 3.12 |
| Publicity of low carbon | 4.04 |
| Publicity of sustainable lifestyle | 4.14 |
| Publicity of energy conservation | 4.04 |
| Sense of community | 4.11 |
| Public participation | 4.00 |
| Indicator | Component 1 | Component 2 | Component 3 | Component 4 | Component 5 |
|---|---|---|---|---|---|
| Property management | 0.80 | ||||
| Maintenance of public facilities | 0.75 | ||||
| Environmental sanitation | 0.76 | ||||
| Greening maintenance | 0.79 | ||||
| Public space energy conservation | 0.78 | ||||
| Traffic organization | 0.72 | ||||
| Drainage management | 0.67 | ||||
| Safety management | 0.76 | ||||
| Barrier-free designs | 0.78 | ||||
| Intelligent design | 0.72 | ||||
| Indoor natural lighting | 0.70 | ||||
| Indoor air ventilation | 0.74 | ||||
| Indoor air quality | 0.73 | ||||
| Indoor thermal comfort (winter) | 0.62 | ||||
| Outdoor air ventilation | 0.69 | ||||
| Indoor thermal comfort (summer) | 0.71 | ||||
| Indoor soundproofing | 0.59 | ||||
| Thermal and insulation performance | 0.72 | ||||
| Window air tightness | 0.71 | ||||
| Outdoor noise control | 0.73 | ||||
| Public transportation accessibility | 0.87 | ||||
| Commercial, entertainment, and public health facility accessibility | 0.83 | ||||
| Publicity of low carbon | 0.70 | ||||
| Publicity of sustainable lifestyle | 0.70 | ||||
| Publicity of energy conservation | 0.70 | ||||
| Sense of community | 0.74 | ||||
| Public participation | 0.79 |
| Bids Combination | YY | YN | NY | NN | SUM |
|---|---|---|---|---|---|
| 25/50/100 | 27 (17.8%) | 54 (35.4%) | 13 (8.6%) | 58 (38.2%) | 152 (100%) |
| 100/200/400 | 6 (3.9%) | 20 (13.1%) | 18 (11.8%) | 109 (71.2%) | 153 (100%) |
| 500/1000/2000 | 6 (4.0%) | 7 (4.6%) | 10 (6.6%) | 128 (84.8%) | 151 (100%) |
| 1000/2000/4000 | 1 (0.6%) | 5 (3.2%) | 4 (2.5%) | 148 (93.7%) | 158 (100%) |
| SUM | 40 (6.5%) | 86 (14.0%) | 45 (7.3%) | 443 (72.2%) | 614 (100%) |
| Variables | Coef | t-Values | p-Values |
|---|---|---|---|
| constant | 1.308828255 | 25.932259 | 0 |
| Bid | 0.007579632 | 103.4773252 | 0 |
| Mean WTP | 204.2252997 | 37.0920321 | 0 |
| 95% confidence interval | 193.6683041 | 215.2127407 | |
| 99% confidence interval | 189.4307546 | 218.1699745 | |
| Wald statistic | 11133.39389 | 0 | |
| Log-likelihood | −1013.195243 |
| Variables | Coef | Standard Error | Wald Statistic | Degree of Freedom | p Value |
|---|---|---|---|---|---|
| Bid | 1.230 | 0.135 | 83.436 | 1 | 0.000 |
| Gender | 0.091 | 0.243 | 0.140 | 1 | 0.708 |
| Age | −0.230 | 0.157 | 2.147 | 1 | 0.143 |
| Income | −0.190 | 0.124 | 2.358 | 1 | 0.125 |
| Z score for component 1 | −0.066 | 0.124 | 0.287 | 1 | 0.592 |
| Z score for component 2 | 0.368 | 0.134 | 7.556 | 1 | 0.006 ** |
| Z score for component 3 | 0.244 | 0.125 | 3.826 | 1 | 0.050 ** |
| Z score for component 4 | 0.239 | 0.124 | 3.725 | 1 | 0.054 * |
| Z score for component 5 | 0.355 | 0.118 | 9.076 | 1 | 0.003 ** |
| Constant | −0.180 | 0.721 | 0.062 | 1 | 0.803 |
Publisher’s Note: MDPI stays neutral with regard to jurisdictional claims in published maps and institutional affiliations. |
© 2021 by the authors. Licensee MDPI, Basel, Switzerland. This article is an open access article distributed under the terms and conditions of the Creative Commons Attribution (CC BY) license (https://creativecommons.org/licenses/by/4.0/).
Share and Cite
Zhang, L.; Fan, Y.; Yang, X.; Zhang, J. Promoting Green Real Estate Development by Increasing Residents’ Satisfaction. Sustainability 2021, 13, 9156. https://doi.org/10.3390/su13169156
Zhang L, Fan Y, Yang X, Zhang J. Promoting Green Real Estate Development by Increasing Residents’ Satisfaction. Sustainability. 2021; 13(16):9156. https://doi.org/10.3390/su13169156
Chicago/Turabian StyleZhang, Li, Yue Fan, Xiaochun Yang, and Jiahao Zhang. 2021. "Promoting Green Real Estate Development by Increasing Residents’ Satisfaction" Sustainability 13, no. 16: 9156. https://doi.org/10.3390/su13169156
APA StyleZhang, L., Fan, Y., Yang, X., & Zhang, J. (2021). Promoting Green Real Estate Development by Increasing Residents’ Satisfaction. Sustainability, 13(16), 9156. https://doi.org/10.3390/su13169156