Abstract
In Malaysia, as more than 50% of road collisions involve motorcyclists, the traffic safety of motorcyclists is critical and must be given priority. This study aims to understand the effects of attitudes, social influences, and control factors on the risky riding behavior of motorcyclists at unsignalized intersections in Malaysia. A motorcyclist-riding-behavior survey was conducted to collect and analyze the self-reported risky riding behaviors of motorcyclists. Three main analyses, namely, frequency and percentage, crosstabulation and test of independence (chi-squared), and logistic regression were adopted to assess the self-reported risky riding behavior and its correlation with outcomes, social influences, and factors. The obtained results show that negative outcomes (χ2 = 89.689, df = 54, p = 0.002) and negative social influences (χ2 = 32.554, df = 18, p = 0.019) are significantly associated with risky riding behavior, while control factors, inhibiting (χ2 = 66.889, df = 48, p = 0.037) and facilitating factors (χ2 = 96.705, df = 72, p = 0.028), have significant effects on risky riding behavior. A greater comprehension of motorcyclists’ risky riding behavior based on their self-reported risky riding behavior and beliefs can influence motorcyclists in making positive changes in their riding style.
1. Introduction
Road safety is an important aspect that needs to be addressed in developing a sustainable transportation system and reducing the ever-increasing number of annual fatalities from road traffic accidents. Accidents involving vehicles are globally one of the leading causes of death. The World Health Organization (WHO) stated that the number of road deaths continues to rise, approaching 1.35 million in 2016 [1]. Of that number, more than half of the deaths are caused by pedestrians, cyclists, and motorcyclists. The majority of Southeast Asia and the Western Pacific deaths were riders of two- and three-wheeled motor vehicles, representing 43% and 36% of all deaths, respectively. Motorcyclists are the most road users killed in road traffic accidents in Malaysia, accounting for 62.4% of all fatalities in 2019 [2]. Human behavior or negligence, road systems, and automobile conditions are the three primary causes of motorcycle crashes [3]. However, rider behavior is most often the main factor that leads to road accidents [3,4,5].
Attitudes toward road-safety rules are similar in motorcyclists and car drivers, yet they differ when assessing their driving behavior in certain hypothetical situations, where motorcyclists are more inclined to violate traffic rules than car drivers are. Although the level of risk perception during driving behavior is the same for both motorcyclists and car drivers, the level of concern of motorcyclists about the risk of road accidents is less than that of car drivers. This leads to a higher possibility of risky driving behavior in motorcyclists than that in car drivers [6].
Roads are primarily complex and dangerous at intersections, with 89% of accidents at intersections caused by human error [7]. In Malaysia, the intersections come second after straight roads as the road segments where accidents most frequently occur [8]. The Ops Selamat or Operation Safe, which is a traffic-safety operation and campaign to ensure safety on all roads in Malaysia, conducted during festive seasons, reported that 91% of total motorcycle accidents were recorded at unsignalized intersections [9]. Therefore, this study explores the behavior of motorcyclists in an effort to reduce traffic accidents involving motorcycles, specifically at unsignalized intersections in Malaysia.
2. Theoretical Background
The theory of planned behavior (TPB) helps to elucidate how we change the behavior of people. The TPB lists the three conceptual factors of intention, namely, attitude toward the behavior, subjective norm, and perceived behavioral control [10]. A favorable or unfavorable attitude toward a specific behavior is usually derived from an individual’s behavioral beliefs about the positive or negative outcomes of performing the behavior. Subjective norms or perceived social pressure originate from normative beliefs and are determined by an individual’s perceptions of social pressure and expectations to perform the behavior. Perceived behavioral control is guided by control beliefs or the individual’s beliefs about the likelihood of encountering the inhibiting or facilitating factors to perform the behavior. The more favorable the attitude and subjective norm with respect to a behavior, and the greater the perceived behavioral control, the greater the intention of a person to carry out the behavior under consideration. Therefore, TPB is very useful in explaining rider behavior [11]. In Australia, standard TPB predictors (attitudes, subjective norm, and perceived behavioral control), and additional social (group norm, specific subjective norm), identity (self-identity), and personal (sensation seeking, aggression) predictors were used to identify the psychosocial predictors of riders’ intentions to engage in safe and risky riding behavior [12]. Not all predictors are necessary or appropriate for a study. TPB elements of attitudes and subjective-norm prediction vary depending on the circumstance or case at hand [13]. Attitudes, subjective norms, and intentions remain significant predictors of helmet usage among adolescents in rural Malaysia, but not for perceived behavioral control and descriptive norms [14]. However, perceived behavioral control was the most consistent predictor of intention not to drink and drive across age and gender, and descriptive norms were the most important predictors of intention among young male drivers in Norway [15]. Normlessness has a positive relationship with rule violations, but a negative relationship with self-assertiveness and speeding [16].
Risky driving behaviors are acts that increase above a given threshold the objective probability of a crash or the seriousness of injuries should a crash occur. While they increase their odds of being in a crash or being seriously injured in a crash, a driver does not consider their acts to be dangerous [17]. Age, marital status, and the purpose for riding a motorcycle were all found to be important predictors of motorcycle riders’ risky behavior [18]. The risky behaviors of motorcycle riders declined as they grew older, as the older a person becomes, the less they are sensation-seeking, attention-attracting, and selfish. The emotional attachment and sense of belonging to their families, their age, and riding experience can contribute to married motorcycle riders’ low-risk behavior. The belief of the stories and experiences of other riders, the influence of other riders on one’s safe and risky riding, and the desire to ride safely for the sake of family members are the range of beliefs, expectations, and behaviors considered to be normative that are associated with motorcyclists [19]. Bazargan-Hejazi et al. [20] found that risk-taking riders have their own mitigation approaches to their risky riding behavior, such as emphasizing that they have the necessary riding skills to manage the risk, believing in motorcycle practicality, having faith in calculated risk, and focusing on riding pleasure.
Risk perceptions and positive affectivity influence risky riding behaviors. Risk-perception measures both positively and negatively influence risky riding behaviors, yet positive affectivity influences them more than risk perception does [21,22]. Among the motorcyclists’ risky riding behaviors related to positive affectivity are drinking alcohol before riding, running red lights, overtaking or turning without using an indicator light, riding without wearing a helmet, crossing a stop intersection without completely stopping, and using a telephone while riding. Attitude has a positive effect on the intention of speeding without helmet wearing [23]. Wearing a helmet is strongly correlated with age, occupation, and motorcycle ownership [24]. Thai riders who fastened their helmet straps perceived traffic risks at a level 3.4 times higher than those who did not wear or fasten helmets [25]. Another risky riding behavior that continues to occur in low- and medium-income countries, including Malaysia, is using the mobile phone [26]. Frequent use of mobile phones to text or search information while riding was associated with a higher chance of being involved in an accident or fall as compared to making or receiving calls [27]. Crossing a stop intersection without fully stopping and turning without using signal light are other risky riding behaviors performed by motorcyclists at intersections. At a stop sign, motorcyclists were less likely to come to a complete stop [28,29]. In Malaysia, when turning at an intersection and switching lanes, the use of turn signals is significantly low, with them only being used 41.1% of the time [30].
Most studies on risky riding behavior used either structural equation modeling (SEM) or hierarchical regression, which is a special form of a multiple linear-regression analysis. Some studies adopted the TPB model with some extensions, and other studies adopted a totally different approach, theory, or model. Table 1 shows a summary of the study component and analytical method used in previous studies. For example, the study by Tunnicliff et al. [12] used TPB standards, namely, attitudes, subjective norm, and perceived behavioral control with both social and self-identity influence, and the personal influences of sensation seeking and aggression to identify the psychosocial predictors of riders’ intentions to engage in three safe (handling my motorcycle skillfully, maintaining 100% awareness, refusing to ride impaired) and three risky (bending road rules to navigate through traffic, pushing my limits, and performing stunts and/or riding at extreme speeds) riding behaviors [12]. Hypothesis testing, correlational analysis, and separate hierarchical regression analysis were used in their study.

Table 1.
Summary of analytical components and methods used in previous studies.
In summary, even though there are many previous studies on risky riding behavior, assessment on the type of risk riding behavior and the reason for performing the risky behavior varies. Motorcyclists tend to behave differently on the basis of local road conditions, rules and regulations, norms, and other socioeconomic and demographic factors. Moreover, motorcyclists’ risky riding behavior at any segment of a road depends on the characteristic of the road segment and the rider’s intention factor. Therefore, this study conducted a preliminary investigation on the basis of TPB components to understand the effects of attitudes, social influences, and control factors influencing the risky riding behavior of motorcyclists at unsignalized intersections in Malaysia. TPB was adopted as the underlying theory because it is widely used in predicting conscious behavior and could thereby be applied in this study to understand the risky riding behavior of Malaysian motorcyclists. However, TPB is used only as a baseline in this study. Rather than assessing the overall construct of the TPB model, this study mainly focuses on the contributing factors in each component of TPB, namely, the perceived positive and negative outcomes, positive and negative social influences, and the inhibiting and facilitating factors using crosstabulation and logistic-regression analysis.
3. Research Methodology
In this section, the methodology undertaken for the study on self-reported motorcyclists’ risky behavior and their risk perception is discussed. A questionnaire survey was extensively used to determine valuable insights into an individual’s subjective thought and beliefs, whereby it is hard to only extract them from the task’s performance measures [31,32]. A questionnaire survey via self-reported data measures the risky riding behaviors and focuses on the riders’ risk perception and attitudes. It is a well-established method to acquire varying information on the respondent’s attitudes, behaviors, beliefs, and reasons for action related to the research subject. Therefore, the self-report questionnaire is one of the most widely used assessment strategies to evaluate a person’s feelings, behaviors, attitudes, and beliefs. Over the past few years, myriad of researchers have adopted the questionnaire survey as a method to investigate risky riding behaviors, including riders’ risk perception, influences, and factors [33]. Figure 1 shows the flow of steps taken in this study.

Figure 1.
Flowchart of study methodology.
As shown in Figure 1, the risky riding behaviors of motorcyclists were assessed through the self-reported risky-riding-behavior survey conducted online and face to face. Respondents who held riding licenses B (for motorcycles exceeding 500 cc), B1 (for motorcycles not exceeding 500 cc), or B2 (for motorcycles not exceeding 250 cc) were the targeted respondents for the survey. The questionnaire was designed and constructed on the basis of the existing literature and similar research conducted in Malaysia and other countries with a high volume of motorcyclists and similar riding behaviors, such as the Philippines, Taiwan, and Indonesia [3,16,21,22,26,28,34]. The questionnaire was divided into six sections. For the first section, demographic information of the participants, including age, gender, years of riding experience, and type of motorcycle owned was collected. Subsequently, trip-pattern information such as trip purpose, frequency, and distance was gathered in the second section. The third section was used to gather information about the risky riding behaviors of the participants. In this section, respondents were required to select the risky behavior with which they most engaged on the basis of 21 types of risky riding behaviors, as shown in Table 2. The same risky behaviors were used in the study conducted by Goh et al. [22] to assess significant factors affecting the risky riding behaviors of motorcyclists in Malaysia.
Table 2.
Risky riding behaviors of motorcyclists.
Subsequently, respondents were required to select the most relevant positive and negative outcomes in performing risky riding behaviors to understand the reasons for engaging in the specified risky riding behaviors. In this survey, positive outcomes were “saving time”, “smooth driving and stable speed”, “satisfying pleasure to show off”, “releasing emotions”, and “others”, while negative outcomes included “threatened by car drivers with road rage”, “challenging traffic policy”, “ticketed”, “compromise on safety”, “cause disturbance to other drivers”, “risk of traffic offenses”, “potential collision with other vehicles”, “accident”, and “others”. The following section evaluates social influences that are factors that could affect riders to engage in risky riding behaviors such as “parental guidance”, “peer pressure”, and “spouse/family”. For the final section, respondents were required to select the most significant controlling factors affecting risky riding behaviors in terms of inducing factors such as “depend on mood”, “tiredness”, and “when we are late”, and hindering factors such as “after seeing news report of traffic accidents” and “when there is a police or camera nearby”.
In order to determine the most engaged risky riding behaviors at unsignalized intersection, a behavioral observation study was conducted. Following a discussion held with the local authority, an unsignalized intersection located in the suburban area of Nibong Tebal, Penang, Malaysia was chosen. The site is considered to be a black spot by the local authority due to the significant number of recorded accidents and traffic violations, especially those involving motorcyclists. Data collection using a video camera was adopted to identify the types of risky riding behaviors performed by motorcyclists at the unsignalized intersection. Video footage of the junction was recorded on a typical weekday over a period of 6 h from 11:30 to 14:30 and 16:30 to 19:30. Figure 2 shows the site conditions of the unsignalized intersection.

Figure 2.
Site conditions of unsignalized intersection.
Consequently, after completing the questionnaire survey and identifying the risky riding behavior at the unsignalized intersection, three main analyses, namely, frequency and percentage, crosstabulation and chi-squared test of independence, and logistic regression were adopted to assess the self-reported risky riding behaviors and their correlation with outcomes, influences, and factors. The frequency of an occurrence is statistically defined as the number of times that it occurs. One of the most common statistical methods for analyzing and interpreting primary data is frequency in percentages, which deals with the number of responses to a specific question, and it is measured as a percentage of the total population chosen for the study. Crosstabulation analysis, also known as bivariate table analysis, is most often used to analyze categorical data. When performing crosstabulation analysis, the chi-squared statistic is generally used to evaluate tests of independence in which the test assesses whether any relationship exists. Logistic regression is often used to predict the probability of a categorical dependent variable against one or more independent variables. In this study, binomial logistic regression (“0” and “1”) was conducted to analyze the probability of performing (“1”) or not performing (“0”) a particular type of risky riding behavior on the basis of contributing factors in each component of attitudes (perceived positive and negative outcomes), social influences (positive and negative influences), and control factors (inhibiting and facilitating factors). The logistic-regression equations are shown in Equations (1) and (2):
and
where is the probability that the motorcyclist engaged in risky riding behavior, is the constant of the equation, and is the coefficient associated with the explanatory variables. The odds ratio means the change in the odds of given a unit change in when the remaining variables are held at a constant, and it can be calculated by simply using the exponential function on the coefficient of explanatory variable exp().
4. Results
4.1. Observed Risky Riding Behavior at Unsignalized Intersection
A total of 2907 motorcyclists were recorded traversing the intersection, and 45.7% or 1329 motorcyclists were observed to have performed a risky riding behavior. Table 3 shows the frequency of the risky riding behavior observed at the unsignalized intersection. The highest recorded risky riding behavior was “R3: did not signal when changing lane, turning, or overtaking other vehicles” with a substantial value of 67.8%, followed by “R1: crossing a stop-controlled junction without fully stopping” with 14.5%; the least recorded risky riding behavior was “R6: riding on the opposite or wrong side of road” with only 1.9%. This result conformed with the conclusion drawn by Ahmed et al. [35] in their study to investigate the behavior of right-turning vehicles at unsignalized intersections in Malaysia, which mentioned that none of the motorcyclists used their turn signal when making a right turn, and the majority of motorcyclists never stopped at the stop line before making the turn.
Table 3.
Frequency of risky riding behaviors observed at unsignalized intersection.
4.2. Demographic Profile of Respondents
A total of 316 respondents from different states in Malaysia participated in this survey, which was conducted between July 2019 to May 2020. All participants were informed about the purpose of the survey before asking for their permission and willingness to participate in the study. The completed questionnaires were then screened and segregated on the basis of different types of risky riding behaviors according to the list in Table 3. Therefore, the only data obtained from 101 respondents were used in the analysis of risky riding behaviors at an unsignalized intersection. All respondents possess a valid motorcycle driving license (B, B1, and B2) in Malaysia. Table 4 shows the demographic profile of the respondents. From the collected data, the age of respondents ranged from 16 to 59 years old. The ages of the respondents were categorized into five groups, as shown in Table 4. Most of the participants were in the age group of 21 to 30 years old (49.50%), followed by 16 to 20 years old (34.65%). The third highest age group of the respondents was 41 to 50 years old (7.92%), followed by 31 to 40 (4.95%). Lastly, only 2.97% of the respondents fell into the age group of 51 and older. The mean and standard deviation of the respondents’ ages were 24.86 and 9.143 years old, respectively.
Table 4.
Demographic profile of respondents.
Results of crosstabulation between age groups with risky riding behavior are as shown in Figure 3. The age group of 21- to 30-year-old motorcyclists was more predominant in performing risky riding behavior “R1: crossing a stop-controlled junction without fully stopping” and “R3: did not signal when changing lane, turning, or overtaking other vehicles”, while the age group of 16–20 years old engaged more in risky riding behavior “R4: doing things that can distract you (such as using a mobile phone) while riding a motorcycle“ and “R5: not switching on the headlight during daytime”. In addition, the chi-squared test for independence showed that there was significant association between age group and risky riding behavior (χ2 = 45.399, df = 24, p = 0.005).
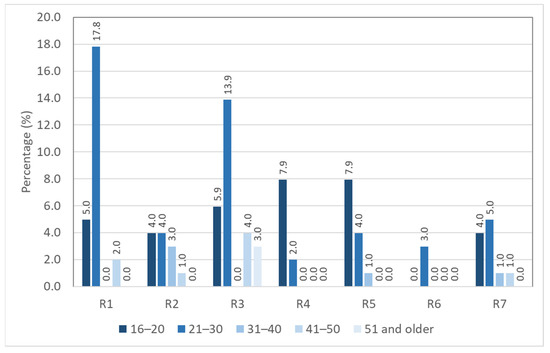
Figure 3.
Crosstabulation between age group and risky riding behaviors.
Subsequently, for the gender distribution of the respondents involved in the study, the majority of the respondents were male, with 68.32%, while the female respondents were only 31.68%. Crosstabulation results between gender with risky riding behavior are as shown in Figure 4, and the results of the chi-squared test for independence showed that gender has no significant association with risky riding behaviors (χ2 = 8.024, df = 6, p = 0.236).
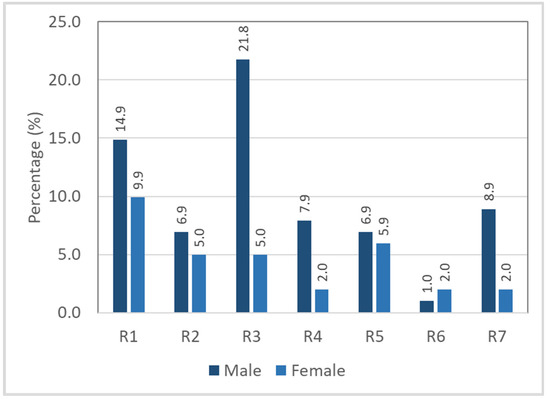
Figure 4.
Crosstabulation between gender and risky riding behaviors.
The majority of the respondents had more than 10 years (19.80%) of riding experience, while only 3.96% of respondents had less than a year of riding experience. The mean and standard deviation of driving experience were 8.0165 and 9.224 years, respectively. Results of crosstabulation between riding experience with risky riding behavior are as shown in Figure 5. Generally, participants with riding experience of between 1 and 5 years were more inclined to perform risky riding behaviors “R1: crossing a stop-controlled junction without fully stopping” and “R3: did not signal when changing lane, turning, or overtaking other vehicles”. Nevertheless, the results of the chi-squared test for independence showed that riding experience (χ2 = 26.249, df = 18, p = 0.094) had no significant association with risky riding behaviors.
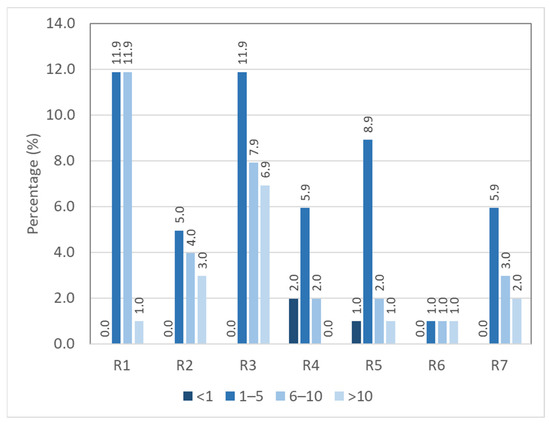
Figure 5.
Crosstabulation between riding experience (years) and risky riding behaviors.
Regarding the type of owned motorcycles, most respondents owned motorcycles with engine capacity between 100 and 250 cc (67.3%), followed by 26.7% owning motorcycles of less than 100 cc, and 5% owning motorcycles between 250 and 500 cc. Only 1% or 1 respondent owned a motorcycle between 500 and 750 cc, and none of the respondents owned a motorcycle of more than 750 cc. Figure 6 shows the results of crosstabulation between motorcycle type and risky riding behavior. However, the results of the chi-squared test for independence showed that motorcycle type had no significant association with risky riding behaviors (χ2 = 20.050, df = 18, p = 0.330).
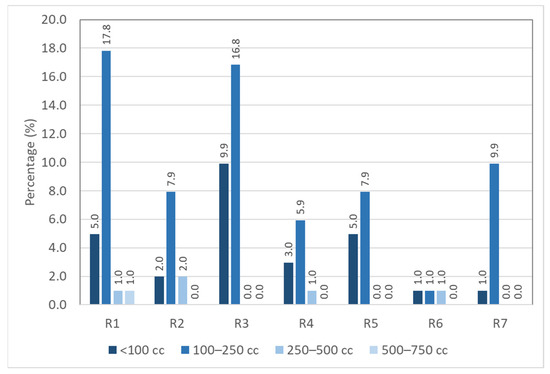
Figure 6.
Crosstabulation between motorcycle type (cc) and risky riding behaviors.
4.3. Trip Patterns
On the basis of the survey results shown in Table 5, the majority of the respondents reported that they only performed a single round trip for all trip purposes with primary trip purposes for shopping/leisure (n = 60), followed by traveling to attend classes at schools or universities (n = 58), and most of the trips were short-distance, of less than 10 km. As for other trip purposes, the respondents mentioned that they would only ride motorcycles when there was no other mode of transportations available for them to use because they perceived motorcycles to be a risky form of transportation. Figure 7, Figure 8 and Figure 9 show the results of crosstabulation between the trip purpose, frequency, and distance with risky riding behaviors, respectively.
Table 5.
Trip patterns.
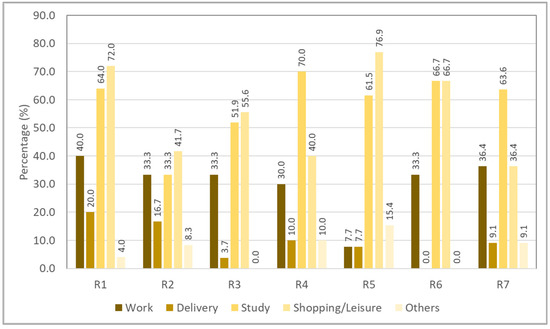
Figure 7.
Crosstabulation between trip purpose and risky riding behaviors.
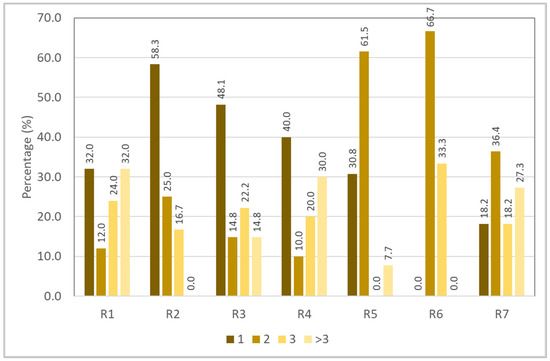
Figure 8.
Crosstabulation between trip frequency and risky riding behaviors.
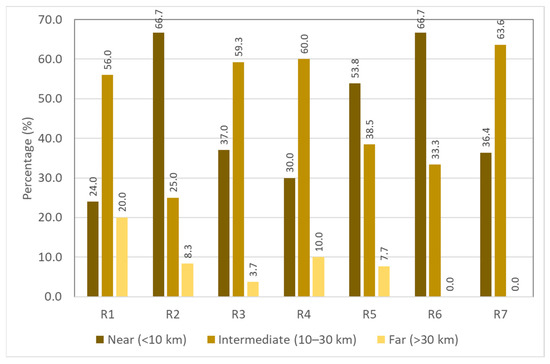
Figure 9.
Crosstabulation between trip distance and risky riding behaviors.
On the basis of the results of the multiple response crosstabulations plotted in Figure 7, no obvious trend could be observed. Responses on the seven types of risky riding behaviors were quite uniformly distributed across all trip purposes. Furthermore, the results of the chi-squared test for independence showed that trip purpose had no significant association with risky riding behaviors (χ2 = 27.163, df = 30, p = 0.615).
The crosstabulation results between trip frequency and risky riding behavior shown in Figure 8 indicated that risky riding behaviors “R1: crossing a stop-controlled junction without fully stopping”, “R2: riding motorcycle without wearing a helmet”, “R3: did not signal when changing lane, turning, or overtaking other vehicles” and “R4: doing things that can distract you (such as using a mobile phone) while riding a motorcycle” are more frequently engaged when making one single round trip. Risky riding behaviors “R5: not switching on the headlight during daytime”, “R6: riding on the opposite or wrong side of road”, and “R7: riding or performing a turn that is not according to the right-of-way rules in order to save time” are more prevalent when completing two round trips. The chi-squared test for independence showed that there is an association between trip frequency and risky riding behavior (χ2 = 28.865, df = 18, p = 0.050).
Results of crosstabulation between trip distance and risky riding behavior in Figure 9 showed no noticeable trend. However, motorcyclists travelling between 10 and 30 km generally often performed risky riding behaviors “R1: crossing a stop-controlled junction without fully stopping”, “R3: did not signal when changing lane, turning, or overtaking other vehicles”, “R4: doing things that can distract you (such as using a mobile phone) while riding a motorcycle”, and “R7: riding or performing a turn that is not according to the right-of-way rules in order to save time”. Motorcyclists travelling less than 10 km often engaged in risky riding behaviors “R2: riding motorcycle without wearing a helmet”, “R5: not switching on the headlight during daytime”, and “R6: Riding on the opposite or wrong side of road”. Nevertheless, the results of the chi-squared test for independence showed that the trip distance had no significant association with risky riding behaviors (χ2 = 13.970, df = 12, p = 0.303).
4.4. Self-Reported Risky Riding Behaviors
The frequencies and percentages of self-reported risky riding behavior are shown in Table 6. Results indicated that the most performed risky riding behavior at unsignalized intersection was “R3: did not signal when changing lane/turning/overtaking other vehicles” with 26.7%, followed by “R1: crossing a stop-controlled junction without fully stopping” with 24.8%; “R5: not switching on the headlight during daytime”, 12.9%; “R2: riding a motorcycle without wearing a helmet”, 11.9%; “R7: riding or performing a turn that is not according to the right-of-way rules in order to save time”, 10.9%; “R4: doing things that can distract you (such as using a mobile phone) while riding a motorcycle”, 9.9%; and “R6: riding on the opposite or wrong side of road” with only 3.0%.
Table 6.
Self-reported risky riding behaviors at unsignalized intersection.
Subsequently, descriptive statistics, multiple response crosstabulation, and logistic regression were used to assess the self-reported risky behavior and the likelihood of performing risky behaviors due to perceived positive and negative outcomes, influences, and factors.
4.5. Attitudes toward Risky Riding Behaviors
TPB explains that, for attitudes toward a behavior, each belief connects the behavior to a certain outcome. A person automatically and simultaneously develops an attitude toward the behavior on the basis of a person’s value toward the behavior, i.e., positive or negative. As a result, that person develops a favorable attitude toward the behavior that produces positive outcomes or an unfavorable attitude toward behavior that causes negative outcomes [10]. In this study, positive outcomes such as saving time, smooth driving, satisfying pleasure, and releasing emotions are expressed as negative attitudes, while negative outcomes such as being threatened by car drivers with road rage, potential collision with other vehicles, accidents, compromising safety, and receiving traffic summons depict positive attitudes. The frequency of responses of each positive and negative outcome given by the respondents is shown in Table 3. Respondents were allowed to select more than one response for both positive and negative outcomes.
On the basis of the results shown in Table 7, the most selected positive outcome of performing risky riding behavior was “saving time” with 46.6%, while the most selected negative outcomes were related to safety, namely, “accident (injury/loss of life)” with 20.5%, “compromise of safety” with 16.3%, and “potential collision with other vehicles” with 14.6%. Other positive outcomes reported by respondents were convenience, avoiding traffic congestion, and saving petrol.
Table 7.
Positive and negative outcomes in performing risky behaviors.
Outcomes related to safety were the most selected negative outcomes where the three most selected responses were “NO8: accident (injury/loss of life)”, which was the highest with 20.5%, followed by “NO4: compromising safety” with 16.3%, and “NO7: potential collision with other vehicles” with 14.6%. Other negative outcomes that are related to other road users such as “NO1: being threatened by car drivers with road rage (honked, flashed, blocked, etc.,)” and “NO5: causing disturbance to other drivers” also recorded high percentages of 13.4% and 10.5%, respectively. Other negative outcomes such as “NO6: risk of traffic offenses”, “NO3: ticketed”, and “NO2: challenging traffic policy” they recorded an average of 19 responses or 7.9%. Other negative outcomes reported by responses were carelessness and receiving warnings by officers from the Road Transport Department of Malaysia.
Figure 10 shows the crosstabulation of positive outcomes and risky riding behaviors. According to the results shown in Figure 10, the majority of respondents perceived “PO1: saving time” as the positive outcome in performing risky riding behaviors at unsignalized intersections, especially for risky behaviors “R1: crossing a stop-controlled junction without fully stopping” (68.0%), “R3: did not signal when changing lane, turning, or overtaking other vehicles” (59.3%), “R5: not switching on the headlight during daytime” (61.5%), “R6: riding on the opposite or wrong side of road” (66.7%), and “R7: riding or performing a turn that is not according to the right-of-way rules in order to save time” (90.9%).
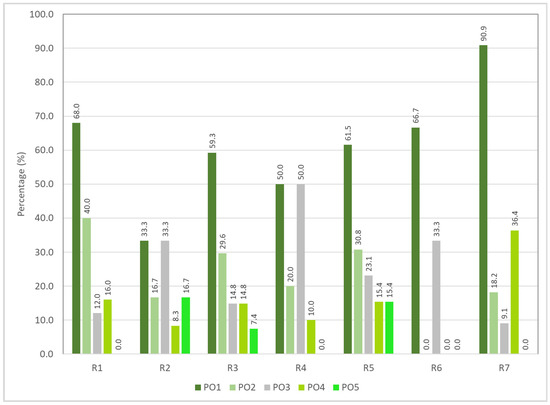
Figure 10.
Crosstabulation between positive outcomes and risky riding behaviors.
Additionally, apart from “PO1: saving time”, the majority of respondents also perceived “PO3: satisfying pleasure or to show off” to be a positive outcome in performing risky behaviors “R2: riding motorcycle without wearing a helmet” (33.3%), “R4: doing things that can distract you (such as using a mobile phone) while riding a motorcycle” (50%) and “R6: riding on the opposite or wrong side of road” (33.3%). Most respondents perceived “PO2: smooth driving and stable speed” to be a positive outcome of performing risky behaviors “R1: crossing a stop-controlled junction without fully stopping” (40.0%) and “R5: not switching on the headlight during daytime” (30.8%).
Moreover, the majority of respondents perceived “PO4: releasing emotion” to be a positive outcome for “R7: riding or performing a turn that is not according to the right-of-way rules in order to save time” (36.4%). However, the chi-squared test for independence showed that there was no significant association between positive outcomes with risky riding behavior (χ2 = 35.693, df = 30, p = 0.218).
Subsequently, crosstabulation analysis was conducted between negative outcomes and risky riding behaviors as shown in Figure 11. On the basis of the obtained results, no obvious trend was observed. However, “NO8: accident (injury/loss of life)” was the most critical negative outcome in performing risky riding behaviors “R1: crossing a stop-controlled junction without fully stopping” (72.0%), “R2: riding motorcycle without wearing a helmet” (50.0%), “R3: did not signal when changing lane, turning, or overtaking other vehicles“ (51.9%), and “R6: riding on the opposite or wrong side of road“ (66.7%). The most critical negative outcome for “R4: doing things that can distract you (such as using a mobile phone) while riding a motorcycle” was “NO3: ticketed” (60.0%); for “R7: riding or performing a turn that is not according to the right-of-way rules in order to save time”, the most critical negative outcome was “NO4: compromising safety” (63.6%). The chi-squared test for independence indicated that negative outcomes are significantly associated with risky riding behavior (χ2 = 89.689, df = 54, p = 0.002). Therefore, logistic regression was conducted to analyze the probability of performing risky riding behaviors on the basis of negative outcomes.

Figure 11.
Crosstabulation between negative outcome and risky riding behaviors.
Results from logistic regression, such as odds ratio and 95% confidence interval, were obtained in order to determine significant negative outcomes when performing risky behaviors. Table 8 shows the results of logistic regression for negative outcomes when performing a risky behavior. Due to the small sample size, the negative “NO9: others” was not included in regression analysis. Obtained results showed that “NO7: potential collision with other vehicles” (β = 1.688, S.E. = 0.632, p = 0.008) and “NO8: accident (injury/loss of life)” (β = 1.419, S.E. = 0.588, p = 0.016) were positively and significantly correlated with risky behavior “R1: crossing a stop-controlled junction without fully stopping”, with the odds ratio indicating that, for every one unit of increment on the predictor, the odds of negative outcomes in engaging in R1 behavior are increased by a factor of 5.406 and 4.134, respectively.
Table 8.
Results of logistic regression (odds ratio and 95% confidence interval) for negative outcomes.
Furthermore, respondents thought that “NO3: ticketed” is more likely the negative outcome in risky behavior “R4: doing things that can distract you (such as using a mobile phone) while riding a motorcycle” with an odds ratio of 14.155 (β = 2.650, S.E. = 0.962, p = 0.006). Additionally, “NO1: threatened by car drivers with road rage (being honked, flashed, blocked, etc.)” and “NO4: compromising safety” were associated with risky behavior “R7: riding or performing a turn that is not according to the right-of-way rules in order to save time” with odds ratios of 6.482 (β = 1.869, S.E. = 0.913, p = 0.041) and 7.974 (β = 2.076, S.E. = 0.903, p = 0.021), respectively. However, no significant association was found with negative outcomes associated to risky behaviors “R2: riding a motorcycle without wearing a helmet”, “R3: did not signal when changing lane, turning, overtaking other vehicles”, “R5: doing things that can distract you (such as using a mobile phone) while riding a motorcycle”, and “R6: riding on the opposite or wrong side of road”. In addition, results of logistic regression for “R6: riding on the opposite or wrong side of road” was inconclusive and hence not presented in Table 8 due to the very small sample size.
4.6. Social Influences on Risky Riding Behaviors
The social factor, which is termed as a subjective norm, refers to the perceived social pressure to perform or not the risky behavior [10]. In this study, both the positive and negative effects of social influences on risky riding behavior were assessed. The obtained responses for positive and negative social influences are shown in Table 9. Respondents were allowed to select more than one response for this section. The obtained results showed that the most significant positive influence was “PI1: parents” with 27.8%, followed by “PI5: friends” with 25.6%, “PI6: other road users” (14.8%), “PI3: police” (14.2%), “PI4: motorcycle club or association” (9.7%); “PI2: family (spouse and/or child)” recorded the least frequency with only 7.4%. Another type of positive influence that was mentioned by one respondent was one’s own self (0.6%).
Table 9.
Respondents’ positive and negative social influences in performing risky behaviors.
The most selected negative influence was “NI1: other road users” with 63.1%, followed by “NI2: friends (peer pressure) with 34.4%, while three other respondents mentioned that parents, loved ones, and family negatively influence their riding behavior (2.5%).
Figure 12 shows the crosstabulation between positive influence and risky riding behavior. Results indicated that “PI1: parents” and “PI5: friends” generally recorded higher percentage as compared to that of other positive influences, especially in performing risky riding behaviors “R1: crossing a stop-controlled junction without fully stopping” (48.0% and 56.0%, respectively), “R3: did not signal when changing lane, turning, or overtaking other vehicles” (40.7% and 33.3% respectively), “R4: doing things that can distract you (such as using a mobile phone) while riding a motorcycle” (60.0% and 70.0%, respectively), “R5: not switching on the headlight during daytime” (76.9% and 38.5%, respectively), and “R7: riding or performing a turn that is not according to the right-of-way rules in order to save time” (63.6% and 45.4% respectively). For risky riding behavior “R2: riding motorcycle without wearing a helmet”, the highest recorded percentage was for “PI6: other road users” with 33.3%. For risky riding behavior “R6: riding on the opposite or wrong side of road”, the more significant positive influences were “PI3: police” and “PI5: friends” with the same percentage of 66.6%. Nevertheless, the chi-squared test for independence showed no significant association between positive influences with risky riding behavior (χ2 = 45.610, df = 42, p = 0.324).
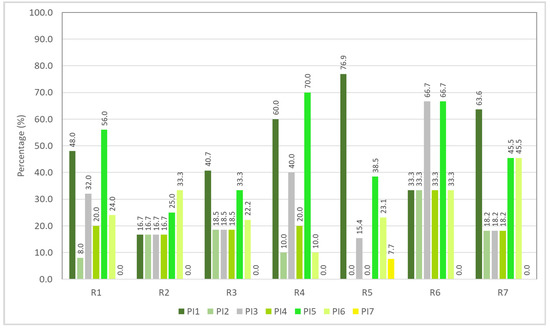
Figure 12.
Crosstabulation between positive influences and risky riding behaviors.
The results of crosstabulation between negative influences and risky riding behavior are as shown in Figure 13. Generally, results demonstrated that “NI1: other road users” was the more critical negative influence for all risky riding behaviors except for “R4: doing things that can distract you (such as using a mobile phone) while riding a motorcycle”, which recorded higher percentage for negative influence “NI2: friends (peer pressure)” with 90.0%, as compared with only 40.0% recorded for “N1: other road users”. Additionally, the most critical risky riding behavior for negative influence “NI1: other road users” was “R6: riding on the opposite or wrong side of road” (100.0%), followed by “R1: crossing a stop-controlled junction without fully stopping” (92.0%), “R2: riding a motorcycle without wearing a helmet” (83.3%), “R5: not switching on the headlight during daytime” (76.9%), “R7: riding or performing a turn that is not according to the right-of-way rules in order to save time” (72.7%), and “R3: did not signal when changing lane, turning, or overtaking other vehicles” (70.4%). The chi-squared test for independence showed that there was a significant association between negative influences with risky riding behavior (χ2 = 32.554, df = 18, p = 0.019). Therefore, results indicated that, between positive and negative influences, negative influences more significantly impact risky riding behavior.
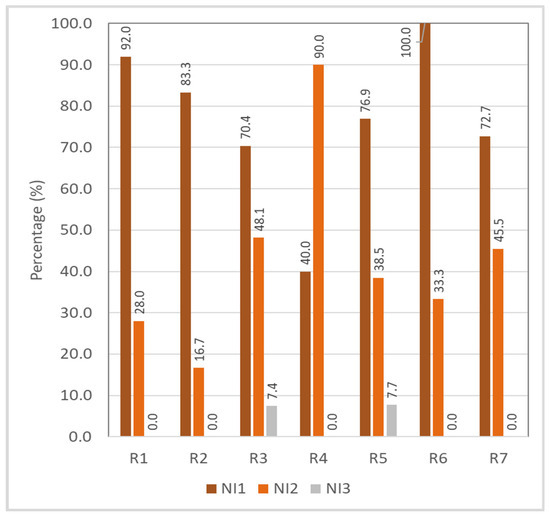
Figure 13.
Crosstabulation between negative influence and risky riding behaviors.
Subsequently, logistic regression was conducted to analyze the probability of performing risky riding behaviors attributed to negative influences. Results of logistic regression are shown in Table 10. However, due to the small sample size, negative influence “NI3: others” was not included in regression analysis.
Table 10.
Results of logistic regression (odds ratio and 95% confidence interval) for negative influences.
Results of logistic regression indicated that “NI2: friends (peer pressure)” significantly influences risky riding behavior “R4: doing things that can distract you (such as using a mobile phone) while riding a motorcycle” with an odds ratio of 10.865 (β = 2.386, S.E. = 1.161, p = 0.040). Nevertheless, no other significant relationships were observed for “R1: crossing a stop-controlled junction without fully stopping”, “R2: riding a motorcycle without wearing a helmet”, “R3: did not signal when changing lane, turning, or overtaking other vehicles”, “R5: not switching on the headlight during daytime”, “R6: riding on the opposite or wrong side of road”, and “R7: riding or performing a turn that is not according to the right-of-way rules in order to save time”. Additionally, the results of logistic regression for “R6: riding on the opposite or wrong side of road” were inconclusive due to the very small sample size and are hence not presented in Table 10.
4.7. Control Factors of Risky Riding Behaviors
According to Ajzen [10], control beliefs are the basis for behavioral control perceptions, and these control beliefs may be formed on the basis of past experiences. However, they are normally affected by other factors, resources, or possibilities that could inhibit or facilitate the performance of the behavior. In this study, various inhibiting and facilitating factors were presented to the respondents, and the results of frequencies and percentages for factors that inhibit and facilitate risky riding behaviors are presented in Table 11. Respondents could select more than one response for each component. Results showed that the most critical factor that inhibited risky riding behavior with the highest percentage was “FI2: when there is a police or camera nearby” with 21.0%. Other discouraging factors such as “FI4: when carrying passengers” (16.2%), “FI7: when thinking of loved ones” (13.1%), “FI8: previous accident or near-miss encounters” (12.2%), “FI3: when the road surface is uneven” (12.2%), “FI1: after seeing news report of traffic accidents” (10.9%) recorded an occurrence rate between 10% and 20%; “FI5: road lighting during night time” (8.7%) and “FI6: when riding speed is equal to the speed of vehicles on the fast lane” (5.7%) recorded an occurrence rate of less than 10%.
Table 11.
Inhibiting and facilitating factors for performing risky behaviors.
The most selected factor that facilitated risky riding behaviors was “FF1: when the overall road is crowded, chaotic, and drivers are in a hurry” (14.9%), followed by “FF12: when we are late” (13.7%), “FF11: when the road has fewer vehicles” (12.5%) and “FF5: want to ride fast” (10.1%). Other causing factors such as “FF4: depends on mood” (9.7%), “FF2: when the fast lane is smoother (curb lane traffic jam)” (9.3%), “FF7: tiredness” (6.9%), “FF8: when overtaking” (6.0%), “FF6: when the road surface is damaged (puddles)” (5.2%), “FF3: avoiding interfering with other road users (bus, heavy vehicles, bicycles, etc.)” (4.8%), “FF10: dissatisfied with the unequal road rights of motorcyclists” (3.6%), and “FF9: avoiding interfering with turning traffic at the intersection” (3.2%) recorded a lower frequency with less than 10% occurrence rate. Consequently, crosstabulation analysis was conducted to investigate the association between factors that inhibit and facilitate risky riding behaviors, and obtained results are shown in Figure 14 and Figure 15, respectively.
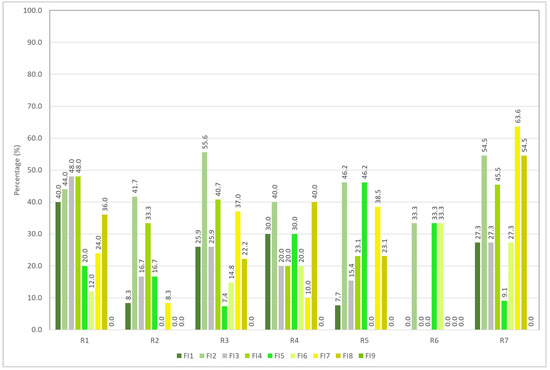
Figure 14.
Crosstabulation between inhibiting factors and risky riding behavior.

Figure 15.
Crosstabulation between facilitating factors and risky riding behaviors.
For the inhibiting factors of risky riding behavior shown in Figure 14, “FI2: when there is a police or camera nearby” generally recorded a higher occurrence rate for all risky behaviors, while “FI7: when thinking of loved ones” recorded the highest percentage for risky behavior “R7: riding or performing a turn that is not according to the right-of-way rules in order to save time” with a 63.6% occurrence rate. Lastly, “FI6: riding or performing a turn that is not according to the right-of-way rules in order to save time” was the least significant factor in discouraging risky riding behavior with an average occurrence rate of only 15.3% across all risky riding behaviors. The chi-squared test for independence also showed that there was a significant association between inhibiting factors and risky riding behavior (χ2 = 66.889, df = 48, p = 0.037).
No significant trend was observed in the results of crosstabulation between facilitating factors shown in Figure 15. However, the most notable causing factor was “FF1: when the overall road is crowded, chaotic, and drivers are in a hurry”, which recorded the highest percentages for “R6: riding on the opposite or wrong side of road” (100.0%), “R7: riding or performing a turn that is not according to the right-of-way rules in order to save time” (72.7%), and “R1: crossing a stop-controlled junction without fully stopping” (44.0%). Other factors such as “FI2: when the fast lane is smoother (curb lane traffic jam)” also recorded a high occurrence rate for risky riding behaviors “R4: doing things that can distract you (such as using a mobile phone) while riding a motorcycle” (40.0%) and “R5: not switching on the headlight during daytime” (38.5%); “FF12: when we are late” also recorded quite high percentages for risky riding behaviors “R3: did not signal when changing lane, turning, or overtaking other vehicle” (44.4%) and “R1: crossing a stop-controlled junction without fully stopping” (44.0%). The least significant factors were “FF3: avoiding interfering with other road users (bus, heavy vehicles, bicycles, etc.,)” and “FF9: avoiding interfering with turning traffic at the intersection” with average occurrence rates of 10.3% and 11.7%, respectively. The chi-squared test for independence indicated that facilitating factors have a significant relationship with risky riding behavior (χ2 = 96.705, df = 72, p = 0.028).
Consequently, logistic regression was performed to examine the probability of performing risky riding behaviors attributed to both inhibiting and facilitating factors. However, due to the small sample size, “FI9: others” and “FF13: others” were not included in the logistic-regression analysis.
Table 12 presents the results of logistic regression for factors that inhibit risky behaviors. Results showed that “FI1: after seeing the news report of traffic accidents” and “FI3: when the road surface is uneven” significantly affect risky behavior “R1: cross the stop-controlled junction without fully stopping”. Results showed significant positive impact with odds ratios of 3.258 (β = 1.181, S.E. = 0.566, p = 0.037) and 3.457 (β = 1.240, S.E. = 0.542, p = 0.022), respectively. Furthermore, “FI5: road lighting during nighttime” was found to be encouraging motorcyclists to perform risky riding behavior “R3: did not signal when changing lane, turning, or overtaking other vehicles”, as results showed negative and significant correlation (β = −1.702, S.E. = 0.852, p = 0.046) with an odds ratio of 0.182. Meanwhile, “FI7: when thinking of loved ones” was significant in inhibiting motorcyclists from performing risky riding behavior “R7: riding or performing a turn that is not according to the right-of-way rules in order to save time”, which showed positive and significant relationship (β = 1.802, S.E. = 0.836, p = 0.031) with an odds ratio of 6.063. However, no other significant relationships between the other inhibiting factors and risky riding behaviors were obtained, and the results of logistic regression for “R6: riding on the opposite or wrong side of road” were unconvincing due to the small sample size; thus, they were not presented in Table 12.
Table 12.
Results of logistic regression (odds ratio and 95% confidence interval) for factors that inhibit risky riding behavior.
Regarding factors that facilitate risky riding behaviors, results in Table 13 show that “FF3: avoiding interfering with other road users” and “FF12: when we are late” were most likely to cause the motorcyclists to perform risky behavior “R1: crossing a stop-controlled junction without fully stopping”, with odds ratios of 12.141 (β = 2.497, S.E. = 0.917, p = 0.007) and 4.369 (β = 1.475, S.E. = 0.626, p = 0.018), respectively. “FF5: want to ride fast” was most likely to cause risky behavior “R1: did not signal when changing lane, turning, or overtaking other vehicles”, with an odds ratio of 3.889 (β = 1.358, S.E. = 0.594, p = 0.022). Additionally, “FF1: when the overall road is crowded, chaotic, and drivers are in a hurry” is also a significant factor to cause risky behavior “R7: riding or performing a turn” that is not according to the right-of-way rules in order to save time (β = 2.026, S.E. = 1.027, p = 0.048) with an odds ratio of 7.587. However, results showed no significant relationship between other facilitating factors and risky riding behaviors. Additionally, results of logistic regression for “R6: riding on the opposite or wrong side of road” were inconclusive due to the very small sample size; hence, they are not presented in Table 13.
Table 13.
Results of logistic regression (odds ratio and 95% confidence interval) for factors that facilitate risky riding behaviors.
5. Discussion
Many studies on risky riding behaviors were either conducted using multivariate regression analysis or structural equation modeling, where analyses were performed on the basis of general risky riding behavior. In this study, a more detailed study was conducted to understand social–economic characteristics, attitudes, social influences, and control factors on the risky riding behavior of motorcyclists in Malaysia using crosstabulation and logistic-regression analyses.
On the basis of crosstabulation analysis, age groups were associated with risky riding behaviors. Many studies have shown that adolescents possess a higher tendency to perform risky behavior than adults do. They have greater chance to ignore the consideration of risk perceptions in the decision-making process. A recent study by Cordellieri et al. [6] mentioned that the most vulnerable group regarding deaths due to road crashes is the young-age group, namely, aged between 15 and 29. They stated that the young-age group is normally related to a higher risk of being involved in a road crash, for instance, speeding, drunk riding, and a lack of observation and signaling at intersections. According to Wong et al. [36] young drivers are more prone to traffic-law violations, speeding, and more often engaging in risky behavior. Furthermore, Sultan et al. [5] mentioned that young riders are poor in engaging in safe riding behavior. Therefore, in general, adolescent or young riders more frequently perform risky riding behaviors as compared to adults or older riders.
In general, the crosstabulation results between gender and risky riding behaviors revealed that male riders are more aggressive as compared to female riders. This finding conforms with the conclusion by Chang and Yeh [34], who mentioned that male riders are generally more likely to violate traffic regulations than female riders are in terms of negligence of potential risk, violation, and the negligence of vehicle examination. In addition, Oltedal and Rundmo [37] concluded that male riders generally have higher scores in terms of risky behavior, accidents with damage, and accidents with personal injury compared to female riders. Similarly, research from Wong et al. [36] showed that approximately 60% of male riders exhibited violations, especially in speeding, which is higher than the statistical data of female riders (36.3%). They concluded that male riders are more likely to seek sensations and to be impatient. Furthermore, a study from Ibrahim et al. [38] discovered that the percentage of female riders in the non-risk-taking category is higher than that of male riders. In other words, male riders are more prone to performing risky behaviors. However, results of the chi-squared test for independence obtained in this study showed that gender has no significant association with risky riding behaviors.
As for the riding experience, results of crosstabulation between riding experience and risky riding behavior showed that riding experience of between 1 and 5 years is more predominant in performing risky riding behaviors. This observation conforms with the conclusion drawn by Machado-León et al. [39], who mentioned that novice or less experienced drivers have a lower tendency of not following the rules of overpassing another vehicle on perceived crash risk compared to medium-level experienced drivers. Additionally, a study conducted by McCartt et al. [40] revealed that the rate of road crashes significantly declined with older age groups and years of licensure. Moreover, driving experience is related to driving skills. Driving skills are a concern of performance limitation with respect to driving tasks that affect drivers’ risk perception [39]. Similar to the trend observed for riding experience, the majority of respondents owning motorcycles with engine capacity between 250 and 500 cc are more predominant in performing risky riding behaviors. This trend concurs with findings from the study by Chang and Yeh [34], who mentioned that motorcyclists of light motorcycles with 50–250 cc had a higher tendency for traffic violations as compared to moped riders with an engine capacity of less than 50 cc. Nevertheless, the results of the chi-squared test for independence showed that riding experience and motorcycle type have no significant association with risky riding behaviors.
Subsequently, for trip patterns, on the basis of the survey results, the majority of respondents reported that they only performed one to two round trips for all trip purposes with the primary purpose of shopping or leisure, followed by studying; most of the trips were short-distance trips. Results of multiple-response crosstabulation between trip purpose and trip distance with risky riding behavior showed no obvious trend, and the results of the chi-squared test for independence also showed that trip purpose and distance have no significant association with risky riding behaviors, while trip frequency has an association with risky riding behaviors. This result differs from the findings of Hassanzadeh et al. [18], who mentioned that the purpose of using the motorcycle was significantly associated with risky behaviors in their multivariate model, but it concurs with their other findings, which stated that riding experience and the amount of riding affect the risky-behavior score.
Consequently, logistic regression was performed, mainly to assess the influence of perceived outcomes, social influences, and control factors on risky riding behaviors at unsignalized intersections. The chi-squared test for independence on perceived outcomes showed that there is no significant association between positive outcomes with risky riding behavior, but there is a significant association between negative outcomes with risky riding behavior. In this study, the positive outcomes such as saving time, smooth driving, satisfying pleasure, and releasing emotions are used to describe the negative attitudes while negative outcomes such as threatened by car drives with road rage, potential collision with other vehicles, accidents, and others are related to positive attitudes. The results of chi-squared tests inferred that negative outcomes (positive attitudes) generally more significantly impact risky riding behavior than positive outcomes do (negative attitudes). Additionally, the result of logistic regression on negative outcomes indicated that motorcyclists are aware that performing risky riding behavior such as crossing a stop-controlled junction without fully stopping could lead to collision and accident. As mentioned by Márque [41], safety perception is the expectation of a negative event, while risk perception is the precursor of a behavior; the higher the risk perception associated with an action is, the less likely a person is to engage in it [42]. Therefore, motorcyclists with high-risk perceptions ride more cautiously, they respect traffic rules, and have a more optimistic attitude toward road safety, while motorcyclists that have a low-risk perception are more susceptible to taking risks when riding [43].
This showed that, in general, motorcyclists in Malaysia have a higher risk perception as they have a more positive attitude toward road safety, but this finding is different than those reported by Ibrahim et al. [38], and Manan and Várhelyi [44], who mentioned that motorcyclists in Malaysia are impulsive, and have a poor attitude toward traffic rules and speed limit. This, however, can be explained by analyzing the other component of TPB, which is the control factor. Crosstabulation results on control factors indicated that both inhibiting and facilitating factors have a strong association with risky riding behaviors. The results of logistic regression on facilitating factors showed that wanting to ride fast is one of the reasons why motorcyclists do not use their turn signal when changing lane, turning, or overtaking other vehicles. Therefore, in general, results are consistent with those of previous studies, which mentioned that aggression and sensation seeking were significant predictors for intentions to violate traffic rules and risky riding behaviors to avoid road congestion [19,21,22,45,46,47]. Additionally, even though positive outcomes such as satisfying pleasure and releasing emotion have little impact on the attitude of motorcyclists in Malaysia, aggression and sensation seeking are more likely to be factors influencing motorcyclists to engage in risky riding behaviors.
Findings on the results of logistic regression on social influences indicated that peer pressure from friends or fellow motorcyclists was likely to more significantly influence risky riding behavior as compared to that of other more important people such as parents or family (spouse and/or child). This concurs with the findings by Tunnicliff et al. [19], who mentioned that the specific subjective norm (“people I ride with”) was a stronger predictor than the subjective norm was (“people who are important to me”) in predicting risky and safe riding intentions. Generally, most adolescents or young drivers treat driving as sensation seeking rather than a choice of mode of transportation. Ibrahim et al. [38] mentioned that driving provides them with a degree of freedom from parental control and a sense of achievement, as licensing is unavailable to obtain during their childhood. As compared to adults, adolescents are more susceptible to the influence of peers to encourage in engaging in risky behavior [48,49]. Moreover, according to Smorti et al. [49], the influence of risk-prone peers can be classified into direct and indirect influence. For instance, the direct influence or encouragement of risky behavior could include urging the driver to drive faster (speeding) and overpass other vehicles [49]. On the other hand, indirect influence is peer encouragement in engaging in risky behaviors, in which the driver perceives a particular risky action to be desirable or expected by the peer passengers [49]. In summary, many previous studies identified peer influence as one of the factors that influence risky riding behavior [38,49,50]. However, as there are more significant control factors influencing risky riding behaviors as compared to social influences, social influence is a poor predictor relative to attitude and perceived behavioral control, as mentioned by Elliot [51].
Overall, risky behavior “R1: crossing a stop-controlled junction without fully stopping” has a total of six influential factors, which is the highest, with odd ratios ranging from 3.258 to 12.141. Subsequently, risky behavior “R7: riding or performing a turn that is not according to the right-of-way rules in order to save time” has four influential factors with odd ratios between 6.063 and 7.974. In addition to these findings, risky behaviors with two significant influencing factors were indicated by “R3: did not signal when changing lane, turning, or overtaking other vehicles” and “R4: doing things that can distract you (such as using a mobile phone) while riding a motorcycle”. Findings also revealed that behavior “R3: did not signal when changing lane, turning, overtaking other vehicles” has factors with odd ratios of 0.182 to 3.889, while factor “R4: doing things that can distract you (such as using a mobile phone)” had odd ratios of 10.865 to 14.155. In contrast, risky behaviors “R2: riding motorcycle without wearing a helmet”, “R5: not switching on the headlight during daytime”, and “R6: riding on the opposite or wrong side of road” have no significant influential factors. However, even though “R2: riding motorcycle without wearing a helmet” and “R5: not switching on the headlight during daytime” had no significant factors in this study, these two behaviors are more frequently engaged than “R4: doing things that can distract you (such as using a mobile phone) while riding a motorcycle”.
Therefore, it can generally be inferred that age and trip frequency are more important demographic characteristic to be considered in the analysis of risky riding behaviors, together with factors related to positive attitude, peer pressure, aggression, and sensation seeking. As for the type of risky behaviors, risky behaviors such as crossing a stop-controlled junction without fully stopping, not signaling when changing lane, turning, or overtaking other vehicles, and riding or performing a turn that is not according to the right-of-way rules are more critical risky behaviors at unsignalized intersections.
6. Study Limitations
The small sample size of 101 respondents in this survey may be perceived as insufficient to reflect the general behavior of Malaysian motorcyclists. However, the study was conducted in an explorative instead of confirmative manner, and further investigation will be conducted to assess the influence of socioeconomic characteristics, riding experience, attitudes, social factors, and motorcyclists’ perceptions on risky riding behavior using structural equation modelling to validate the findings of this study. The factor leading toward this response rate is contributed by time constraints imposed by the Malaysian authorities during the pandemic period. The newly enforced law in Malaysia prevents all physical interaction, resulting in the study primarily relying on the online survey form, which was conducted for several months. Therefore, due to this limitation, it is recommended to increase and expand the sample size in subsequent research to better represent the Malaysian motorcyclists’ population.
The second limitation to this study is the method of conducting a self-reported questionnaire survey. Although this method is efficient and cost-effective, there are several drawbacks to it. First, this method can be affected by the respondent’s memory toward the question’s response, which they may not accurately recall during the survey. Second, respondents may tend to provide the socially acceptable answer rather than an actual response from themselves. Third, the length of the questionnaire survey affects the response that may cause the respondents to lose attention and interest. Thus, these factors can create a bias toward the survey affecting the final results. Additionally, there is limited access toward crash rates related to the study of the specified risky behavior. Data available from the Malaysian authorities do not specify the cause of crashes. Therefore, there are no actual data available to verify if these behaviors contribute to motorcycle crashes. This limitation conjures the need to understand the causes of crashes of motorcycles at a road intersection, particularly at unsignalized intersections, as the behaviors of motorcyclists crossing an unsignalized intersection have greater complexity compared to at a signalized intersection. The potential outcome and the need for the study severely outweigh the limitations encountered by this research. Researchers in Malaysia commonly conduct studies on elements contributing to motorcycle collisions due to the road environment and vehicle. However, the human factor of Malaysian motorcyclists’ behavior that leads to motorcycle accidents is rarely covered in most studies [52].
7. Conclusions
The main objective of this study was to understand motorcyclists’ intention to engage in risky riding behavior at an unsignalized intersection by implementing the TPB model. Results of crosstabulation among demographic profiles such as age, gender, and trip patterns on risky riding behavior indicated that age and trip frequency are strongly associated with risky riding behaviors. The study also assessed the effects of attitude, social influence, and control factors to further understand motorcyclists’ intentions.
Findings from this study also implied that crossing a stop-controlled junction without fully stopping, which is the behavior with the highest number of significant factors, has the highest potential to be intervened. Therefore, countermeasures for this behavior are to incorporate and emphasize on significant factors in the education system. The same measures can also be applied to other risky behaviors to potentially improve the road-safety awareness of Malaysian motorcyclists.
As most risky behaviors are due to the human factor, safety awareness within Malaysian motorcyclists should be applied on the policy-implementation level to generate an effective intervention. The findings of this study can provide authorities with a base to understand factors affecting rider behavior to further improve road safety among Malaysian motorcyclists. In addition, findings from this study can streamline the authorities’ operations in systematically capturing causes of motorcyclist crash incidents instead of evaluating every incident in an individualistic manner.
Further study can be conducted to supplement this research by implementing more comprehensive structural equation modeling to determine the correlation among riders’ demographic attributes, trip frequency, and risk perception. Furthermore, secondary information such as crash data on frequency, type, and severity can be included in structural equation modeling to enhance the prediction capability of the model to better anticipate factors affecting Malaysian motorcyclists. The scalability of structural equation modeling is able to provide better insight for authorities to assist them in the decision-making process of generating an effective policy.
Author Contributions
Conceptualization, L.V.L.; methodology, L.V.L. and P.K.G.; software, L.V.L. and P.K.G.; validation, L.V.L.; formal analysis, L.V.L. and P.K.G.; investigation, P.K.G. and W.C.G.; resources, L.V.L.; data curation, P.K.G. and W.C.G.; writing—original-draft preparation, L.V.L., S.A.M.S. and W.C.G.; writing—review and editing, L.V.L., S.A.M.S. and W.C.G.; visualization, L.V.L. and S.A.M.S.; supervision, L.V.L.; project administration, L.V.L.; funding acquisition, L.V.L. All authors have read and agreed to the published version of the manuscript.
Funding
This research received no external funding.
Institutional Review Board Statement
Ethical review and approval were waived for this study due to the reason that no intervention is presented to the participants, therefore there is no risk of physical harm to those who participate. Additionally, the survey only involved voluntary participation with informed consent acquired from respondents. Confidentiality and anonymity of the respondents are protected and retained as no personal data were obtained from the survey.
Informed Consent Statement
Informed consent was obtained from all participants involved in the study.
Data Availability Statement
The study did not report any additional data.
Acknowledgments
The authors wish to express their sincere gratitude to the School of Civil Engineering, Universiti Sains Malaysia, for the support.
Conflicts of Interest
The authors declare no conflict of interest.
References
- WHO. Global Status Report on Road Safety 2018: Summary; (WHO/NMH/NVI/18.20); World Health Organization: Geneva, Switzerland, 2018; Available online: https://apps.who.int/iris/handle/10665/277370 (accessed on 21 May 2021).
- Ishak, S.Z.; Syed Md Rahim, S.A. Where is Malaysia at the end of the Decade of Action for Road Safety 2011–2020? Int. J. Road Saf. 2020, 1, 1–3. [Google Scholar]
- Idris, A.; Hamid, H.; Law, T.H. Factors Contributing to Motorcycle Accidents in Malaysia. In IOP Conference Series: Earth and Environmental Science; IOP Publishing: Bristol, UK, 2019; Volume 357, p. 12039. [Google Scholar]
- Yousif, M.T.; Sadullah, A.F.M.; Kassim, K.A.A. A Review of Behavioural Issues Contribution to Motorcycle Safety. IATSS Res. 2020, 44, 142–154. [Google Scholar] [CrossRef]
- Sultan, Z.; Ngadiman, N.I.; Kadir, F.D.A.; Roslan, N.F.; Moeinaddini, M. Factor Analysis of Motorcycle Crashes in Malaysia. Plan. Malays. 2016, 4, 135–146. [Google Scholar] [CrossRef] [Green Version]
- Cordellieri, P.; Sdoia, S.; Ferlazzo, F.; Sgalla, R.; Giannini, A.M. Driving Attitudes, Behaviours, Risk Perception and Risk Concern among Young Student Car-Drivers, Motorcyclists and Pedestrians in Various EU Countries. Transp. Res. Part F Traffic Psychol. Behav. 2019, 65, 56–67. [Google Scholar] [CrossRef] [Green Version]
- Lefevre, S.; Laugier, C.; Ibanez-Guzman, J. Risk Assessment at Road Intersections: Comparing Intention and Expectation. In Proceedings of the 2012 IEEE Intelligent Vehicles Symposium, Madrid, Spain, 3–7 June 2012; pp. 165–171. [Google Scholar]
- Nasarrudin, N.F.; Mohd Razelan, I.S. The Trend of Road Traffic Crashes at Urban Signalised Intersection. In IOP Conference Series: Materials Science and Engineering; IOP Publishing: Bristol, UK, 2018; Volume 342, p. 012015. [Google Scholar]
- Lamin, F.; Noor, A.; Zainal, S.; Atiqah, S.; Faudzi, M.; Omar, A.; Mohammed, N. Motorcycle Fatal Crashes during Focused Enforcement Intervention: Ops Selamat 1/2012; MRR No. 368; MIROS: Kajang, Malaysia, 2020. [Google Scholar]
- Ajzen, I. The Theory of Planned Behavior. Organ. Behav. Hum. Decis. Process. 1991, 50, 179–211. [Google Scholar] [CrossRef]
- Özkan, T.; Lajunen, T.; Doğruyol, B.; Yıldırım, Z.; Çoymak, A. Motorcycle Accidents, Rider Behaviour, and Psychological Models. Accid. Anal. Prev. 2012, 49, 124–132. [Google Scholar] [CrossRef] [PubMed]
- Tunnicliff, D.J.; Watson, B.C.; White, K.M.; Hyde, M.K.; Schonfeld, C.C.; Wishart, D.E. Understanding the Factors Influencing Safe and Unsafe Motorcycle Rider Intentions. Accid. Anal. Prev. 2012, 49, 133–141. [Google Scholar] [CrossRef] [Green Version]
- Abdul Hanan, S. Intention to Comply with the School Zone Speed Limit: Scenario-Based Study. J. East. Asia Soc. Transp. Stud. 2017, 12, 1965–1973. [Google Scholar] [CrossRef]
- Ahmed, M.B.; Ambak, K.; Raqib, A.; Sukor, N.S. Helmet Usage among Adolescents in Rural Road from the Extended Theory of Planned Behaviour. J. Appl. Sci. 2012, 13, 161–166. [Google Scholar] [CrossRef]
- Moan, I.S.; Rise, J. Predicting Intentions Not to “Drink and Drive” Using an Extended Version of the Theory of Planned Behaviour. Accid. Anal. Prev. 2011, 43, 1378–1384. [Google Scholar] [CrossRef]
- Bathan, A.; de Ocampo, J.; Ong, J.; Maria, A.; Gutierrez, J.; Seva, R.; Mariano, R. A Predictive Model of Motorcycle Accident Involvement Using Structural Equation Modeling Considering Driver Personality and Riding Behavior in Metro Manila. In Proceedings of the International Conference on Industrial Engineering and Operations Management, Bandung, Indonesia, 6–8 March 2018; pp. 1783–1803. [Google Scholar]
- Eby, D.W. Driving, Risky. In Encyclopedia of Applied Psychology; Spielberger, C.D., Ed.; Elsevier: New York, NY, USA, 2004; pp. 627–632. ISBN 978-0-12-657410-4. [Google Scholar]
- Hassanzadeh, K.; Salarilak, S.; Sadeghi-Bazargani, H.; Golestani, M. Motorcyclist Risky Riding Behaviors and Its Predictors in an Iranian Population. J. Inj. Violence Res. 2020, 12, 161. [Google Scholar] [CrossRef]
- Tunnicliff, D.; Watson, B.; White, K.M.; Lewis, I.; Wishart, D. The Social Context of Motorcycle Riding and the Key Determinants Influencing Rider Behavior: A Qualitative Investigation. Traffic Inj. Prev. 2011, 12, 363–376. [Google Scholar] [CrossRef] [Green Version]
- Bazargan-Hejazi, S.; Zamani-Alavijeh, F.; Hindman, D.; Mohamadi, E.; Bazargan, M. How Do Motorcyclists Manage Mental Tensions of Risky Riding? BMC Public Health 2013, 13, 865. [Google Scholar] [CrossRef] [PubMed] [Green Version]
- Wedagama, D.M.P. Analysing Self-Reported Risky Behaviours of Motorcyclists in Bali Using Structural Equation Modelling. J. East. Asia Soc. Transp. Stud. 2015, 11, 2015–2027. [Google Scholar] [CrossRef]
- Goh, W.C.; Leong, L.V.; Cheah, R.J.X. Assessing Significant Factors Affecting Risky Riding Behaviors of Motorcyclists. Appl. Sci. 2020, 10, 6608. [Google Scholar] [CrossRef]
- Trinh, T.A.; Linh Le, T.P. The Association between Risk-Taking Behavior and Helmet Use among Motorcyclist. In IOP Conference Series: Earth and Environmental Science; IOP Publishing: Bristol, UK, 2018; Volume 143, p. 012069. [Google Scholar]
- Dapilah, F.; Guba, B.Y.; Owusu-Sekyere, E. Motorcyclist Characteristics and Traffic Behaviour in Urban Northern Ghana: Implications for Road Traffic Accidents. J. Transp. Health 2017, 4, 237–245. [Google Scholar] [CrossRef]
- Hongsranagon, P.; Khompratya, T.; Hongpukdee, S.; Havanond, P.; Deelertyuenyong, N. Traffic Risk Behavior and Perceptions of Thai Motorcyclists: A Case Study. IATSS Res. 2011, 35, 30–33. [Google Scholar] [CrossRef] [Green Version]
- Rusli, R.; Oviedo-Trespalacios, O.; Abd Salam, S.A. Risky Riding Behaviours among Motorcyclists in Malaysia: A Roadside Survey. Transp. Res. Part F Traffic Psychol. Behav. 2020, 74, 446–457. [Google Scholar] [CrossRef]
- Truong, L.T.; Nguyen, H.T.T.; de Gruyter, C. Mobile Phone Use While Riding a Motorcycle and Crashes among University Students. Traffic Inj. Prev. 2019, 20, 204–210. [Google Scholar] [CrossRef] [PubMed]
- Ramlan, R.; Irawan, M.Z.; Munawar, A. Behavioral Factors of Motorcyclists in Right-Turn Movements at Unsignalized Intersections: An Insight from Yogyakarta, Indonesia. IATSS Res. 2021, 45, 116–122. [Google Scholar] [CrossRef]
- Muttart, J.W.; Peck, L.R.; Guderian, S.; Bartlett, W.; Ton, L.P.; Kauderer, C.; Fisher, D.L.; Manning, J.E. Glancing and Stopping Behavior of Motorcyclists and Car Drivers at Intersections. Transp. Res. Rec. 2011, 2265, 81–88. [Google Scholar] [CrossRef] [PubMed] [Green Version]
- Ariffin, A.H.; Hamzah, A.; Solah, S.; Paiman, F.; Syukri, M.; Khalid, A.; Isah, N.; Anwar, K.; Kassim, A.; Ishak, S.Z.; et al. Turn Signal Use among Motorcyclists in Klang Valley, Malaysia: A Case Study. J. Kejuruter. SI 2020, 3, 83–88. [Google Scholar] [CrossRef]
- Clark, I.A.; Maguire, E.A. Do Questionnaires Reflect Their Purported Cognitive Functions? Cognition 2020, 195, 104114. [Google Scholar] [CrossRef]
- Bulmer, M. Questionnaires (Sage Benchmarks in Social Research Methods); Sage Publications: London, UK, 2004; ISBN 9781446263204. [Google Scholar]
- Scott-Parker, B.; Watson, B.; King, M.J. Understanding the Psychosocial Factors Influencing the Risky Behaviour of Young Drivers. Transp. Res. Part F Traffic Psychol. Behav. 2009, 12, 470–482. [Google Scholar] [CrossRef] [Green Version]
- Chang, H.L.; Yeh, T.H. Motorcyclist Accident Involvement by Age, Gender, and Risky Behaviors in Taipei, Taiwan. Transp. Res. Part F Traffic Psychol. Behav. 2007, 10, 109–122. [Google Scholar] [CrossRef]
- Ahmed, A.; Sadullah, A.F.M.; Yahya, A.S. Analysis of the Effect of Directional Traffic Volume and Mix on Road Traffic Crashes at Three-Legged Unsignalized Intersections. Transp. Eng. 2021, 3, 100052. [Google Scholar] [CrossRef]
- Wong, J.T.; Chung, Y.S.; Huang, S.H. Determinants behind Young Motorcyclists’ Risky Riding Behavior. Accid. Anal. Prev. 2010, 42, 275–281. [Google Scholar] [CrossRef]
- Oltedal, S.; Rundmo, T. The Effects of Personality and Gender on Risky Driving Behaviour and Accident Involvement. Saf. Sci. 2006, 44, 621–628. [Google Scholar] [CrossRef]
- Ibrahim, M.K.A.; Md Noor, S.M.; Mohamad, N.A.; Mohd Yusoff, M.F. A Case Study on Risk-Taking Behaviours among Motorcyclists in Klang Valley, Malaysia; MRR 07/2012; MIROS: Kajang, Malaysia, 2012. [Google Scholar]
- Machado-León, J.L.; de Oña, J.; de Oña, R.; Eboli, L.; Mazzulla, G. Socio-Economic and Driving Experience Factors Affecting Drivers’ Perceptions of Traffic Crash Risk. Transp. Res. Part F Traffic Psychol. Behav. 2016, 37, 41–51. [Google Scholar] [CrossRef]
- McCartt, A.T.; Mayhew, D.R.; Braitman, K.A.; Ferguson, S.A.; Simpson, H.M. Effects of Age and Experience on Young Driver Crashes: Review of Recent Literature. Traffic Inj. Prev. 2009, 10, 209–219. [Google Scholar] [CrossRef]
- Márquez, L. Safety Perception in Transportation Choices: Progress and Research Lines. Ing. Compet. 2016, 18, 11–24. [Google Scholar]
- Falco, A.; Piccirelli, A.; Girardi, D.; Dal Corso, L.; de Carlo, N.A. Risky Riding Behavior on Two Wheels: The Role of Cognitive, Social, and Personality Variables among Young Adolescents. J. Saf. Res. 2013, 46, 47–57. [Google Scholar] [CrossRef] [PubMed]
- Maulina, D.; Danilasari, K.R.; Nazhira, F.; Jufri, S.S. Why Riders Perform Risky Riding Behavior in Jakarta: The Effects of Hazardous Situation, Gender, and Risk Perception. Psychol. Res. Urban Soc. 2018, 1, 38. [Google Scholar] [CrossRef]
- Abdul Manan, M.M.; Várhelyi, A. Motorcycle Fatalities in Malaysia. IATSS Res. 2012, 36, 30–39. [Google Scholar] [CrossRef] [Green Version]
- Ulleberg, P.; Rundmo, T. Personality, Attitudes and Risk Perception as Predictors of Risky Driving Behaviour among Young Drivers. Saf. Sci. 2003, 41, 427–443. [Google Scholar] [CrossRef]
- Romero, D.L.; de Barros, D.M.; Belizario, G.O.; Serafim, A.d.P. Personality Traits and Risky Behavior among Motorcyclists: An Exploratory Study. PLoS ONE 2019, 14, e0225949. [Google Scholar] [CrossRef] [PubMed]
- Zamani-Alavijeh, F.; Niknami, S.; Bazargan, M.; Mohammadi, E.; Montazeri, A.; Ahmadi, F.; Ghofranipour, F. Accident-Related Risk Behaviors Associated with Motivations for Motorcycle Use in Iran: A Country with Very High Traffic Deaths. Traffic Inj. Prev. 2009, 10, 237–242. [Google Scholar] [CrossRef]
- Gardner, M.; Steinberg, L. Peer Influence on Risk Taking, Risk Preference, and Risky Decision Making in Adolescence and Adulthood: An Experimental Study. Dev. Psychol. 2005, 41, 625–635. [Google Scholar] [CrossRef] [PubMed] [Green Version]
- Smorti, M.; Guarnieri, S.; Ingoglia, S. The Parental Bond, Resistance to Peer Influence, and Risky Driving in Adolescence. Transp. Res. Part F Traffic Psychol. Behav. 2014, 22, 184–195. [Google Scholar] [CrossRef]
- Borhan, M.N.; Ibrahim, A.N.H.; Aziz, A.; Yazid, M.R.M. The Relationship between the Demographic, Personal, and Social Factors of Malaysian Motorcyclists and Risk Taking Behavior at Signalized Intersections. Accid. Anal. Prev. 2018, 121, 94–100. [Google Scholar] [CrossRef]
- Elliott, M.A. Predicting Motorcyclists’ Intentions to Speed: Effects of Selected Cognitions from the Theory of Planned Behaviour, Self-Identity and Social Identity. Accid. Anal. Prev. 2010, 42, 718–725. [Google Scholar] [CrossRef] [PubMed]
- Azman, N.S.; Ilyas, R.; Isah, N.; Ibrahim, M.K.A. Riding Behaviour of Motorcyclists in the Klang Valley; MRR No. 370; MIROS: Kajang, Malaysia, 2020. [Google Scholar]
Publisher’s Note: MDPI stays neutral with regard to jurisdictional claims in published maps and institutional affiliations. |
© 2021 by the authors. Licensee MDPI, Basel, Switzerland. This article is an open access article distributed under the terms and conditions of the Creative Commons Attribution (CC BY) license (https://creativecommons.org/licenses/by/4.0/).