Article

Assessing Multi-Micronutrients Deficiency in Agricultural Soils of India

1
ICAR-Indian Institute of Soil Science, Bhopal 462038, India
2
ICAR-National Academy of Agricultural Research Management, Telangana 500030, India
3
Indian Council of Agricultural Research, New Delhi 110012, India
4
International Zinc Association, New Delhi 110062, India
5
International Zinc Association, Durham, NC 27713, USA
*
Author to whom correspondence should be addressed.
Sustainability 2021, 13(16), 9136; https://doi.org/10.3390/su13169136
Submission received: 4 August 2021 / Revised: 9 August 2021 / Accepted: 9 August 2021 / Published: 15 August 2021

Abstract

:
The deficiencies of nutrient elements and inappropriate nutrient management practices in agricultural soils of the world is one of the reasons for low crop productivity, reduced nutritional quality of agricultural produce, and animal/human malnutrition. We carried out the present study to evaluate the single and multi-nutrient deficiencies of sulfur (S) and micronutrients (zinc (Zn), boron (B), iron (Fe), copper (Cu) and manganese (Mn)) in agricultural soils of India for their effective management to achieve sustainable crop production, improved nutritional quality in crops and better animal/human health. Altogether, 24,2827 surface soil samples (0 to 15 cm depth) were collected from the agriculture fields of 615 districts in 28 states of India and were analyzed for available S and micronutrient concentration. The concentration of available S and micronutrients varied widely. There were variable and widespread deficiencies of S and micronutrients in different states. The deficiencies of S, Zn and B were higher compared to the deficiencies of Fe, Cu and Mn. There were occurrences of two-nutrient (namely S + Zn, Zn + B, S + B, Zn + Fe Zn + Mn, S + Fe, Zn + Cu and Fe + B), three-nutrient (namely S + Zn + B, S + Zn + B and Zn + Fe + B) and four-nutrient (namely Zn + Fe + Cu + Mn and Zn + Fe + Cu + Mn + B) deficiencies in different extents. This information could be used by various stakeholders for production, supply and application of the right kind of fertilizers in different districts, states and agro-ecological regions of India for better crop production, crop nutritional quality, nutrient use efficiency and soil and environmental health. This will also help in a greater way to address the issue of malnutrition in human/animals.

1. Introduction

Soils are the prime sources of nutrients for plant growth and development [1,2]. Plants absorb the desired nutrients from soil in different proportions as per requirements [3,4]. Phytomicrobiome (microbial community associated with plant) play a pivotal role in enhancing nutrient availability and crop yield [5,6]. Soil is linked to the well-being of animals and humans through agriculture and agricultural produces [7]. Macronutrients are required in higher quantities by the plants whereas micronutrients (otherwise called as trace elements) are needed in smaller quantities but both the categories of nutrients play equally important roles in plant metabolism. The deficiency of phyto-available (hereafter referred as available) nutrients in soils adversely affect soil health, crop production, nutritional quality of agricultural produces and in turn, human/animal health [8,9].
Besides nitrogen (N), phosphorus (P) and potassium (K) deficiency, deficiencies of sulfur (S) [10,11] and micronutrients (zinc (Zn), boron (B), iron (Fe), copper (Cu) and manganese (Mn)) (either single nutrient deficiency or multi-nutrient deficiency) have been reported in different soils of the world, including in India [12,13,14]. The essential micronutrients for field crops are Zn, B, Fe, Cu, Mn and molybdenum [15]. Other micronutrients at low concentrations considered essential for some plants are nickel and cobalt. The incidence of micronutrient deficiencies in crops and soils has increased markedly in recent years. The emergence of micronutrient deficiencies in soils of different parts of the world is primarily due to cultivation of high-yielding crops and cultivars, increased cropping intensity, enhanced application of high-analysis (>30% of available nutrients) NPK fertilizers having lower amounts of micronutrient contaminants, less or no use of organic manures and increased use of advanced soil and plant analysis technologies [15]. The extent of S and micronutrient deficiencies vary within different administrative boundaries such as districts and states because of the variations in soil types, prevailing climatic conditions, nature and type of crops and soil–crop management practices [8,16]. The intake of foods (obtained from crops) low in micronutrient concentration and produced from micronutrient-deficient soils causes micronutrient malnutrition in animals and humans [14,17]. However, adoption of agronomic biofortification strategies such as application of micronutrients to soil and crops (as foliar spray) has the potential to ameliorate micronutrient deficiencies in soil–plant systems, and to enhance crop productivity and micronutrient content in agricultural produce, which could alleviate micronutrient malnutrition in animals and humans [18].
There is a need for continuous evaluation and monitoring of the extent of S and micronutrient deficiencies in agricultural soils, at the district and state levels, for the production and supply of the right kind and quantity of S and micronutrient fertilizers and the adoption of appropriate site-specific S and micronutrient management practices [14,19]. The mapping of S and micronutrient deficiencies in soils using geostatistical tools is useful for proper visualization of location and/or area-wise deficiencies [20]. These maps are useful for taking decisions regarding the application of required nutrients in right quantity, appropriate form and in the right place and in balanced proportions for obtaining the higher nutrient use efficiency. The efficient S and micronutrient management practices in soil–plant systems help in sustainable crop production, production of better-quality agricultural produce and in turn, improve animal and human health [7,9,21,22].
Although there are many scattered studies evaluating the status and distribution of S and micronutrient deficiency, systematic information regarding state-wise S and micronutrient deficiencies and the status of two- or multiple-nutrient deficiencies in cultivated soils of India is limited. We hypothesize that a wide variation exists in the state-wise S and micronutrient deficiencies in India. Therefore, the present study was carried out with the aim to evaluate the status of single- and multi-nutrient deficiencies of S and micronutrients and to visualize their distribution in agricultural soils of different states of India. This information is useful for adopting efficient S and micronutrient management practices in different agricultural soils of India.

2. Materials and Methods

2.1. Study Area

The study area (India) is located at 8°4′–37°6′ N latitude and 68°7′–97°25′ E longitude and is surrounded by the Indian Ocean (on the south), the Arabian Sea (on the southwest) and the Bay of Bengal (on the southeast). It shares its land borders with Pakistan, China, Bhutan, Bangladesh, Myanmar and Nepal. India is the bulk of the Indian subcontinent lying on Indian tectonic plate, which is a portion of Indo-Australian plate. It comprises 28 states and eight union territories. Soils of the country are alluvial, black, red and yellow, lateritic, arid, forest and mountainous, and are formed by deposition of sediments of rivers. Soils belong to mainly to the orders of Inceptisols, Alfisols, Entisols, Vertisols, Mollisols, Aridisols, Ultisols and Oxisols, with sandy to clayey texture [23]. The climate of the country is influenced by the Himalayas and the Thar Desert. India has arid, semi-arid, tropical wet, tropical wet-dry, humid sub-tropical and alpine climatic zones with mean temperature of <20.0–>27.5 °C prevailing across the country. The country is divided into 20 agro-ecological regions (AER) with different climate parameters (Table 1), soils and cultivated crops (Table 2) [24]. The mean annual rainfall varies from <150–3000 mm in different AERs. It receives uneven and erratic rainfall from June to September. It rains heavily in the north-eastern and western ghats regions and Kerala state, whereas the south-eastern parts and the Indo-Gangetic plain receive moderate rainfall. Scanty rainfall is obtained in the western parts of Gujarat, Rajasthan, Punjab and Haryana.

2.2. Soil Sampling and Analysis

Altogether, 242,827 soil samples from the surface soil layers (0 to 15 cm depth) were collected from agricultural land holdings of 615 districts in 28 states of India, under the tutelage of All India Coordinated Research Project on Micro and Secondary Nutrients and Pollutant Elements in Soils and Plants, following a stratified random sampling procedure [25], from April to June of 2012 to 2018. Soil samples were collected using a hand-held auger composed of stainless steel. Each composite soil sample was obtained from 3 to 4 subsamples collected from a small land holding (<1 ha), 6 to 7 subsamples collected from a medium land holding (1–3 ha) and 9 to 10 subsamples collected from a large land holding (>3 ha) of each district. The collected samples were air dried, processed, ground to pass through a 2 mm size sieve and stored in plastic bottles for analysis.
Soil samples were analyzed for available S using calcium chloride solution (0.15%) as extractant [26] and spectrophotometer (Shimadzu (UV-1800), Shimadzu Scientific Instruments, Columbia, USA) for estimation. Available Zn, Fe, Cu and Mn in soil samples were determined after extracting the samples with diethylene triamine penta acetic acid extractant [27]. The estimation of Zn, Fe, Cu and Mn in clear extract was carried out utilizing atomic absorption spectrophotometer (Varian (AA240FS), Varian Inc., Palo Alto, CA, USA). Available B was estimated after extracting the samples with hot water [28] and estimating the color intensity developed by adding azomethine-H solution using a spectrophotometer (Shimadzu (UV-1800), Shimadzu Scientific Instruments, Columbia, Portland, OR, USA).

2.3. Statistical Analysis

The data pertaining to available S, Zn, B, Fe, Cu and Mn in soil samples were subjected to statistical analysis for obtaining descriptive statistics, viz., minimum, maximum, mean, standard deviation (SD), coefficient of variation (CV), skewness and kurtosis, using SAS 9.2 software package [29]. Run tests were carried out to check the randomness of data. The frequency distribution of soil samples having available S and micronutrients in different concentrations and distribution of single- and multi-nutrient deficiencies were estimated using the data analysis program of Microsoft Excel. The concentrations of S and micronutrients in soil samples were categorized as acute deficient, deficient, latent deficient, marginally sufficient, adequate and high as per the generalized classification adopted for Indian soils [16]. The distribution maps for two- and multi-nutrient deficiencies were prepared using software ArcGIS for power BI, in order to have better data visualization and proper understanding of distribution of nutrient deficiencies in the different parts of India. The nutrient deficiencies (% of the sampled sites), district boundary, state boundary and AER boundary were used as different layers of ArcGIS mapping.

3. Results

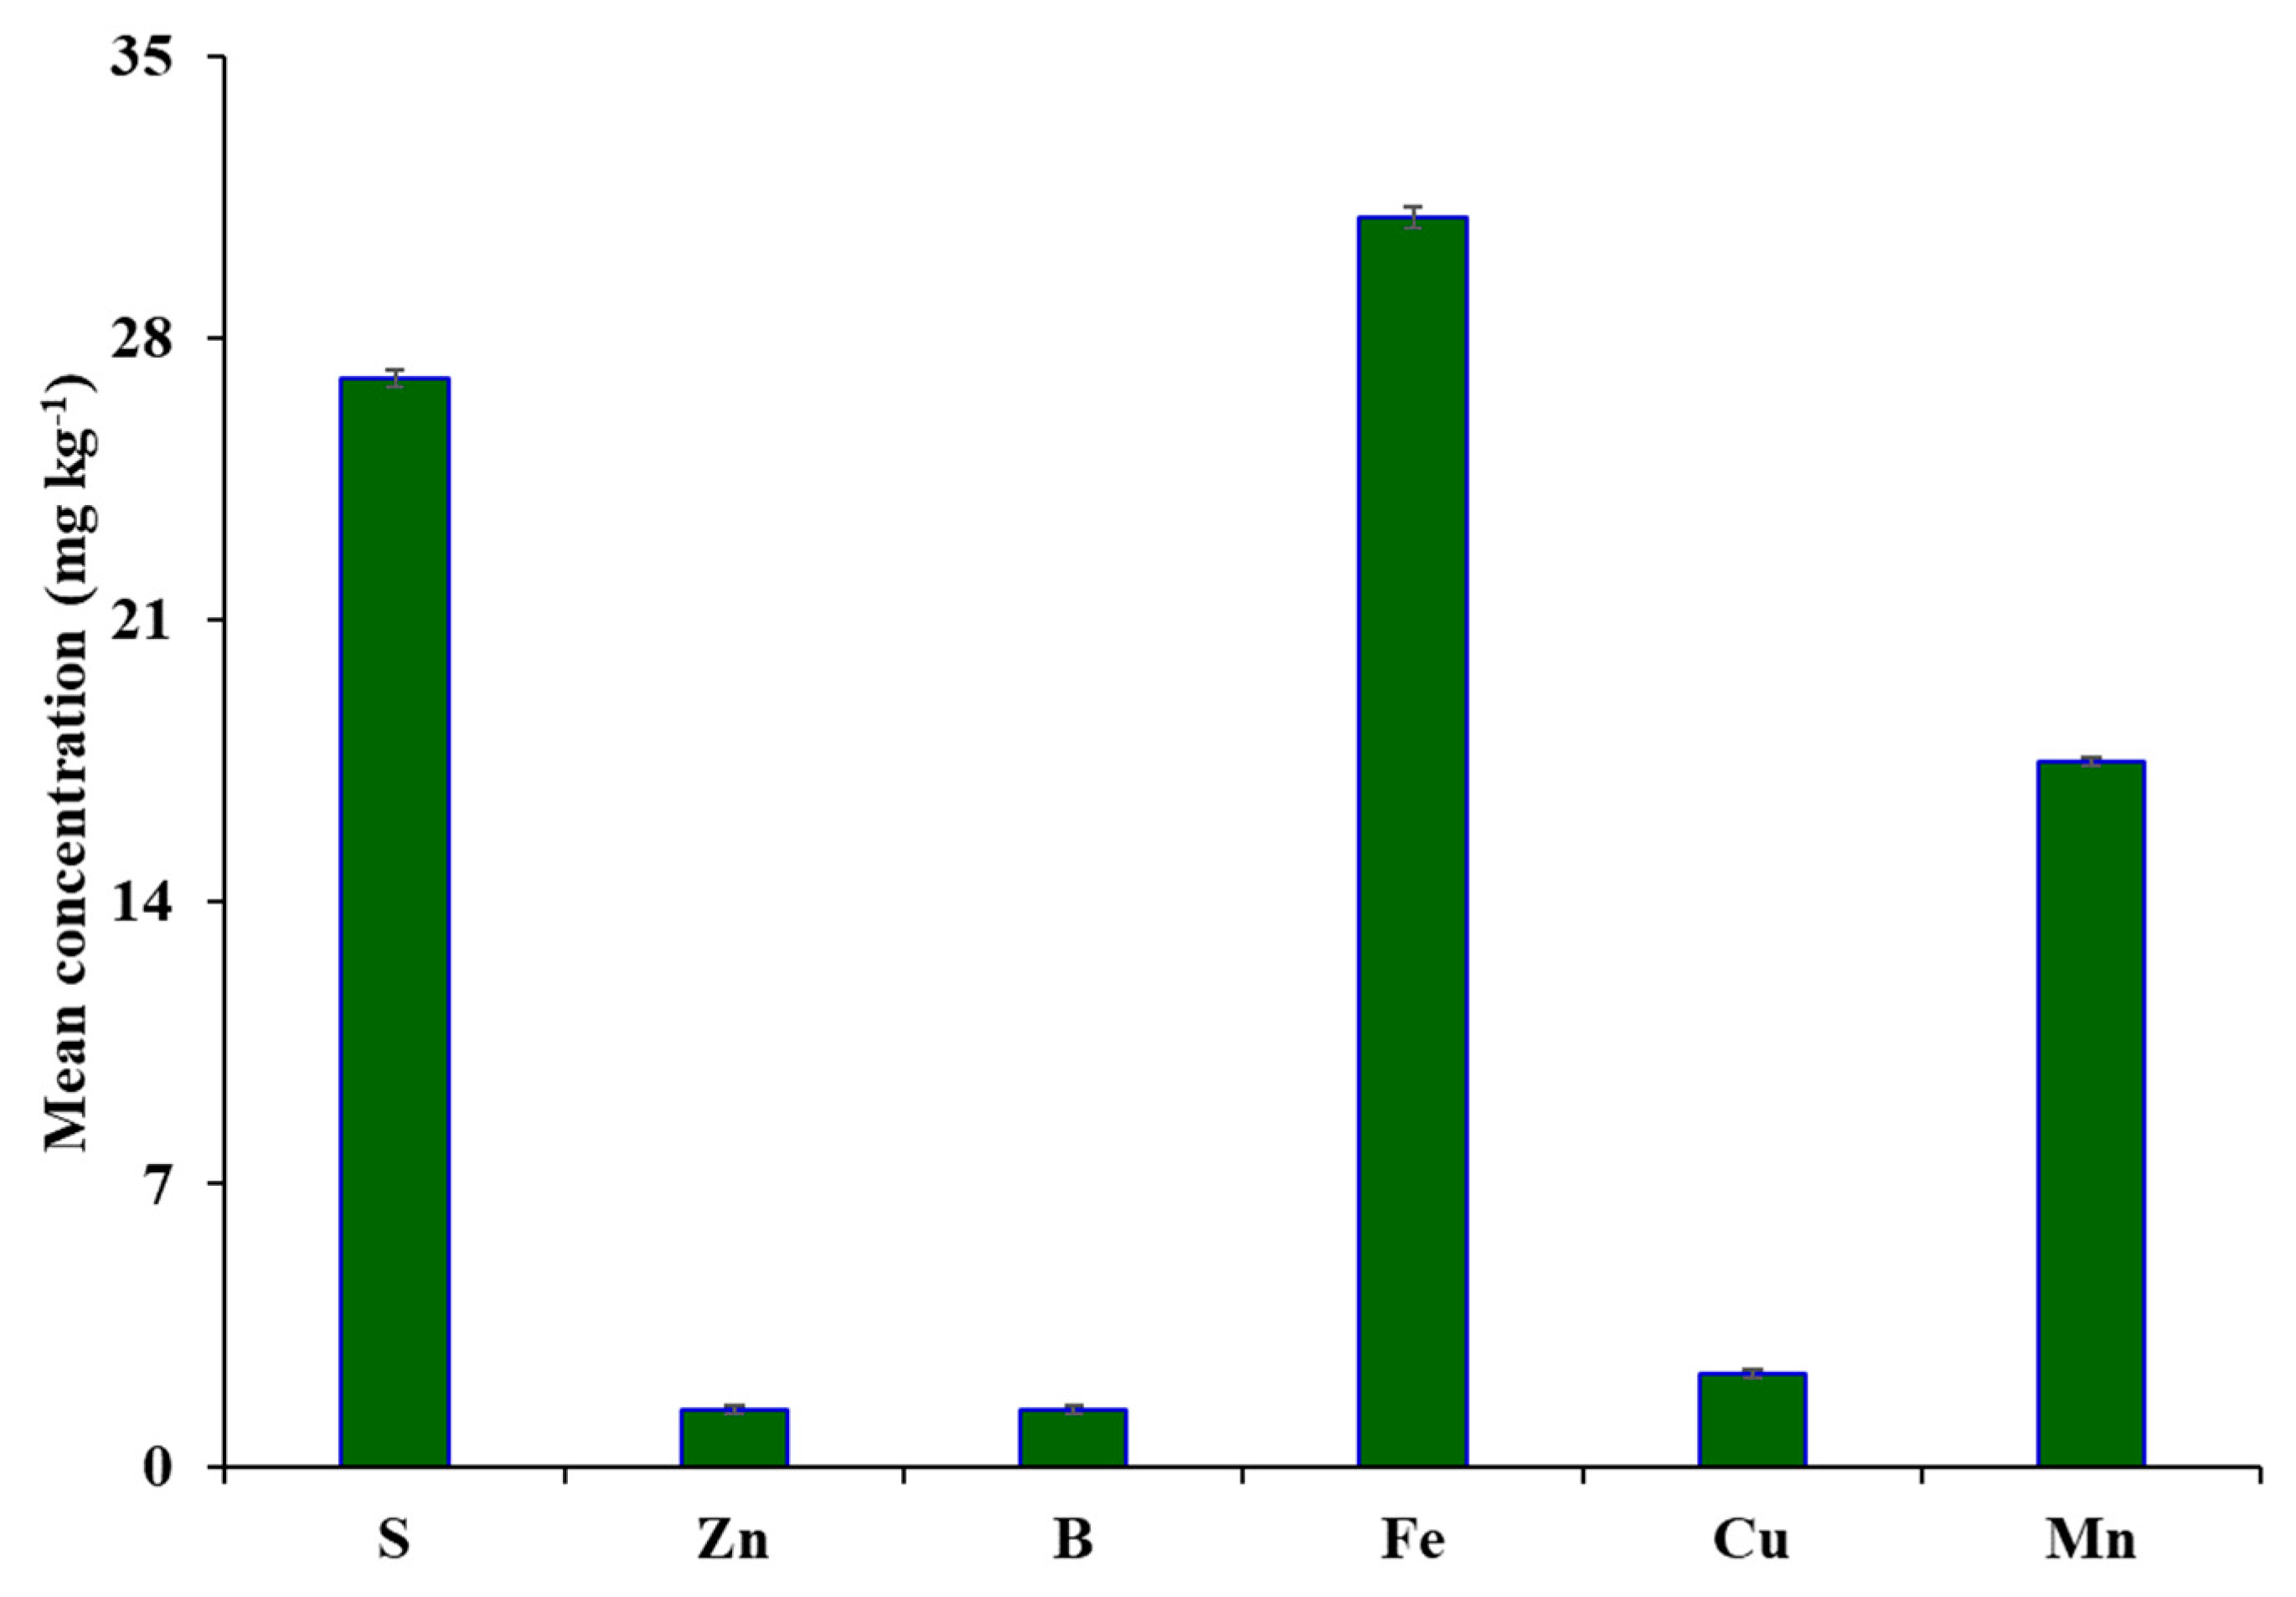
3.1. Concentration of Available S, Zn, B, Fe, Cu and Mn

The concentration of available S, Zn and B varied from 0.02–822, 0.01–59.8 and 0.01–109 mg kg−1, respectively (Table 3). The concentration of available Fe, Cu and Mn varied from 0.01–964, 0.01–99.2 and 0.01–483 mg kg−1, respectively. However, the mean concentration of available nutrients followed the order: available Fe > available S > available Mn > available Cu > available Zn, available B (Figure 1). The CV values of available nutrients varied from 111% (for available S) to 338% (for available B).

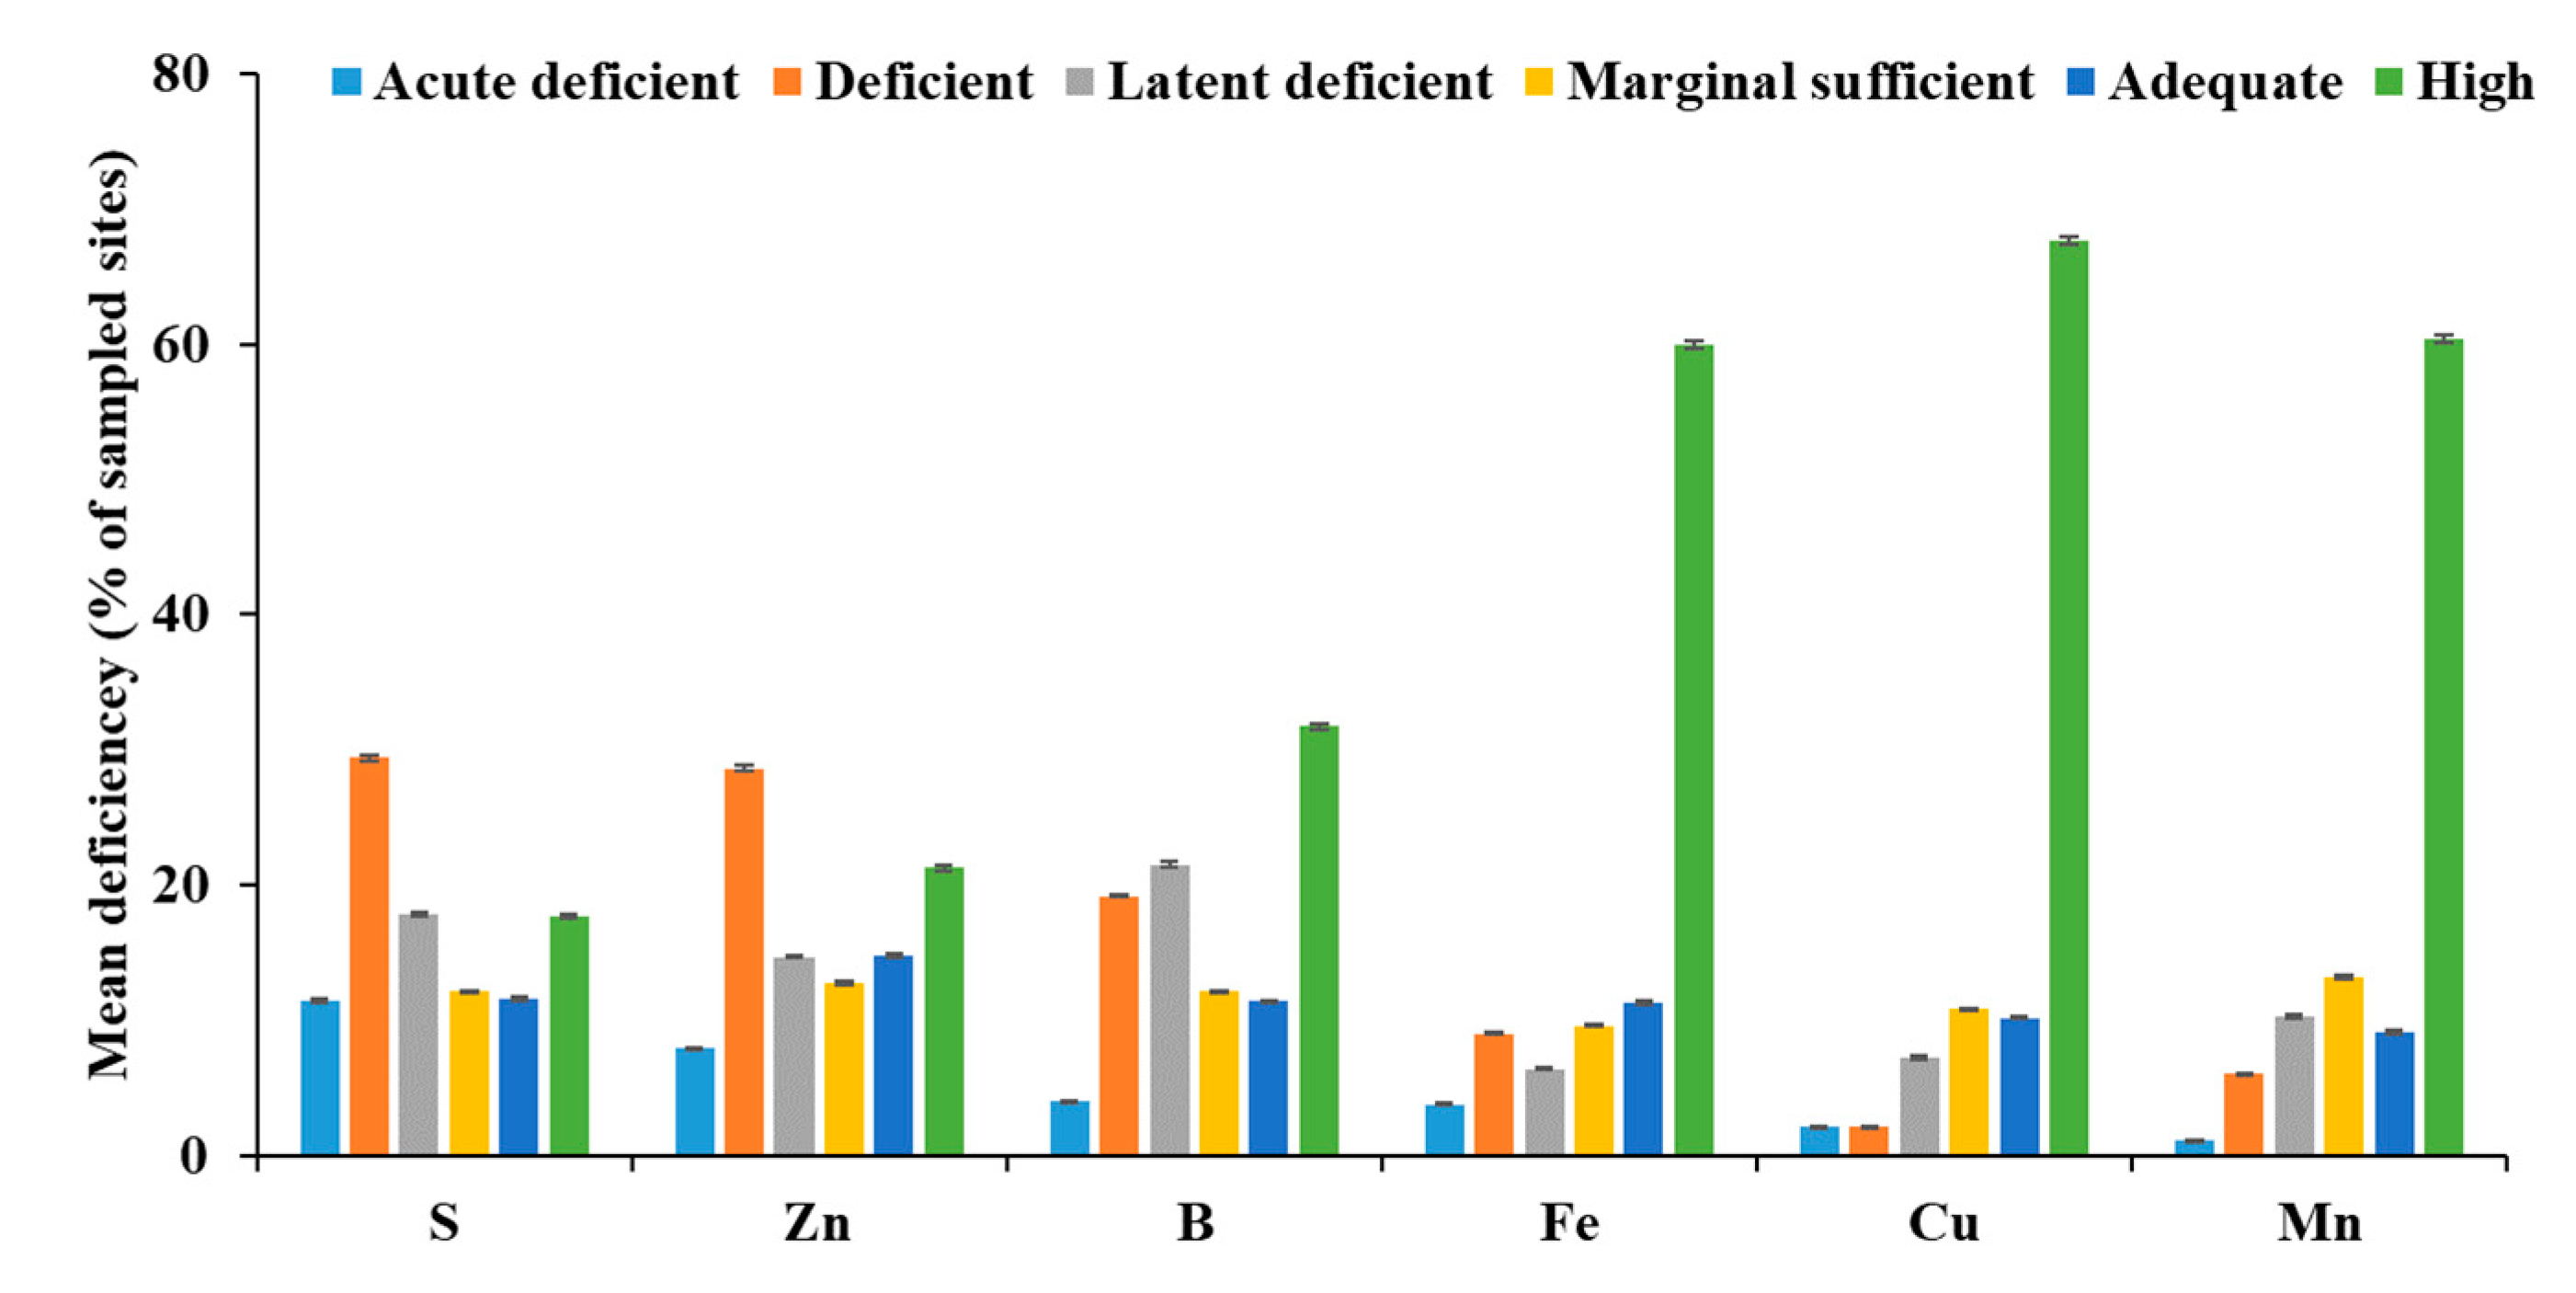
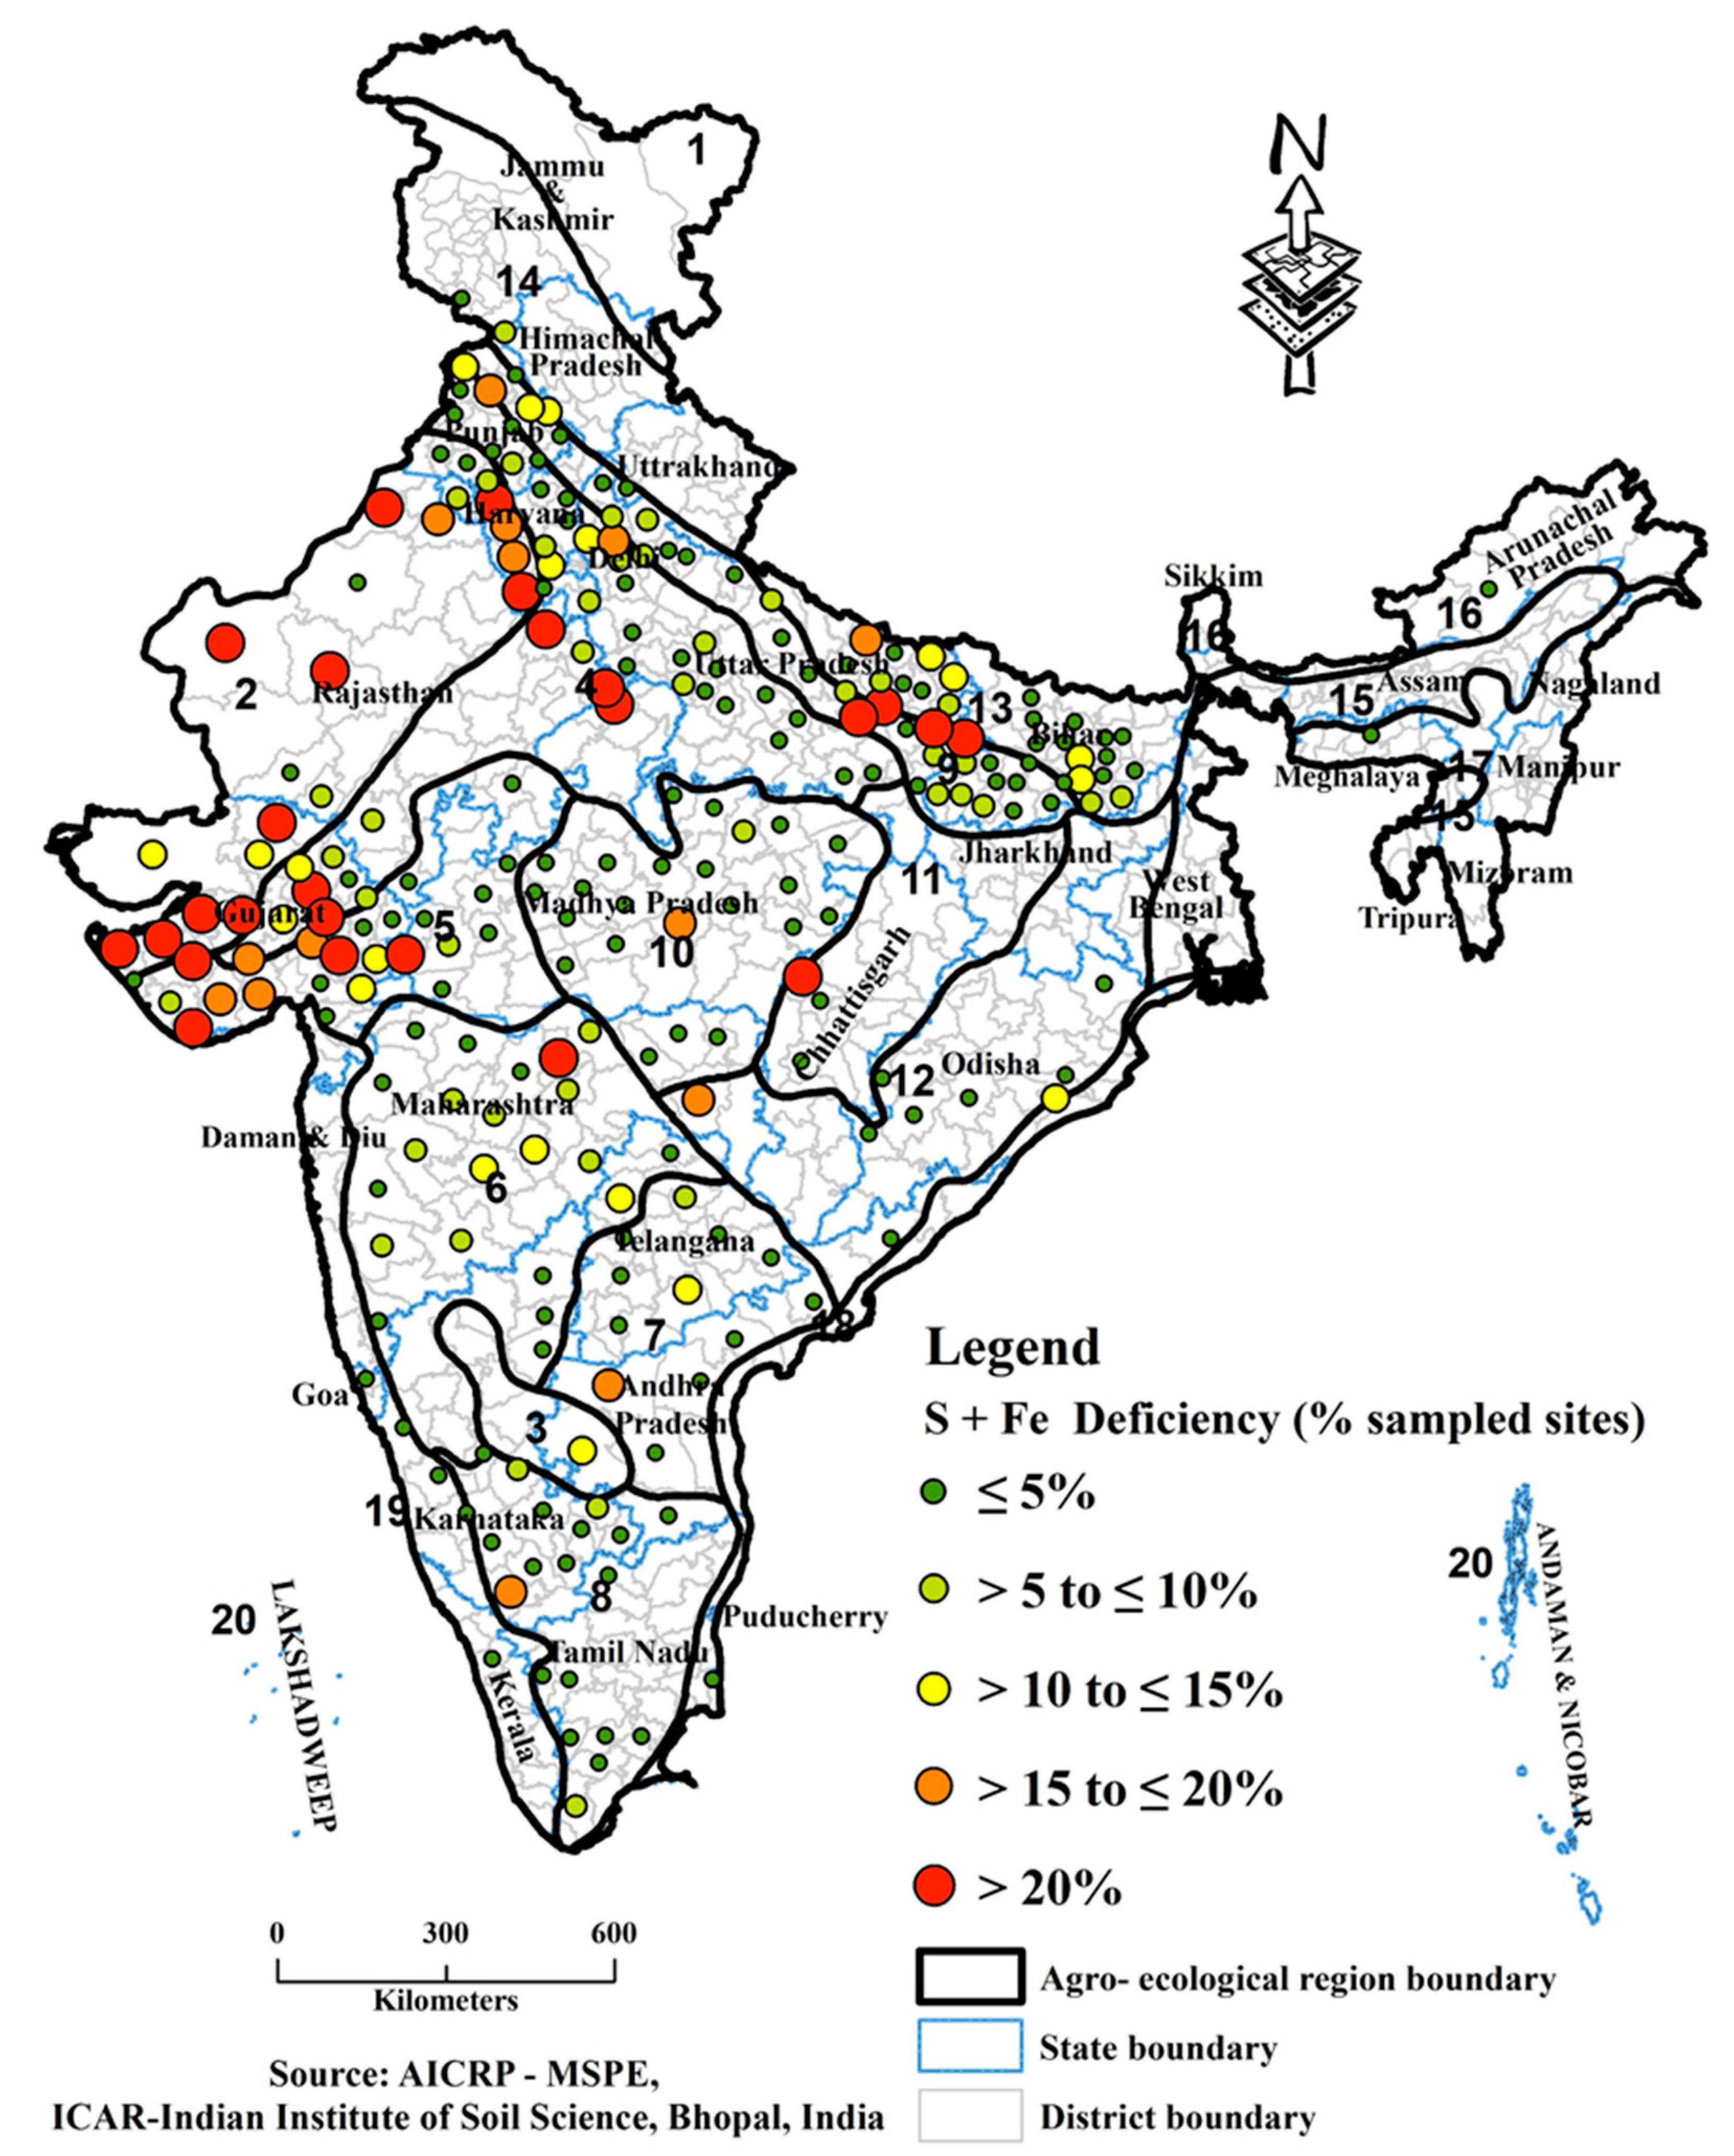
3.2. Distribution of Single Nutrient Deficiencies of S, Zn, B, Fe, Cu and Mn

The concentration of available nutrients in soils were grouped into acute deficient, deficient, latent deficient, marginally sufficient, adequate and high categories. About 11.4%, 29.4% and 17.8% of the sampled sites were acute deficient (≤7.5 mg kg−1), deficient (>7.5–≤15.0 mg kg−1) and latent deficient (>15.0–≤22.5 mg kg−1) in available S, respectively (Figure 2). Meanwhile, 12.1%, 11.6% and 17.7% of the sampled sites were marginally sufficient (>22.5–≤30.0 mg kg−1), adequate (>30.0–≤40.0 mg kg−1) and high (>40.0 mg kg−1) in available S. Out of 615 districts, >30–≤40% of the sampled sites in 86 districts, >40–≤50% of the sampled sites in 70 districts and >50% of the sampled sites in 101 districts were deficient (acute deficient + deficient) in available S. More than 50% of the sampled sites in 12 districts of Gujarat, 13 districts of Madhya Pradesh and 8 districts each in Odisha and Tamil Nadu were deficient in available S.
About 7.90%, 28.6% and 14.7% of the sampled sites were acute deficient (≤0.30 mg kg−1), deficient (>0.30–≤0.60 mg kg−1) and latent deficient (>0.60–≤0.90 mg kg−1) in available Zn, respectively (Figure 2). Meanwhile, 12.7%, 14.8% and 21.3% of the sampled sites were marginally sufficient (>0.90–≤1.20 mg kg−1), adequate (>1.20–≤1.80 mg kg−1) and high (>1.80 mg kg−1) in available Zn, respectively. More than 30–≤40% of the sampled sites in 68 districts, >40–≤50% of samples in 57 districts and >50% of the sampled sites in 131 districts were deficient (acute deficient + deficient) in available Zn. More than 50% of the sampled sites in 16 districts of Bihar, 40 districts of Madhya Pradesh, 13 districts of Maharashtra and 23 districts of Tamil Nadu were deficient in available Zn.
About 4.00%, 19.2% and 21.5% of the sampled sites were acute deficient (≤0.20 mg kg−1), deficient (>0.20–≤0.50 mg kg−1) and latent deficient (>0.50–≤0.70 mg kg−1) in available B, respectively (Figure 2). Meanwhile, 12.1%, 11.4% and 31.7% of the sampled sites were marginally sufficient (>0.70–≤0.90 mg kg−1), adequate (>0.90–≤1.10 mg kg−1) and high (>1.10 mg kg−1) in available B, respectively. More than 30–≤40% of the sampled sites in 75 districts, >40–≤50% of the sampled sites in 57 districts and >50% of the sampled sites in 86 districts were deficient (acute deficient + deficient) in available B. More than 50% of the sampled sites in 6 districts each of Assam and Karnataka, 7 districts of Jharkhand, 10 districts of Kerala, 15 districts of Odisha and 5 districts each of Maharashtra, Telangana and West Bengal were deficient in available B.
About 3.80%, 9.00% and 6.40% of the sampled sites were acute deficient (≤2.50 mg kg−1), deficient (>2.50–≤4.50 mg kg−1) and latent deficient (>4.50–≤6.50 mg kg−1) in available Fe, respectively (Figure 2). Meanwhile, 9.60%, 11.3% and 59.9% of the sampled sites were marginally sufficient (>6.50–≤8.50 mg kg−1), adequate (>8.50–≤10.5 mg kg−1) and high (>10.5 mg kg−1) in available Fe, respectively. More than 15–≤20% of the sampled sites in 55 districts, >20–≤25% of samples in 17 districts and >25% of the sampled sites in 83 districts were deficient (acute deficient + deficient) in available Fe. More than 25% of the sampled sites in 17 districts of Gujarat, 14 districts of Maharashtra, 8 districts of Rajasthan and 9 districts of Uttar Pradesh were deficient in available Fe.
About 2.10%, 2.10% and 7.20% of the sampled sites were acute deficient (≤0.20 mg kg−1), deficient (>0.20–≤0.40 mg kg−1) and latent deficient (>0.40–≤0.60 mg kg−1) in available Cu, respectively (Figure 2). Meanwhile, 10.8%, 10.2% and 67.6% of the sampled sites were marginally sufficient (>0.60–≤0.80 mg kg−1), adequate (>0.80–≤1.00 mg kg−1) and high (>1.00 mg kg−1) in available Cu. Out of 615 districts, >15–≤20% of the sampled sites in 13 districts, >20–≤25% of the sampled sites in 8 districts and >25% of the sampled sites in 5 districts were deficient (acute deficient + deficient) in available Cu. More than 25% of the sampled sites in one district of Haryana, three districts of Tamil Nadu and one district of Odisha were deficient in available Cu.
About 1.10%, 6.00% and 10.3% of the sampled sites were acute deficient (≤1.00 mg kg−1), deficient (>1.00–≤3.00 mg kg−1) and latent deficient (>3.00–≤5.00 mg kg−1) in available Mn, respectively (Figure 2). Meanwhile, 13.2%, 9.10% and 60.4% of the sampled sites were marginally sufficient (>5.00–≤7.00 mg kg−1), adequate (>7.00–≤9.00 mg kg−1) and high (>9.00 mg kg−1) in available Mn, respectively. More than 15–≤20% of the sampled sites in 21 districts, >20–≤25% of samples in 14 districts and >25% of the sampled sites in 41 districts were deficient (acute deficient + deficient) in available Mn. More than 25% of the sampled sites in 4 districts of Bihar, 7 districts each of Jammu and Kashmir, Punjab and Rajasthan, 1 district each of Haryana, Himachal Pradesh, Tamil Nadu and Telangana and 12 districts of Uttar Pradesh were deficient in available Mn.

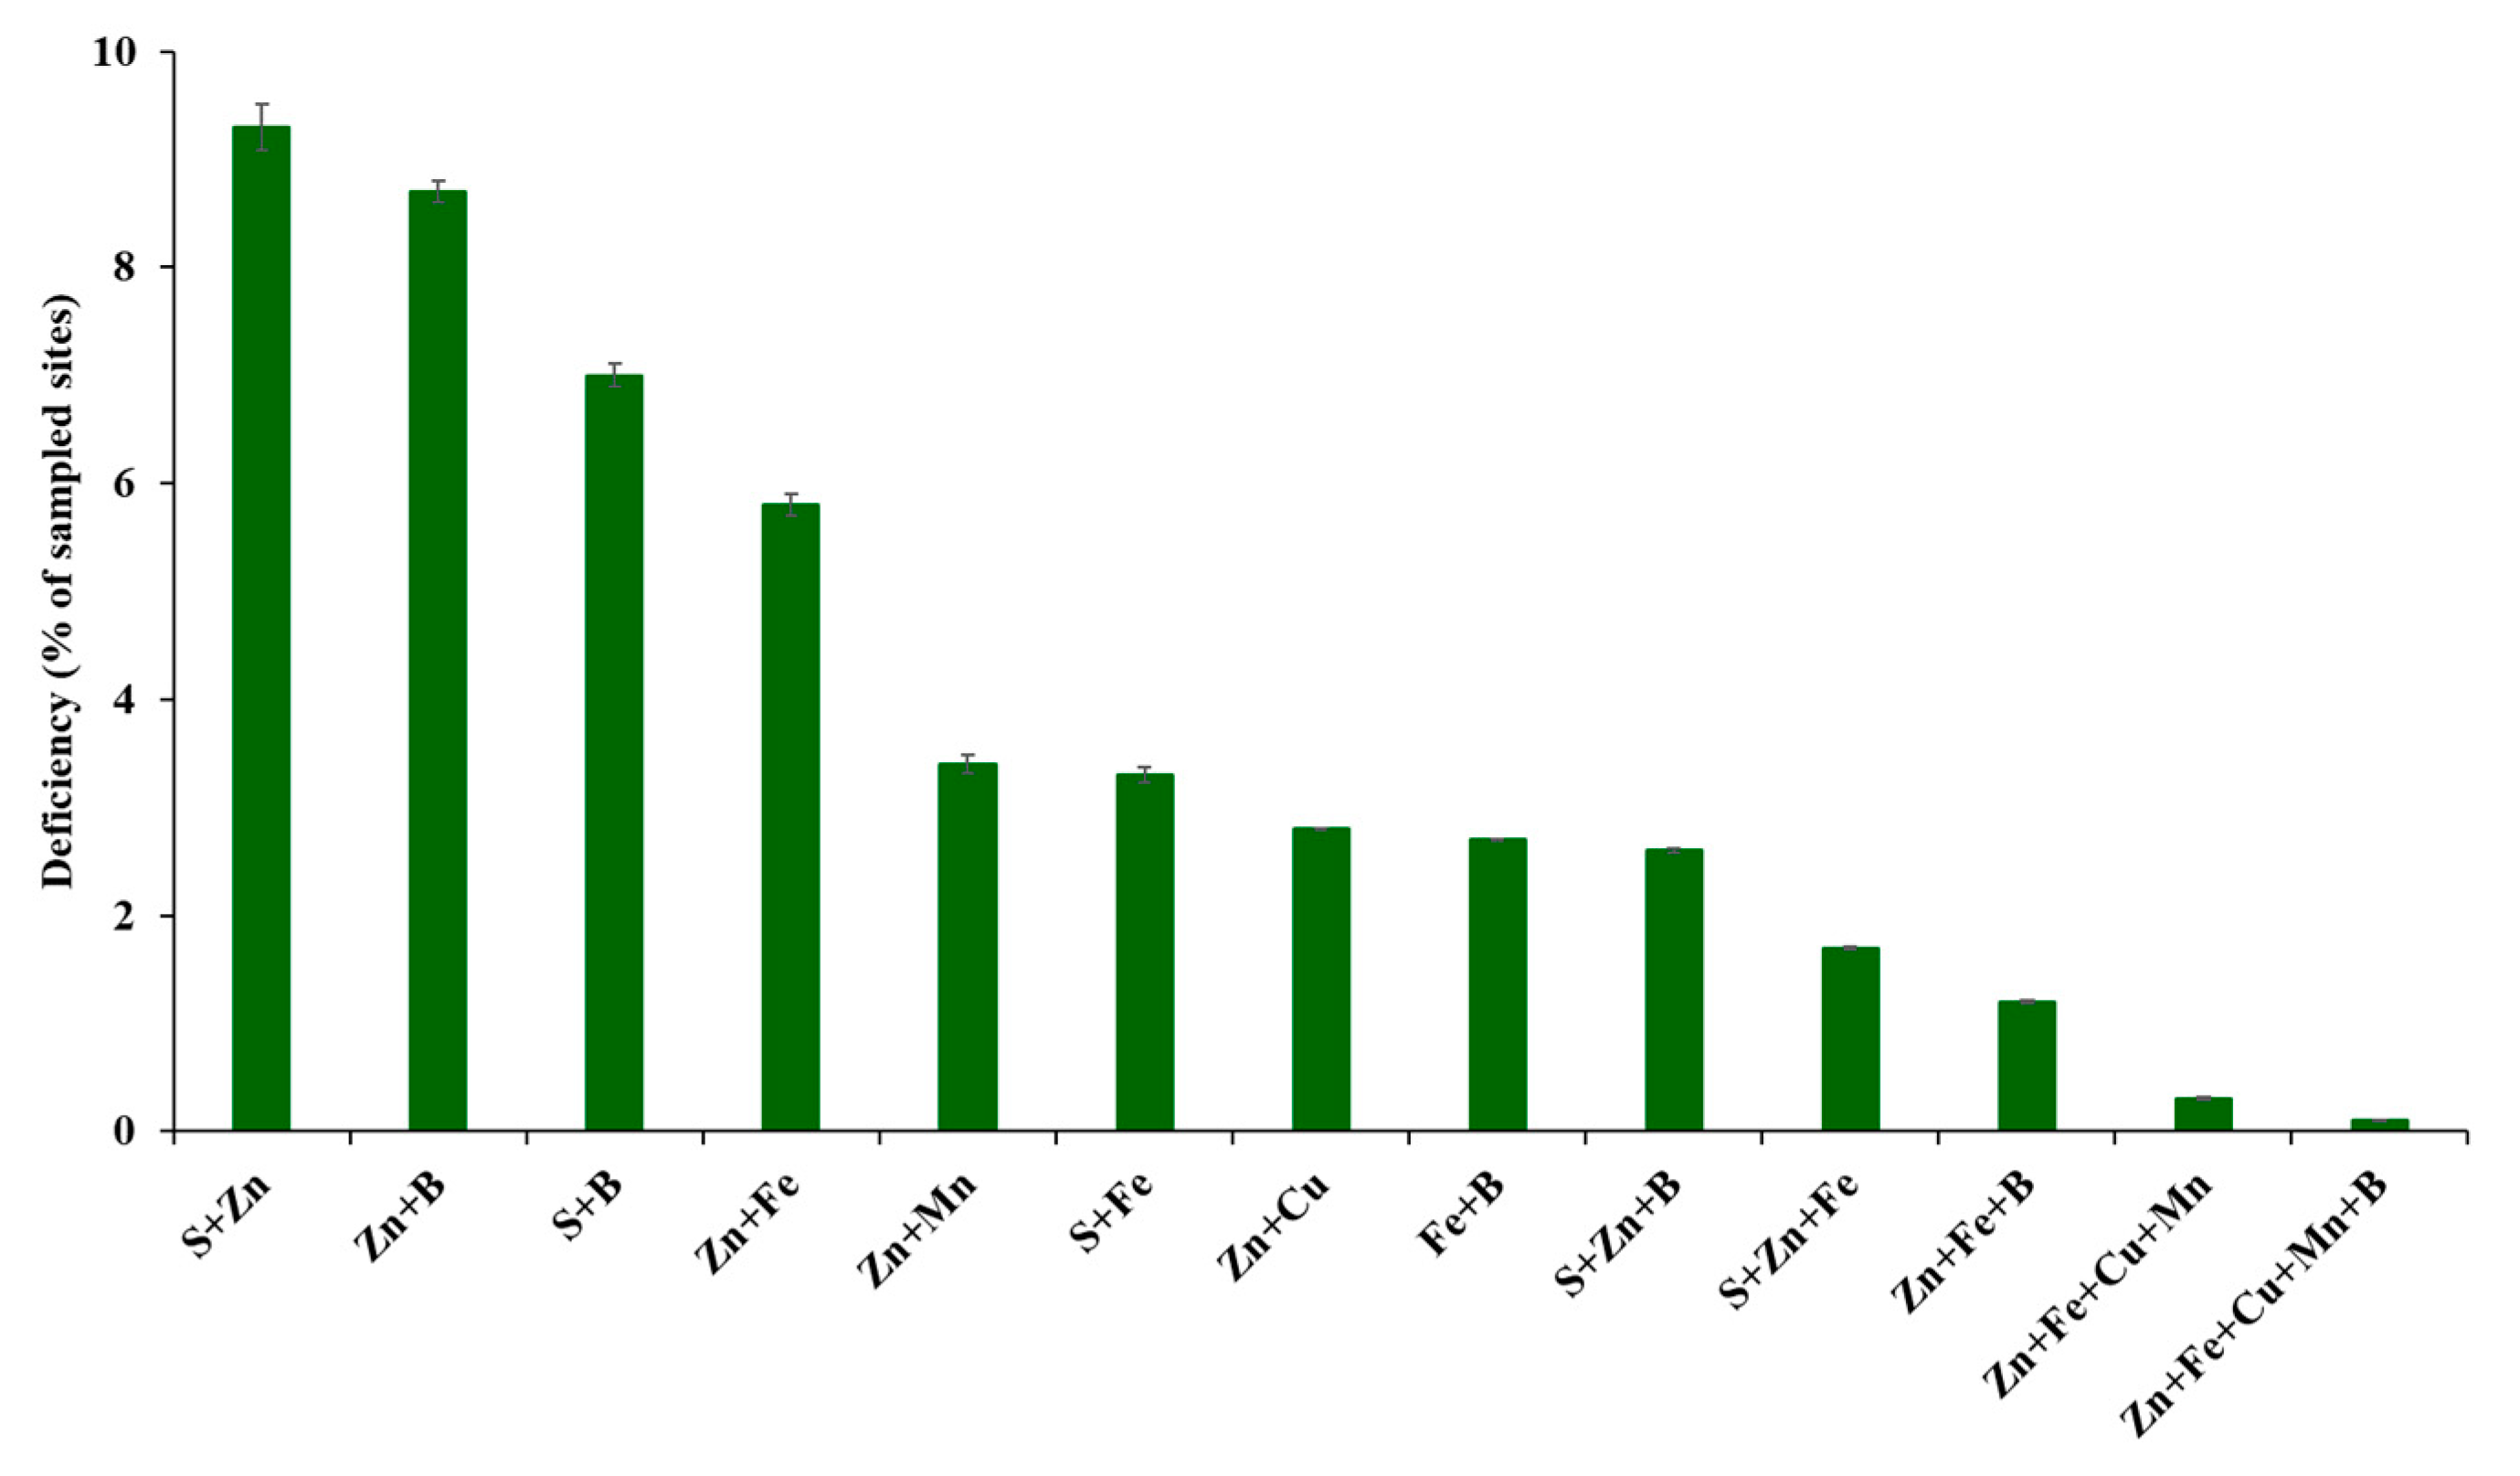
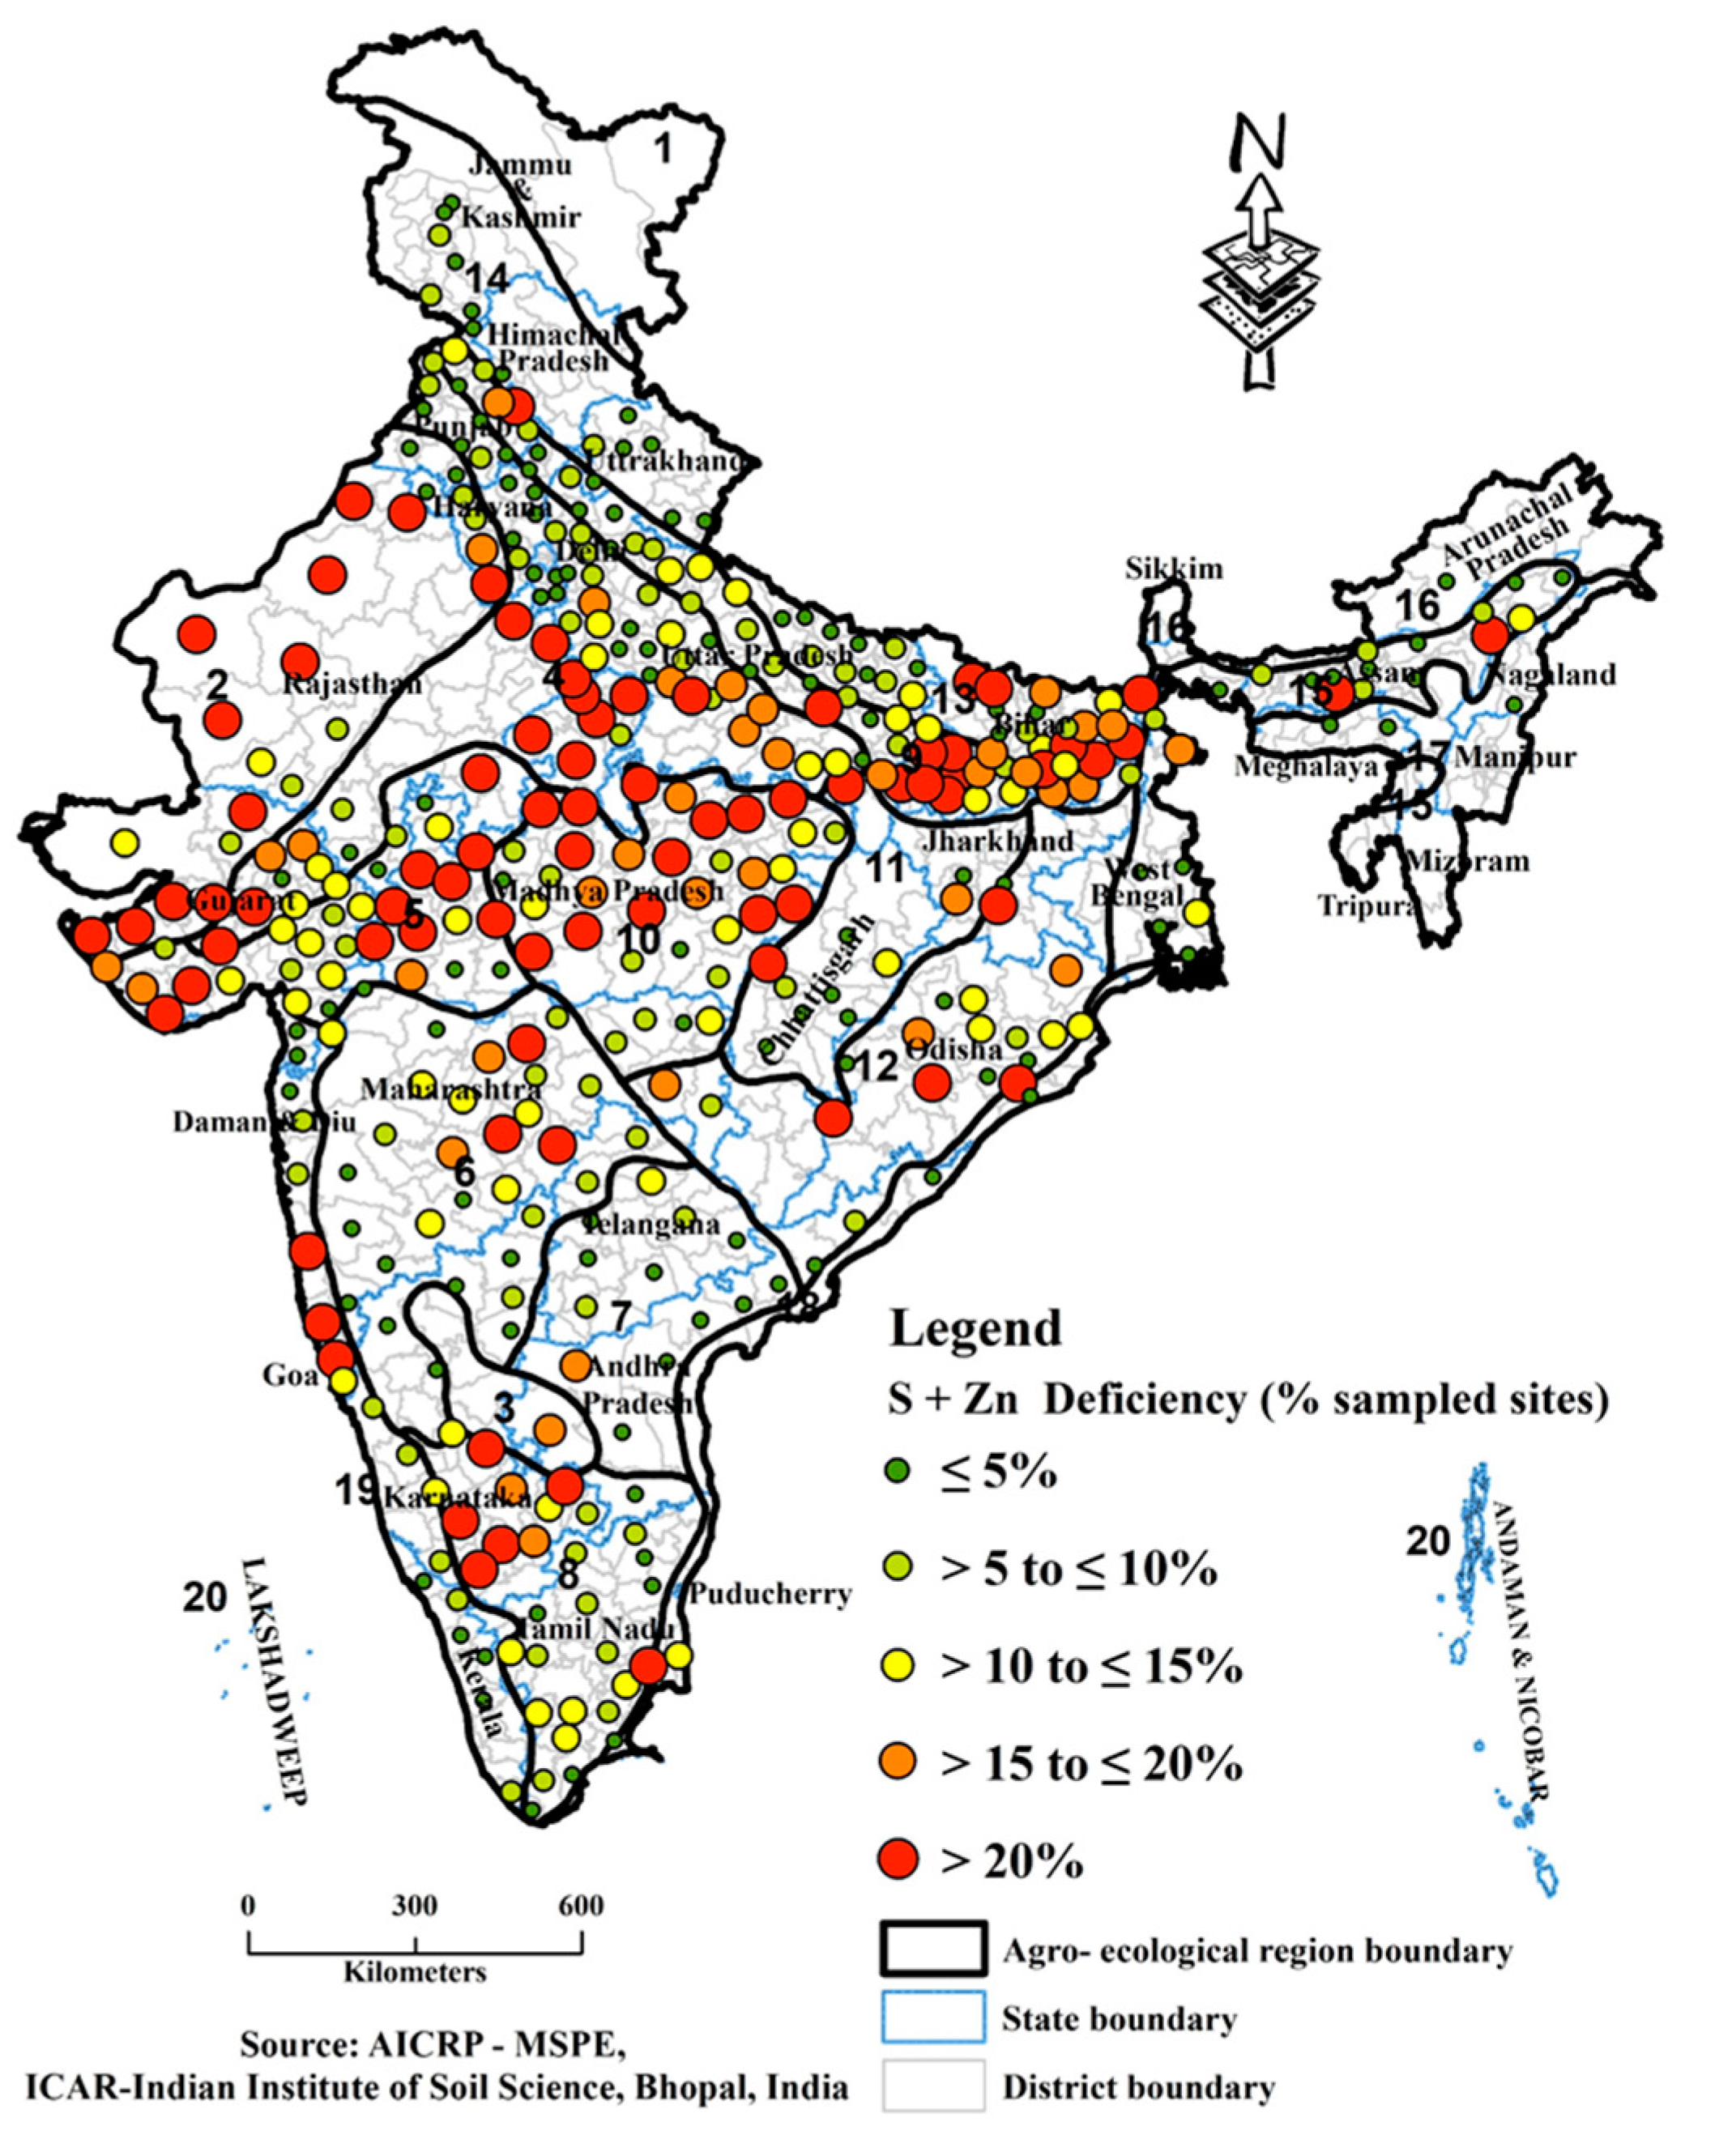
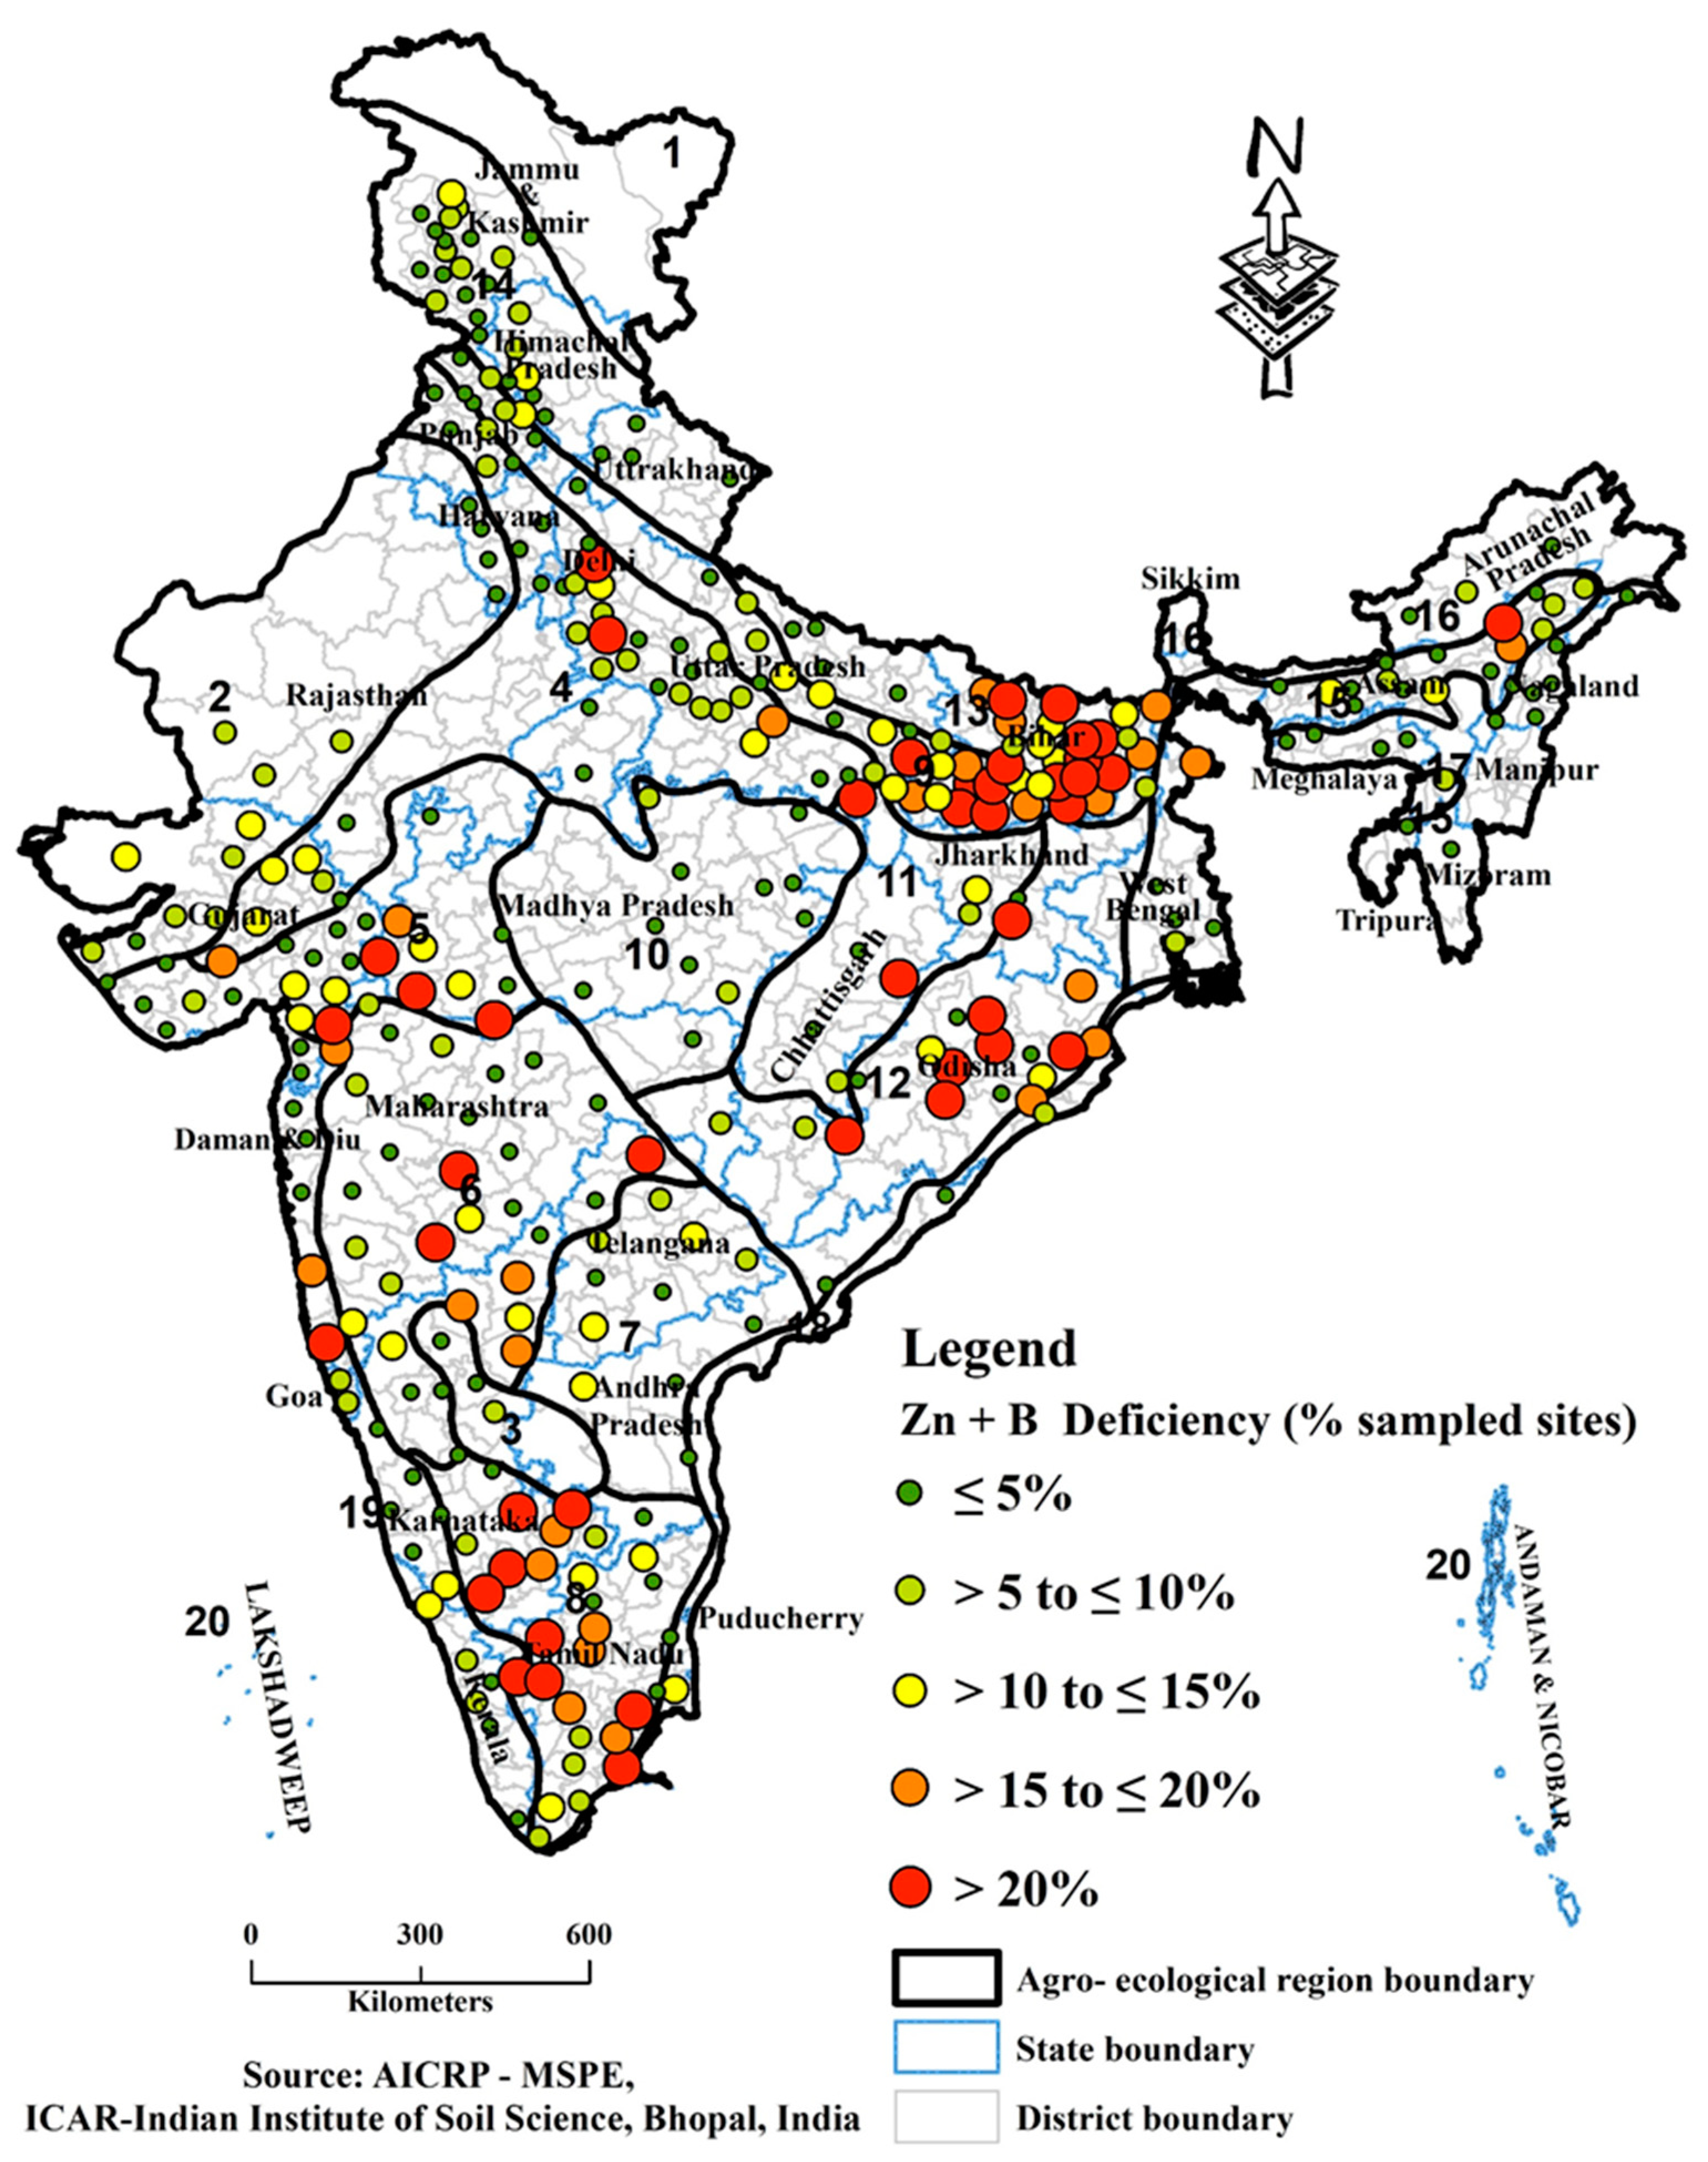
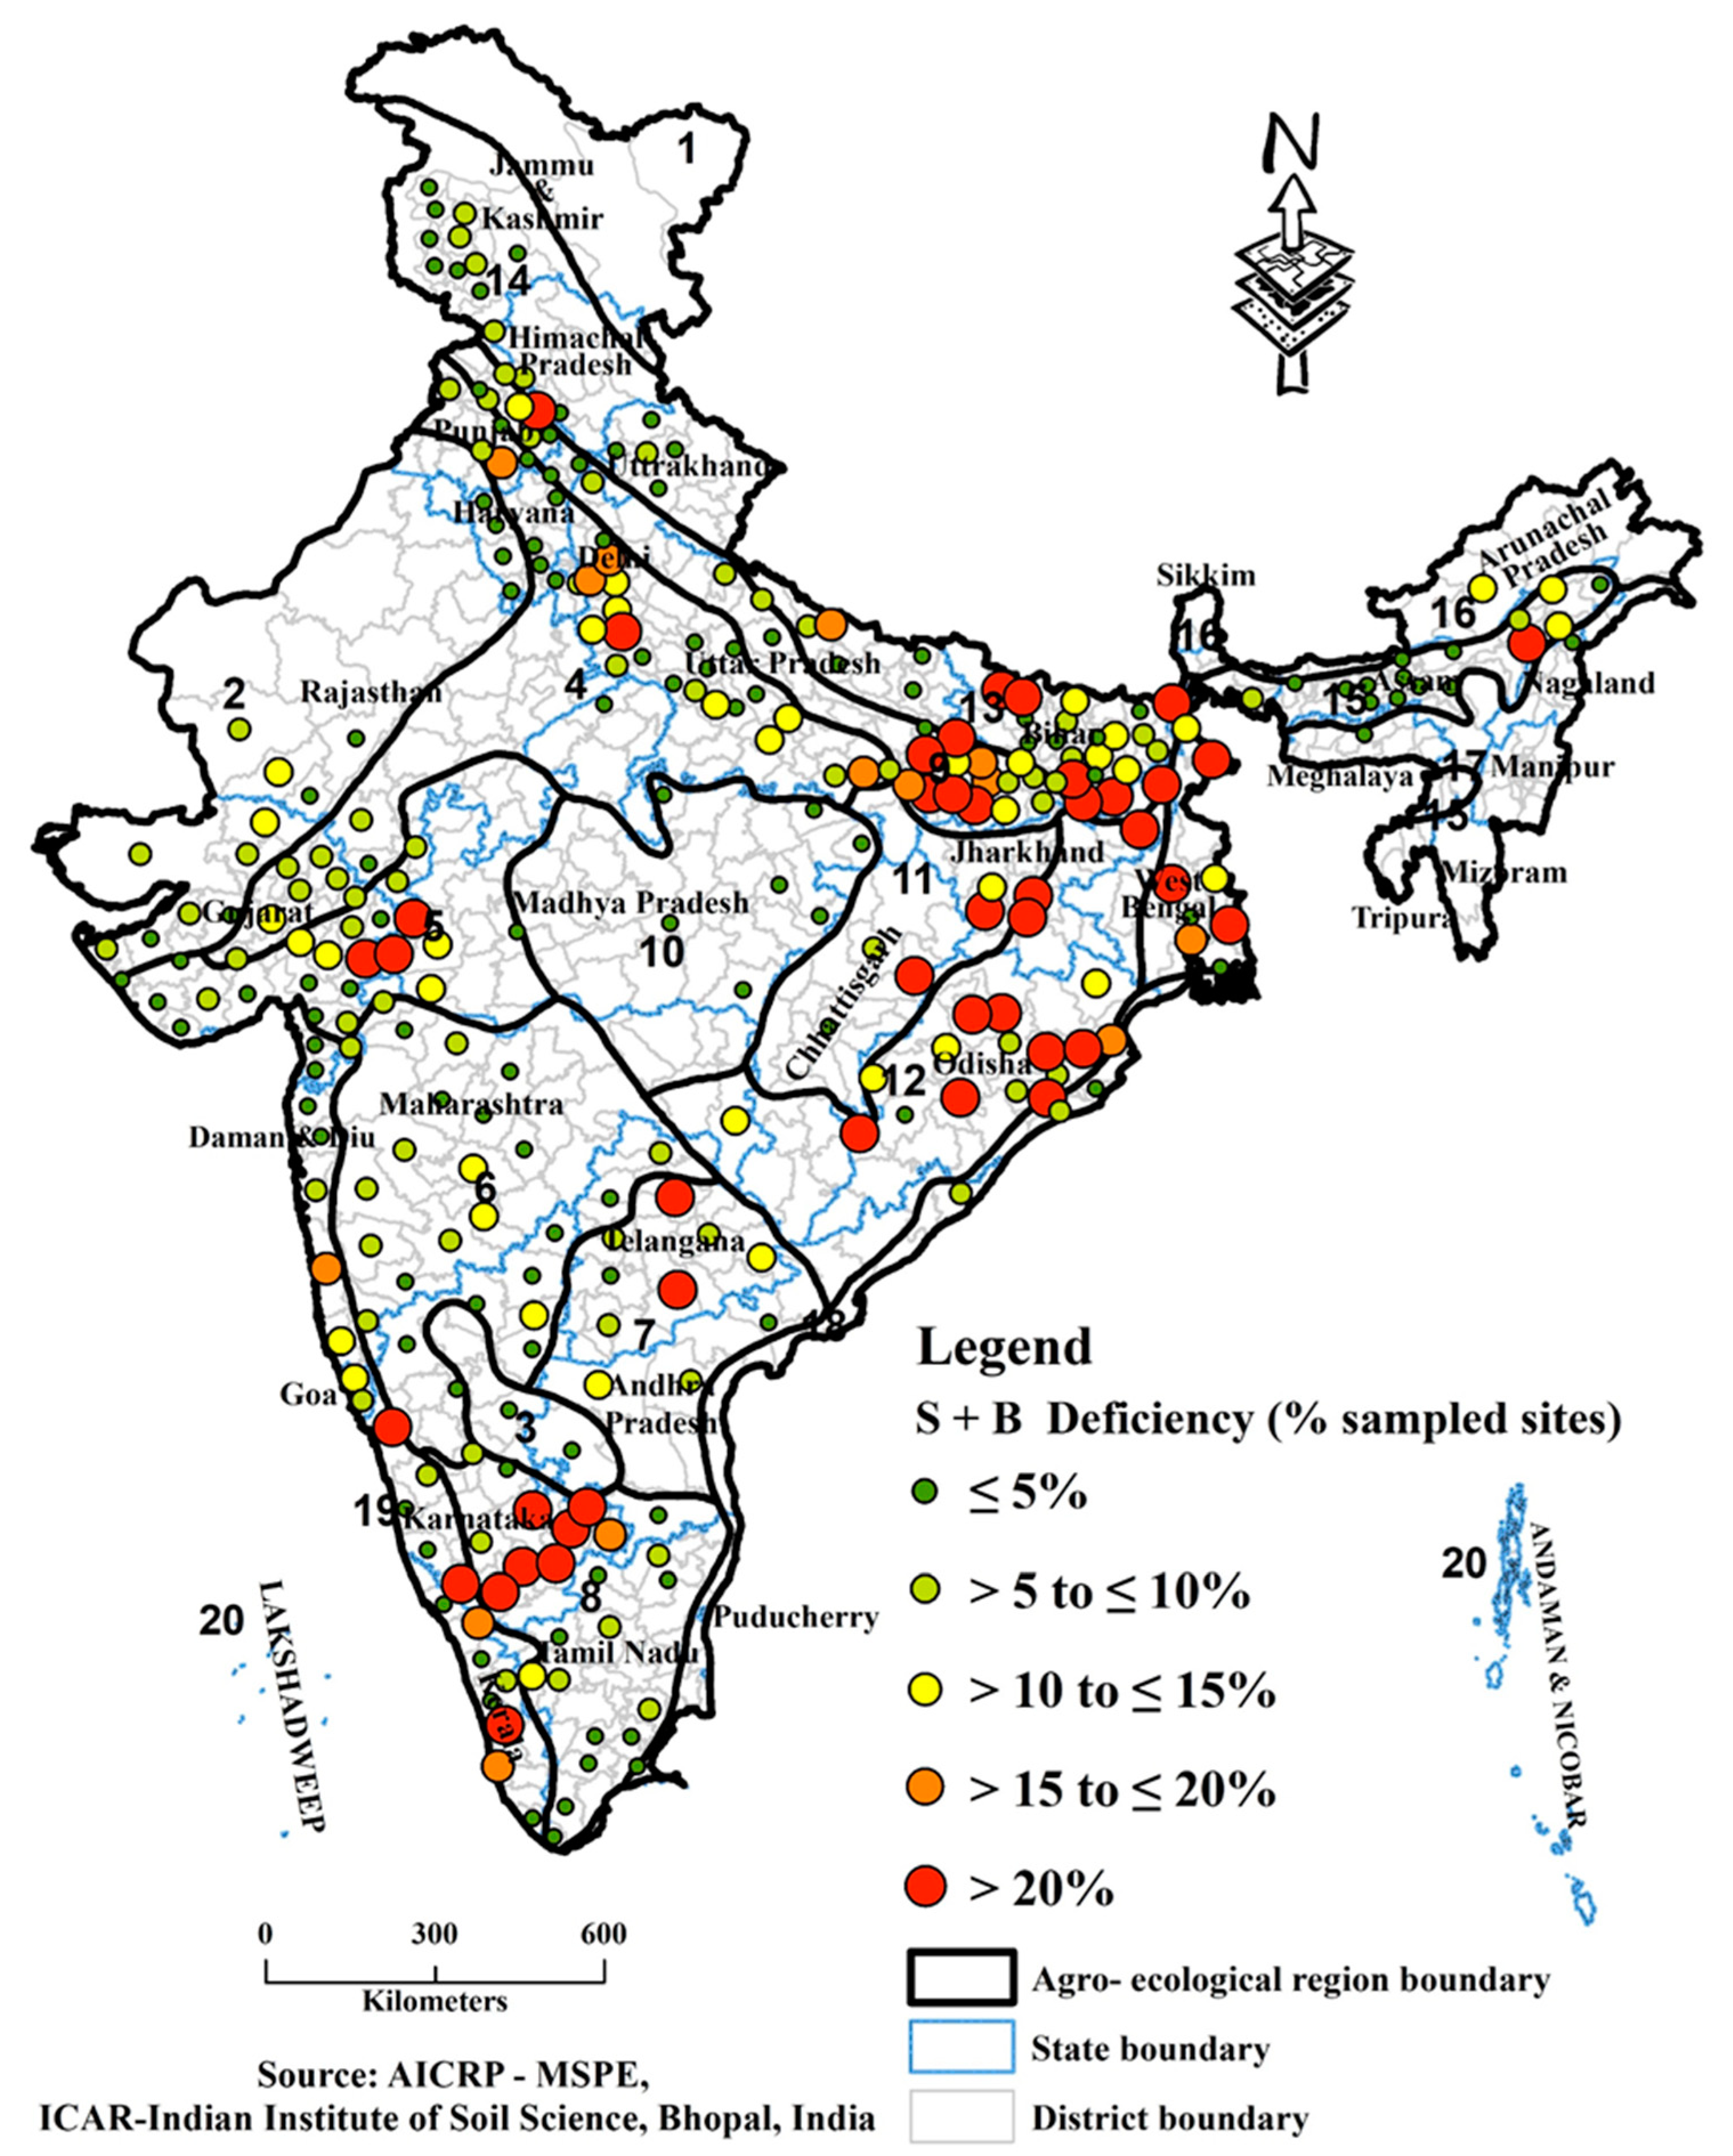
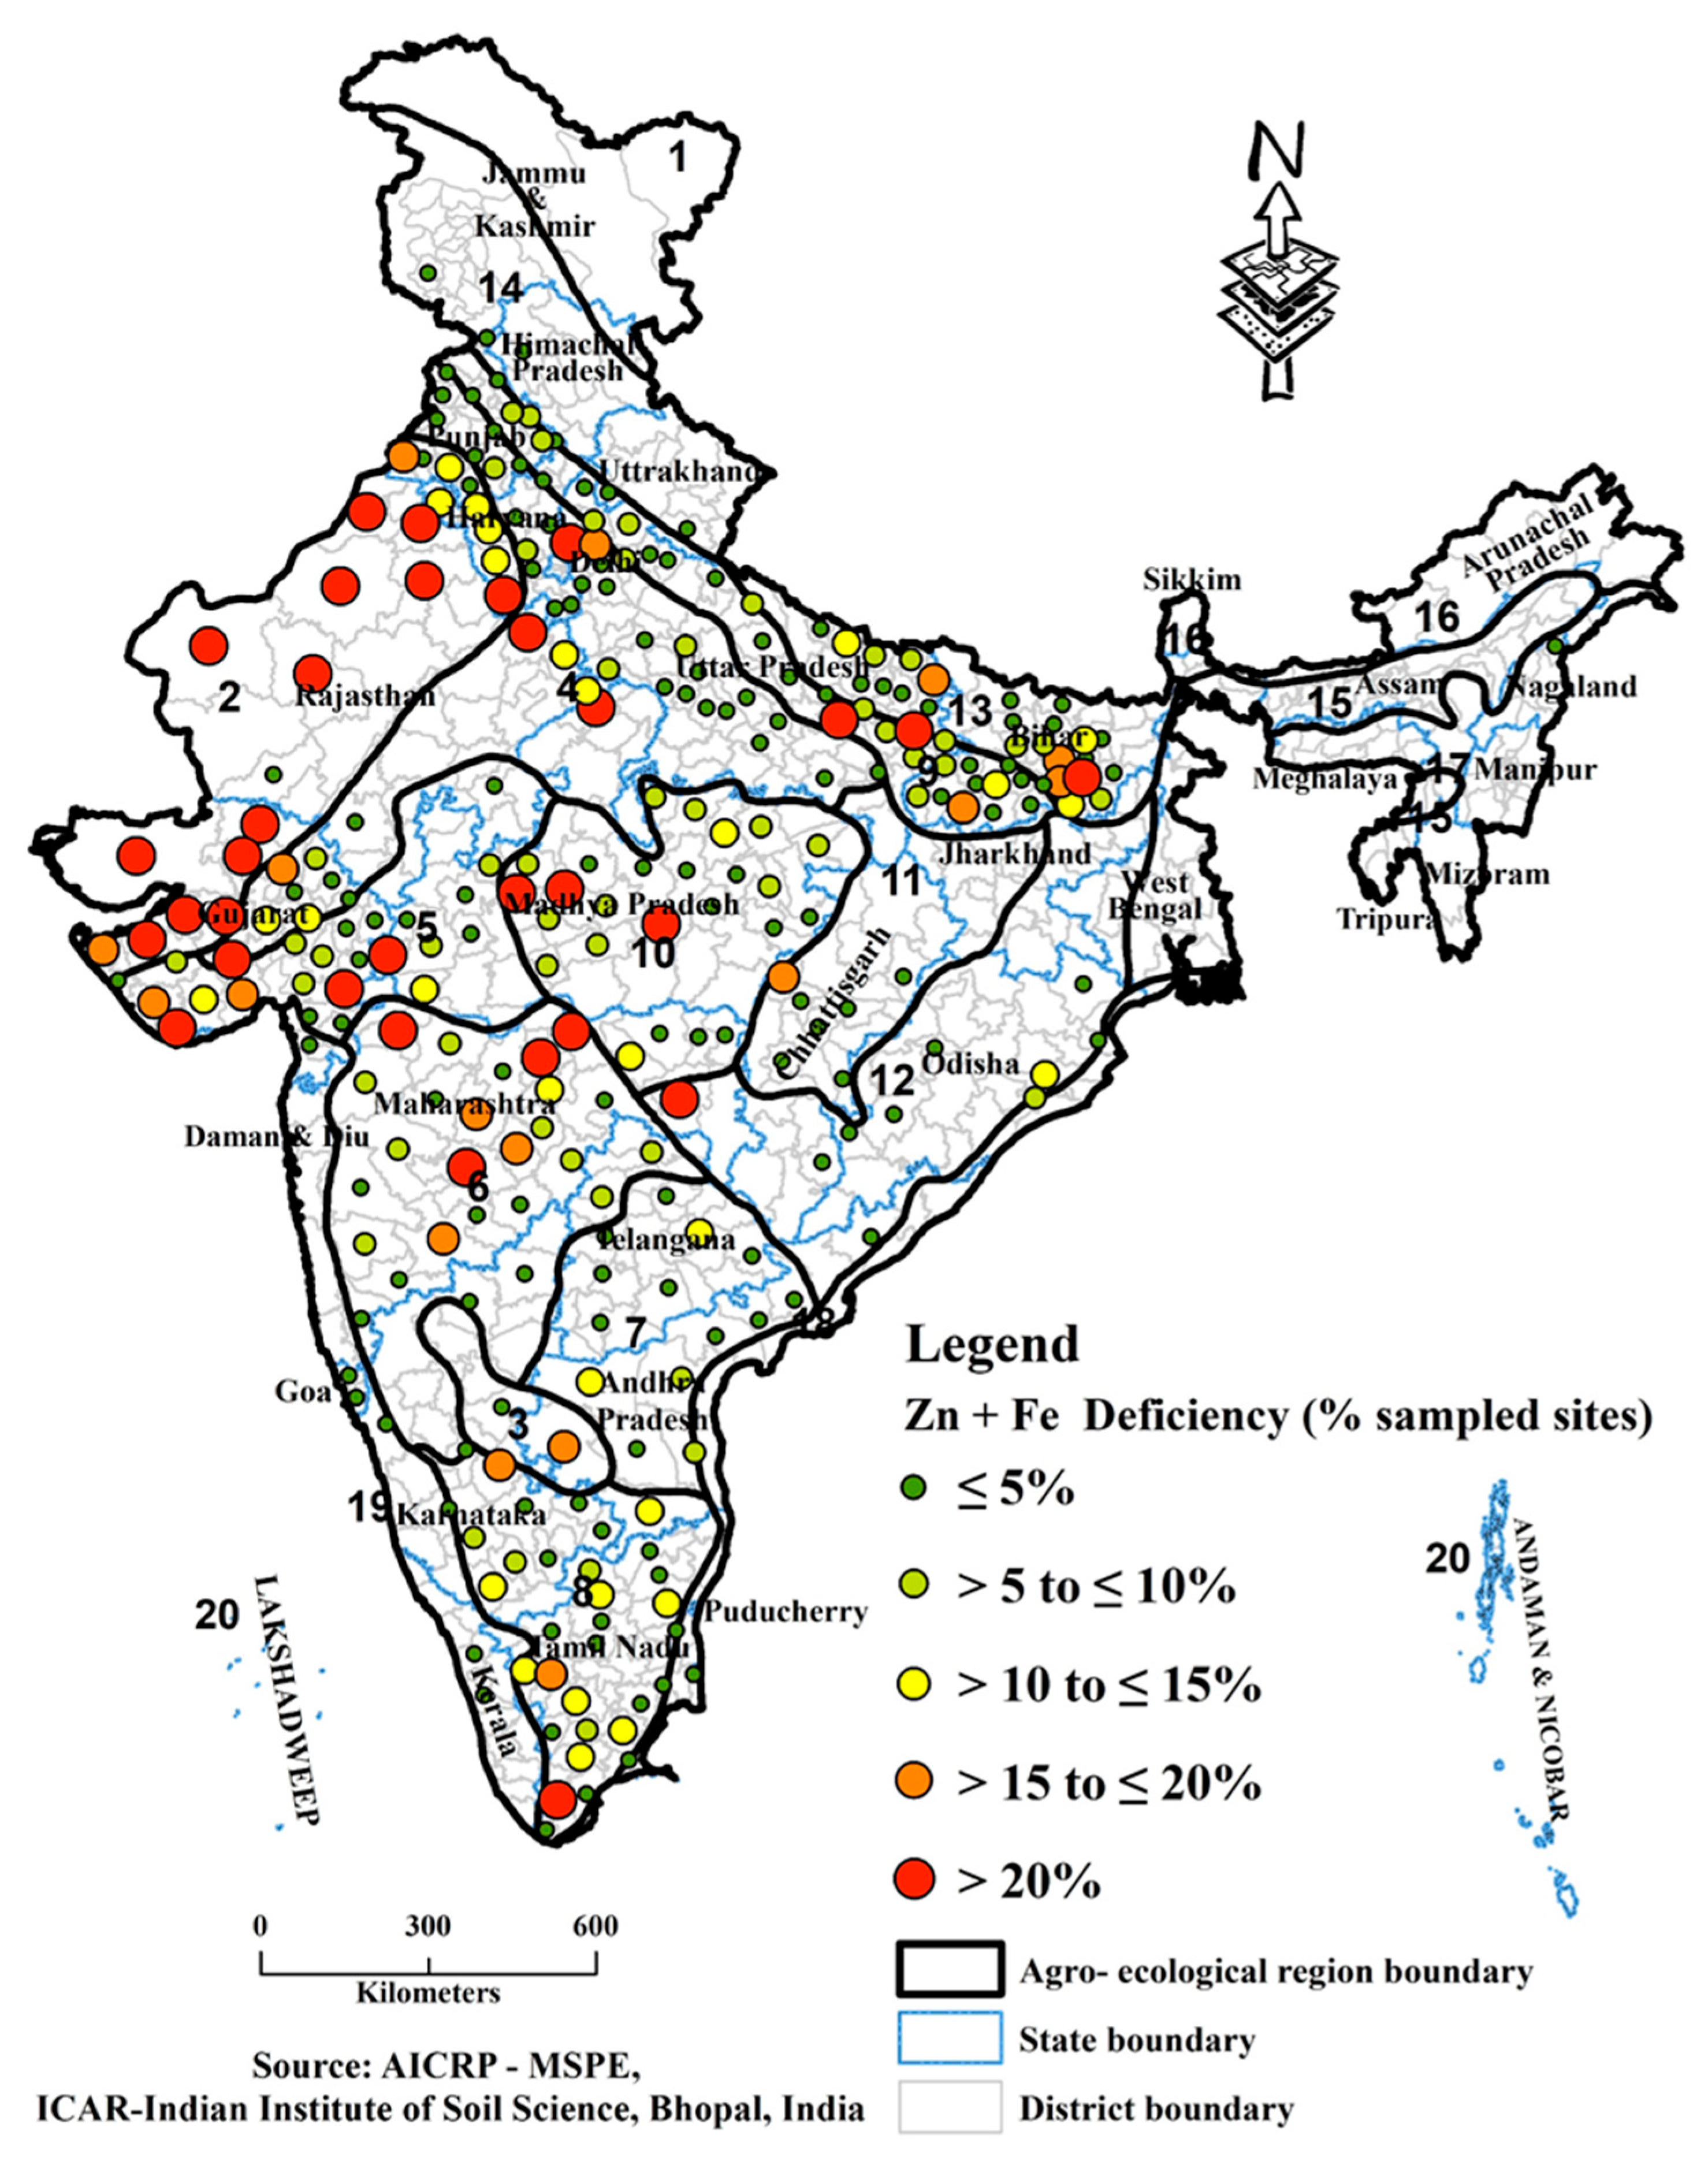
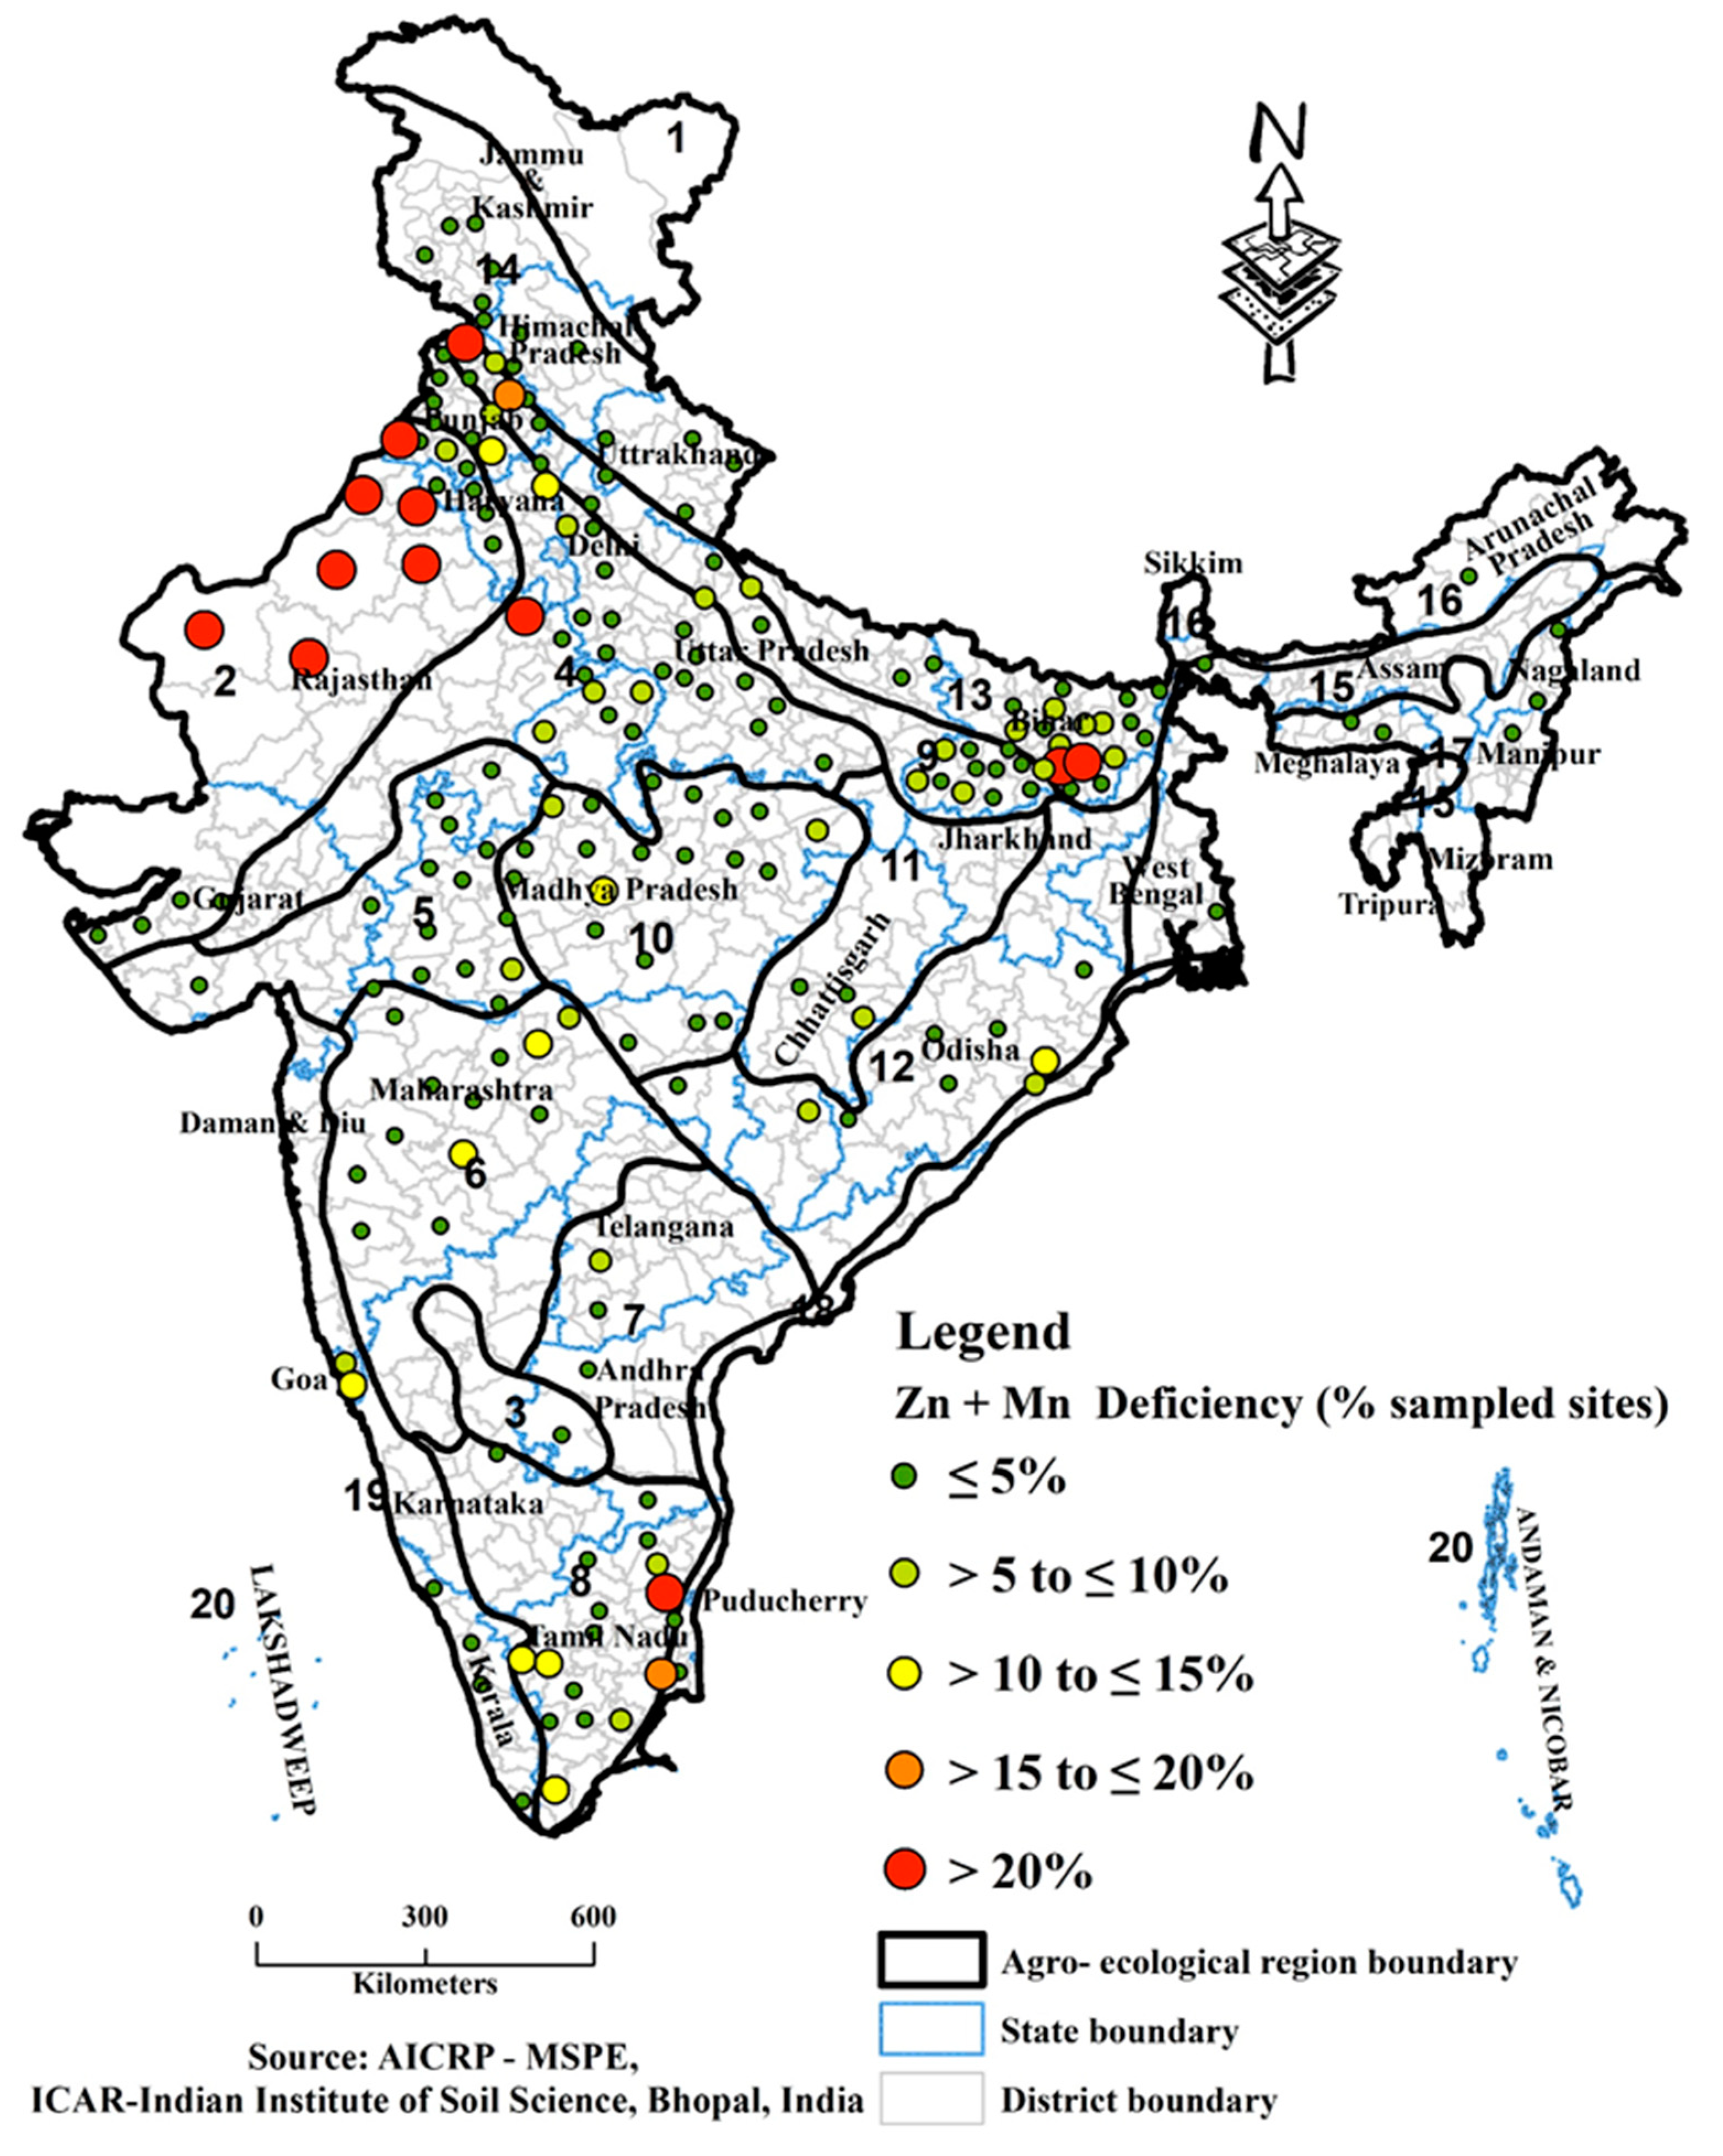
3.3. Distribution of Multi-Nutrient Deficiencies of S, Zn, B, Fe, Cu and Mn

Two or more nutrient deficiencies were recorded in 0.10–9.30% of soils (Figure 3). The mean deficiency of S + Zn was in 9.30% of the sampled sites (varying from 0.10–29.9% of the sampled sites for different states). It was predominantly prevalent in different districts of Bihar, Gujarat, Karnataka, Madhya Pradesh, Odisha, Rajasthan, Uttar Pradesh and Maharashtra (Figure 4). More than 20% of the sampled sites in 9 districts of Gujarat, 25 districts of Madhya Pradesh, 8 districts of Odisha and 10 districts of Rajasthan were deficient in S + Zn. The deficiency of Zn + B varied from 0.60–20.3% of the sampled sites in different states with a mean value of 8.70%. Its prevalence in states such as Bihar, Karnataka, Odisha and Tamil Nadu was higher (Figure 5).
More than 20% of the sampled sites in 16 districts of Bihar, 5 districts each of Karnataka and Telangana, 13 districts of Odisha and 7 districts of Tamil Nadu were deficient in Zn + B. The deficiency of S + B varied widely in different states with mean value of 7.00%. A relatively higher percentage of the sampled sites in Jharkhand, Karnataka, Kerala, Manipur, Odisha, Uttarakhand and West Bengal state were deficient in S + B (Figure 6). More than 20% of the sampled sites in 6 districts each of Jharkhand and Manipur, 9 districts each of Karnataka and Kerala, 14 districts of Odisha and 5 districts of Telangana were deficient in S + B. On average, 5.80% of the sampled sites were deficient in Zn + Fe. A relatively higher percentage of the sampled sites of Gujarat, Karnataka, Maharashtra and Rajasthan were deficient in Zn + Fe (Figure 7). More than 20% of the sampled sites in nine districts of Gujarat, five districts each of Madhya Pradesh and Maharashtra and seven districts of Rajasthan had Zn + Fe deficiency. A higher percentage of the sampled sites of Goa, Jammu and Kashmir and Rajasthan were deficient in Zn + Mn, with a national average of 3.4% (Figure 8). Deficiencies of S + Fe (Figure 9), Zn + Cu and Fe + B were recorded in 3.30%, 2.80% and 2.70% of the sampled sites, respectively, and were scattered across the country. Deficiencies of S + Fe was higher in Gujarat, Haryana, Rajasthan and Uttar Pradesh.
Three-nutrient deficiencies such as S + Zn + B, S + Zn + Fe and Zn + Fe + B were recorded in 2.60%, 1.70% and 1.20% of the sampled sites, respectively. A relatively higher percentage of the sampled sites in Bihar, Goa, Karnataka and Odisha were deficient in S + Zn + B. Moreover, S + Zn + Fe deficiency was more prevalent in soils of Gujarat, Haryana, Maharashtra and Rajasthan. A higher percentage of the sampled sites in Bihar and Karnataka were deficient in Zn + Fe + B. More than 20% of the sampled sites in one district each of Bihar, Chhattisgarh, Karnataka and Madhya Pradesh and five districts of Odisha were deficient in S + Zn + B. More than 20% of the sampled sites in one district each of Haryana, Karnataka, Maharashtra and Uttar Pradesh and two districts each of Madhya Pradesh and Rajasthan were deficient in S + Zn + Fe. More than three-nutrient deficiencies including Zn + Fe + Cu + Mn and Zn + Fe + Cu + Mn + B were less prevalent, recorded in only 0.30% and 0.10% of the sampled sites, respectively. Less than 5% of the sampled sites in 13 districts of Bihar, 7 districts each of Punjab and Uttar Pradesh and 16 districts of Tamil Nadu were deficient in Zn + Fe + Cu + Mn. Meanwhile, less than 5% of the sampled sites in 13 districts of Bihar, 4 districts of Punjab and 10 districts of Tamil Nadu were deficient in Zn + Fe + Cu + Mn + B.

4. Discussion

Proper understanding of the status of available S and micronutrients and their deficiencies in different soils is very much essential for effective fertilizer management in different soil–crop situations. Furthermore, it is useful for the production and distribution of S and micronutrients-based fertilizers for different areas.

4.1. Concentration of Available S, Zn, B, Fe, Cu and Mn

The concentrations of available S, Zn, B, Fe, Cu and Mn in soils of India varied widely (with CV values of 111% to 338%) with a mean concentration of 27.0 ± 29.9 mg kg−1 for available S, 1.40 ± 1.60 mg kg−1 for available Zn, 1.40 ± 4.70 mg kg−1 for available B, 31.0 ± 52.2 mg kg−1 for available Fe, 2.30 ± 3.50 mg kg−1 for available Cu and 17.5 ± 21.4 mg kg−1 for available Mn (Table 3). This is in line with the finding of Scherer [30], who reported wide variations in available S concentrations in soils of different parts of the world. Mathew et al. [31] also reported the mean concentration of available Zn 2.80 ± 0.2 mg kg−1, available Fe 130 ± 6.90 mg kg−1, available Mn 193 ± 20.5 mg kg−1, available B 0.68 ± 1.10 mg kg−1 and available Cu 8.40 ± 0.80 mg kg−1 in surface soils of Mount Kilimanjaro’s slopes in Tanzania. Silva et al. [32] reported the mean concentration of available Fe 66.6 ± 56.0 mg kg−1, available Mn 12.2 ± 14.4 mg kg−1, available Zn 2.30 ± 1.30 mg kg−1 and available Cu 1.10 ± 0.80 mg kg−1 in surface soils of sugarcane-producing regions of Brazil. The variations in available S and micronutrients in soils is attributed to soil factors, plant factors and soil–crop management practices [15,30,33,34]. Furthermore, presence of organic matter, plant residues and S-containing salts contribute towards variations in available S concentration in soils [35]. The available concentrations of S and micronutrients in soils depend more on the level of weathering of rocks [15]. The highly weathered tropical soils have the lowest S and micronutrient concentrations. Soil factors, namely pH, soil organic matter, redox potential, biological activity, clay content and cation exchange capacity, and anthropogenic activities predominantly influence soil properties and micronutrient availability [17,36]. Moreover, plant factors such as type and nature of plant, rooting morphology, root secretions and plant–microbe associations influence micronutrient availability [37,38].

4.2. Distribution of Single Nutrient Deficiencies of S, Zn, B, Fe, Cu and Mn

About 40.8% and 17.8% of the sampled sites were deficient (acute deficient + deficient) and latently deficient in available S, respectively (Figure 2). The extent of S deficiency was different in districts of various states of India. More than 50% of the sampled sites of a large number of districts in states including Gujarat, Madhya Pradesh, Manipur, Odisha and Rajasthan were deficient in available S. The variations in S deficiency in soils of different parts of the country is ascribed to growing of crops requiring S, and nil or insufficient application of S fertilizers. This highlights the fact that farmers need to pursue site-specific S management based on different soil–crop situations, as the extent of deficiency in soils and cop requirements varies. Corroborating our findings, several researchers reported crop responses to various doses of S application in different parts of India [16,39,40,41].
There were deficiencies (acute deficient + deficient) of available Zn, B, Fe, Cu and Mn in 36.5%, 23.2%, 12.8%, 4.20% and 7.10% of the sampled sites, respectively (Figure 2). Some soils also exhibited latent deficiency in these micronutrients. Alloway [12] also reported the deficiency of micronutrients in soils of different countries of the world. Like S deficiency, the extent of micronutrient deficiency varies in different districts of various states. The deficiency of Zn at various levels prevails in almost all states of the country. Most of the Zn deficiency is observed in soils with high pH, coarse textured, calcareous, low in organic carbon content and under intense cultivation. Like Zn deficiency, B deficiency also prevailed in different states of India. It is more prevalent in the leached sandy, highly calcareous, limed acid and lateritic soils. The extent of B deficiency was higher in eastern states of India, which is attributed to excess leaching in sandy loam soils and alluvial and loess deposits.
The deficiency of Fe was more prevalent in western states including Gujarat, Maharashtra and Rajasthan. It was also prevalent in soils of Bihar, Uttar Pradesh, Karnataka and Telangana. The deficiency of Fe in soils of these states is attributed to the higher soil pH and prevailing moisture stress conditions, which leads to conversion of ferrous (Fe2+) to ferric (Fe3+) form of Fe. Copper deficiency was present in the limited samples. More than 20% of sampled sites in 13 districts of Assam, Haryana, Odisha, Rajasthan and Tamil Nadu had Cu deficiency. The deficiency of Cu in these soils is because of sandy textured, calcareous and eluviated soils rich in organic matter. The extent of Mn deficiency was more prevalent in states including Bihar, Haryana, Jammu and Kashmir, Punjab, Rajasthan, Tamil Nadu, Telangana and Uttar Pradesh. The deficiency of Mn in soils is attributed to the presence of low total content of Mn, calcareous soil, heavily limed acid soil, coarse textured soils and low moisture content. Our findings regarding the prevalence of micronutrient deficiencies in soils of different states of India are corroborated by the reports of the crop responses to application of micronutrients [20,42,43]. Crop responses vary with soil–crop contexts. Therefore, the farmers need to apply micronutrient fertilizers based on the extent of deficiency in soils and crop demands under various soil–crop situations. Further, for enriching consumable agricultural produce with Zn and Fe, it is very much essential to maintain the sufficient levels of plant available Zn and Fe in soils or readily available pools of Zn and Fe in plant parts [18]. This could be achieved by supplying Zn and Fe fertilizers to the soils and plants based on Zn and Fe status in soil and crop requirements.

4.3. Distribution of Multi-Nutrient Deficiencies of S, Zn, B, Fe, Cu and Mn

Along with the single nutrient deficiency, deficiencies of two or more nutrients (S and micronutrients) were prevalent in different states. The average percent of samples showing multi-nutrient deficiencies followed the order: S + Zn > Zn + B > S + B > Zn + Fe > Zn + Mn > S + Fe > Zn + Cu > Fe + B > S + Zn + B > S + Zn + Fe > Zn + Fe + B > Zn + Fe + Cu + Mn > Zn + Fe + Cu + Mn + B. However, the extent of multi-nutrient deficiencies was different in various states and AERs. The states of Goa, Madhya Pradesh, Odisha and Rajasthan had S + Zn deficiency in >15% of sampled sites. The AER 5, 8, 9, 10 and 13 had higher percent of S + Zn deficiency. Similarly, the higher percentage of sampled sites of Bihar, Karnataka, Odisha and Tamil Nadu (of AER 5, 8, 12 and 13) had Zn + B deficiency. The percent deficiency of S + B was more in AER 5, 8, 9, 12 and 13. The higher percentage of sampled sites were deficient in Zn + Fe in AER 2, 5, 6 and 8. This spatial variability in the distribution of deficiencies is attributed to differences in prevailing climate parameters, soils, cultivated crops and adoption of different soil–crop management practices (Table 1 and Table 2). This warrants application of customized fertilizers according to the nutrient deficiencies in soils and crop requirements, in different districts, states and AERs, for better soil health, sustainable crop production and improved crop quality [44,45]. The information generated from this study could be utilized by the planners, policymakers and fertilizer industries in the production and supply of the right kind of S and micronutrients-based customized fertilizers for different districts, states and AERs of India. Presently, some customized grades of fertilizers are available for farmers [46] and there are some reports of crop responses to the application of customized fertilizers in India [47,48]. However, there is need for the development of S and micronutrients-based customized fertilizers for different districts of India considering S and micronutrient deficiencies and crop needs. This will help in a greater way for obtaining sustainable crop production, better crop quality and animal and human health.

5. Conclusions

The study revealed a wide variation in the concentrations of available S and micronutrients in agricultural soils of India. There were varied levels of deficiencies (acute deficient + deficient + latent deficient) for available S (58.6%), available Zn (51.2%), available B (44.7%), available Fe (19.2%), available Cu (1104%) and available Mn (17.4%). The distribution of single and multi-nutrient deficiencies of S and micronutrients in different districts, states and AERs of India was different. There is a need for S and micronutrient application based on the soil deficiency status in various districts, states and AERs of India, as well as crop requirements for sustainable crop production, enrichment of nutrients in crops and better animal and human health. Based on multi-nutrient deficiency, the right kind of S and micronutrients-based customized fertilizers may be developed and supplied for use in different regions of India. This type of study needs to be carried out periodically to obtain precise information pertaining to exact levels of S and micronutrient deficiencies to achieve strategic planning of balanced and site-specific nutrient management. Single and multi-nutrient deficiencies may be assessed in the agricultural soils of other parts of the world for efficient use of S and micronutrients in order to achieve food and nutritional security and better animal and human health.

Author Contributions

All authors contributed to the design of the study. A.K.S. (Arvind Kumar Shukla), S.K.B., S.D., A.G. and C.P. collected the samples, relevant data and conducted analysis. A.K.S. (Anil Kumar Singh) and S.K.B. wrote the first draft. A.K.S. (Arvind Kumar Shukla), S.K.B., A.K.P., C.S.R., S.D., A.G., S.K.C. and A.K.S. (Anil Kumar Singh) edited and revised the manuscript. All authors have agreed to the published version of the manuscript.

Funding

The study was funded by Indian Council of Agricultural Research, New Delhi.

Institutional Review Board Statement

Not applicable.

Informed Consent Statement

Not applicable.

Data Availability Statement

The data are available from the corresponding author upon reasonable request.

Acknowledgments

The authors thank the Indian Council of Agricultural Research, New Delhi, for supporting the study through All India Coordinated Research Project on Micro and Secondary Nutrients in Soils and Plants. The authors acknowledge their colleagues who extended logistic and technical support during the study.

Conflicts of Interest

The authors declare that they have no conflict of interest.

Animal Research

Not applicable.

Consent to Participate

The consent of all the participants of the study was obtained.

Consent for Publication

The consent for publication was obtained from all the participants of the study.

References

  1. Singh, B.; Schulze, D.G. Soil Minerals and Plant Nutrition. Nat. Educ. Knowl. 2015, 6, 1. [Google Scholar]
  2. Cogger, C.; Brown, S. Soil formation and nutrient cycling. In Sowing Seeds in the City; Brown, S., McIvor, K., Hodges, S.E., Eds.; Springer: Dordrecht, The Netherlands, 2016. [Google Scholar] [CrossRef]
  3. Chapin, F.S. Patterns of nutrient absorption and use by plants from natural and man-modified environments. In Disturbance and Ecosystems. Ecological Studies (Analysis and Synthesis); Mooney, H.A., Godron, M., Eds.; Springer: Berlin/Heidelberg, Germany, 1983. [Google Scholar] [CrossRef]
  4. Marschner, P. Marschner’s Mineral Nutrition of Higher Plants; Academic Press: Adelaide, Australia, 2012. [Google Scholar] [CrossRef]
  5. Bhatt, P.; Verma, A.; Verma, S.; Anwar, M.S.; Prasher, P.; Mudila, H.; Chen, S. Understanding phytomicrobiome: A potential reservoir for better crop management. Sustainability 2020, 12, 5446. [Google Scholar] [CrossRef]
  6. Fendrihan, S.; Pop, C.E. Biotechnological potential of associated microorganism. Rom. Biotechnol. Lett. 2021, 26, 2700–2706. [Google Scholar] [CrossRef]
  7. Brevik, E.C.; Slaughter, L.; Singh, B.R.; Steffan, J.J.; Collier, D.; Barnhart, P.; Pereira, P. Soil and human health: Current status and future needs. Air Soil Water Res. 2020, 13, 1–23. [Google Scholar] [CrossRef]
  8. White, P.J.; Brown, P.H. Plant nutrition for sustainable development and global health. Annals Bot. 2010, 105, 1073–1080. [Google Scholar] [CrossRef] [PubMed] [Green Version]
  9. Shukla, A.K.; Behera, S.K.; Pakhre, A.; Chaudhari, S.K. Micronutrients in soils, plants, animals and humans. Indian J. Fert. 2018, 14, 30–54. [Google Scholar]
  10. Khurana, M.P.S.; Sadana, U.S. Bijay-Singh. Sulfur nutrition of crops in the Indo-Gangetic plains of south Asia. In Sulfur: A Missing Link between Soils, Crops, and Nutrition; Jez, J., Ed.; American Society of Agronomy: Madison, WI, USA, 2008; pp. 11–24. [Google Scholar] [CrossRef]
  11. Piotrowska-Dlugosz, A.; Siwik-Ziomek, A.; Dlugosz, J.; Gozdowski, D. Spatio-temporal variability of soil sulfur content and arylsulfatase activity at a conventionally managed arable field. Geoderma 2017, 295, 107–118. [Google Scholar] [CrossRef]
  12. Alloway, B.J. Micronutrient Deficiencies in Global Crop Production; Springer: Dordrecht, The Netherlands, 2008. [Google Scholar] [CrossRef]
  13. Shukla, A.K.; Behera, S.K.; Satyanarayana, T.; Majumdar, K. Importance of micronutrients in Indian agriculture. Better Crops South Asia 2019, 11, 6–10. [Google Scholar]
  14. Kihara, J.; Bolo, P.; Kinyua, M.; Rurinda, J.; Pikki, K. Micronutrient deficiencies in African soils and the human nutritional nexus: Opportunities with staple crops. Environ. Geochem. Health 2020, 42, 3015–3033. [Google Scholar] [CrossRef] [PubMed] [Green Version]
  15. Fageria, N.K.; Baligar, V.C.; Clark, R.B. Micronutrients in crop production. Adv. Agron. 2002, 77, 185–250. [Google Scholar] [CrossRef]
  16. Shukla, A.K.; Behera, S.K. All India research project on micro- and secondary nutrients and pollutant elements in soils and plants: Research achievements and future thrusts. Indian J. Fert. 2019, 15, 522–543. [Google Scholar]
  17. Manzeke, G.M.; Mtambanengwe, F.; Watts, M.J.; Hamilton, E.M.; Lark, R.M.; Broadley, M.R.; Mapfumo, P. Fertilizer management and soil type influence grain zinc and iron concentration under contrasting smallholder cropping systems in Zimbabwe. Sci. Rep. 2019, 9, 6445. [Google Scholar] [CrossRef]
  18. Shukla, A.K.; Behera, S.K. Biofortification for overcoming zinc and iron malnutrition in Indian population: Current research status and way forward. Indian J. Fert. 2020, 16, 1262–1276. [Google Scholar]
  19. Shah, F.; Wu, W. Soil and crop management strategies to ensure higher crop productivity within sustainable environments. Sustainability 2019, 11, 1485. [Google Scholar] [CrossRef] [Green Version]
  20. Shukla, A.K.; Behera, S.K.; Singh, V.K.; Prakash, C.; Sachan, A.K.; Dhaliwal, S.S.; Srivastava, P.C.; Pachauri, S.P.; Tripathi, A.; Pathak, J.; et al. Pre-monsoon spatial distribution of available micronutrients and sulphur in surface soils and their management zones in Indian Indo-Gangetic Plain. PLoS ONE 2020, 15, e0234053. [Google Scholar] [CrossRef]
  21. Steffan, J.J.; Brevik, E.C.; Burgess, L.C.; Cerda, A. The effect of soil on human health: An overview. Eur. J. Soil Sci. 2018, 69, 159–171. [Google Scholar] [CrossRef] [PubMed] [Green Version]
  22. Behera, S.K.; Shukla, A.K.; Prakash, C.; Tripathi, A.; Kumar, A.; Trivedi, V. Establishing management zones of soil sulphur and micronutrients for sustainable crop production. Land Degrad. Dev. 2021, 32, 3614–3625. [Google Scholar] [CrossRef]
  23. Soil Survey Staff. Keys to Soil Taxonomy; USDA-Natural Resources Conservation Service: Washington, DC, USA, 2014.
  24. NBSSLUP. National Bureau of Soil Survey and Land Use Planning. 2021. Available online: https://www.nbsslup.in/assets/uploads/clinks/Delineating%20Agro-Ecological%20Regions.pdf (accessed on 15 July 2021).
  25. Gelfand, A.E.; Schliep, E.M. Spatial statistics and Gaussian processes: A beautiful marriage. Spatial Stat. 2016, 18, 86–104. [Google Scholar] [CrossRef]
  26. Williams, C.H.; Steinbergs, A. Soil sulphur fractions as chemical indices of available sulphur in some Australian soils. Aust. J. Agril. Res. 1959, 10, 340–352. [Google Scholar] [CrossRef]
  27. Lindsay, W.L.; Norvell, W.A. Development of a DTPA soil test for zinc, iron, manganese and copper. Soil Sci. Soc. Am. J. 1978, 42, 421–448. [Google Scholar] [CrossRef]
  28. Gupta, U.C. A simplified method for determining hot-water soluble boron in podzol soils. Soil Sci. 1967, 103, 424–428. [Google Scholar] [CrossRef]
  29. SAS Institute. The SAS System for Windows. Release 9.2; SAS Institute: Cary, NC, USA, 2011. [Google Scholar]
  30. Scherer, H.W. Sulfur in soils. J. Plant Nutr. Soil Sci. 2009, 172, 326–335. [Google Scholar] [CrossRef]
  31. Mathew, M.M.; Majule, A.E.; Marchant, R.; Sinclair, F. Variability of soil micronutrients concentration along the slopes of Mount Kilimanjaro, Tanzania. Appl. Env. Soil Sci. 2016, 9814316. [Google Scholar] [CrossRef] [Green Version]
  32. Silva, R.C.F.; Silva, F.B.V.; Biondi, C.M.; Nascimento, C.W.A.; Oliveira, E.C.A. Assessing the content of micronutrients in soils and sugarcane in different pedogeological contexts of northeastern Brazil. Rev. Bras. Ciencia Solo 2019, 43, e0180228. [Google Scholar] [CrossRef] [Green Version]
  33. White, J.G.; Zasoski, R.J. Mapping soil micronutrients. Field Crops Res. 1999, 60, 11–26. [Google Scholar] [CrossRef]
  34. Rengel, Z. Availability of Mn, Zn and Fe in the rhizosphere. J. Soil Sci. Plant Nutr. 2015, 15, 397–409. [Google Scholar] [CrossRef] [Green Version]
  35. Jez, J. Availability of sulfur to crops from soil and other sources. In Sulfur: A Missing Link between Soils, Crops, and Nutrition; Jez, J. American Society of Agronomy: Madison, WI, USA, 2008; pp. 59–82. [Google Scholar] [CrossRef]
  36. Bungau, S.; Behl, T.; Aleya, L.; Bourgeade, P.; Aloui-Soss, B.; Purza, A.L.; Abid, A.; Samuel, A.D. Expatiating the impact of anthropogenic aspects and climatic factors on long-term soil monitoring and management. Environ. Sci. Pollut. Res. 2021, 28, 30528–30550. [Google Scholar] [CrossRef]
  37. Samuel, A.D.; Bungau, S.; Tit, D.M.; Melinte, C.E.; Purza, L.; Bad, G.E. Effects of long-term application of organic and mineral fertilizers on soil enzymes. Rev. Chim. 2018, 69, 2608–2612. [Google Scholar] [CrossRef]
  38. Samuel, A.D.; Bungau, S.; Fodor, I.K.; Tit, D.M.; Blidar, C.F.; David, T.; Melinte, C.E. Effects of liming and fertilization on the dehydrogenase and catalase activities. Rev. Chim. 2019, 70, 3464–3468. [Google Scholar] [CrossRef]
  39. Singh, M.V.; Behera, S.K. All India Coordinated Research Project of Micro- and Secondary Nutrients and Pollutant Elements in Soils and Plants—A Profile; Research Bulletin No. 10; All India Coordinated Research Project of Micro- and Secondary Nutrients and Pollutant Elements in Soils and Plants; Indian Institute of Soil Science: Bhopal, India, 2011; pp. 1–57. [Google Scholar]
  40. Aulakh, M.S. Crop responses to sulphur nutrition. In Sulphur in Plants; Abrol, Y.P., Ahmad, A., Eds.; Springer: Dordrecht, The Netherlands, 2003. [Google Scholar] [CrossRef]
  41. Singh, V.K.; Dwivedi, B.S.; Shukla, A.K.; Kumar, V.; Gangwar, B.; Rani, M.; Singh, S.K.; Mishra, R.P. Status of available sulfur in soils of north-western Indo-Gangetic plain and western Himalayan region and responses of rice and wheat to applied sulfur in farmer’s fields. Agri. Res. 2015, 4, 76–92. [Google Scholar] [CrossRef]
  42. Takkar, P.N.; Chhibba, I.M.; Mehta, S.K. Twenty Years of Coordinated Research on Micronutrients in Soils and Plants; Indian Institute of Soil Science: Bhopal, India, 1989. [Google Scholar]
  43. Shukla, A.K.; Behera, S.K. Micronutrient fertilizers for higher productivity. Indian J. Fert. 2012, 8, 100–117. [Google Scholar]
  44. Tiwari, K.N. Relevance of customized fertilizers in the era of multi-nutrient deficiency. Indian J. Fert. 2010, 6, 76–86. [Google Scholar]
  45. Majumdar, S.; Prakash, N.B. Prospects of customized fertilizers in Indian agriculture. Curr. Sci. 2018, 115, 242–248. [Google Scholar] [CrossRef]
  46. FAI. Speciality Fertilizers and Micronutrient Statistics 2019–2020; The Fertilizer Association of India: New Delhi, India, 2020. [Google Scholar]
  47. Dwivedi, S.K.; Meshram, M.R. Effect of customized fertilizer on productivity and nutrient uptake of rice (Oryza sativa). Indian J. Agron. 2014, 59, 247–250. [Google Scholar]
  48. Mudalagiriyappa, B.; Raghavendra Goud, B.; Ramachandrappa, B.K.; Nanjappa, H.V. Influence of customized fertilizers on growth and yield of Finger Millet {Eleusine coracana (L.) Gaertn.} in Alfisols of southern India. Indian J. Dryland Agri. Res. Dev. 2015, 30, 50–54. [Google Scholar] [CrossRef]
Figure 1. Mean concentration of available S and micronutrients in agricultural soils of India. Error bars indicate stand error of the means.
Sustainability 13 09136 g001
Figure 2. Mean deficiency of available S and micronutrients in agricultural soils of India. Error bars indicate stand error of the means.
Sustainability 13 09136 g002
Figure 3. Mean deficiency of two or more nutrients (S and micronutrients) in soils of different states of India. Error bars indicate stand error of the means.
Sustainability 13 09136 g003
Figure 4. Distribution of S + Zn deficiency in soils (% of sampled sites) of different parts of India. Number denotes agro-ecological regions.
Sustainability 13 09136 g004
Figure 5. Distribution of Zn + B deficiency in soils (% of sampled sites) of different parts of India. Number denotes agro-ecological regions.
Sustainability 13 09136 g005
Figure 6. Distribution of S + B deficiency in soils (% of sampled sites) of different parts of India. Number denotes agro-ecological regions.
Sustainability 13 09136 g006
Figure 7. Distribution of Zn + Fe deficiency in soils (% of sampled sites) of different parts of India. Number denotes agro-ecological regions.
Sustainability 13 09136 g007
Figure 8. Distribution of Zn + Mn deficiency in soils (% of sampled sites) of different parts of India. Number denotes agro-ecological regions.
Sustainability 13 09136 g008
Figure 9. Distribution of S+ Fe deficiency in soils (% of sampled sites) of different parts of India. Number denotes agro-ecological regions.
Sustainability 13 09136 g009
Table 1. Different agro-ecological regions of India with climate parameters.
Serial No. of Agro-Ecological RegionName of Agro-Ecological RegionClimate Parameters
1Cold arid eco-region with shallow skeletal soilsIt experiences mild summer, harsh winter and receives mean annual rainfall of <150 mm.
2Hot arid eco-region with desert and saline soilsIt experiences hot summer and cool winter and receives mean annual rainfall of <400 mm.
3Hot arid eco-region with red and black soilsIt experiences hot and dry summer, mild winter and receives mean annual rainfall of 400–500 mm.
4Hot semi-arid eco-region with alluvium derived soilsIt experiences hot and dry summer, cool winter and receives mean annual rainfall of 500–1000 mm.
5Hot semi-arid eco-region with medium and deep black soilsIt experiences hot and wet summer, dry winter and receives mean annual rainfall of 500–1000 mm.
6Hot semi-arid eco-region with shallow and medium (dominant) black soilsIt experiences hot and humid summer, mild and dry winter and receives mean annual rainfall of 600–1000 mm.
7Hot semi-arid eco-region with red and black soilsIt experiences hot and dry summer, mild and dry winter and receives mean annual rainfall of 600–1100 mm.
8Hot semi-arid eco-region with red loamy soilsIt experiences hot and dry summer, mild winter and receives mean annual rainfall of 600–1000 mm.
9Hot sub-humid (dry) eco-region with alluvial-derived soilsIt experiences hot summer, cool winter and receives mean annual rainfall of 1000–1200 mm.
10Hot sub-humid eco-region with red and black soilsIt experiences hot summer, mild winter and receives mean annual rainfall of 1000–1500 mm.
11Hot sub-humid eco-region with red and yellow soilsIt experiences hot summer, cool winter and receives mean annual rainfall of 1200–1600 mm.
12Hot sub-humid eco-region with red and lateritic soilsIt experiences hot summer, cool winter and receives mean annual rainfall 1000–1600 mm.
13Hot sub-humid (moist) eco-region with alluvium-derived soilsIt experiences hot and wet summer, cool and dry winter and receives mean annual rainfall of 1400–1800 mm.
14Warm sub-humid to humid with inclusion of perhumid eco-region with brown forest and podzolic soilsIt experiences mild summer, cool winter and receives mean annual rainfall of 1000–2000 mm.
15Hot sub-humid (moist) to humid (inclusion of perhumid) eco-region with alluvium-derived soilsIt experiences hot summer, mild to moderately cool winter and receives mean annual rainfall of 1400–1600 mm.
16Warm sub-humid eco-region with brown and red hill soilsIt experiences warm summer, cool winter and receives mean annual rainfall of 2000 mm.
17Warm perhumid eco-region with red and lateritic soilsIt experiences warm summer, cool winter and receives mean annual rainfall of 2000–3000 mm.
18Hot sub-humid to semi-arid eco-region with coastal alluvium-derived soilsIt experiences semi-arid and sub-humid (moist) climate and receives mean annual rainfall of 900–1100 mm (west coast) and 1200–1600 mm (east coast).
19Hot humid perhumid eco-region with red, lateritic and alluvium-derived soilsIt experiences hot and humid summer, warm winter and receives mean annual rainfall of >2000 mm.
20Hot humid per-humid island eco-region with red loamy and sandy soilsIt experiences tropical climate and receives mean annual rainfall of 1600–3000 mm.
Table 2. Nature of soils and commonly cultivated crops in different agro-ecological regions of India.
Serial No. of Agro-Ecological RegionNature of SoilCommonly Cultivated Crops
1Soils are skeletal, calcareous and alkaline in reaction.Vegetables, millets, wheat, fodder, pulses and barley.
2Soils are sandy, moderately calcareous and alkaline in reaction.Pearl millet, fodder, pulses, cotton, sugarcane, mustard, wheat and gram.
3Soils are shallow, medium red soil with slightly acidic and noncalcareous nature. Soils are also deep, clayey black with slightly alkaline and calcareous nature.Pearl millet, groundnut, sugarcane, sunflower and cotton.
4Soils are deep, loamy and alluvium derived and clayey mixed red and black. Rice, millets, maize, pulses, berseem, wheat, mustard and sugarcane, jowar, pigeon pea, soybean, lentil and cotton.
5Soils are deep loamy to clayey black soil with slightly alkaline and calcareous nature with swell-shrink characters.Sorghum, pearl millet, pigeon pea, groundnut, soybean, maize, pulses, safflower, sunflower and wheat.
6Soils are shallow, loamy skeletal, clayey, calcareous and moderately alkaline in reaction.Sorghum, pearl millet, pigeon pea, safflower, sunflower, cotton and groundnut.
7Soils are red, non-calcareous and neutral in reaction, clayey and calcareous with alkaline in reaction.Sorghum, pigeon pea, rice, cotton, groundnut, sunflower, safflower, castor.
8Soils are non-calcareous and slightly acidic soil, and calcareous and moderately alkaline. Millets, pulses, groundnut, sorghum and sunflower.
9Soils are alluvium derived deep and loamy with neutral in reaction.Rice, maize, barley, pigeon pea, jute, wheat, lentil, mustard, cotton and sugarcane.
10Soils are deep black calcareous soil with slightly alkaline in reaction, moderately deep, clayey red with neutral to slightly acidic in reaction.Rice, wheat, sorghum, soybean, pigeon pea, gram, cotton and vegetables.
11Soils are deep, loamy, non-calcareous, red and yellow with neutral to slightly alkaline in reaction.Rice, wheat, millets, pigeon pea, green gram and black gram.
12Soils are fine loamy to clayey, non-calcareous red soil with slightly to moderately acidic in reaction.Rice, wheat, pulses and groundnut.
13Soils are deep, loamy, calcareous with moderately alkaline in reaction. Rice, maize, moong, pigeon pea, lentil, wheat, sesamum, groundnut, sugarcane, tobacco, turmeric, chilies, potato and coriander.
14Soils are shallow to deep brown forest and podzolic soil, fine loamy and neutral to mildly alkaline in reaction.Wheat, millet, maize, rice and apple.
15Soils are slight to strongly acidic.Rice, wheat, jute, tea, pineapple, citrus, banana, pulses, oilseed and sugarcane.
16Soils are shallow to moderately shallow, loamy brown forest soil with moderately acidic in reaction.Rice, maize, millet, potato, sweet potato, sesamum, pulses, cotton, mesta, sugarcane, pineapple, citrus, apple, pear, peach, banana and medicinal plants.
17Soils are shallow to very deep, loamy, red and lateritic, red and yellow with acidic in reaction.Rice, millets, maize, potato, tea, coffee, rubber, orange, pineapple, jute, mustard, black gram, green gram and lentil.
18Soils are clayey and slight to moderately sodic.Rice, coconut, black gram, lentil, sunflower and groundnut.
19Soils are deep, clayey red, lateritic, alluvium derived and strongly to moderately acidic in reaction.Rice, tapioca, coconut and spices.
20Soils are medium to very deep red-loamy, marine-derived, calcareous sandy with slightly to strongly acidic in reaction.Rice, coconut, arecanut, oil palm, tapioca and pepper.
Table 3. Descriptive statistics of available sulfur and micronutrients in soils the India (n = 242827).
NutrientsMinimumMaximumMeanSDCV (%)SkewnessKurtosis
S (mg kg−1)0.0282227.029.91114.2835.6
Zn (mg kg−1)0.0159.81.401.601187.35118
B (mg kg−1)0.011091.404.7033812.8189
Fe (mg kg−1)0.0196431.052.21685.5347.3
Cu (mg kg−1)0.0199.22.303.5015310.8186
Mn (mg kg−1)0.0148317.521.41225.7259.7
Note: S = available sulfur, Zn = available zinc, B = available boron, Fe = available iron, Cu = available copper, Mn = available manganese, SD = standard deviation, CV = coefficient of variation.
Publisher’s Note: MDPI stays neutral with regard to jurisdictional claims in published maps and institutional affiliations.

