
To Purchase or Not to Purchase? Drivers of Consumers’ Preferences for Animal Welfare in Their Meat Choice

Abstract
:1. Introduction
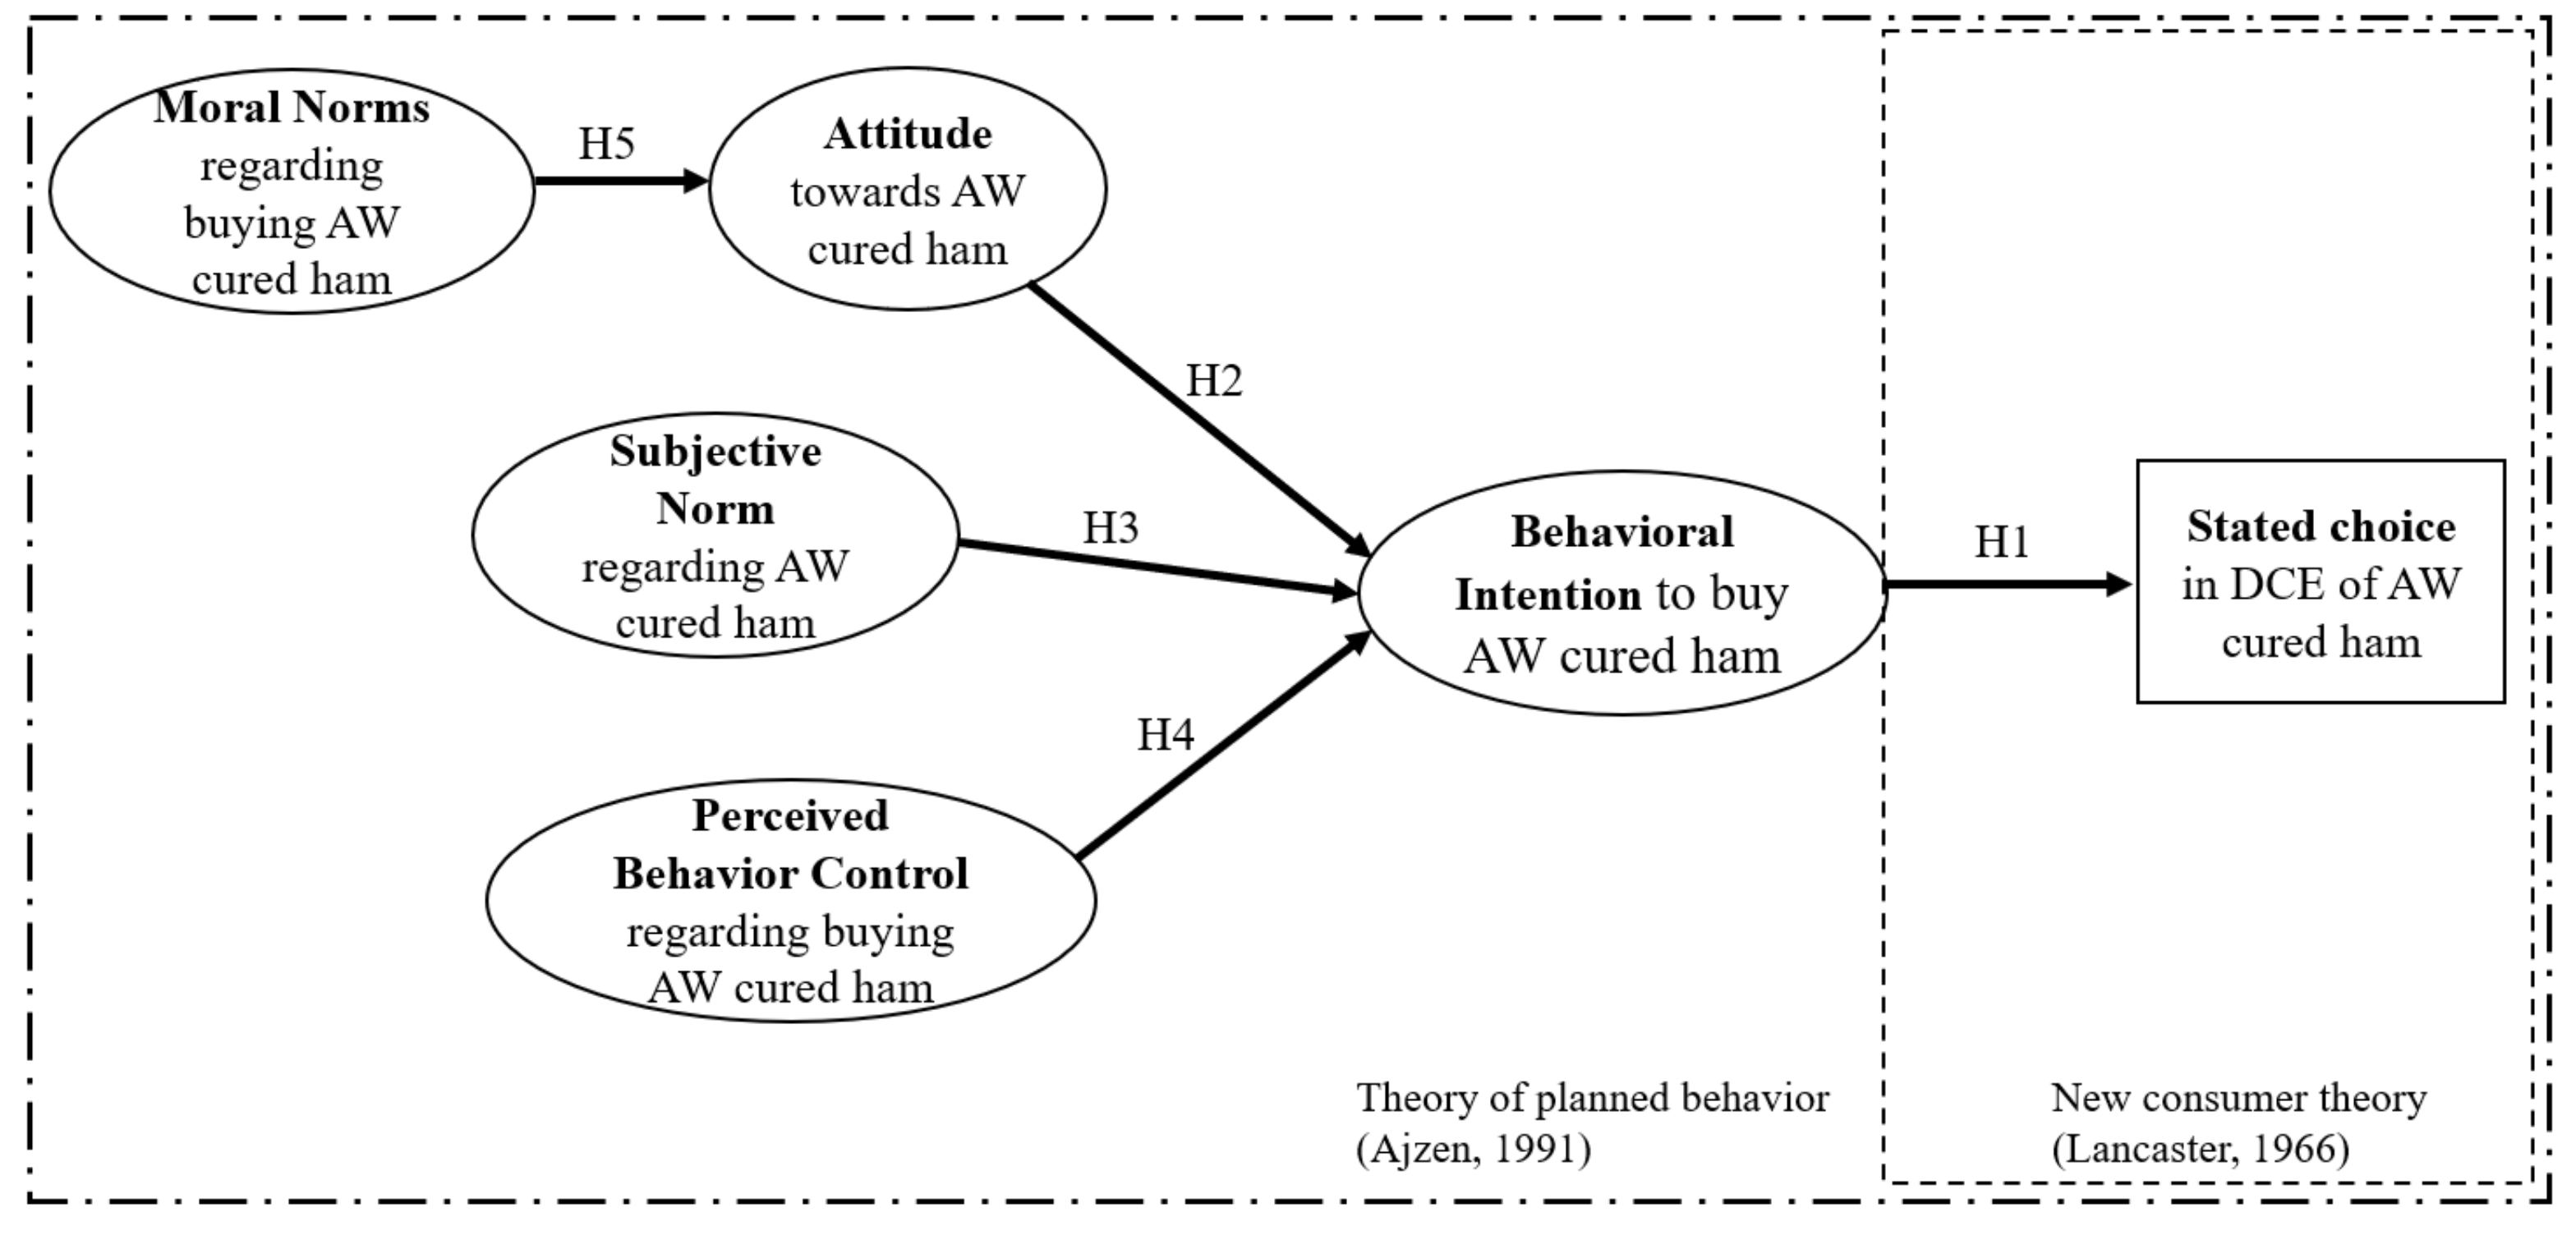
2. Theory Framework and Research Hypotheses
3. Methodology, Data and Analysis
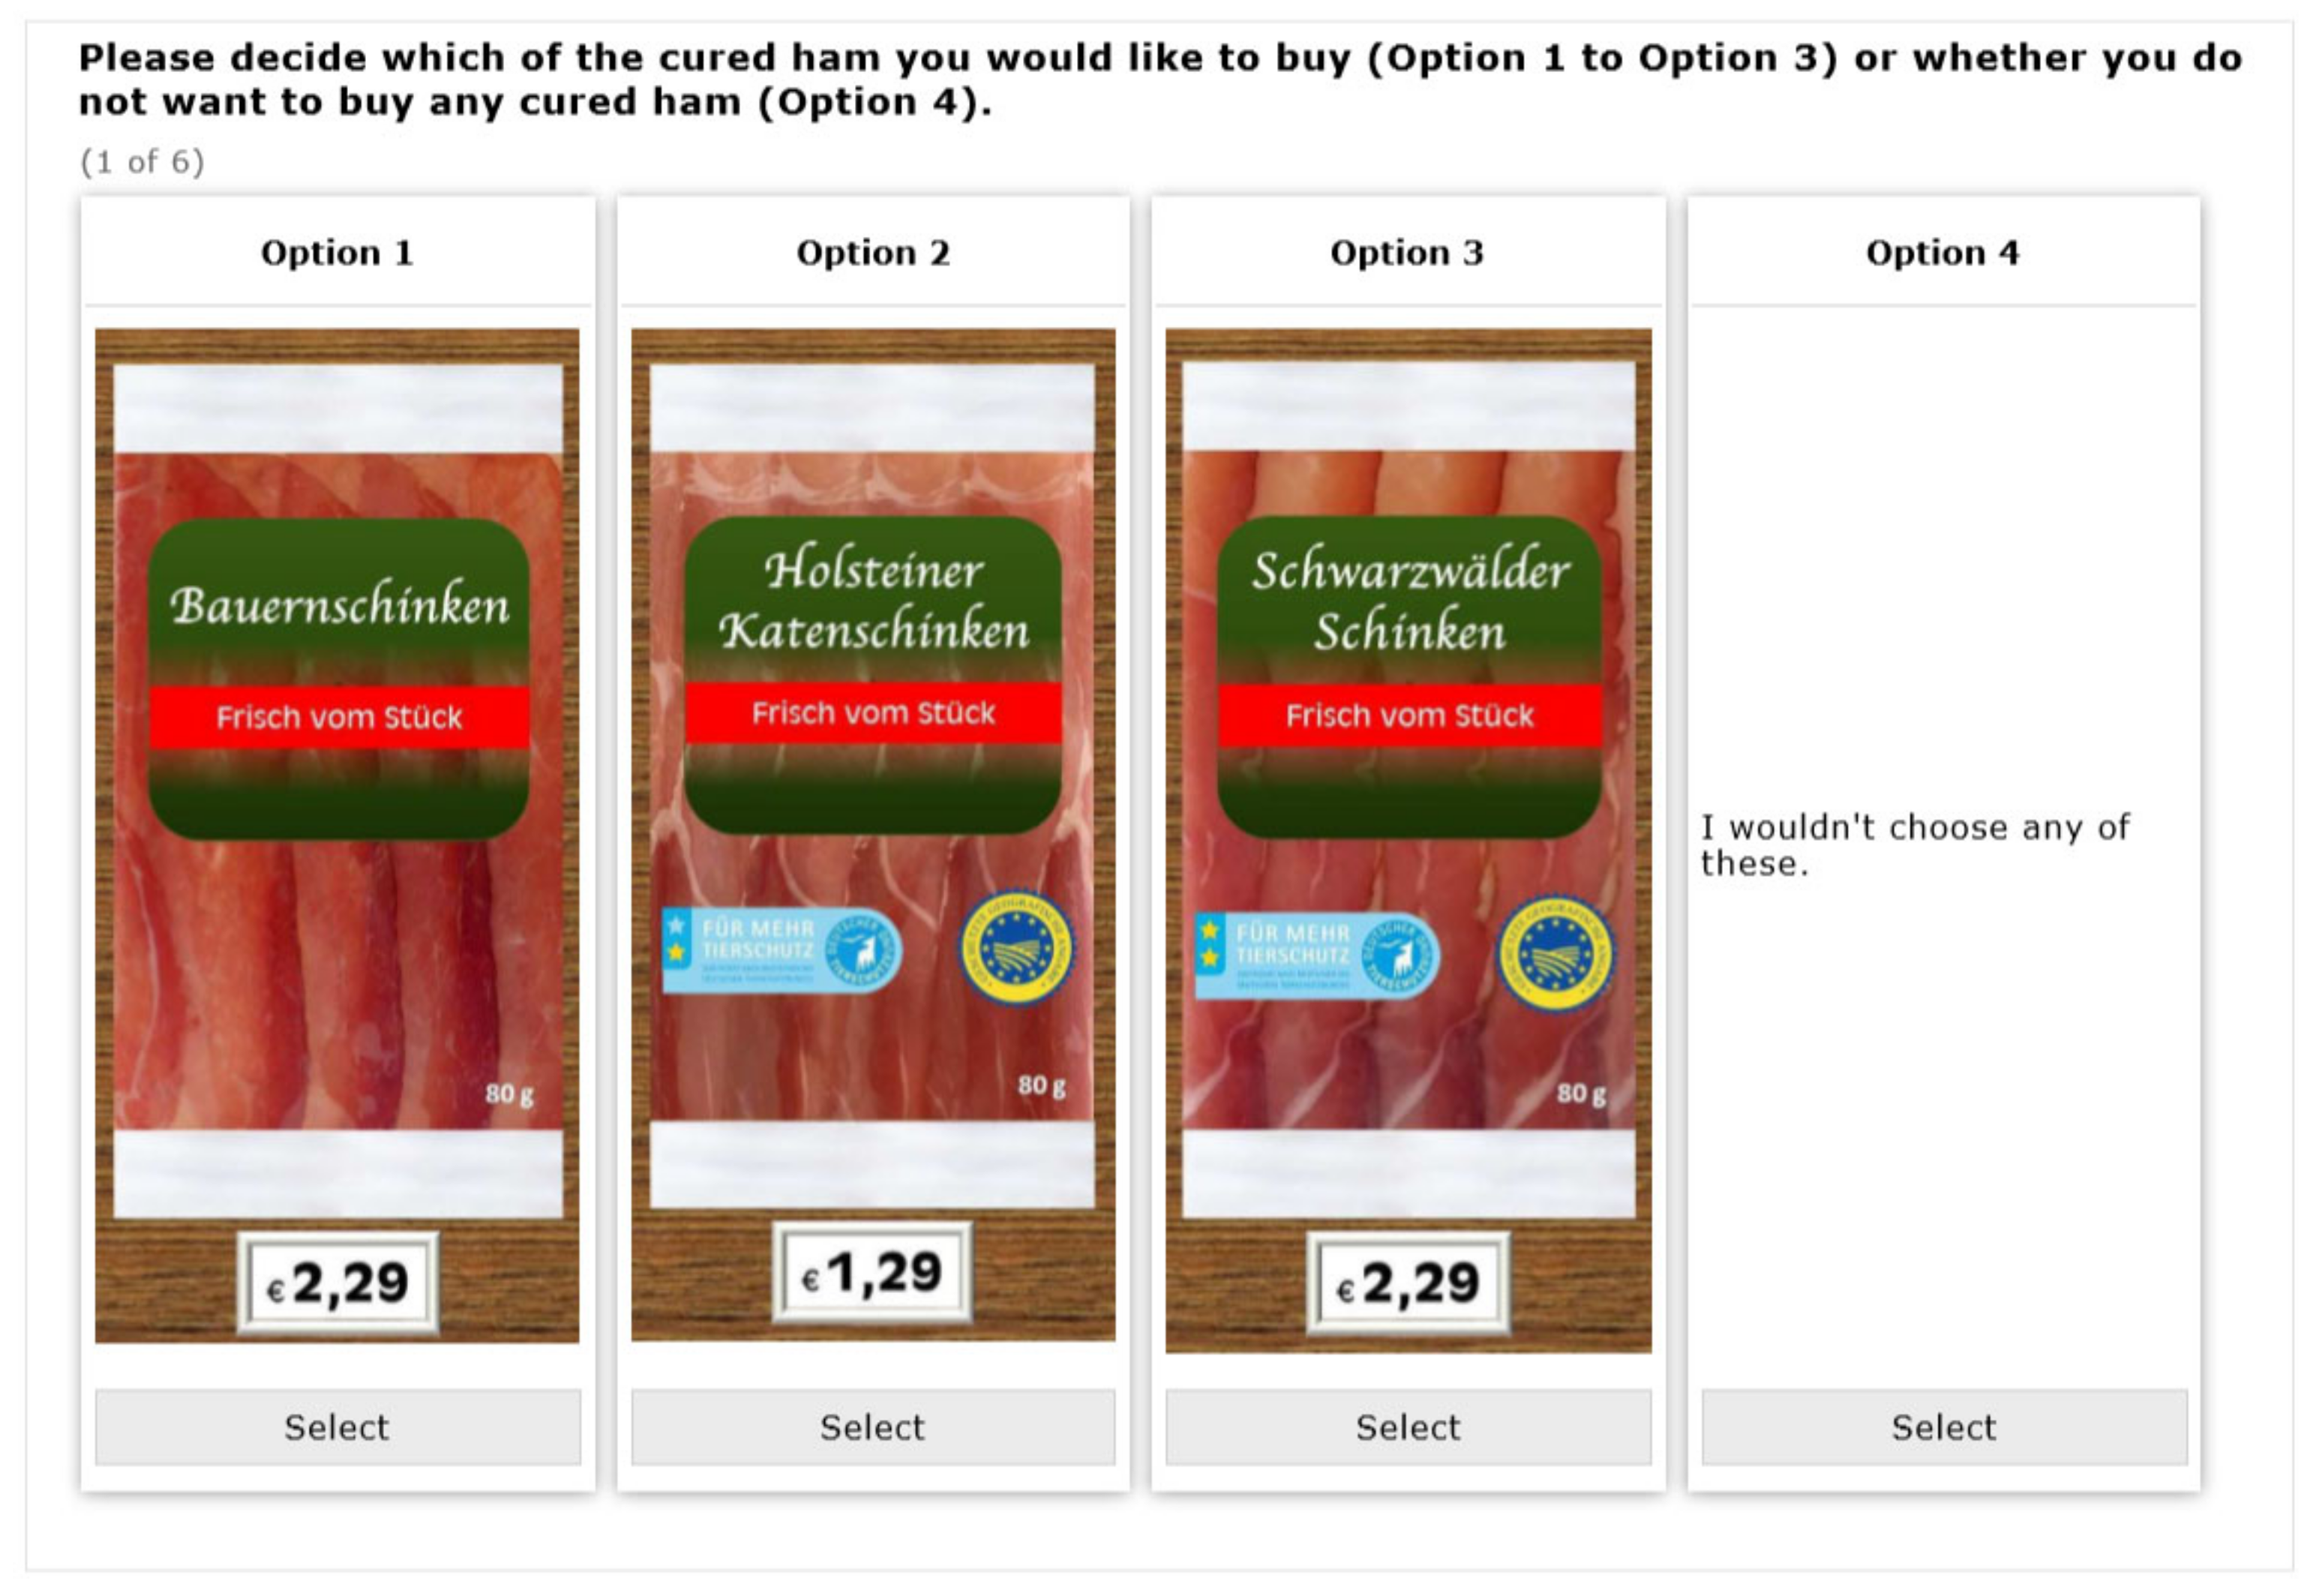
3.1. Choice Experimental Design
3.2. Definition of Measurement System of the LVM
3.3. Sampling and Data Collection
3.4. Data Analysis
4. Results
5. Discussion
6. Conclusions
Author Contributions
Funding
Institutional Review Board Statement
Informed Consent Statement
Data Availability Statement
Acknowledgments
Conflicts of Interest
Appendix A

| Für Mehr Tierschutz 2-Star | Für Mehr Tierschutz 1-Star | Legal Requirements | |
|---|---|---|---|
| Stock size | Maximum of 3000 fattening places | Maximum of 3000 fattening places | No requirements |
| Outdoor climate | Outdoor access | Access to different climate zones | No requirements |
| Stocking density (Pigs with a weight 50–110 kg) | 1.5 m2/animal | 1.1 m2/animal New enterprises 1.3 m2/animal | 0.75 m2/animal |
| Castration of male piglets | With anaesthesia and analgesia | With anaesthesia and analgesia | Castration without anaesthesia is legally prohibited since 1 January 2021 |
| Tail docking | Not allowed | Not allowed (Exceptional cases one third of the tail can be docked) | Allowed |
| Resting | (Straw) bedding on solid lying surface | Bedding on solid lying surface | No requirements |
| Light | Direct contact due to outdoor access | Contact with daylight through translucent side panels of the stable | Translucent area in the stable —Complemented by lighting schemes when required |
| Manipulable materials | Long-stalk straw or similar material | Straw or similar organic material | No requirements |
| Slatted floor | Only permitted in the activity area, not in the resting area | Requirements for new enterprises with outdoor climate stables: Slatted floors prohibited in the resting area | No requirements |
| Thermal regulation | Choice between indoor and outdoor area. Additional cooling options (e.g., water spraying) have to be available | Cooling options (e.g., water spraying) have to be available | No detailed requirements |
| Transportation to slaughterhouses | Maximum 200 km, and 4 h (exceptions possible) | Maximum 200 km and 4 h (exceptions possible) | Maximum 8 h |
Appendix B
| Null Log-Likelihood = −3335.42 | ||||
|---|---|---|---|---|
| Number of Groups | Log-Likelihood | AIC | BIC | Chi-Square |
| 2 | −2530.57 | 5087.15 | 5162.36 | 1609.70 |
| 3 | −2371.02 | 4782.05 | 4897.76 | 1928.80 |
| 4 | −2289.93 | 4633.86 | 4790.08 | 2090.99 |
| 5 | −2247.43 | 4562.87 | 4759.58 | 2175.98 |
References
- Zukunfskommission Landwirtschaf. Zukunf Landwirtschaf. Eine gesamtgesellschafliche Aufgabe. Empfehlungen der Zukunfskommission Landwirtschaf; Zukunfskommission Landwirtschaf: Rangsdorf, Deutschland, 2021. [Google Scholar]
- HLPE. Sustainable Agricultural Development for Food Security and Nutrition: A Report by the High Level Panel of Experts on Food Security and Nutrition of the Committee on World Food Security; HLPE: Rome, Italy, 2016. [Google Scholar]
- Bennett, R.M.; Anderson, J.; Blaney, R.J. Moral intensity and willingness to pay concerning farm animal welfare issues and the implications for agricultural policy. J. Agric. Environ. Ethics 2002, 15, 187–202. [Google Scholar] [CrossRef]
- Hartmann, M.; Simons, J.; Dutta, K. Farm Animal Welfare: A Challenge for Markets and Policy. Agriculture and Food in the 21st Century–Economic, Environmental and Social Challenges; Peter Lang: Bern, Switzerland, 2014; pp. 37–59. [Google Scholar] [CrossRef]
- Heerwagen, L.R.; Mørkbak, M.R.; Denver, S.; Sandøe, P.; Christensen, T. The Role of Quality Labels in Market-Driven Animal Welfare. J. Agric. Environ. Ethics 2014, 28, 67–84. [Google Scholar] [CrossRef]
- European Commission. Attitudes of EU Citizens Towards Animal Welfare, Special Eurobarometer 270; European Commission: Brussels, Belgium, 2007. [Google Scholar]
- Bundesministerium für Ernährung und Landwirtschaft (BMEL). Nutztierstrategie Zukunftsfähige Tierhaltung in Deutschland. 2019. Available online: https://www.bmel.de/SharedDocs/Downloads/DE/Broschueren/Nutztierhaltungsstrategie.pdf;jsessionid=2875726C9E96C9471468447C60399545.live841?__blob=publicationFile&v=8 (accessed on 12 August 2021).
- European Commission. Attitudes of Europeans Towards Animal Welfare, Special Eurobarometer 442; European Commission: Brussels, Belgium, 2016. [Google Scholar]
- Gocsik, É.; Lansink, A.G.J.M.O.; Saatkamp, H.W. Mid-term financial impact of animal welfare improvements in Dutch broiler production. Poult. Sci. 2013, 92, 3314–3329. [Google Scholar] [CrossRef]
- Gocsik, É.; Saatkamp, H.W.; de Lauwere, C.C.; Oude Lansink, A.G.J.M. A Conceptual Approach for a Quantitative Economic Analysis of Farmers’ Decision-Making Regarding Animal Welfare. J. Agric. Environ. Ethics 2013, 27, 287–308. [Google Scholar] [CrossRef]
- Grethe, H. The Economics of Farm Animal Welfare. Annu. Rev. Resour. Econ. 2017, 9, 75–94. [Google Scholar] [CrossRef]
- Kompetenznetzwerk Nutztierhaltung. Empfehlungen des Kompetenznetzwerks Nutztierhaltung, Berlin 2020. 2020. Available online: https://www.bmel.de/SharedDocs/Downloads/DE/_Tiere/Nutztiere/200211-empfehlung-kompetenznetzwerk-nutztierhaltung.pdf;jsessionid=678E7E0F2B35B4EDF16BE6D4366E4077.live842?__blob=publicationFile&v=3 (accessed on 25 June 2021).
- Cornish, A.R.; Briley, D.; Wilson, B.J.; Raubenheimer, D.; Schlosberg, D.; McGreevy, P.D. The price of good welfare: Does informing consumers about what on-package labels mean for animal welfare influence their purchase intentions? Appetite 2020, 148, 104577. [Google Scholar] [CrossRef]
- Frey, U.J.; Pirscher, F. Willingness to pay and moral stance: The case of farm animal welfare in Germany. PLoS ONE 2018, 13, e0202193. [Google Scholar] [CrossRef] [PubMed] [Green Version]
- Garcez de Oliveira Padilha, L.; Malek, L.; Umberger, W.J. Sustainable Meat: Looking through the Eyes of Australian Consumers. Sustainability 2021, 13, 5398. [Google Scholar] [CrossRef]
- Uehleke, R.; Hüttel, S. The free-rider deficit in the demand for farm animal welfare-labelled meat. In European Review of Agricultural Economics; Oxford University Press: Oxford, UK, 2019; Volume 46, pp. 291–318. [Google Scholar]
- Latacz-Lohmann, U.; Schreiner, J.A. Assessing consumer and producer preferences for animal welfare using a common elicitation format. J. Agric. Econ. 2019, 70, 293–315. [Google Scholar] [CrossRef]
- Lagerkvist, C.J.; Hess, S. A meta-analysis of consumer willingness to pay for farm animal welfare. Eur. Rev. Agric. Econ. 2010, 38, 55–78. [Google Scholar] [CrossRef]
- Clark, B.; Stewart, G.B.; Panzone, L.A.; Kyriazakis, I.; Frewer, L.J. Citizens, consumers and farm animal welfare: A meta-analysis of willingness-to-pay studies. Food Policy 2017, 68, 112–127. [Google Scholar] [CrossRef] [Green Version]
- Cao, Y.J.; Cranfield, J.; Chen, C.; Widowski, T. Heterogeneous informational and attitudinal impacts on consumer preferences for eggs from welfare enhanced cage systems. Food Pol. 2021, 99, 101979. [Google Scholar] [CrossRef]
- Charry, A.; Narjes, M.; Enciso, K.; Peters, M.; Burkart, S. Sustainable intensification of beef production in Colombia—Chances for product differentiation and price premiums. Agric. Food Econ. 2019, 7, 22. [Google Scholar] [CrossRef] [Green Version]
- Denver, S.; Sandøe, P.; Christensen, T. Consumer preferences for pig welfare–Can the market accommodate more than one level of welfare pork? Meat Sci. 2017, 129, 140–146. [Google Scholar] [CrossRef] [PubMed]
- Eldesouky, A.; Mesias, F.J.; Escribano, M. Consumer Assessment of Sustainability Traits in Meat Production. A Choice Experiment Study in Spain. Sustainability 2020, 12, 4093. [Google Scholar] [CrossRef]
- Mulder, M.; Zomer, S. Dutch consumers’ willingness to pay for broiler welfare. J. Appl. Anim. Welf. Sci. 2017, 20, 137–154. [Google Scholar] [CrossRef] [PubMed] [Green Version]
- Van Loo, E.J.; Caputo, V.; Nayga, R.M.; Verbeke, W. Consumers’ valuation of sustainability labels on meat. Food Pol. 2014, 49, 137–150. [Google Scholar] [CrossRef]
- Mazzocchi, C.; Orsi, L.; Sali, G. Consumers’ attitudes for sustainable mountain cheese. Sustainability 2021, 13, 1743. [Google Scholar] [CrossRef]
- Nocella, G.; Boecker, A.; Hubbard, L.; Scarpa, R. Eliciting consumer preferences for certified animal-friendly foods: Can elements of the theory of planned behavior improve choice experiment analysis? Psychol. Mark. 2012, 29, 850–868. [Google Scholar] [CrossRef]
- Beldad, A.; Hegner, S. A Steak for Supper if the Cow Did Not Suffer: Understanding the Mechanisms Behind People’s Intention to Purchase Animal Welfare-Friendly (AWF) Meat Products. J. Agric. Environ. Ethics 2020, 33, 461–486. [Google Scholar] [CrossRef]
- Jamieson, J.; Reiss, M.J.; Allen, D.; Asher, L.; Parker, M.O.; Wathes, C.M.; Abeyesinghe, S.M. Adolescents care but don’t feel responsible for farm animal welfare. Soc. Anim. 2015, 23, 269–297. [Google Scholar] [CrossRef] [Green Version]
- McEachern, M.G.; Schröder, M.J.A.; Willock, J.; Whitelock, J.; Mason, R. Exploring ethical brand extensions and consumer buying behaviour: The RSPCA and the “Freedom Food” brand. J. Prod. Brand Manag. 2007, 16, 168–177. [Google Scholar] [CrossRef]
- Toma, L.; McVittie, A.; Hubbard, C.; Stott, A.W. A structural equation model of the factors influencing British consumers’ behaviour toward animal welfare. J. Food Prod. Mark. 2011, 17, 261–278. [Google Scholar] [CrossRef]
- Toma, L.; Stott, A.W.; Revoredo-Giha, C.; Kupiec-Teahan, B. Consumers and animal welfare. A comparison between European Union countries. Appetite 2012, 58, 597–607. [Google Scholar] [CrossRef] [PubMed]
- Weinrich, R.; Spiller, A. Can a Multi-Level Label do Better than a Binary Label for Animal Welfare? A PLS-Analysis of Consumer Satisfaction. Int. Food Agribus. Manag. Rev. 2016, 19, 1–30. [Google Scholar]
- Bouscasse, H. Integrated Choice and Latent Variable Models: A Literature Review on Mode Choice; Grenoble Applied Economics Laboratory (GAEL): Grenoble, France, 2018. [Google Scholar]
- Yeh, C.H.; Hartmann, M.; Gorton, M.; Tocco, B.; Amilien, V.; Steinnes, K.K. Looking behind the choice of organic: A cross-country analysis applying Integrated Choice and Latent Variable Models. Appetite 2021, 167, 105591. [Google Scholar] [CrossRef]
- Bosse, R.; Müller, A.; Gibis, M.; Weiss, A.; Schmidt, H.; Weiss, J. Recent advances in cured raw ham manufacture. Crit. Rev. Food Sci. Nutr. 2018, 58, 610–630. [Google Scholar] [CrossRef]
- Resano, H.; Pérez-Cueto, F.J.A.; Sanjuán, A.I.; de Barcellos, M.D.; Grunert, K.G.; Verbeke, W. Consumer satisfaction with dry-cured ham in five European countries. Meat Sci. 2011, 87, 336–343. [Google Scholar] [CrossRef]
- Vij, A.; Walker, J.L. How, when and why integrated choice and latent variable models are latently useful. Transp. Res. Part B Methodol. 2016, 90, 192–217. [Google Scholar] [CrossRef]
- McFadden, D. Conditional Logit Analysis of Qualitative Choice Behavior. In Frontiers in Econometrics; Zarembka, P., Ed.; Academic Press: New York, NY, USA, 1974; pp. 105–142. [Google Scholar]
- Lancaster, K.J. A New Approach to Consumer Theory. J. Polit. Econ. 1966, 74, 132–157. [Google Scholar] [CrossRef]
- Train, K.E. Discrete Choice Methods with Simulation; Cambridge University Press: Cambridge, UK, 2009. [Google Scholar]
- McFadden, D.; Train, K. Mixed MNL models for discrete response. J. Appl. Econom. 2000, 15, 447–470. [Google Scholar] [CrossRef]
- Hensher, D.A.; Greene, W.H. The mixed logit model: The state of practice. Transportation 2003, 30, 133–176. [Google Scholar] [CrossRef]
- Ashok, K.; Dillon, W.R.; Yuan, S. Extending discrete choice models to incorporate attitudinal and other latent variables. J. Mark. Res. 2002, 31, 31–46. [Google Scholar] [CrossRef]
- Louviere, J.; Street, D.; Carson, R.; Ainslie, A.; Deshazo, J.R.; Cameron, T.; Hensher, D.; Kohn, R.; Marley, T. Dissecting the random component of utility. Mark. Lett. 2002, 13, 177–193. [Google Scholar] [CrossRef]
- Hess, S. Rethinking heterogeneity: The role of attitudes, decision rules and information processing strategies. Transp. Lett. 2012, 4, 105–113. [Google Scholar] [CrossRef]
- Daly, A.; Hess, S.; Patruni, B.; Potoglou, D.; Rohr, C. Using ordered attitudinal indicators in a latent variable choice model: A study of the impact of security on rail travel behaviour. Transportation 2012, 39, 267–297. [Google Scholar] [CrossRef]
- Boxall, P.C.; Adamowicz, W.L. Understanding heterogeneous preferences in random utility models: A latent class approach. Environ. Resour. Econ. 2002, 23, 421–446. [Google Scholar] [CrossRef]
- Yeh, C.H.; Hartmann, M.; Langen, N. The role of trust in explaining food choice: Combining choice experiment and attribute best–worst scaling. Foods 2020, 9, 45. [Google Scholar] [CrossRef] [Green Version]
- Ben-Akiva, M.; McFadden, D.; Train, K.; Walker, J.; Bhat, C.; Bierlaire, M.; Bolduc, D.; Boersch-Supan, A.; Brownstone, D.; Bunch, D.; et al. Hybrid choice models: Progress and challenges. Mark. Lett. 2002, 13, 163–175. [Google Scholar] [CrossRef] [Green Version]
- Ben-Akiva, M.; de Palma, A.; McFadden, D.; Abou-Zeid, M.; Chiappori, P.-A.; de Lapparent, M.; Durlauf, S.; Fosgerau, M.; Fukuda, D.; Hess, S.; et al. Process and context in choice models. Mark. Lett. 2012, 23, 439–456. [Google Scholar] [CrossRef] [Green Version]
- Ajzen, I. The Theory of Planned Behavior. Theory Plan. Behav. 1991, 50, 179–211. [Google Scholar] [CrossRef]
- Armitage, C.J.; Conner, M. Efficacy of the Theory of Planned Behaviour: A meta-analytic review. Br. J. Soc. Psychol. 2001, 40, 471–499. [Google Scholar] [CrossRef] [Green Version]
- Crites, S.L., Jr.; Fabrigar, L.R.; Petty, R.E. Measuring the affective and cognitive properties of attitudes: Conceptual and methodological issues. Personal. Soc. Psychol. Bull. 1994, 20, 619–634. [Google Scholar] [CrossRef]
- Madden, T.J.; Ellen, P.S.; Ajzen, I. A Comparison of the Theory of Planned Behavior and the Theory of Reasoned Action. Personal. Soc. Psychol. Bull. 1992, 18, 3–9. [Google Scholar] [CrossRef]
- Manstead, A.S.R. The Role of Moral Norm in the Attitude-Behavior Relation. In Attitudes, Behavior, and Social Context; Psychology Press: London, UK, 1999; pp. 11–30. [Google Scholar] [CrossRef]
- Wan, C.; Shen, G.Q.; Choi, S. Experiential and instrumental attitudes: Interaction effect of attitude and subjective norm on recycling intention. J. Environ. Psychol. 2017, 50, 69–79. [Google Scholar] [CrossRef]
- Fretschner, M. Ajzen’s Theory of Planned Behavior in Entrepreneurship Education Research. In Becoming an Entrepreneur. Professional and Vet Learning; SensePublishers: Rotterdam, The Netherlands, 2014; pp. 249–277. [Google Scholar] [CrossRef]
- Dean, M.; Raats, M.M.; Shepherd, R. Moral Concerns and Consumer Choice of Fresh and Processed Organic Foods1. J. Appl. Soc. Psychol. 2008, 38, 2088–2107. [Google Scholar] [CrossRef] [Green Version]
- Deutscher tierschutzbund e.V. Tierschutzlabel “Für Mehr Tierschutz“. Available online: https://www.tierschutzbund.de/fileadmin/user_upload/Downloads/Broschueren/Tierschutzlabel-Broschuere.pdf (accessed on 31 July 2021).
- Cummings, R.G.; Taylor, L.O. Unbiased value estimates for environmental goods: A cheap talk design for the contingent valuation method. Am. Econ. Rev. 1999, 89, 649–665. [Google Scholar] [CrossRef]
- Tonsor, G.T.; Shupp, R.S. Cheap Talk Scripts and Online Choice Experiments: “Looking Beyond the Mean”. Am. J. Agric. Econ. 2011, 93, 1015–1031. [Google Scholar] [CrossRef]
- ChoiceMetrics. Ngene 1.1.2 User Manual and Reference Guide: The Cutting Edge in Experimental Design; ChoiceMetrics: Sydney, Australia, 2012. [Google Scholar]
- Povey, R.; Wellens, B.; Conner, M. Attitudes towards following meat, vegetarian and vegan diets: An examination of the role of ambivalence. Appetite 2001, 37, 15–26. [Google Scholar] [CrossRef] [Green Version]
- Fishbein, M.; Ajzen, I. Predicting and Changing Behavior: The Reasoned Action Approach; Psychology Press: New York, NY, USA, 2011. [Google Scholar]
- Arvola, A.; Vassallo, M.; Dean, M.; Lampila, P.; Saba, A.; Lahteenmaki, L.; Shepherd, R. Predicting intentions to purchase organic food: The role of affective and moral attitudes in the Theory of Planned Behaviour. Appetite 2008, 50, 443–454. [Google Scholar] [CrossRef]
- Rossi, P.E.; Allenby, G.M. Bayesian statistics and marketing. Bayesian Stat. Mark. 2003, 22, 304–328. [Google Scholar] [CrossRef]
- Rossi, P.E.; Allenby, G.M.; McCulloch, R. Bayesian Statistics and Marketing; John Wiley & Sons: Hoboken, NJ, USA, 2012. [Google Scholar]
- Hampton, C. Estimating and reporting structural equation models with behavioral accounting data. Behav. Res. Acc. 2015, 27, 1–34. [Google Scholar] [CrossRef]
- McQuitty, S.; Wolf, M. Structural equation modeling: A practical introduction. J. Afr. Bus. 2013, 14, 58–69. [Google Scholar] [CrossRef]
- Morrison, T.G.; Morrison, M.A.; McCutcheon, J.M. Best practice recommendations for using structural equation modelling in psychological research. Psychology 2017, 8, 1326. [Google Scholar] [CrossRef] [Green Version]
- Statistisches Bundesamt (Destatis). Bevölkerung auf Grundlage des Zensus 2011. 2017. Available online: https://www.destatis.de/DE/Themen/Gesellschaft-Umwelt/Bevoelkerung/Bevoelkerungsstand/Publikationen/Downloads-Bevoelkerungsstand/bevoelkerungsfortschreibung-2010130167004.pdf?__blob=publicationFile&v=4 (accessed on 18 March 2020).
- Statistisches Bundesamt (Destatis). Bevölkerung und Erwerbstätigkeit. 2016. Available online: https://www.destatis.de/DE/Publikationen/Thematisch/Bevoelkerung/Bevoelkerungsstand/Bevoelkerungsfortschreibung2010130157004.pdf?__blob=publicationFile (accessed on 18 March 2020).
- Statistisches Bundesamt (Destatis). Bevölkerung und Erwerbstätigkeit: Haushalte und Familien, Ergebnisse des Mikrozensus. 2017. Available online: https://www.destatis.de/DE/Themen/Gesellschaft-Umwelt/Bevoelkerung/Haushalte-Familien/Publikationen/Downloads-Haushalte/haushalte-familien-2010300177004.pdf?__blob=publicationFile&v=4 (accessed on 18 March 2020).
- Bech, M.; Gyrd-Hansen, D. Effects coding in discrete choice experiments. Health Econ. 2005, 14, 1079–1083. [Google Scholar] [CrossRef]
- Swait, J. A structural equation model of latent segmentation and product choice for cross-sectional revealed preference choice data. J. Retail. Consum. Serv. 1994, 1, 77–89. [Google Scholar] [CrossRef]
- Hair, J.F.; Black, W.C.; Babin, B.J.; Anderson, R.E.; Tatham, R.L. Multivariate Data Analysis, 7th ed.; Prentice Hall: Upper Saddle River, NJ, USA, 2010. [Google Scholar]
- Bagozzi, R.P.; Yi, Y. Specification, evaluation, and interpretation of structural equation models. J. Acad. Mark. Sci. 2012, 40, 8–34. [Google Scholar] [CrossRef]
- Fornell, C.; Larcker, D.F. Evaluating Structural Equation Models with Unobservable Variables and Measurement Error. J. Mark. Res. 1981, 18, 39–50. [Google Scholar] [CrossRef]
- Lorenz, B.A.S.; Hartmann, M.; Langen, N. What makes people leave their food? The interaction of personal and situational factors leading to plate leftovers in canteens. Appetite 2017, 116, 45–56. [Google Scholar] [CrossRef]
- Wang, J.W.; Wang, X. Structural Equation Modeling: Application Using Mplus, 2nd ed.; John Wiley & Sons Ltd.: Hoboken, NJ, USA, 2020. [Google Scholar]
- Byrne, B.M. Structural Equation Modeling with AMOS: Basic Concepts, Applications, and Programming; Routledge: New York, NY, USA, 2010. [Google Scholar]
- Bagozzi, R.P.; Yi, Y. On the evaluation of structural equation models. J. Acad. Mark. Sci. 1988, 16, 74–94. [Google Scholar] [CrossRef]
- Brown, T.A. Confirmatory Factor Analysis for Applied Research; Gilford Press: New York, NY, USA, 2006. [Google Scholar]
- Grunert, K.G.; Sonntag, W.I.; Glanz-Chanos, V.; Forum, S. Consumer interest in environmental impact, safety, health and animal welfare aspects of modern pig production: Results of a cross-national choice experiment. Meat Sci. 2018, 137, 123–129. [Google Scholar] [CrossRef]
- Xu, L.; Yang, X.; Wu, L.; Chen, X.; Chen, L.; Tsai, F.S. Consumers’ willingness to pay for food with information on animal welfare, lean meat essence detection, and traceability. Int. J. Environ. Res. Public Health 2019, 16, 3616. [Google Scholar] [CrossRef] [PubMed] [Green Version]
- Sonoda, Y.; Oishi, K.; Chomei, Y.; Hirooka, H. How do human values influence the beef preferences of consumer segments regarding animal welfare and environmentally friendly production? Meat Sci. 2018, 146, 75–86. [Google Scholar] [CrossRef]
- De Jonge, J.; van der Lans, I.A.; van Trijp, H.C. Different shades of grey: Compromise products to encourage animal friendly consumption. Food Qual. Prefer. 2015, 45, 87–99. [Google Scholar] [CrossRef]
- Aprile, M.C.; Caputo, V.; Nayga, R.M., Jr. Consumers’ valuation of food quality labels: The case of the European geographic indication and organic farming labels. Int. J. Consum. Stud. 2012, 36, 158–165. [Google Scholar] [CrossRef]
- Caputo, V.; Aprile, M.C.; Nayga, R.M., Jr. Consumers’ valuation for European food quality labels: Importance of label information provision. In Proceedings of the EAAE 2011 Congress, Zurich, Switzerland, 30 August–2 September 2011. [Google Scholar]
- Maza, M.T.; Gracia, A.; Saied, M. Consumers’ valuation of two packaging aspects for fresh lamb meat: Vacuum and information labels. Packag. Technol. Sci. 2018, 31, 123–132. [Google Scholar] [CrossRef]
- Dahlhausen, J.L.; Rungie, C.; Roosen, J. Value of labeling credence attributes-common structures and individual preferences. Agric. Econ. 2018, 49, 741–751. [Google Scholar] [CrossRef]
- Otieno, D.J.; Ogutu, S.O. Consumer willingness to pay for chicken welfare attributes in Kenya. J. Int. Food Agribus. Mark. 2019, 32, 379–402. [Google Scholar] [CrossRef]
- Trudel, R.; Cotte, J. Does it pay to be good? MIT Sloan Manag. Rev. 2009, 50, 61. [Google Scholar]
- Simonson, I. Choice based on reasons: The case of attraction and compromise effects. J. Consum. Esearch 1989, 16, 158–174. [Google Scholar] [CrossRef]
- Hoeksma, D.L.; Gerritzen, M.A.; Lokhorst, A.M.; Poortvliet, P.M. An extended theory of planned behavior to predict consumers’ willingness to buy mobile slaughter unit meat. Meat Sci. 2017, 128, 15–23. [Google Scholar] [CrossRef]
- Rex, J.; Lobo, A.; Leckie, C. Evaluating the Drivers of Sustainable Behavioral Intentions: An Application and Extension of the Theory of Planned Behavior. J. Nonprofit Public Sect. Mark. 2015, 27, 263–284. [Google Scholar] [CrossRef]
- Spence, M.; Stancu, V.; Elliott, C.T.; Dean, M. Exploring consumer purchase intentions towards traceable minced beef and beef steak using the theory of planned behavior. Food Control 2018, 91, 138–147. [Google Scholar] [CrossRef] [Green Version]
- Raats, M.M.; Shepherd, R.; Sparks, P. Including Moral Dimensions of Choice Within the Structure of the Theory of Planned Behavior1. J. Appl. Soc. Psychol. 1995, 25, 484–494. [Google Scholar] [CrossRef]
- Sparks, P.; Shepherd, R. The Role of Moral Judgments Within Expectancy-Value-Based Attitude-Behavior Models. Ethics Behav. 2002, 12, 299–321. [Google Scholar] [CrossRef]
- Carrington, M.J.; Neville, B.A.; Whitwell, G.J. Why Ethical Consumers Don’t Walk Their Talk: Towards a Framework for Understanding the Gap Between the Ethical Purchase Intentions and Actual Buying Behaviour of Ethically Minded Consumers. J. Bus. Ethics 2010, 97, 139–158. [Google Scholar] [CrossRef]
- Yamoah, F.A.; Acquaye, A. Unravelling the attitude-behaviour gap paradox for sustainable food consumption: Insight from the UK apple market. J. Clean. Prod. 2019, 217, 172–184. [Google Scholar] [CrossRef]
- Vigors, B. Reducing the consumer attitude–behaviour gap in animal welfare: The potential role of ‘nudges’. Animals 2018, 8, 232. [Google Scholar] [CrossRef] [Green Version]
- Mayfield, L.E.; Bennett, R.M.; Tranter, R.B.; Wooldridge, M.J. Consumption of welfarefriendly food products in Great Britain, Italy and Sweden, and how it may be influenced by consumer attitudes to, and behaviour towards, animal welfare attributes. Int. J. Sociol. Agric. Food 2007, 15, 59–73. [Google Scholar]
- Miele, M. Report Concerning Consumer Perceptions and Attitudes Towards Farm Animal Welfare; European Animal Welfare Platform: Brussels, Belgium, 2010. [Google Scholar]
- Harper, G.C.; Makatouni, A. Consumer perception of organic food production and farm animal welfare. Br. Food J. 2002, 104, 287–299. [Google Scholar] [CrossRef]
- Samant, S.S.; Seo, H.S. Effects of label understanding level on consumers’ visual attention toward sustainability and process-related label claims found on chicken meat products. Food Qual. Prefer. 2016, 50, 48–56. [Google Scholar] [CrossRef]
- Yang, Y.C. Factors affecting consumers’ willingness to pay for animal welfare eggs in Taiwan. I. Int. Food Agribus. Manag. Rev. 2018, 21, 741–754. [Google Scholar] [CrossRef]
- Krasner, B. The Food Chain: Regulation, Inspection, and Supply; Krasner, B., Ed.; Greenhaven Publishing LLC.: New York, NY, USA, 2018. [Google Scholar]
- Carlsson, F.; Frykblom, P.; Lagerkvist, C.J. Using cheap talk as a test of validity in choice experiments. Econ. Lett. 2005, 89, 147–152. [Google Scholar] [CrossRef] [Green Version]


| Attributes | Level 1 | Level 2 | Level 3 | Level 4 |
|---|---|---|---|---|
| Animal welfare labelling | None | One-star AW label  | Two-star AW label  | |
| Variety of cured ham | Generic ham | PGI-labelled Holsteiner Katenschinken | PGI-labelled Schwarzwälder Schinken | |
| Prices | EUR 1.29 | EUR 1.79 | EUR 2.29 | EUR 2.79 |
| Construct | Items | References |
|---|---|---|
| Attitude (ATT) * | Buying cured ham produced in line with higher animal welfare standards instead of cured ham in accordance with legal standards makes me feel:
| Adapted from Povey et al. [64]; Fishbein and Ajzen [65] |
I think that buying cured ham produced in line with higher animal welfare standards instead of cured ham in accordance with legal standards is:
| ||
| Subjective Norms (SN) ** | Most people who are important to me would like me to buy cured ham produced in line with higher animal welfare standards instead of cured ham in accordance with legal standards [Code: SN1]. My close friends and family expect me to buy cured ham produced in line with higher animal welfare standards instead of cured ham in accordance with legal standards [Code: SN2]. Most of my close friends and family generally buy cured ham produced in line with higher animal welfare standards instead of cured ham in accordance with legal standards [Code: SN3]. | Ajzen [52]; Fishbein and Ajzen [65] |
| Perceived Behavioral Control (PBC) ** | Whether or not I buy cured ham produced in line with higher animal welfare standards instead of cured ham in accordance with legal standards on a regular basis is completely up to me [Code: PBC1]. I am confident that I can buy cured ham produced in line with higher animal welfare standards instead of cured ham in accordance with legal standards on a regular basis [Code: PBC2]. For me, buying cured ham produced in line with higher animal welfare standards instead of cured ham in accordance with legal standards on a regular basis is easy [Code: PBC3]. | Ajzen [52] |
| Behavioral Intention (BI) ** | I intend to buy cured ham produced in line with higher animal welfare standards instead of cured ham in accordance with legal standards on a regular basis [CODE: BI1]. I will make an effort to buy cured ham produced in line with higher animal welfare standards instead of cured ham in accordance with legal standards on a regular basis [CODE: BI2]. In the future, when you buy cured ham, how often will you buy cured ham produced in line with higher animal welfare standards? [CODE: BI3] | Adapted from Fishbein and Ajzen [65] |
| Moral Norms (MN) ** | Buying cured ham produced in line with higher animal welfare standards instead of cured ham in accordance with legal standards:
| Dean et al. [59]; Arvola et al. [66] |
| Total N | 900 |
|---|---|
| Valid N | 401 |
| Qualified N % (Valid N/Total N) | 0.45 |
| Gender | |
| Female (%) | 48.88 |
| Male (%) | 51.12 |
| Average age | 43.77 |
| Living area | |
| Rural area (%) | 38.40 |
| Urban medium town (%) | 22.94 |
| City (%) | 38.65 |
| Education | |
| Lower secondary/primary education or below (%) | 16.96 |
| Upper secondary education (%) | 16.21 |
| University or college entrance qualification (e.g., A-levels, vocational certificate, technical diploma) (%) | 39.90 |
| Bachelor’s degree or equivalent level (%) | 11.97 |
| Master, Postgraduate, or doctoral degree (%) | 14.96 |
| Household size | 2.41 |
| Number of children (<18 year) in a household | 0.47 |
| Household monthly net income | |
| HHI< EUR 900 (%) | 3.74 |
| EUR 900 ≤ HHI < EUR 1300 (%) | 7.98 |
| EUR 1300 ≤ HHI < EUR 2000 (%) | 16.21 |
| EUR 2000 ≤ HHI < EUR 3600 (%) | 38.90 |
| EUR 3600 ≤ HHI < EUR 5000 (%) | 18.70 |
| EUR 5000 ≤ HHI (%) | 7.98 |
| Preferred not to provide information (%) | 6.48 |
| Model | Mixed Logit Model | Latent Class Analysis | |||||||
|---|---|---|---|---|---|---|---|---|---|
| N | 401 | ||||||||
| Group 1: Product and Process Quality Supporters | Group 2: Price Sensitive Consumers | ||||||||
| Segment Size | 62% | 38% | |||||||
| Avg. Imprt. a (S.D.) | Avg. Utilities b (S.D.) | WTP | Imprt. c (%) | Utilities (S.E.) | WTP | Imprt. c (%) | Utilites (S.E.) | WTP | |
| Variety of cured ham | 28.06 (16.91) | 31.21 | 7.80 | ||||||
| Generic ham | −14.31 (41.73) | −0.71 | −39.68 (0.04) | −1.33 | −0.02(0.08) | 0.00 | |||
| Holsteiner Katenschinken | −11.38 (34.65) | −0.56 | −14.28 (0.05) | −0.48 | −11.67 (0.09) | −0.13 | |||
| Schwarzwälder Schinken | 25.69 (37.20) | 1.27 | 53.96 (0.04) | 1.81 | 11.69(0.08) | 0.13 | |||
| Animal welfare labelling | 22.32 (14.05) | 38.93 | 4.34 | ||||||
| None | −34.03 (31.59) | −1.68 | −77.63 (0.05) | −2.60 | −6.67 (0.08) | −0.08 | |||
| One star AW label | 17.82 (16.01) | 0.88 | 38.48 (0.04) | 1.29 | 0.33(0.09) | 0.00 | |||
| Two stars AW label | 16.22 (24.40) | 0.80 | 39.15 (0.04) | 1.31 | 6.34 (0.08) | 0.07 | |||
| Price | 49.62 (24.35) | −40.57 (37.57) | 29.86 | −29.86 (0.03) | 87.87 | −87.67 (0.09) | |||
| NONE | −139.97 (192.85) | −363.06 (0.18) | 60.68 (0.12) | ||||||
| Group 1 Product and Process Quality Supporters N = 249 | Group 2 Price Sensitive Consumers N = 152 | Comparison Group 1/Group 2 | |||||||||||
|---|---|---|---|---|---|---|---|---|---|---|---|---|---|
| Construct | Item Code | M | SD | S | K | Std. Factor Loadings | M | SD | S | K | Std. Factor Loadings | Mean Diff. | Sig. |
| Attitude | ATT1 | 6.03 | 0.97 | −1.01 | 0.97 | 0.78 *** | 5.49 | 1.26 | −0.88 | 0.88 | 0.76 *** | 0.54 | *** |
| ATT4 | 5.95 | 1.21 | −1.5 | 2.77 | 0.81 *** | 5.28 | 1.47 | −1.03 | 0.96 | 0.78 *** | 0.67 | *** | |
| ATT5 | 5.95 | 1.29 | −1.56 | 2.59 | 0.63 *** | 5.53 | 1.22 | −0.5 | −0.18 | 0.78 *** | 0.42 | *** | |
| ATT6 | 6.09 | 1.18 | −1.39 | 1.72 | 0.80 *** | 5.34 | 1.49 | −0.7 | 0.02 | 0.80 *** | 0.76 | *** | |
| Subjective Norm | SN1 | 4.47 | 1.62 | −0.43 | −0.09 | 0.86 *** | 3.59 | 1.58 | −0.25 | −0.51 | 0.94 *** | 0.88 | *** |
| SN2 | 4.08 | 1.67 | −0.25 | −0.47 | 0.79 *** | 3.32 | 1.65 | −0.13 | −1.06 | 0.90 *** | 0.75 | *** | |
| SN3 | 4.40 | 1.41 | −0.38 | 0.17 | 0.76 *** | 3.53 | 1.57 | −0.06 | −0.46 | 0.80 *** | 0.87 | *** | |
| Perceived Behavior Control | PBC2 | 5.33 | 1.31 | −0.65 | 0.22 | 0.88 *** | 4.50 | 1.44 | −0.35 | 0.35 | 0.88 *** | 0.83 | ** |
| PBC3 | 5.02 | 1.44 | −0.50 | −0.02 | 0.76 *** | 4.26 | 1.50 | −0.32 | −0.06 | 0.76 *** | 0.76 | *** | |
| Behavioral Intention | BI1 | 5.39 | 1.33 | −0.74 | 0.41 | 0.89 *** | 4.47 | 1.52 | −0.32 | 0.05 | 0.90 *** | 0.92 | *** |
| BI2 | 5.60 | 1.27 | −0.81 | 0.5 | 0.88 *** | 4.53 | 1.65 | −0.64 | −0.09 | 0.82 *** | 1.07 | *** | |
| BI3 | 5.12 | 1.19 | −0.57 | 0.73 | 0.84 *** | 4.34 | 1.30 | −0.02 | 0.47 | 0.85 *** | 0.78 | *** | |
| Moral Norm | MN1 | 5.53 | 1.40 | −1,00 | 0.79 | 0.89 *** | 4.68 | 1.69 | −0.61 | −0.13 | 0.94 *** | 0.85 | *** |
| MN2 | 5.67 | 1.34 | −0.99 | 0.79 | 0.86 *** | 4.86 | 1.60 | −0.74 | 0.33 | 0.91 *** | 0.81 | *** | |
| MN3 | 5.09 | 1.48 | −0.55 | 0.01 | 0.72 *** | 4.37 | 1.66 | −0.47 | −0.17 | 0.84 *** | 0.72 | *** | |
| Group 1 Product and Process Quality Supporters N = 249 | Group 2 Price Sensitive Consumers N = 152 | |||||||||||
|---|---|---|---|---|---|---|---|---|---|---|---|---|
| Construct | Cron-Bach’s Alpha | CR | AVE | Sqrt. of AVE | Highest Corr. Coef. with Other Construct | Correlated Relationship | Cron-Bach’s Alpha | CR | AVE | Sqrt. of AVE | Highest Corr. Coef. with Other Construct | Correlated Relationship |
| Attitude | 0.88 | 0.84 | 0.58 | 0.76 | 0.85 | ATT-BI | 0.88 | 0.86 | 0.61 | 0.78 | 0.60 | ATT-PBC |
| Subjective Norm | 0.84 | 0.84 | 0.64 | 0.8 | 0.60 | SN-PBC | 0.92 | 0.91 | 0.78 | 0.88 | 0.80 | SN-PBC |
| Perceived Behavior Control | 0.80 | 0.80 | 0.67 | 0.82 | 0.80 | PBC-BI | 0.79 | 0.80 | 0.67 | 0.82 | 0.80 | PBC-SN |
| Behavioral Intention | 0.91 | 0.90 | 0.76 | 0.87 | 0.85 | BI-ATT | 0.89 | 0.89 | 0.73 | 0.85 | 0.69 | BI-PBC |
| Moral Norm | 0.86 | 0.86 | 0.68 | 0.82 | 0.82 | ATT-MN | 0.92 | 0.92 | 0.80 | 0.89 | 0.54 | MN-PBC |
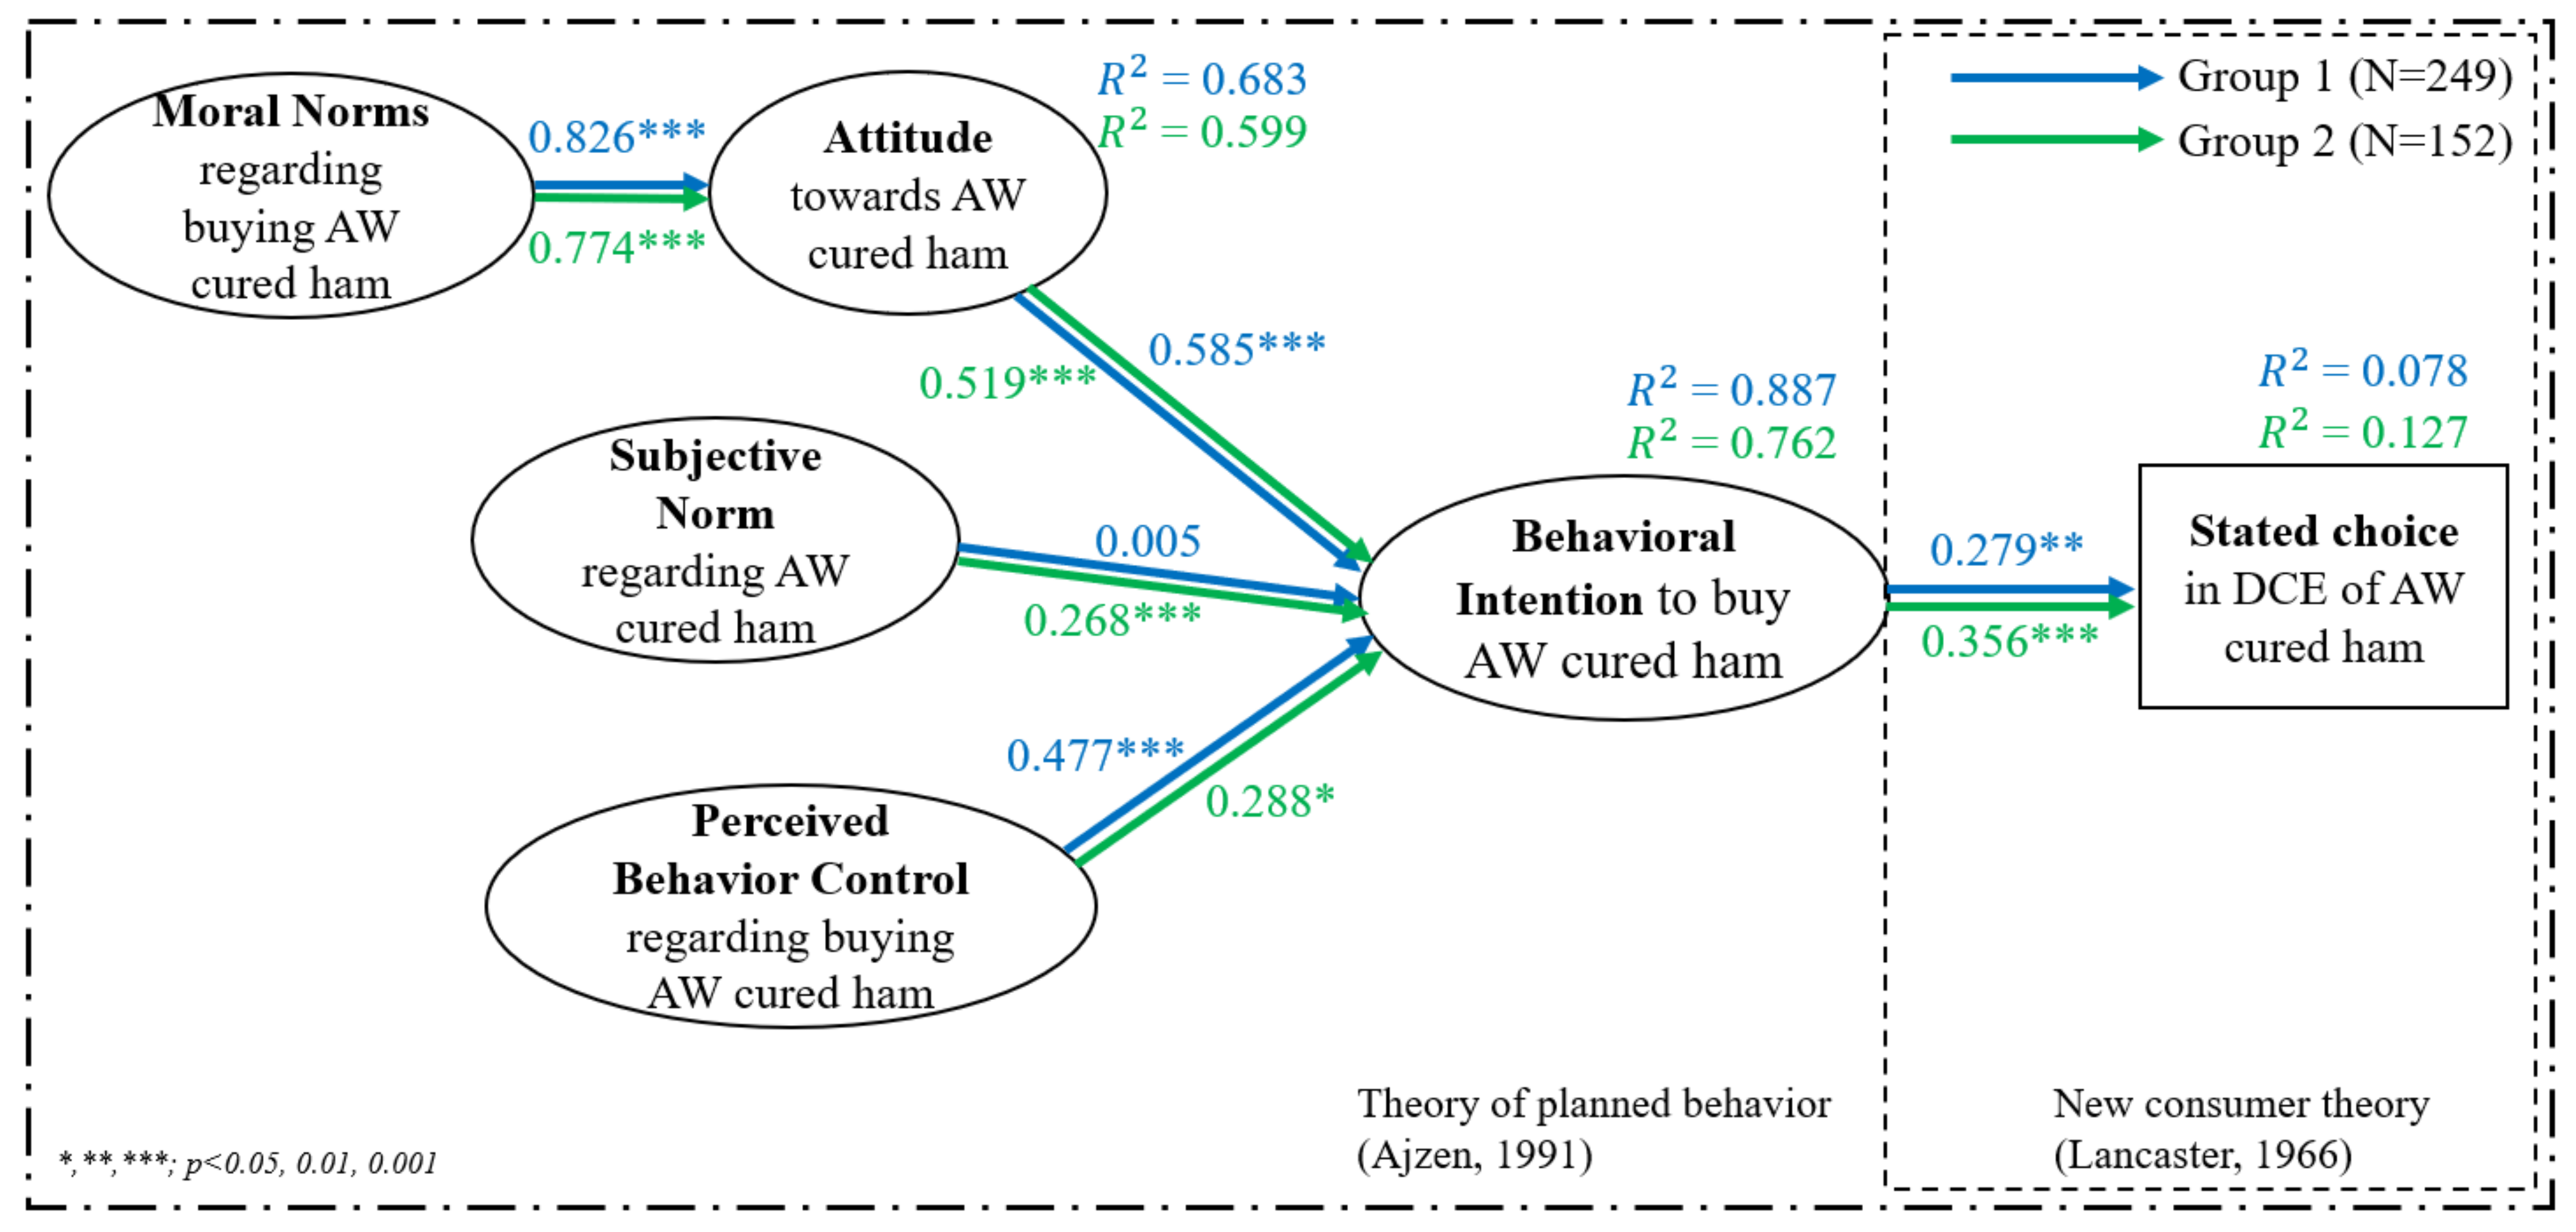
| Group | Hypotheses | LVM Path | Testing Results | Model Fit Measures | ||
|---|---|---|---|---|---|---|
| Group 1: Product and Process Quality Supporters | H1 | Behavioral Intention→ Stated Choice | 0.28 ** | Support | , , | RMSEA = 0.040 CFI = 0.969 TLI = 0.965 Chi-Square Test of Model Fit = 275.320 d.f. = 208 p-value = 0.001 |
| H2 | Attitude → Behavioral Intention | 0.59 *** | Support | |||
| H3 | Subjective Norms → Behavioral Intention | 0.01 | Not Support | |||
| H4 | Perceived Behavioral Control → Behavioral Intention | 0.48 *** | Support | |||
| H5 | Moral Norms → Attitude | 0.83 *** | Support | |||
| Group 2: Price Sensitive Consumers | H1 | Behavioral Intention → Stated Choice | 0.36 *** | Support | , , | |
| H2 | Attitude → Behavioral Intention | 0.52 *** | Support | |||
| H3 | Subjective Norms → Behavioral Intention | 0.27 *** | Support | |||
| H4 | Perceived Behavioral Control → Behavioral Intention | 0.29 * | Support | |||
| H5 | Moral Norms → Attitude | 0.77 *** | Support |
Publisher’s Note: MDPI stays neutral with regard to jurisdictional claims in published maps and institutional affiliations. |
© 2021 by the authors. Licensee MDPI, Basel, Switzerland. This article is an open access article distributed under the terms and conditions of the Creative Commons Attribution (CC BY) license (https://creativecommons.org/licenses/by/4.0/).
Share and Cite
Yeh, C.-H.; Hartmann, M. To Purchase or Not to Purchase? Drivers of Consumers’ Preferences for Animal Welfare in Their Meat Choice. Sustainability 2021, 13, 9100. https://doi.org/10.3390/su13169100
Yeh C-H, Hartmann M. To Purchase or Not to Purchase? Drivers of Consumers’ Preferences for Animal Welfare in Their Meat Choice. Sustainability. 2021; 13(16):9100. https://doi.org/10.3390/su13169100
Chicago/Turabian StyleYeh, Ching-Hua, and Monika Hartmann. 2021. "To Purchase or Not to Purchase? Drivers of Consumers’ Preferences for Animal Welfare in Their Meat Choice" Sustainability 13, no. 16: 9100. https://doi.org/10.3390/su13169100
APA StyleYeh, C.-H., & Hartmann, M. (2021). To Purchase or Not to Purchase? Drivers of Consumers’ Preferences for Animal Welfare in Their Meat Choice. Sustainability, 13(16), 9100. https://doi.org/10.3390/su13169100