Article

The Local Labor Market Impacts of US Megafires

by
Benjamin A. Jones
1,* and
Shana McDermott
2
1
Department of Economics, University of New Mexico, Albuquerque, NM 87131, USA
2
Department of Economics, Trinity University, San Antonio, TX 78212, USA
*
Author to whom correspondence should be addressed.
Sustainability 2021, 13(16), 9078; https://doi.org/10.3390/su13169078
Submission received: 19 July 2021 / Revised: 8 August 2021 / Accepted: 10 August 2021 / Published: 13 August 2021
(This article belongs to the Special Issue Sustainability Perspectives on Fire and Smoke)

Abstract

:
As we learn to sustainably coexist with wildfire, there is an urgent need to improve our understanding of its multidimensional impacts on society. To this end, we undertake a nationwide study to estimate how megafires (wildfires > 100,000 acres in size) affect US labor market outcomes in communities located within the flame zone. Both year-of-fire and over-time dynamic impacts are studied between 2010−2017. We find that counties located within a megafire flame zone experience significantly lower per capita wage earnings across multiple sources of earnings data for up to two years after megafire event occurrence. We find preliminary evidence that impacts are nonlinear over megafire size. These results highlight a new dimension of megafire impacts and expand the scope of the potential costs of megafires that should be considered in benefit-cost analyses of wildfire control and suppression decisions, especially along sustainability dimensions.

1. Introduction

Sustainable forest management and megafires are directly related. Megafires, or fires that burn more than 100,000 acres, account for 85% of total wildfire suppression related expenditures [1,2,3]. This draws down the funds available for other forest management practices related to wildfire prevention activities like prescribed burning and mechanical thinning [1,2,3]. Moreover, most forest policies related to control and suppression decisions are currently informed by smaller, more frequently studied wildfires, not megafires [1]. This means that wildfire budgets for prevention and control may be underfunded because they do not consider how megafires, which become more common every year, may differ from small wildfire events [2,4]. For example, recent research shows that megafires produce nonlinear health impacts over wildfire size, justifying more spending per acre when compared to smaller wildfires [5].
Nailing down impact estimates from megafires is important because sustainable forest management requires balancing various, often competing, goals and objectives. For example, forest managers need to undertake wildfire prevention while providing nondecreasing ecosystem services and resource use (i.e., timber). Wildfires complicate these management goals and imprint large changes on local economies and ecosystems [6]. The direct effects on residents resulting from megafires, such as infrastructure damage, are enormous and relatively straightforward to calculate. Even some indirect impacts like health impacts [7,8,9] and water quality [10,11] have received recent attention in the literature. However, other secondary effects like changes to local labor markets following a megafire are less understood, which we address in this paper.
Williams et al. [3] point out that “these second-order effects to human health, infrastructure, and local economies are barely accounted for and rarely documented.” Bowman and Johnston [12] also highlight that the indirect effects of fires are a “poorly developed research field.” What is concerning is that the indirect effects may be much more significant than the direct effects. The International Association of Wildland Fire, in conjunction with the Nature Conservancy, estimate that the real cost of wildfire to local communities can be upwards of 30 times higher than the official estimated cost [13] due to harder-to-measure outcomes such as local economic impacts and changes in quality of life.
Predicting the effect a megafire has on local labor market outcomes, such as wage earnings, is unclear. It could be that wages in an affected area increase immediately following a fire as demand for labor increases while fighting the wildfire or, in the long-run, should the supply of labor migrate out of the area [14]. However, short- and long-run job losses from businesses leaving the area could dampen these effects [15,16].
Understanding the net effect on wages is especially important for improving outcomes and resiliency in communities where wildfires occur. Our analysis focuses on the universe of US counties located within a megafire flame zone and the general impact on the labor market (i.e., we do not evaluate the specific mechanisms through which the labor market is impacted, only whether and to what extent the effect exists). Impacts are evaluated over six years after a given megafire event, thus allowing for both a short- and long-term evaluation of local community effects. We create a robust fixed effects model to estimate impacts to wages, considering county-level and weather-driven confounding effects and fire size. The results show that megafire activity is associated with reduced wages in a county that experienced a fire, and the observed impacts persist for several years after the fire’s occurrence, which suggests longer-term effects in flame zone communities. We also provide evidence of heterogeneous wage impacts by megafire size, consistent with recent health findings. Our results speak directly to the economic sustainability and resiliency, or lack thereof, of communities located within megafire flame zones.

2. Background on Megafire and Labor Impacts

An observed increase in megafire activity is the result of both environmental and internal wildfire dynamics. While external factors such as earlier snowmelt, higher summer temperatures, and longer fire seasons contribute to the probability that a large wildfire occurs [17,18,19], the self-reinforcing, internal system dynamics make large wildfires mega. For example, megafires can generate their own weather through firestorm clouds called pyrocumulonimbus. These storm clouds can cause dry lightning and firenadoes or fire whirls as embers and ash get caught in the violently rising air, resulting in the creation of new fires and a larger burn area [20,21]. As one can imagine, combining these factors makes fighting megafires inherently more difficult than smaller wildfires, which can significantly alter local landscapes.
However, wildfires are known for more than their ability to physically alter environments. Wildfires also negatively affect air quality, including increasing ambient ground level PM2.5 (fine particulate matter) and PM10 (course particulate matter) and increasing toxic mercury and lead particulates [22,23]. Particulates found in the air during a wildfire event are significantly larger than those found in typical urban air pollution [24]. Significantly, wildfire air pollution can penetrate indoors, raising questions about the effectiveness of staying inside to avoid exposure to wildfire emissions [24,25]. This is concerning given that megafires are increasing in both frequency and size.
While wildfire smoke has established negative links to air quality, the resulting impact on the labor market is less clear and debated in the literature. Several studies observe initially positive effects on labor after a wildfire occurs near a community, especially while suppression activities are ongoing [9,26,27]. Nielsen-Pincus et al. [28] observe that communities closer to the fire, who are more directly affected by suppression costs, had the most substantial influence on employment growth. Borgschulte et al. [29] find that exposure to wildfire smoke reduces potential earnings even at a distance. However, Economou et al. [30] find no effect on local income following a wildfire, including those communities located closer to the fire. These studies seem to support previous literature that suggests greater labor instability occurs in the long run following a wildfire [27,31]. Longer-term studies enforce the idea of volatility in the labor market where labor effects possibly become detrimental over time [32], which seems to mimic other labor outcomes from natural disasters [33,34]. Among all of these previous wildfire impact studies, only three papers, Jones and McDermott [5], Bytnerowicz et al. [22], and Navarro et al. [25] specifically examine consequences from megafires; the remaining literature observed smaller wildfire events or combinations of smaller wildfires and megafires (thus confounding the megafire only impacts). Bytnerowicz et al. [22] examined the changes to ground level air pollution, and Navarro et al. [25] focused purely on changes to long-distance dispersal of pollutants from the megafires. None of these studies examined possible impacts on labor. A paper by Nielson-Pincus et al. [9], who examined labor market impacts of large wildfires in the western US, did include some megafires in their study, but that was not the focus of their assessment. Instead, they included western wildfires where the US Forest Service spent greater than $1 million on fire suppression efforts. Additionally, while Borgschulte et al. [29] examine impacts to labor of wildfire smoke, they focus on distant effects from the flame zone or drifting smoke. With that being said, to our knowledge, there are no papers that examine how megafires impact wage outcomes in local communities directly within the flame zone and over several years.
There are at least three fundamental reasons why a study of megafire impacts to flame zone communities is needed. First, as described earlier, megafires behave differently than smaller, better studied wildfires. Such differences in fire characteristics may cause megafires to be associated with larger and more severe impacts relative to smaller wildfire events. Second, the general results of indirect outcomes from wildfires are still debated in the literature, so additional insight provided by our study is necessary. Finally, in the future, we expect megafires to grow in frequency due to climate change and continued forest fuels buildup. Thus, estimates of their economic impacts on society are urgently needed, which can be used by policymakers for purposes of benefit-cost analyses on megafire suppression efforts and future investments in forest fuels reductions (e.g., thinning and prescribed burning). For the first time, this paper uses national US data to evaluate these costs in terms of labor market impacts. Our results have immediate and important sustainability implications for wildfire control and suppression decisions.

3. Materials and Methods

3.1. Wage Earnings Data

Data on wage earnings were obtained from the Internal Revenue Service (IRS) Statistics of Income (SOI), the US Census Bureau County Business Patterns (CBP) dataset, and the Bureau of Economic Analysis (BEA) Regional Economic Information System (REIS). Each dataset captures a slightly different slice of US wage earnings, which is why all three are employed in the analysis. The IRS SOI data is constructed by the IRS using a stratified probability sample of administrative records of individual income tax returns (forms 1040) from the IRS Individual Master File system. These data contain information on aggregate wages, the number of returns filed, and the number of personal exemptions and are provided annually and at the county level. We independently calculate wage earnings per capita by dividing aggregate wages by the number of personal exemptions in a given county. By contrast, the CBP dataset captures firm-level payroll information for the universe of US firms with paid employees. These data are also annualized at the county-level and provide us with information on aggregate payroll and employment statistics constructed from administrative records for single unit firms and a combination of administrative records and survey collected data for multi-unit companies. We calculate wage earnings per capita by dividing aggregate firm payroll by the aggregate number of firm employees. Lastly, we use data from the REIS, which is primarily constructed by the BEA by making adjustments to the Quarterly Census of Employment and Wages (QCEW) data. These annual county-level data provide aggregate estimates of wages and salaries using firm administrative data as reported under the state unemployment insurance system (including the federal civilian employee reporting system). Per capita wage earnings are calculated as before. In the analysis that follows, each earnings data source will be used both independently and in combination with each other to capture, to the extent possible, a wide swath of labor earnings in the US. Note that all wage earnings data are in annual county-level terms and were available up to 2017 at the time of the analysis. Wages have been inflation adjusted into 2017 dollars.

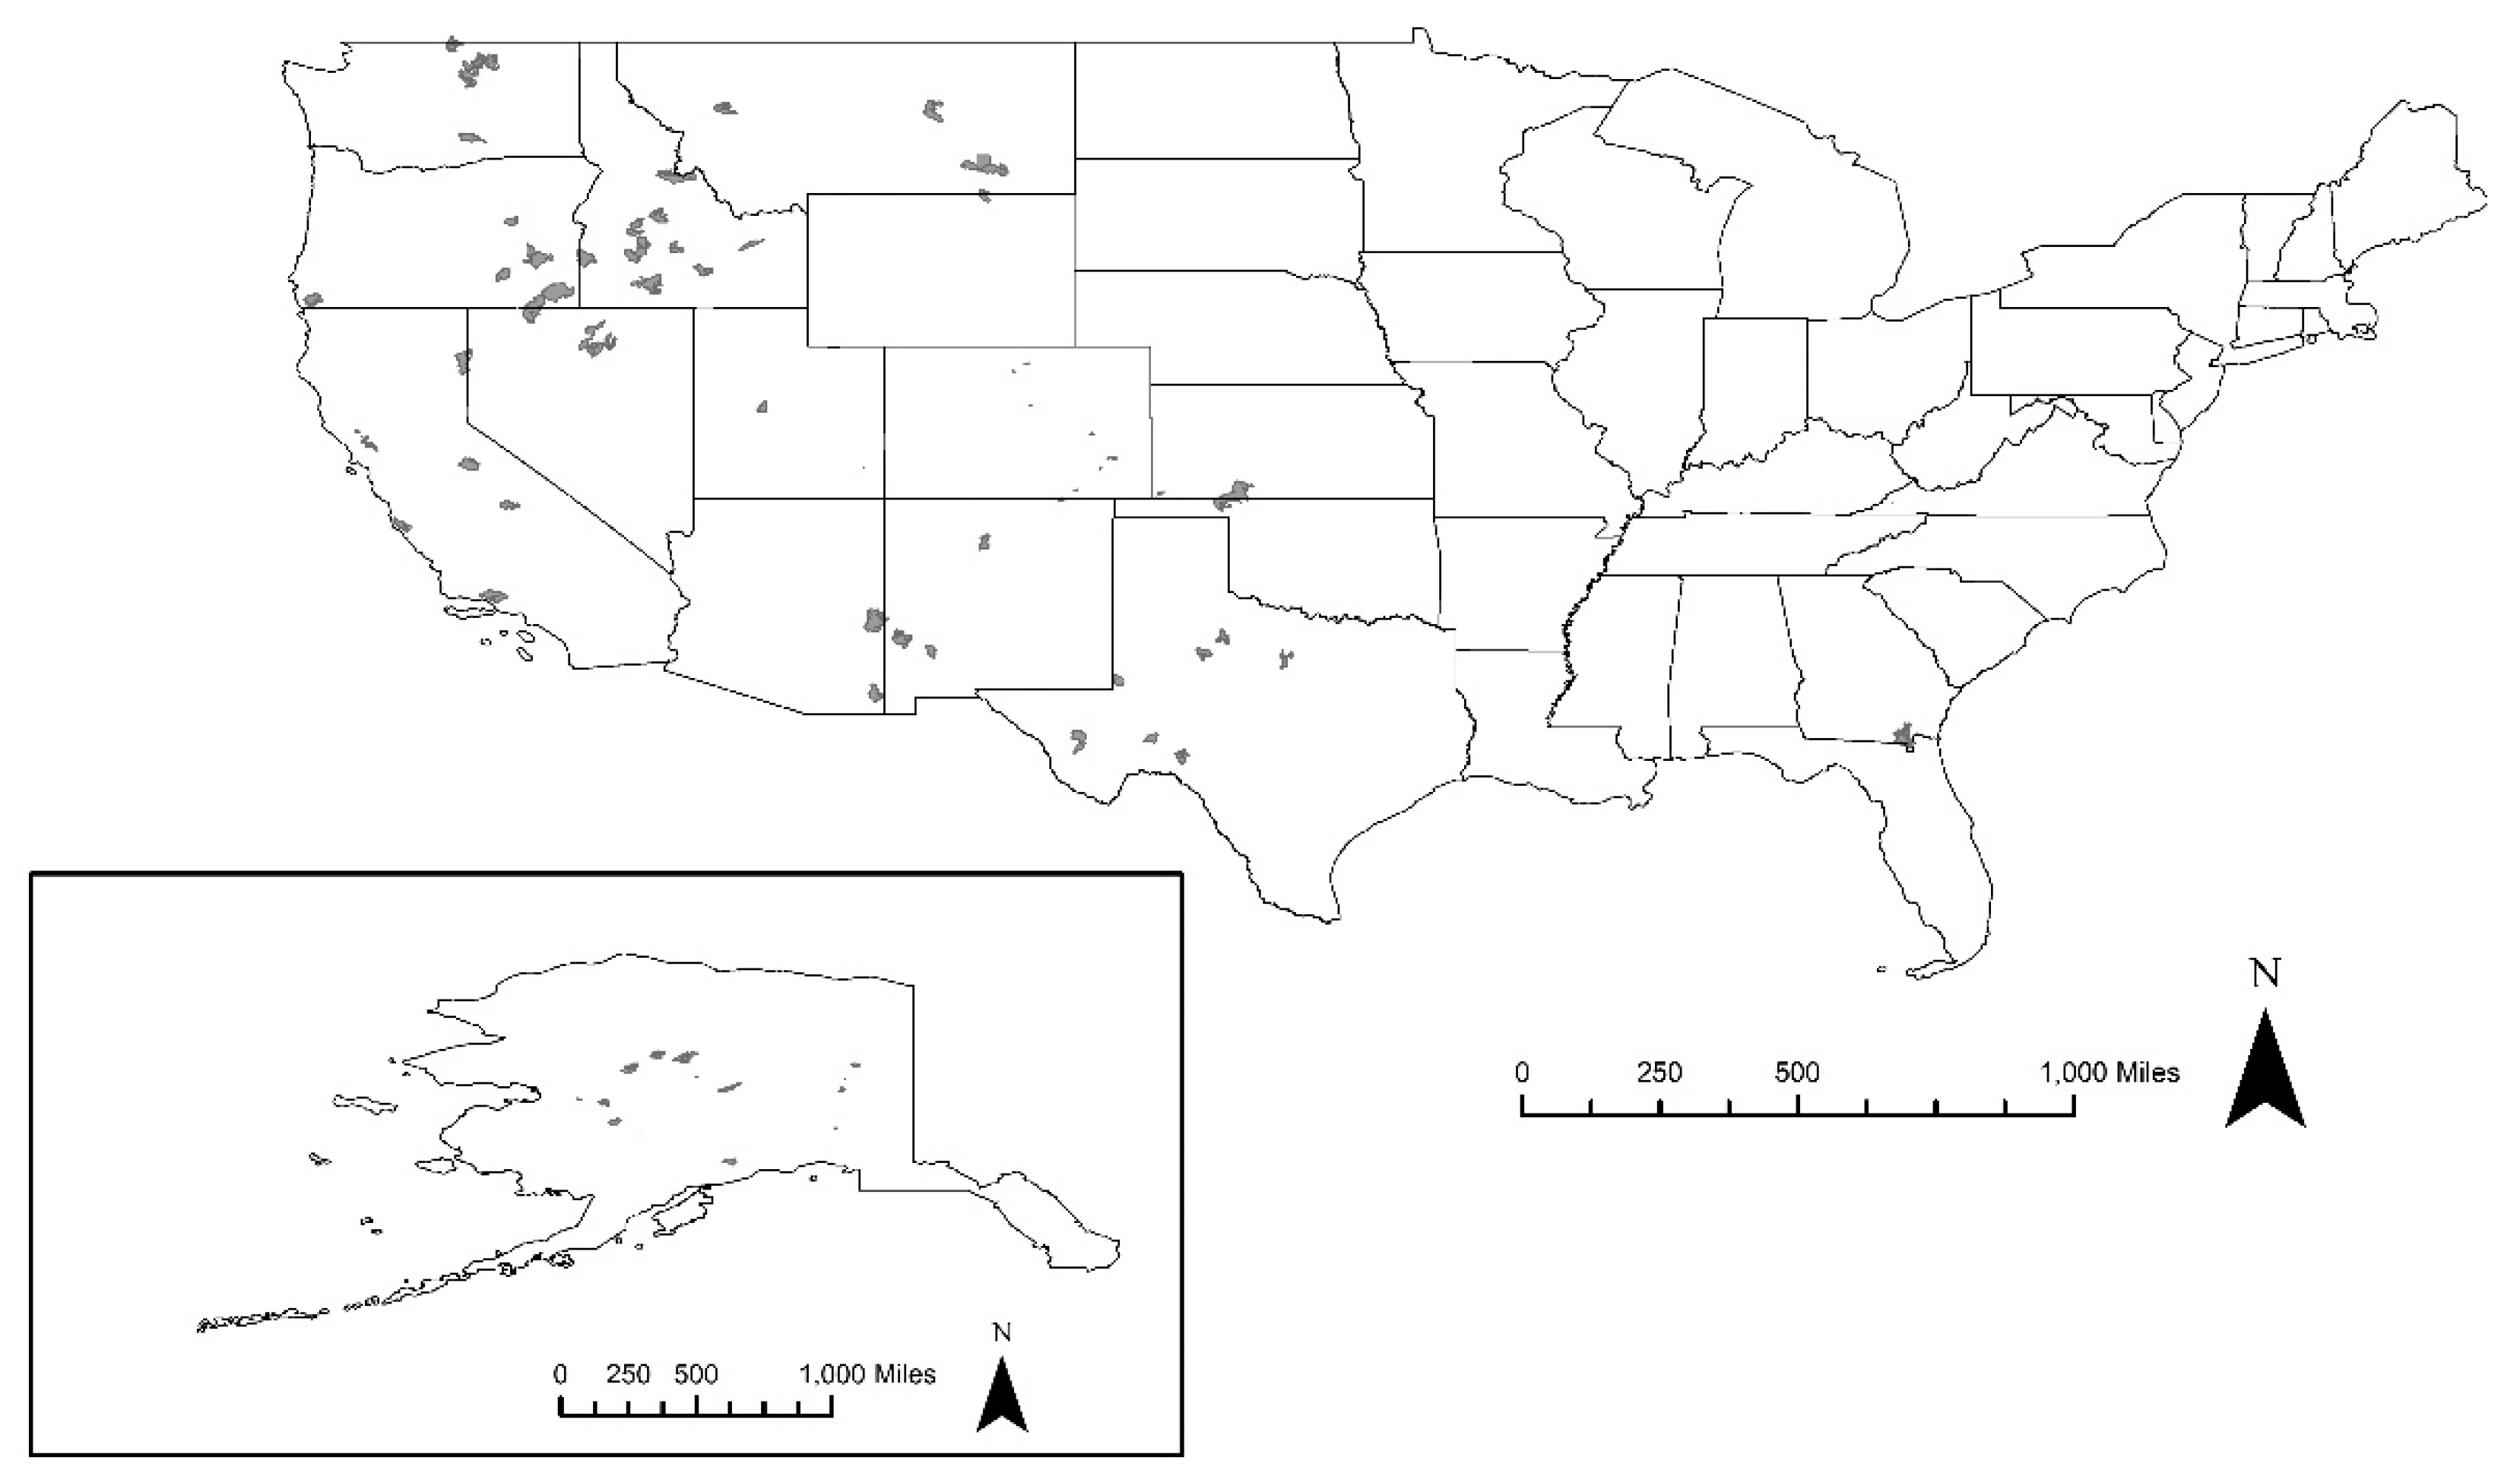
3.2. Megafire Perimeter Data

Data on all US megafire locations over 2010–2017 were obtained from the USGS Geospatial Multi-Agency Coordination (GeoMAC) system. The GeoMAC system is the most complete accounting of US wildfire perimeters and was originally designed to give fire managers near real time fire perimeter information on any US wildfire that was known to the National Interagency Fire Center. In addition to perimeter data, GeoMAC also provides information on the acres burned, the name or designation of the fire, and event narratives. Observations for megafires—i.e., fires whose final perimeter size was >100,000 acres—were retained for further processing. Using GIS software, we then calculated all instances of any >0% megafire perimeter overlap with each county, using data on the final megafire extent. Each county was then assigned information on the characteristics of each megafire that physically burned within its boundaries at some point during the fire event, including information on the date of fire overlap and the total acres burned by the fire. Megafires that spanned more than one county are included in the analysis and the affected counties are appropriately coded as experiencing a fire event. Figure 1 shows the final perimeters for all US megafires between 2010–2017. Most megafires occur in the western US.

3.3. Weather Data

Wildfire frequency and severity is influenced by weather. Thus, to credibly isolate the impacts of megafires, we must account for differential weather conditions in our empirical models. To do so, we collected daily data on maximum and minimum temperature and total precipitation from over 54,000 land-based monitoring stations in the US from the NOAA National Centers for Environmental Information (NCEI). County-level estimates were obtained by using a population weighted averaging approach of all monitoring stations within a 25-mile radius of the population centroid of each county. Weights are equal to the inverse square root of each station’s distance to the population centroid using exact latitude and longitude coordinates. This follows similar approaches in Jones and Goodkind [35] and Levinson [36].
Since the labor market data used are in annual terms, 10 discrete annual mean temperature bins (<40 °F, 40–45 °F, 45–50 °F, 50–55 °F, 55–60 °F, 60–65 °F, 65–70 °F, 70–75 °F, 75–80 °F, and >80 °F), and six discrete annual precipitation bins (<1.5 mm, 1.5–3 mm, 3–4.5 mm, 4.5–6 mm, 6–7.5 mm, and >7.5 mm) were created. Each bin contains the number of days in a given county-year that mean temperature and precipitation fell into the corresponding discrete category. Using discrete weather bins allows us to flexibly control for nonlinear weather effects in the empirical models.

3.4. Sociodemographic Data

Sociodemographic characteristics are related to both megafire activity and labor market outcomes [37,38]. To account for this, data on annual county-level household income and poverty rates were obtained from the US Census Bureau Small Area Income and Poverty Estimates (SAIPE) Program. Additional data on county educational attainment (% of county with HS diploma or GED and % of county with four-year college degree) and on county-level race and ethnicity (Hispanic, African American, Asian, and non-Hispanic white) were obtained from the American Community Survey five-year estimates. These variables will be used to control for non-fire drivers of labor market outcomes.

3.5. Summary Statistics

In what follows, we drop counties experiencing more than one wildfire (megafire or ≤100,000-acre general wildfire) between 2010–2017 so that our analysis can focus only on those counties that experience at most one wildfire during the study period. The labor market impacts associated with experiencing multiple wildfire events (megafires or otherwise) over the study period may be meaningfully different than the impacts associated with a single fire event. However, impacts associated with multiple fires are taken up in more detail in the robustness checks later in the paper (see Section 4.4).
Table 1 provides the final summary statistics among US counties containing a single megafire between 2010 and 2017. The final dataset includes 85 counties across 17 states. Average megafire extent is 203,258 acres, but with a large standard deviation (the largest megafire is >3.1 million acres). Mean per capita annual wage earnings vary from $18,365 (IRS) to $42,113 (REIS) depending on the source of the data. For context, mean US per capita annual wage earnings are $14,932 (IRS) and $31,439 (REIS); thus, megafire counties have generally higher incomes than the nation as a whole.
Since we are using annual county-level data (eight years of data across 85 counties), there is a slight concern about the small sample size available to us (n = 680). This motivates our use of a small sample adjustment in the empirical models that follow (discussed in more detail below).

3.6. Empirical Methodology

Our empirical strategy is to isolate the wage earnings impacts of within county megafires from other environmental and sociodemographic confounding factors. An important component of this strategy is the use of an appropriate set of fixed effects. In all of our estimated models, county fixed effects are included. This will control for unobservable time invariant heterogeneity at the county-level, including factors such as geography (which could influence megafire spread and intensity), time invariant county-level healthcare availability, time invariant employment and labor market characteristics, and cultural norms and practices surrounding wildfire responses that are unchanging in a given county and over time. In addition to county fixed effects, state-by-year fixed effects will also be used. These fixed effects will control for over time heterogeneity in outcomes that are specific to a given state-year (e.g., over time state-level labor market trends, state-specific industrial and employment policies, recessionary impacts, etc.).
Two separate wage earnings models are estimated: (i) a model that captures the single year wage earnings effects of megafires (i.e., effects in the same year as megafire occurrence), and (ii) a model that captures the dynamic over time wage earnings impacts of megafires, starting in Year = 0 (the year of the megafire) and progressing through Year = 7 after initial megafire occurrence. Thus, model (i) will give us an immediate “snapshot” of megafire impacts to wages in a flame zone county during the year of fire occurrence. By contrast, model (ii) will provide a more holistic temporal perspective of the wage impacts of megafires over time, allowing for a study of dynamic trends.
The single year wage earnings model is estimated as,
L o g ( W a g e c t ) = β 0 + β 1 M e g a f i r e c t + X c t β 2 + W c t β 3 + δ c o u n t y + π s t a t e y e a r + ε c t
where L o g ( W a g e c t ) is one of three logged per capita wage earnings measures from the IRS, CBP, or REIS datasets (or an average across all three) in county c in year t ; M e g a f i r e is an indicator variable that equals 1 in the year of a documented megafire event that occurred in a given county (and equals 0 otherwise);   X is a vector of sociodemographic variables (fraction of county with a HS diploma, median household income, poverty rate, fraction of county Hispanic, fraction of county African American, and fraction of county non-Hispanic white); W is a vector of annual discrete weather bins for mean temperature and precipitation ;   δ c o u n t y are the county fixed effects; π s t a t e y e a r are the state-by-year fixed effects; and ε c t is the idiosyncratic error term. The coefficient of interest is β 1 , which provides information on the within county wage earnings impacts of megafires in the year of fire occurrence.
The dynamic wage earnings model is estimated as,
L o g ( W a g e c t ) = p = 3 p = 7 β p 1 [ M F c t = p ] c t + X c t β 2 + W c t β 3 + δ c o u n t y + π s t a t e y e a r + ε c t  
where M F c t denotes the years immediately before and after a megafire event (−3 and +7 years), with 1 [ M F c t = 0 ] c t denoting the year of megafire occurrence (Year = 0). All other terms are as previously defined. The β p coefficients will provide information on the dynamic over time impacts of US megafires in the years immediately following a fire event, up to seven years. Equation (2) will therefore allow for an investigation of the temporal longevity of megafire impacts to wage earnings.
Given our relatively small sample size (owing to using annual county-level data), we follow the recommendations given in Roodman et al. [39] and employ a wild cluster bootstrap (using county-level clustering) to estimate the standard errors. The wild cluster bootstrap will address heteroskedasticity of unknown form when large sample assumptions do not hold and will also account for correlation within clusters. However, it is worth noting that our sample is substantially larger than the n = 30 threshold generally considered to be problematic in inferential statistics (see [40]), thus reducing concerns of small sample bias. Moreover, it has been shown that small sample bias is virtually eliminated in regression models once n = 100 is achieved [41], which our sample size is well above.

4. Results & Discussion

4.1. Single-Year Wage Earnings Results

Results from estimating versions of Equation (1) are presented in Table 2. These results capture the single year effects of megafires in flame zone counties in the year of fire occurrence. Columns (1–3) each use wage earnings data from a different source and an average across all the data sources is used in column (4). In all instances, we observe consistent evidence that per capita wage earnings decline in megafire affected counties in the year of fire occurrence, anywhere from 1.7–2.4%, depending on the source of data used. For context, average per capita earnings in megafire affected counties are $18,365 (IRS), $25,653 (CBP), and $42,113 (REIS), from the summary statistics in Table 1. Thus, the wage earnings impact results in Table 2 indicate that annual wages decline, on average, by $312 (IRS), $538 (CBP), and $1010 (REIS) in the year of megafire occurrence.
There are several possible explanations for a negative wage effect finding. First, commerce in service sectors may be reduced in areas affected by megafires due to evacuations, outmigration, and other disruptions to normal business patterns [28]. This may cause reduced economic activity and fewer labor market opportunities in a given community, pushing down wages. Second, worker health outcomes may diminish in megafire affected counties due to smoke exposure, changes in mental health, lost family members or friends, or for some other reason, which reduces worker productivity and the ability to work, thereby depressing wage earnings. This hypothesis is consistent with prior findings of an inverse relationship between air pollution and productivity (e.g., [42,43]) and with prior work on wildfire smoke exposure and human health (e.g., [44]). Third, since many megafire communities are located in sparsely populated rural areas that are often in or near national and state parks and wilderness areas, it is possible that the environmental impacts of burn scars drive away recreationists and tourists. This could lower wages in affected communities. Interviews done by Davis et al. [31] after a large 2008 fire in California support this hypothesis.
A key implication of the wage earnings result is that it contrasts with the disaster event-wage narrative previously observed for hurricanes where labor market outcomes were found to have improved in hurricane affected communities, presumably due to reconstruction and cleanup efforts and the infusion of government monies [34]. A similar narrative is often conjectured by wildfire researchers, though generally with little empirical evidence, that “fire suppression efforts provide short-term jobs and economic benefits” and that “long-term restoration projects following fire may provide continued employment” [45]. However, as our results demonstrate, the nationwide empirical evidence does not seem to support such a statement, at least for megafires in particular. This may be because wildfires generate different economic impacts versus other disasters, such as hurricanes, due to differences in the length of the events and the presence of suppression activities during a fire event, as discussed in Davis et al. [31]. This leads to a complicated relationship between wildfires and labor market outcomes, as found in Davis et al. [31], where positive wage and employment benefits are not guaranteed, consistent with our own findings in Table 2. Nielsen-Pincus et al. [28] found positive wage earnings effects of wildfires in the quarter of fire occurrence, contrasting with our results here, but they did not look specifically at megafires nor did their model account for underlying weather and sociodemographic conditions or include as robust a set of fixed effects as employed here. These differences may possibly lead to different findings, especially since megafires tend to have substantively different (i.e., more consequential) impacts on local communities compared to general wildfire events [46]. Alternatively, it is possible that some threshold exists where the wage impacts of wildfires turn negative as the extent and severity of the fire increases. This might explain the positive wage earnings finding in Nielsen-Pincus et al. [28] for general wildfires (including smaller non-megafire events) compared to the negative wage results found in the current work for megafires, in particular (and we preliminarily explore this possibility in Section 3.6).

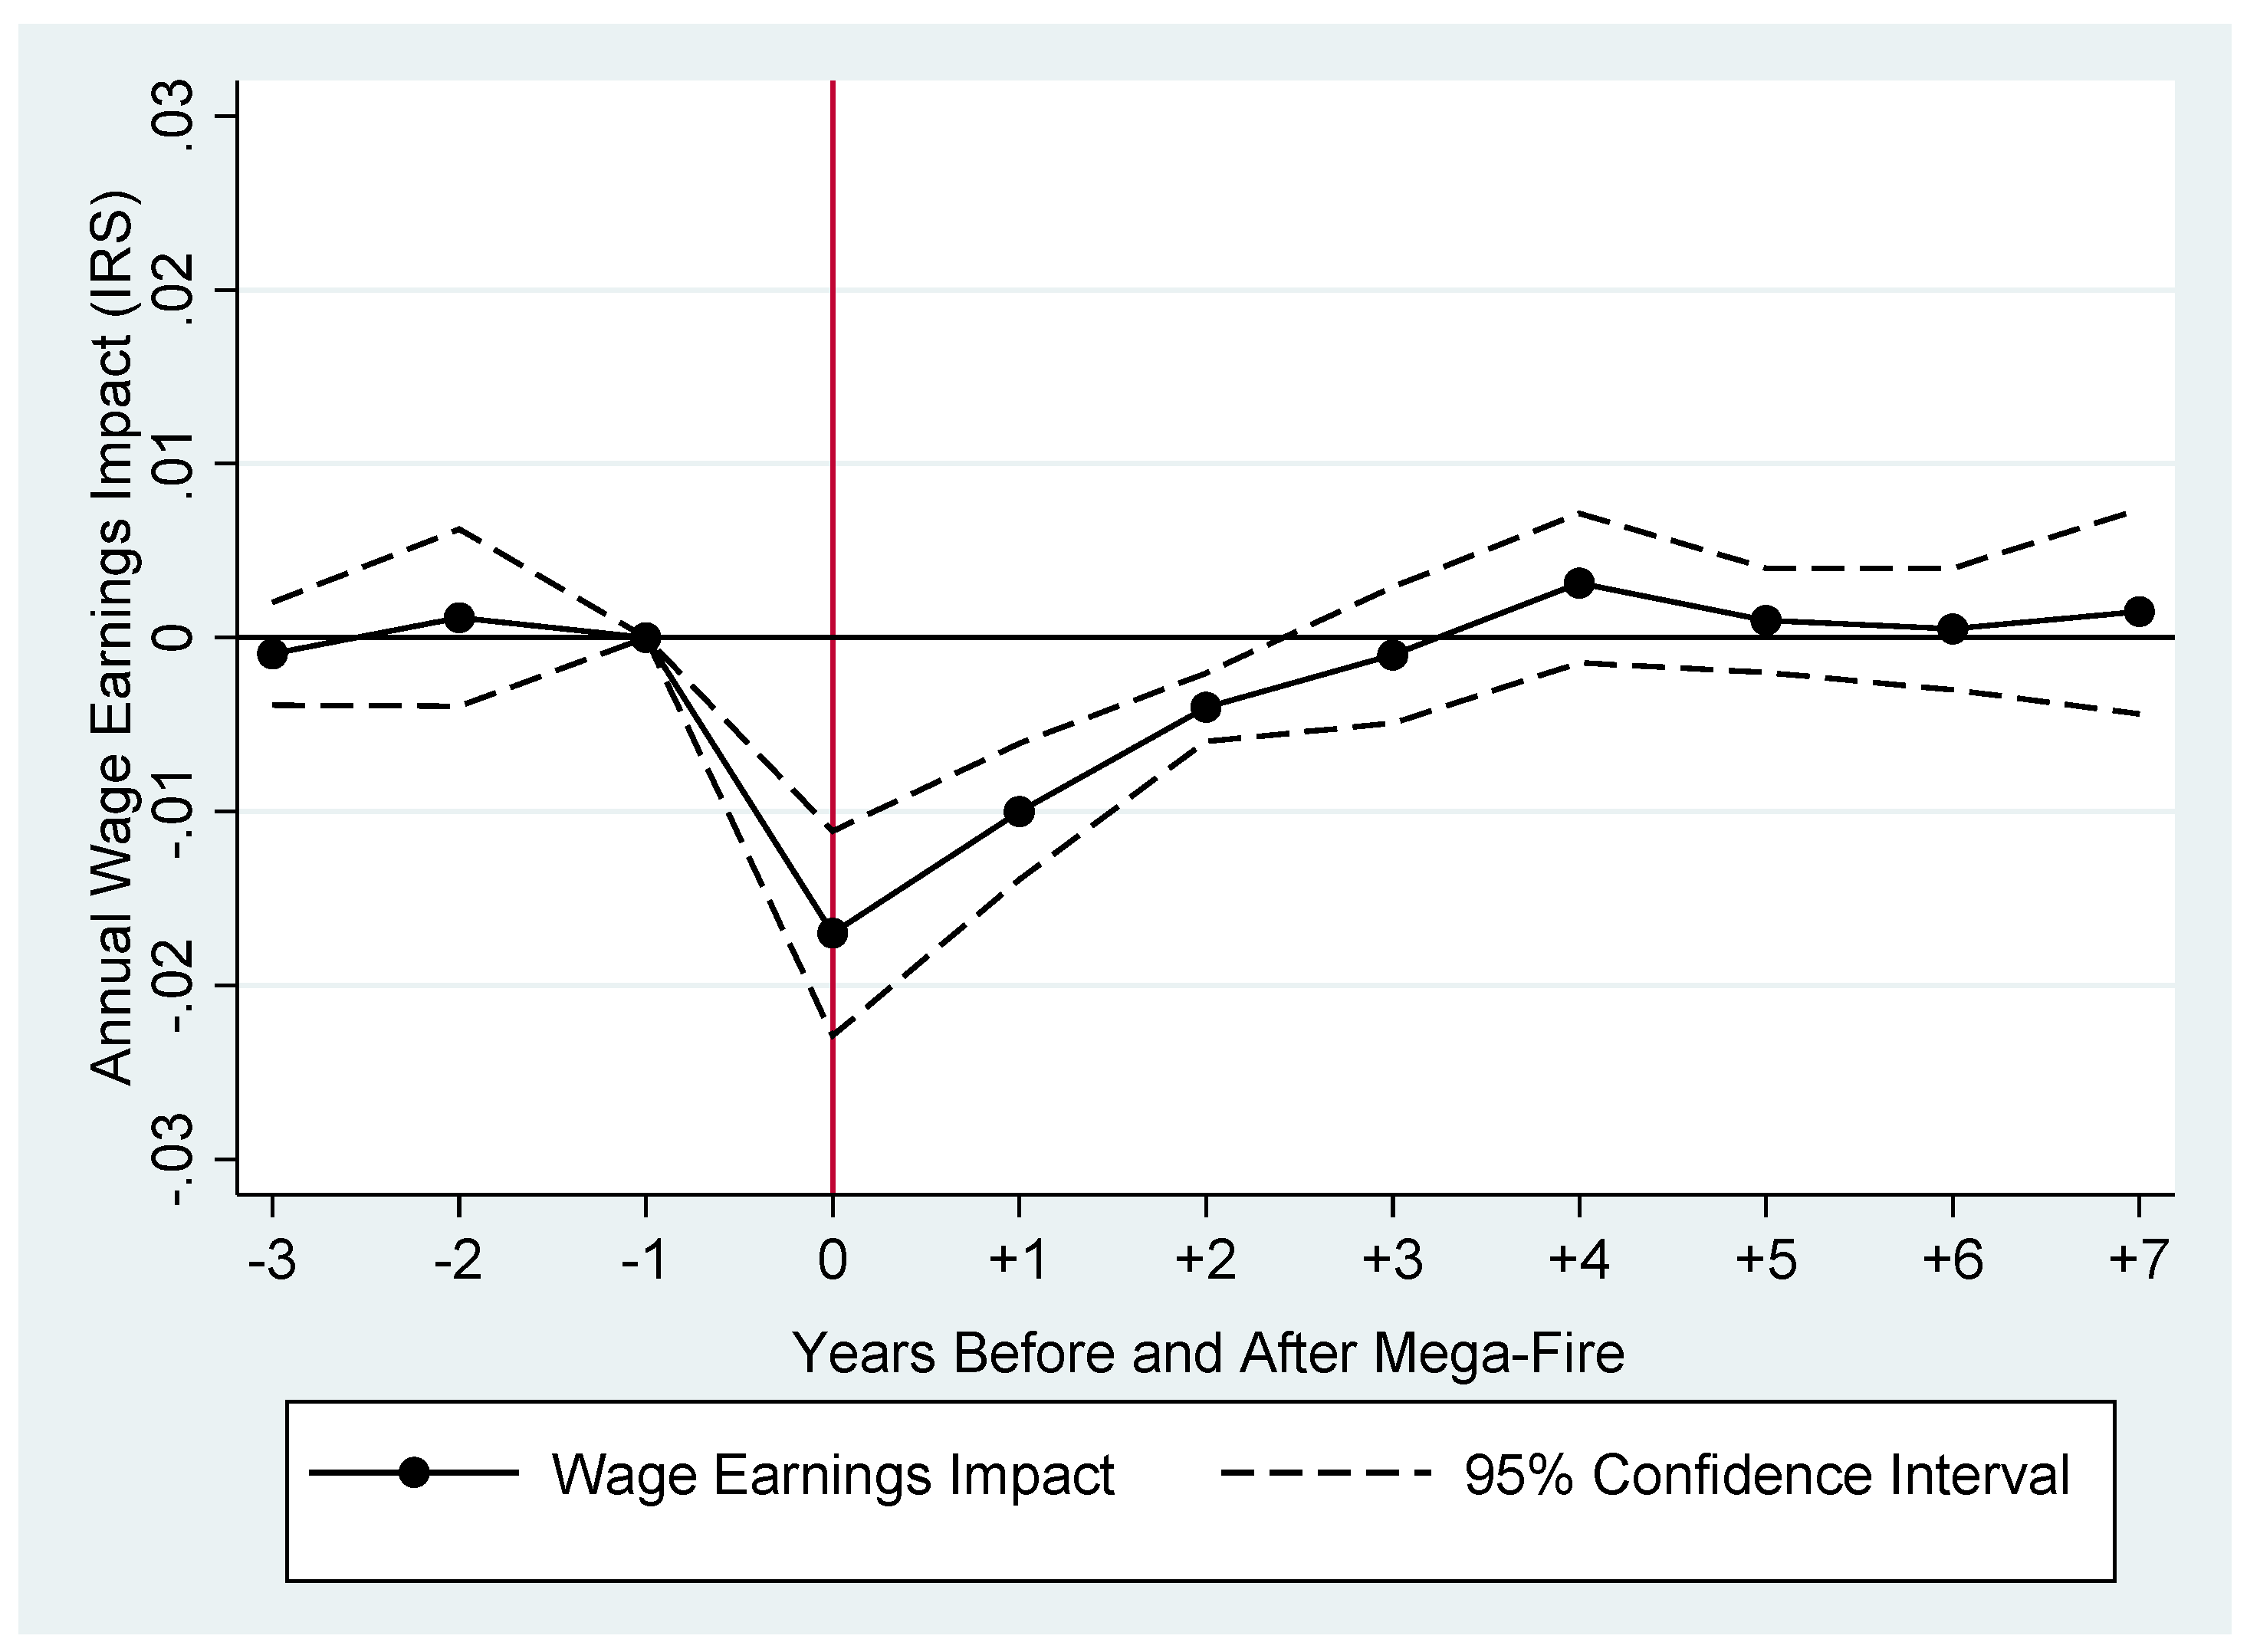
4.2. Dynamic Trends in Wage Earnings Impacts

Results from estimating Equation (2) are shown in Figure 2. For simplicity, only the IRS wage earnings data are used here, though using either the CBP or REIS data produced qualitatively similar figures. Figure 2 shows a clear negative effect of megafires on local wage earnings in the year of event occurrence (Year = 0), of −1.7%. Interestingly, the effect persists, though at diminishing magnitudes, into Year = +1 (−1%) and Year = +2 (−0.4%). In Year = +3 and onward, the effects are negligible and are generally precisely estimated zeros, suggesting that the local wage impacts of megafires last for up to two years, at most, after initial fire occurrence. Additionally, the precisely estimated zeros for the years prior to megafire occurrence (Year = −3 and = −2) are causally consistent and act as an important placebo test because they show that there are no local wage impacts of megafires prior to when they actually occurred.
Cumulatively, if we add together the significant single year marginal effects in Figure 2, we find that megafires lower annual IRS wage earnings by a total of 1.7% + 1.0% + 0.4% = 3.1% over a two-year period. Put differently, the average worker in a megafire affected community experiences approximately $569 in total lost labor income in years 0, 1, and 2 after a single megafire occurs in their county-of-residence, based on average annual IRS wage earnings of $18,365 from Table 1. To provide context for this finding, prior research has shown that wildfires can have legacy effects on the social and economic fabric of affected communities, including longer-term impacts on social networks, mental health, stress, availability of medical care, labor market opportunities, and personal financial conditions (e.g., [6,45]). Consistent with this body of work, we are observing persistent wage earnings impacts of megafires for several years after the fire has been extinguished. That is, there is suggestive evidence that megafires have both immediate and medium-term negative effects on labor market conditions in affected communities. However, the effects tend to diminish in magnitude over time, perhaps due to federal and state disaster relief monies or insurance claim payouts, economic rebuilding efforts, or a return to normal economic and commerce conditions that existed prior to megafire event occurrence.

4.3. Heterogeneity in Wage Impacts by Megafire Size

There is little prior literature on how the labor market impacts of wildfires vary by fire attributes, and none, to the best of our knowledge, specifically looking at megafires (though see [5] for a recent example as applied to megafire size and infant health). Thus, in the spirit of Moeltner et al. [47], we preliminarily investigate how the wage earnings impacts of megafires vary based on megafire burn extent. Note that the nature of the relationship between wage impacts and megafire size is not immediately clear. On the one hand, we might expect impacts to increase in fire size due to potentially greater smoke production and environmental damage. However, on the other hand, impacts may potentially be constant or even decreasing in size since larger fires also tend to receive more fire suppression, media attention, and greater disaster and post-disaster relief resources, which may attenuate the wage impacts associated with larger fire events.
As a preliminary attempt to gain some clarity on this issue, we created three new indicator variables for megafire status based on the final burn area of the fire: 100,000–150,000, 150,000–250,000, and >250,000 acres. Equation (1) was then re-estimated using these new indicators in place of M e g a f i r e c t and the results are reported in Table 3. We find evidence that the adverse impacts of megafires on within-county wage earnings are increasing in fire size. There is also some suggestive evidence of nonlinearity—i.e., impacts that are increasing at an increasing rate in fire extent. The wage impacts of differently sized megafires (using an average of IRS, CBP, and REIS data; Table 3, column (4)) are −0.3% for fires 100 k–150 k acres in size, −0.8% for fires sized 150 k–250 k acres, and −4.6% for >250 k acre fires. That is, the wage impacts for the largest megafires (those >250 k acres) are over 15 times larger than impacts for the smallest megafires (those 100 k–150 k acres), suggestive of nonlinearity. It is not immediately obvious what is driving this heterogeneity, but the result does highlight the fact that not all megafires are created equal. In particular, learning to sustainably coexist with megafires, and wildfires more generally, may require greater suppression and disaster relief investments per acre burned for larger fires compared to smaller ones. Additionally, these heterogeneity results provide initial suggestive evidence that the wage earnings impacts of wildfires are smaller for smaller fires. It may even be possible that smaller fires than those considered here (i.e., non-megafires) generate negligible or even positive wage earnings impacts, consistent with the trend observed in Table 3 and also consistent with prior work on general wildfire impacts [28], though an exploration of this issue is left to future work.

4.4. Robustness Checks

Several robustness check results are presented in Table 4. In panel A, counties experiencing >1 wildfire or megafire event over 2010–2017 are added back into the analysis; recall that these n = 21 counties were previously dropped. Results are negligibly changed when these additional counties are included in the regressions. This suggests that the single year wage earnings impacts of megafires are similar for communities that rarely experience fire events compared to those communities that also recently experienced another megafire or general wildfire. Future work might study the sustainability implications of this finding. In panel B, we restrict the data to include only those counties where at least 20% of the county land area was burned by the megafire. This is a check on whether our >0% county overlap inclusion criterion used for the main results was too restrictive. Results are again negligibly changed due to this data re-specification, though the sample sizes are significantly reduced (due to some counties experiencing little megafire extent overlap). In panel C, the analysis is restricted to only those counties containing a major urban area with a population of at least 250,000 people. The wage earnings results are slightly smaller in magnitude now compared to the main results in Table 2, suggestive that counties containing populated urban centers experience reduced wage effects of megafires. There is no immediate explanation for this finding, but one possibility is that large urban centers have a diverse array of commerce and economic activity, such that megafires are less impactful in relative terms. However, given the extremely small sample sizes associated with this specification, the results should be taken as only suggestive. In panel D, we evaluate megafire impacts among non-California counties only. This is a check on whether our results are being driven by California alone, which, if true, would reduce results generalizability. However, we find similar magnitudes of effect as before, indicating that California impacts are not driving the main results; the negative impacts of megafires hold generally. Lastly, in panel E the wage impacts of megafires in counties immediately adjacent to megafire affected counties are studied. It is possible that wages in neighboring counties could be affected by proximal fire events if individuals live in one county, but work in another one, for example. We find some evidence of such a “spillover” effect, but the magnitude of the effect is 4–5 times smaller than the wage impacts observed in flame zone counties.

5. Conclusions

This paper investigated the local labor market impacts of US megafires over 2010–2017. We find that counties located within a megafire flame zone experience significantly lower per capita wage earnings in the year of a megafire and for up to two years after fire occurrence. To the best of our knowledge, this is the first comprehensive nationwide study of megafire wage earnings impacts on communities located within the fire perimeter, thereby shedding “new light” on the social and economic effects of megafires.
There are several important takeaways from this study. First, our finding that wages are negatively impacted by megafires contrasts with other nature disaster literature and studies from smaller wildfires. This result also provides important insight into the vulnerabilities labor markets face in a changing climate, in addition to other costs that should be factored into climate change benefit-cost analysis. Second, given the multi-year period of time studied in this work, we can provide preliminary evidence that megafire impacts, while greatest during the year of the actual fire event, do seem to persist for several years after the fire has been extinguished, though at decreasing rates. This is an important contribution to our understanding of megafires impacts and warrants further attention and scrutiny. Third, our negative wage earnings findings for several years post-fire provide new information to ongoing debates within the extant literature on local wildfire economic impacts, which has previously found a mixture of both short-term positive and long-term positive and negative wage earnings impacts (e.g., [28]). Differences between prior literature and our work might be driven by our use of a stronger set of fixed effects to control for seasonality and unobservable heterogeneity or because we focus on megafires, which might have more devastating impacts on local economies compared to smaller wildfire events. Finally, since megafire impacts on wages are nonlinear in fire burn area, an economic case can be made to justify disproportionate management responses to large megafires, specifically, those >250 k acres. Impacts of >250 k acre megafires are over 15 times larger than impacts among fires 100 k–250 k acres. This result supports previous research that calls for more suppression costs per acre burned for megafires than smaller wildfires [5].
One limitation of this study is that the specific mechanisms by which local megafires translate into differential wage outcomes were not studied. The small sample sizes available to us in the wage earnings data make it impossible to reliably parse the data into specific occupations or clusters of occupations that might be differentially affected by megafires. Additionally, our use of annual data (which is the finest time scale available across all three of the wage earnings datasets) precludes us from investigating how daily changes in smoke conditions, burn severity, and daily suppression activities might be driving the wage impact effects found in this work. Future work might consider studying these relevant mechanisms and pathways of effect.
As megafires continue to grow in frequency in the US (and globally), there is increased interest in improving our understanding of their direct and indirect impacts on society. This is important as we adapt to live sustainably with fire. The present study contributes to this ongoing line of inquiry and has the potential to be highly impactful both from an academic perspective, but, perhaps more importantly, from a policy application perspective where concerns regarding megafire management and forest fuels reductions for the prevention of megafires continue to be hotly debated in the wildfire policy domain [48].
In the spirit of Albert Einstein, we can’t solve the problem of increased megafires using the same kind of thinking that led us to this point. In other words, as we learn to coexist with megafires and wildfires in a climate-altered world, we need a better understanding of their impacts on economies to motivate suppression, control, and prevention decisions. Importantly, this work highlights the disproportionate human costs of megafires as they grow in size and extent. Developing a sustainable wildfire policy requires human ingenuity, and our results show the importance of finding a path forward that minimizes impacts to our most important resource.

Author Contributions

Conceptualization, B.A.J. and S.M.; methodology, B.A.J.; software, B.A.J.; validation, B.A.J.; formal analysis, B.A.J.; investigation, B.A.J.; data curation, B.A.J.; writing—original draft preparation, B.A.J. and S.M.; writing—review and editing, B.A.J. and S.M.; visualization, B.A.J.; project administration, B.A.J. and S.M. All authors have read and agreed to the published version of the manuscript.

Funding

This research received no external funding.

Institutional Review Board Statement

Not applicable.

Conflicts of Interest

The authors declare no conflict of interest.

References

  1. Let’s Stop Megafires before They Start: Invest in Forest Restoration and Fire Resilient Communities. Nat. Conserv. 2020. Available online: https://www.nature.org/en-us/about-us/where-we-work/united-states/california/stories-in-california/californias-wildfire-future/ (accessed on 1 August 2021).
  2. Struzik, E. The age of megafires: The world hits a climate tipping point. YaleEnvironment360. 17 September 2020. Available online: https://e360.yale.edu/features/the-age-of-megafires-the-world-hits-a-climate-tipping-point (accessed on 1 August 2021).
  3. Williams, J.; Albright, D.; Hoffmann, A.A.; Eritsov, A.; Moore, P.F.; Mendes De Morais, J.; Leonard, M.; San Miguel-Ayanz, J.; Xanthopoulos, G.; Van Lierop, P. Findings and Implications from a Coarse-Scale Global Assessment of Recent Selected Mega-Fires. In Proceedings of the FAO at the Vth International Wildland Fire Conference, Sun City, South Africa, 9–13 May 2011; pp. 27–40. [Google Scholar]
  4. Budget Justifications and Performance Information Fiscal Year 2021: Wildland Fire Management; The U.S. Department of the Interior: Washington, DC, USA, 2021.
  5. Jones, B.A.; McDermott, S. Infant Health Outcomes in Mega-Fire Affected Communities. Appl. Econ. Lett. 2021, 1–11, in press. [Google Scholar] [CrossRef]
  6. Stephenson, C.; Handmer, J.; Betts, R. Estimating the Economic, Social and Environmental Impacts of Wildfires in Australia. Environ. Hazards 2013, 12, 93–111. [Google Scholar] [CrossRef]
  7. Fann, N.; Alman, B.; Broome, R.A.; Morgan, G.G.; Johnston, F.H.; Pouliot, G.; Rappold, A.G. The Health Impacts and Economic Value of Wildland Fire Episodes in the US: 2008–2012. Sci. Total Environ. 2018, 610, 802–809. [Google Scholar] [CrossRef]
  8. Jones, B.A. Willingness to Pay Estimates for Wildfire Smoke Health Impacts in the US Using the Life Satisfaction Approach. J. Environ. Econ. Policy 2018, 7, 403–419. [Google Scholar] [CrossRef]
  9. Nielsen-Pincus, M.; Moseley, C.; Gebert, K. Job Growth and Loss across Sectors and Time in the Western US: The Impact of Large Wildfires. For. Policy Econ. 2014, 38, 199–206. [Google Scholar] [CrossRef] [Green Version]
  10. Hohner, A.K.; Rhoades, C.C.; Wilkerson, P.; Rosario-Ortiz, F.L. Wildfires Alter Forest Watersheds and Threaten Drinking Water Quality. Acc. Chem. Res. 2019, 52, 1234–1244. [Google Scholar] [CrossRef]
  11. Smith, H.G.; Sheridan, G.J.; Lane, P.N.; Nyman, P.; Haydon, S. Wildfire Effects on Water Quality in Forest Catchments: A Review with Implications for Water Supply. J. Hydrol. 2011, 396, 170–192. [Google Scholar] [CrossRef]
  12. Bowman, D.M.J.S.; Balch, J.; Artaxo, P.; Bond, W.J.; Cochrane, M.A.; D’Antonio, C.M.; DeFries, R.; Johnston, F.H.; Keeley, J.E.; Krawchuk, M.A.; et al. The Human Dimension of Fire Regimes on Earth. J. Biogeogr. 2011, 38, 2223–2236. [Google Scholar] [CrossRef] [Green Version]
  13. International Association of Wildland Fire. Position Paper: Reduce Wildfire Risks or We’ll Continue to Pay More for Fire Disasters. 2015. Available online: https://www.iawfonline.org/article/reduce-wildfire-risks-or-pay-more-for-fire-disasters/ (accessed on 1 August 2021).
  14. Kirchberger, M. Natural Disasters and Labor Markets. J. Dev. Econ. 2017, 125, 40–58. [Google Scholar] [CrossRef] [Green Version]
  15. Higuchi, Y.; Inui, T.; Hosoi, T.; Takabe, I.; Kawakami, A. The Impact of the Great East Japan Earthquake on the Labor Market—Need to Resolve the Employment Mismatch in the Disaster-Stricken Areas. Jpn. Labor Rev. 2012, 9, 4–21. [Google Scholar]
  16. Groen, J.A.; Polivka, A.E. The Effect of Hurricane Katrina on the Labor Market Outcomes of Evacuees. Am. Econ. Rev. 2008, 98, 43–48. [Google Scholar] [CrossRef] [Green Version]
  17. Westerling, A.L.; Hidalgo, H.G.; Cayan, D.R.; Swetnam, T.W. Warming and Earlier Spring Increase Western US Forest Wildfire Activity. Science 2006, 313, 940–943. [Google Scholar] [CrossRef] [PubMed] [Green Version]
  18. Mote, P.W.; Hamlet, A.F.; Clark, M.P.; Lettenmaier, D.P. Declining Mountain Snowpack in Western North America. Bull. Am. Meteorol. Soc. 2005, 86, 39–50. [Google Scholar] [CrossRef]
  19. Stewart, I.T.; Cayan, D.R.; Dettinger, M.D. Changes toward Earlier Streamflow Timing across Western North America. J. Clim. 2005, 18, 1136–1155. [Google Scholar] [CrossRef]
  20. Lareau, N.P.; Clements, C.B. Environmental Controls on Pyrocumulus and Pyrocumulonimbus Initiation and Development. Atmos. Chem. Phys. 2016, 16, 4005–4022. [Google Scholar] [CrossRef] [Green Version]
  21. Forthofer, J.M.; Goodrick, S.L. Review of Vortices in Wildland Fire. J. Combust. 2011, 2011. [Google Scholar] [CrossRef]
  22. Bytnerowicz, A.; Hsu, Y.-M.; Percy, K.; Legge, A.; Fenn, M.E.; Schilling, S.; Frączek, W.; Alexander, D. Ground level Air Pollution Changes during a Boreal Wildland Mega-Fire. Sci. Total Environ. 2016, 572, 755–769. [Google Scholar] [CrossRef]
  23. Khawand, C. Air Quality, Mortality, and Perinatal Health: Causal Evidence from Wildfires; Working Paper; 2015; Available online: https://ideas.repec.org/jmp/2015/pkh318.pdf. (accessed on 1 August 2021).
  24. Phuleria, H.C.; Fine, P.M.; Zhu, Y.; Sioutas, C. Air Quality Impacts of the October 2003 Southern California Wildfires. J. Geophys. Res. Atmos. 2005, 110. [Google Scholar] [CrossRef] [Green Version]
  25. Navarro, K.M.; Cisneros, R.; O’Neill, S.M.; Schweizer, D.; Larkin, N.K.; Balmes, J.R. Air-Quality Impacts and Intake Fraction of PM2. 5 during the 2013 Rim Megafire. Environ. Sci. Technol. 2016, 50, 11965–11973. [Google Scholar] [CrossRef]
  26. Keegan, C.E.; Morgan, T.A.; Hearst, A.L.; Fiedler, C.E. Impacts of the 2000 Wildfires on Montana’s Forest Industry Employment. For. Prod. J. 2004, 54, 26–28. [Google Scholar]
  27. Mosley, C.; Gebert, K.; Jakes, P.; Leete, L.; Nielsen-Pincus, M.; Davis, E.J.; Evers, C.; Rishel, B.; Sundstrom, S. The Economic Effects of Large Wildfires; JFSP Research Project Reports. 55; 2013; Available online: http://digitalcommons.unl.edu/jfspresearch/55 (accessed on 1 August 2021).
  28. Nielsen-Pincus, M.; Moseley, C.; Gebert, K. The Effects of Large Wildfires on Employment and Wage Growth and Volatility in the Western United States. J. For. 2013, 111, 404–411. [Google Scholar] [CrossRef]
  29. Borgschulte, M.; Molitor, D.; Zou, E. Air Pollution and the Labor Market: Evidence from Wildfire Smoke; Working Paper; 2018; Available online: https://static1.squarespace.com/static/56034c20e4b047f1e0c1bfca/t/5f3a910df2f2fd38e695321b/1597673744847/Smoke_and_Labor.pdf. (accessed on 1 August 2021).
  30. Economou, F.; Prodromidis, P.; Skintzi, G. Large Fire Disaster and the Regional Economy: The 2007 Case of the Peloponnese. South-East. Eur. J. Econ. 2019, 17, 7–31. [Google Scholar]
  31. Davis, E.J.; Moseley, C.; Nielsen-Pincus, M.; Jakes, P.J. The Community Economic Impacts of Large Wildfires: A Case Study from Trinity County, California. Soc. Nat. Resour. 2014, 27, 983–993. [Google Scholar] [CrossRef]
  32. Mercer, D.E.; Prestemon, J.P. Comparing Production Function Models for Wildfire Risk Analysis in the Wildland–Urban Interface. For. Policy Econ. 2005, 7, 782–795. [Google Scholar] [CrossRef]
  33. Mu, J.E.; Chen, Y. Impacts of Large Natural Disasters on Regional Income. Nat. Hazards 2016, 83, 1485–1503. [Google Scholar] [CrossRef]
  34. Belasen, A.R.; Polachek, S.W. How Hurricanes Affect Wages and Employment in Local Labor Markets. Am. Econ. Rev. 2008, 98, 49–53. [Google Scholar] [CrossRef]
  35. Jones, B.A.; Goodkind, A.L. Urban Afforestation and Infant Health: Evidence from MillionTreesNYC. J. Environ. Econ. Manag. 2019, 95, 26–44. [Google Scholar] [CrossRef]
  36. Levinson, A. Valuing Public Goods Using Happiness Data: The Case of Air Quality. J. Public Econ. 2012, 96, 869–880. [Google Scholar] [CrossRef]
  37. Masri, S.; Scaduto, E.; Jin, Y.; Wu, J. Disproportionate Impacts of Wildfires among Elderly and Low-Income Communities in California from 2000–2020. Int. J. Environ. Res. Public Health 2021, 18, 3921. [Google Scholar] [CrossRef]
  38. Browne, I.; Misra, J. The Intersection of Gender and Race in the Labor Market. Annu. Rev. Sociol. 2003, 29, 487–513. [Google Scholar] [CrossRef]
  39. Roodman, D.; Nielsen, M.Ø.; MacKinnon, J.G.; Webb, M.D. Fast and Wild: Bootstrap Inference in Stata Using Boottest. Stata J. 2019, 19, 4–60. [Google Scholar] [CrossRef] [Green Version]
  40. Atilgan, H. Sample Size for Estimation of g and Phi Coefficients in Generalizability Theory. Eurasian J. Educ. Res. 2013, 51, 215–227. [Google Scholar]
  41. Maas, C.J.; Hox, J.J. Sufficient Sample Sizes for Multilevel Modeling. Methodology 2005, 1, 86–92. [Google Scholar] [CrossRef] [Green Version]
  42. Chang, T.Y.; Graff Zivin, J.; Gross, T.; Neidell, M. The Effect of Pollution on Worker Productivity: Evidence from Call Center Workers in China. Am. Econ. J. Appl. Econ. 2019, 11, 151–172. [Google Scholar] [CrossRef] [Green Version]
  43. Chang, T.; Graff Zivin, J.; Gross, T.; Neidell, M. Particulate Pollution and the Productivity of Pear Packers. Am. Econ. J. Econ. Policy 2016, 8, 141–169. [Google Scholar] [CrossRef] [Green Version]
  44. Adetona, O.; Reinhardt, T.E.; Domitrovich, J.; Broyles, G.; Adetona, A.M.; Kleinman, M.T.; Ottmar, R.D.; Naeher, L.P. Review of the Health Effects of Wildland Fire Smoke on Wildland Firefighters and the Public. Inhal. Toxicol. 2016, 28, 95–139. [Google Scholar] [CrossRef]
  45. Morton, D.C.; Roessing, M.E.; Camp, A.E.; Tyrrell, M.L. Assessing the Environmental, Social, and Economic Impacts of Wildfire. In GISF Research Paper 001 Forest Health Initiative; Yale University School of Forestry & Environmental Studies: New Haven, CT, USA, 2003. [Google Scholar]
  46. Ferreira-Leite, F.; Bento-Gonçalves, A.; Vieira, A.; da Vinha, L. Mega-Fires around the World: A Literature Review. In Wildland Fires: A Worldwide Reality’; Gonçalves, A.J.B., Vieira, A.A.B., Eds.; Nova Science Publishers: Hauppauge, NY, USA, 2015; pp. 15–33. [Google Scholar]
  47. Moeltner, K.; Kim, M.-K.; Zhu, E.; Yang, W. Wildfire Smoke and Health Impacts: A Closer Look at Fire Attributes and Their Marginal Effects. J. Environ. Econ. Manag. 2013, 66, 476–496. [Google Scholar] [CrossRef]
  48. North, M.P.; Stephens, S.L.; Collins, B.M.; Agee, J.K.; APleT, G.; Franklin, J.F.; Fule, P.Z. Reform Forest Fire Management. Science 2015, 349, 1280–1281. [Google Scholar] [CrossRef]
Figure 1. US Megafire Perimeters, 2010–2017. Data source: USGS GeoMAC and authors’ calculations.
Sustainability 13 09078 g001
Figure 2. Dynamic Impacts of Megafires on Annual IRS Wage Earnings (Event Study Plot). Notes: regression results from estimating Equation (2) are shown for the dynamic impact of a single megafire event on annual IRS wage earnings (coeff. × 100 to put in % terms) in counties where a megafire occurred. Year = −1 is the omitted base and Year = 0 is the year of megafire occurrence. Wild cluster bootstrap standard errors used.
Sustainability 13 09078 g002
Table 1. Summary Statistics for Megafire Counties (n = 680; Years 2010–2017).
VariableMeanStd. Dev.
Per capita wage earnings (IRS) (2017$)18,365.854624.80
Per capita wage earnings (CBP) (2017$)25,653.9410,620.14
Per capita wage earnings (REIS) (2017$)42,113.168451.19
Megafire size (acres)203,258.10173,779.9
Fraction of county with HS diploma0.8140.083
Fraction of county with 4-year college degree0.2540.088
Fraction of county Hispanic0.3850.190
Fraction of county African American0.0240.016
Fraction of county Asian0.0470.033
Fraction of county non-Hispanic white0.4980.203
Median household income55,197.712,858.3
Poverty rate0.1740.068
Num. of days per year mean temp. <40 °F44.9660.18
Num. of days per year mean temp. 40–45 °F22.5216.15
Num. of days per year mean temp. 45–50 °F35.1413.81
Num. of days per year mean temp. 50–55 °F43.6915.51
Num. of days per year mean temp. 55–60 °F48.8724.73
Num. of days per year mean temp. 60–65 °F50.5825.69
Num. of days per year mean temp. 65–70 °F43.7120.53
Num. of days per year mean temp. 70–75 °F30.3514.59
Num. of days per year mean temp. 75–80 °F22.3319.02
Num. of days per year mean temp. > 80 °F22.7532.02
Num. of days per year precipitation < 1.5mm315.6123.30
Num. of days per year precipitation 1.5–3mm16.079.29
Num. of days per year precipitation 3–4.5mm8.684.89
Num. of days per year precipitation 4.5–6mm5.383.59
Num. of days per year precipitation 6–7.5mm4.212.69
Num. of days per year precipitation > 7.5mm15.1411.00
Sources: IRS SOI, US Census Bureau CBP, BEA REIS, USGS GeoMAC, US Census Bureau SAIPE Program, American Community Survey, NOAA NCEI.
Table 2. Single Year Wage Earnings Impacts of US Megafires, 2010–2017.
(1)(2)(3)(4)
Dep. variable: Log per capita wage earnings (coef. × 100)
IRSCBPREISAverage of IRS, CBP, and REIS
Megafire−0.017 ***−0.021 ***−0.024 ***−0.021 ***
(0.003)(0.005)(0.004)(0.004)
Sociodemographic controlsYesYesYesYes
Weather controlsYesYesYesYes
County FEYesYesYesYes
State-year FEYesYesYesYes
R-squared (within)0.2170.1020.0740.081
Sample size680680680680
Notes: this table shows regression results of the impact of megafire events on annual (log) wage earnings in counties where the fires occurred and in the year of the fire event. Each column uses earnings data from a different source. In column (4), data used are an average of the three different data sources used separately in columns (1–3). Sociodemographic controls include: % of county with a HS diploma, median household income, % poverty rate, % Hispanic, % African American, and % non-Hispanic white. Weather controls include 10 annual mean temperature bins and 6 annual precipitation bins. Wild cluster bootstrap standard errors shown in parentheses at the county-level. *** p < 0.01.
Table 3. Heterogeneous Single Year Wage Earnings Impacts by Megafire Size.
(1)(2)(3)(4)
Dep. variable: Log per capita wage earnings (coef. × 100)
IRSCBPREISAverage of IRS, CBP, and REIS
Megafire (100 k–150 k acres)−0.003 **−0.003 **−0.002 **−0.003 **
(0.001)(0.001)(0.001)(0.001)
Megafire (150 k–250 k acres)−0.013 **−0.009 **−0.006 **−0.008 **
(0.006)(0.004)(0.003)(0.004)
Megafire (>250k acres)−0.023 **−0.069 **−0.049 ***−0.046 ***
(0.010)(0.033)(0.018)(0.017)
Sociodemographic controlsYesYesYesYes
Weather controlsYesYesYesYes
County FEYesYesYesYes
State-year FEYesYesYesYes
R-squared (within)0.2240.0950.0770.086
Sample size680680680680
Notes: each column presents results from a separate regression of the impact of megafires of different sizes located within a given county on annual wage earnings in that same county during the year of fire occurrence. Versions of Equation (1) are used. Each column uses data from a different source. Sizes correspond to the final acreage burn area of the megafire. Sociodemographic and weather controls are the same as those previously used in Table 2. Wild cluster bootstrap standard errors shown in parentheses at the county level. *** p < 0.01; ** p < 0.05; * p < 0.10.
Table 4. Robustness Checks.
(1)(2)(3)(4)
Dep. variable: Log per capita wage earnings (coef. × 100)
IRSCBPREISAverage of IRS, CBP, and REIS
Panel A: Adding Multiple Fire Counties
Megafire±0.016 ***−0.021 ***−0.023 ***−0.021 ***
(0.003)(0.006)(0.004)(0.007)
R-squared (within)0.2170.1020.0730.081
Sample size848848848848
Panel B: Counties with ≥20% Fire Perimeter Overlap
Megafire−0.016 ***−0.022 ***−0.024 ***−0.022 ***
(0.002)(0.007)(0.004)(0.004)
R-squared (within)0.2180.0900.0640.067
Sample size371371371371
Panel C: Counties with Major Urban Area (≥250,000 Population)
Megafire−0.014 ***−0.017 ***−0.018 ***−0.016 ***
(0.002)(0.003)(0.004)(0.003)
R-squared (within)0.3310.1760.0660.070
Sample size42424242
Panel D: Non-California Counties Only
Megafire−0.017 ***−0.020 ***−0.022 ***−0.020 ***
(0.004)(0.006)(0.005)(0.005)
R-squared (within)0.2140.1970.0670.070
Sample size489489489489
Panel E: Impacts in Adjacent Counties
Adjacent megafire−0.003 ***−0.004 ***−0.004 ***−0.004 ***
(0.001)(0.001)(0.001)(0.001)
R-squared (within)0.1940.1010.0410.079
Sample size1475147514751475
Sociodemographic controlsYesYesYesYes
Weather controlsYesYesYesYes
County FEYesYesYesYes
State-year FEYesYesYesYes
Notes: each panel-column combination presents results from a separate regression using versions of Equation (1). Each column uses a different source of wage earnings data. Panel A includes counties that experience >1 wildfire or megafire over 2010–2017. Panel B restricts the data to those counties where at least 20% of the county land area is burned by a megafire. Panel C restricts the data to those counties containing a major urban area with ≥250,000 population. Panel D looks at impacts in non-California counties only. Panel E shows the impacts in counties that are immediately adjacent to megafire affected counties. Controls and fixed effects are the same as those previously used in Table 2. Wild cluster bootstrap standard errors shown in parentheses at the county-level. *** p < 0.01.
Publisher’s Note: MDPI stays neutral with regard to jurisdictional claims in published maps and institutional affiliations.

